Introduction
Type 2 diabetes mellitus (T2DM) is a metabolic
disease characterized by hyperglycemia. T2DM can lead to serious
complications, including cardiovascular disease, blindness, renal
failure and amputation. The pathogenesis of T2DM is complex and
oxidative stress, in addition to inflammation are two crucial risk
factors. Metabolic disorders may lead to oxidative stress by
generating the reactive oxygen species (ROS). ROS could activate
nuclear factor-κB pathway and produce various proinflammatory
cytokines. These factors could deteriorate the islets β-cells of
the pancreas and insulin signaling pathways, resulting in reduced
release of insulin and insulin resistance (1). Meanwhile, persistent hyperglycaemia in
T2DM also increases the production of ROS and inflammatory
cytokines, damaging various organ systems and leading to diabetic
complications. In addition, clinical observations have indicated
that patients with T2DM have typical symptoms, including dry mouth
and polydipsia, even taste impairment. Therefore, taking the
aforementioned into consideration, it is suggested that
hyperglycemia may cause salivary secretion disorder in patients
with T2DM by oxidative stress and inflammation.
Saliva is mainly secreted by the parotid gland, the
submandibular gland and the sublingual gland. The submandibular
gland serves an role in basal salivary secretion, while the parotid
gland serves an important role in stimulated salivary secretion.
However, the sublingual gland serves an minor role in salivary
secretion. Salivary secretion is mainly regulated by the autonomic
nervous system. The sympathetic nerve regulates the secretion of a
large number of protein saliva, including salivary alpha-amylase
(sAA) by beta adrenergic receptors (β-AR)/G protein stimulating
adenylate cyclase (Gs)/adenylate cyclase (AC)/cyclic adenosine
monophosphate (cAMP)/protein kinase A (PKA) signaling pathway; The
parasympathetic nerve regulates the secretion of a large number of
fluid saliva, such as electrolytes, water and a little salivary
proteins by choline receptor (M3R)/G protein subunit alpha Q
(Gq)/phospholipase C-β (PLC-β)/inositol 1,4,5-trisphosphate
(IP3)/Ca2+/aquaporin-5 (AQP5) signaling pathway
(2). Therefore, the function of
salivary glands and the salivary secretion pathways are the main
factors that affect the synthesis and secretion of saliva.
At present, studies on salivary secretion in
patients with T2DM have mainly focused on the comparison of
salivary indicators between diabetic and non-diabetic individuals,
due to the limitation of clinical research. Several studies have
shown that diabetic patients and healthy individuals had
significant differences in the salivary parameters, including
salivary glucose, sAA, s-IgA, sialic acid, total salivary protein
and ion concentration (3-7),
and diabetic patients exhibited pathological changes in the
autonomic nervous system (8).
Research on salivary secretion in diabetic animal model has been
focused on pathological observation and associated mechanisms of
salivary glands, due to the technological difficulty of salivary
acquisition. A number of studies have reported that salivary
hypofunction is associated with atrophy of the submandibular and
parotid glands in diabetic rat and hamsters (9,10). In
addition, High et al (11)
reported that the submandibular gland hypofunction is associated
with the abnormity of calcium signaling pathway in diabetic rats
induced by streptozotocin.
Although basal salivary secretion in T2DM had been
reported in a number of studies, certain limitations remain, such
as that the salivary parameters were mainly from basal saliva, and
the lack of stimulated saliva; In addition, studies on salivary
glands' function are mainly focused on pathological observation,
and the lack of mechanism studies in inflammation and salivary
secretion pathway; In particular, the association between T2DM,
basal and stimulated salivary parameters, and salivary glands
function remains unclear. Therefore, the present study investigated
the differences in salivary secretion in basal and stimulated
conditions between T2DM and control rats. The aim of the present
study was to further examine the underlying mechanism of the
aforementional looking at the histopathology and the expression
levels of salivary secretion proteins regulated by autonomic nerves
in the parotid and submandibular glands.
Materials and methods
Experimental animals
Male Sprague-Dawley (SD) rats (195-200 g) were
provided by the Experimental Animal Center of Guangzhou Traditional
Chinese Medicine University, and production license number was SCXK
(Guangdong) 2013-0034. SD rats were bred in in the Experimental
Animal Center of Guangdong Pharmaceutical University, and use
license number was SYXK (Guangdong) 2017-0125. Housing conditions
were controlled at 20±2˚C at room temperature with a 12/12 h
light/dark cycle. The present study was approved by the Academic
Ethics Committee of Guangdong Pharmaceutical University (approval
no. gdpu2016074).
Induction of T2DM rats
Once adaptive feeding patterns were established (3
days), sixteen 8-week-old SD rats were randomly divided into
control and T2DM groups. Rats in the control group (n=8) were kept
on a basic diet, provided by the Experimental Animal Center of
Guangdong Pharmaceutical University, where total energy was 3.85
kcal/g, and the energy supply ratio of fat was 10%. Rats in the
T2DM group (n=8) received a high-fat diet (HFD), provided by
Guangdong Medical Experimental Animal Center, where total energy
was 4.73 Kcal/g, and the energy supply ratio of fat was 45%. After
8 weeks of feeding, according to preliminary experiments and
references (12), rats in the T2DM
group were intraperitoneally injected with 35 mg/kg streptozotocin
(STZ, McLean, Shanghai, China) subsequent to fasting >12 h. STZ
was dissolved in 0.1M citrate buffer at pH=4.2-4.5 prior to use.
Meanwhile, rats in the control group were injected with equal
volume of citrate buffer. After one weeks, approximately 500 µl
blood samples from the orbital cavity of experimental rats were
collected to determine the glucose blood level and insulin
concentration, using the glucose oxidase method with Blood Sugar
kit (cat. no. 141517011, Mindray) and the ELISA method with Insulin
Detection kit (cat. no. CBS-E05070R, CUSABIO), respectively,
according to the manufacture's protocols. Rats with fasting blood
glucose levels with a value ≥11.1 mmol/l, insulin resistance, and
exhibiting typical symptoms including polydipsia, polyphagia,
polyuria and weight loss (Table I),
were considered the optimal group and therefore, were selected as
T2DM group. The polydipsia and polyphagia were assessed by water
and food intakes, while the polyuria was assessed by moisture level
of padding. Subsequently, rats in the control group and the T2DM
group were kept on their basic diet and high-fat/high-sugar diet,
respectively.
 | Table IGeneral characteristics of
experimental rats. |
Table I
General characteristics of
experimental rats.
| Time point | Group | Body weight
(g) | Food intake
(g/w) | Energy intake
(kcal/w) | Water intake
(ml/w) | Glucose
(mmol/l) | Insulin
(ng/ml) | HOMA-IR index |
|---|
| Initial | Control | 264.89±19.98 | 1,191.80±55.06 |
5,038.50±386.08 | 1,855±18.02 | 4.32±0.08 | | |
| | T2DM | 262.02±16.23 | 996.13±44.97 |
4,711.71±368.40 | 1,805±17.32 | 4.29±0.18 | | |
| Final | Control | 528.57±21.30 | 1,222.10±63.25 |
4,582.88±354.38 | 2,125±120.27 | 4.69±0.10 | 1.49±0.36 | 6.77±1.87 |
| | T2DM |
388.48±29.76a |
1,661.47±34.37a |
7,858.74±162.57a |
3,979±250.82a |
19.11±0.23a |
1.12±0.26a |
24.99±3.70a |
Collection and processing of
samples
Saliva was collected according to our previous
research (13,14). The protocol was as follows: Rats were
fasted overnight and the experiment was carried out the following
day between 9:00-11:00 am. The rats were anesthetized with 30 mg/kg
pentobarbital sodium (Beijing Chemical Reagent Company) and their
limbs were fixed. Basal saliva of rats (prior to stimulation) was
collected for 3 min with a micro-sampler. Stimulated saliva
(following stimulation) was collected by the aforementioned method.
Pieces of filter paper (0.5x0.5 cm) were soaked in 0.4 mol/l citric
acid solution for 10 min, and were subsequently air dried. The
aforementioned was used to stimulate the tip of the rats' tongue
for 30 sec every 2.5 min and saliva was collected for 5 min using a
micro-sampler. The collected saliva samples were centrifuged at
10,000 x g at 4 ˚C for 5 min, and the supernatant was stored at
-20˚C.
At the end of the experiment, experimental rats were
anaesthetized by intraperitoneal injection of 10% chloral hydrate
(300 mg/kg). After anaesthesia was determined by pain reflex and
cornea reflex, the blood of rats, more than 5 ml, was drained from
abdominal aorta. After confirming that the rat heartbeat stopped
for 5 min by touch and stethoscope, rat's parotid and submandibular
glands were taken in 15 min. Moreover, experimental animals did not
exhibit signs of peritonitis after the chloral hydrate
administration. These tissue specimens were washed with
physiological saline, and dried with filter paper. Some of them
were fixed in 4% paraformaldehyde to perform hematoxylin and eosin
(H&E) staining, and the remaining tissues were store in -80˚C,
in order to evaluate biochemical parameters determination and
perform real-time quantitative PCR (RT-qPCR).
Examination of salivary
parameters
The activity of sAA (U/ml) was determined using the
kinetic reaction assay wiht a commercially available AMY kit (cat.
no. 142817005, Mindray) on the BS-180 automatic biochemical
analyzer (Mindray, Shenzhen, China). Briefly, chromogenic
substrate, 4,6-ethylidene-G7-ρ-nitrophenol, is cleaved by sAA and
auxiliary enzyme α-glucosidase into ρ-nitrophenol (PNP). The sAA
activity was determined using the PNP absorption spectrum at 405
nm. Total protein concentration (mg/ml) was determined using the
bicinchoninic acid (BCA) Protein Assay Kit (cat. no. P0011,
Beyotime), and bovine serum albumin was used to obtain standard
curves. All operations were strictly carried out according to the
reagents manual and instrument operation instructions. Salivary
flow rate was calculated by the total volume of saliva (ml) and
saliva collection time (min), which was expressed as ml/min.
Salivary protein secretion rate was calculated by the total protein
concentration (mg/ml) and the salivary flow rate (ml/min), which
expressed as mg/min. The sAA specific activity was calculated by
the sAA activity (U/ml) and the total protein concentration
(mg/ml), which was expressed as U/mg. The delta (Δ) value of all
salivary parameters was calculated by the parameters values prior
and following acid stimulation. Salivary pH value was determined by
precision test paper of pH 6.4-8.0 and 8.0-10.0 (Fuyang special
paper Co., Ltd.).
Biochemical parameters in tissue
evaluation
The parotid and submandibular glands stored at -80˚C
were taken out to prepare into 10% tissue homogenate with
pre-cooling saline using an electric homogenizer. After 10 min of
centrifugation at 10,000 xg at 4˚C, the supernatant was used to
determine the activities of sAA and total superoxide dismutase
(T-SOD, item number: A001-1, Jiancheng institute of bioengineering,
Nanjing, China), and the contents of total protein, total
cholesterol (TC, lot number: 141617008), triglyceride (TG, lot
number: 141717008), glucose (lot number: 141517011), all purchased
from Mindray, and malondialdehyde (MDA, item number: A003-1,
Jiancheng Institute of bioengineering, Nanjing, China) using the
BS-180 automatic biochemical analyzer. Determination of total
protein content and sAA activity was described above. T-SOD
activity was determined using the xanthine oxidase method. MDA
content was determined using colour reaction of MDA and
thibabituric acid. TC and TG contents were determined using the
methods of cholesterol oxidase and glycerol-3-phosphate oxidase,
respectively.
H&E staining in
histopathology
Due to the fact that the sublingual gland accounts
for a small proportion of salivary secretion, the focus of this
study was on the other two glands, including the parotid and
submandibular glands. Tissue specimens from the parotid and
submandibular glands were obtained from 4% paraformaldehyde, and
transferred to 70% ethanol. Tissue specimens were subsequently
placed in processing cassettes to dehydrate using gradient alcohol
series, and embedded in paraffin wax blocks. Prior to
immunostaining, tissue slices (thickness, 2 µm) were dewaxed by
xylene, rehydrated through decreasing concentrations of ethanol,
and washed using phosphate buffer solution. After H&E staining,
tissue specimens were dehydrated through increasing concentrations
of ethanol and xylene. Finally, histopathological characteristics
of the two glands were observed and images were obtained by ZEISS
microscope (Germany, magnification, x400).
RT-qPCR
Total RNA from the parotid and submandibular glands
was extracted by TRNzol Universal Reagent (Tiangen Biotech Co.,
Ltd.). The cDNA was synthesized using cDNA first chain premix
reagent (directory number: KR118, Tiangen Biotech Co., Ltd.).
RT-qPCR experiment was performed using the Talent fluorescence
quantitative detection kit SYBR Green (directory number: FP209.
Tiangen Biotech Co., Ltd., Beijing, China) to determine the
expression levels of TNF-α, IL-6, β1-AR, M3R, AQP5 and PKA genes.
The primers and product sizes of these genes were presented in
Table II. The PCR reaction
procedure was as follows: Initial denaturation of 95˚C for 3 min,
followed by 45 cycles of 95˚C for 5 sec, 60˚C for 10 sec and 72˚C
for 15 sec. The β-actin gene was used as an internal control to
normalize the amount of candidate genes. RT-qPCR was performed on
CFX96 Real-Time PCR Detection System (Bio-Rad, California, USA) and
the results were analyzed by the
2-ΔΔct method using CFX manager
software version 3.1.
| Table IISequences of primers used in the
present study. |
Table II
Sequences of primers used in the
present study.
| Gene | Forward
(5'-3') | Reversse
(5'-3') | Product size
(bp) |
|---|
| β-actin |
GGAGATTACTGCCCTGGCTCCTA |
GACTCATCGTACTCCTGCTTGCTG | 103 |
| TNF-α |
GCATGATCCGAGATGTGGAACTGG |
CGCCACGAGCAGGAATGAGAAG | 113 |
| IL-6 |
AGGAGTGGCTAAGGACCAAGACC |
TGCCGAGTAGACCTCATAGTGACC | 85 |
| AQP5 |
CAACAACACAACGCCTGGCAAG |
AGAGTCGGTGGAGGAGAAGATGC | 88 |
| M3 |
CGGTCGCTGTCACTTCTGGTTC |
CGCTGCTGCTGTGGTCTTGG | 80 |
| PKA |
GGACAAGCAGAAGGTGGTGAAGC |
ACCAGGCACGTACTCCATGACC | 154 |
| β1-AR |
CTCATCGTGCTGCTCATCGTAGTG |
GATGAAGAGGTTGGTGAGCGTCTG | 93 |
Western blot analysis
The parotid and submandibular gland tissue were
homogenized in RIPA lysis buffer and 1 mM PMSF
(phenylmethylsulfonyl fluoride) on ice for 30 min, and subsequently
centrifuged for 10 min at 10,000 x g and 4˚C in order to extract
proteins. The protein contents were determined using nucleic acid
protein detector. The protein samples were boiled after adding 4x
loading buffer for 10 min at 100˚C and the protein samples of equal
quantity were subsequently separated using SDS-PAGE. Proteins with
different molecular weights were separated on 10% separation gel
and 5% stacking gel. The separated proteins were subsequently
transferred onto polyvinylidene difluoride membranes, which were
already soaked in methanol for 15 min, and blocked with 5% skim
milk prepared with PBST (ratio of PBS and Tween-20 was 2,000:1) for
2 h. The protein blots were subsequently incubated with primary
antibodies for sAA (ab139994, Abcam, dilution, 1:1,000), β-actin
(20536-1-AP, Proteintech Group, Inc., dilution, 1:5,000) and β1-AR
(ab3442, Abcam, dilution, 1:1,000) overnight at 4 ˚C. Proteins were
then incubated with the corresponding Horseradish
Peroxidase-conjugated Affinipure Goat Anti-Rabbit IgG (E030120-01,
EarthOx Life Sciences, dilution, 1:10,000) for 2 h after washing
with PBST in triplicate. The protein blots were stained using ECL
luminous solution. Due to the difference of expression abundance,
the interest and control proteins were run on different membranes.
Protein bands were obtained using GeneGnome XQR gel imaging systems
(Syngene) and quantified by ImageJ software (National Institutes of
Health).
Statistical analysis
Prior to statistical analyses, all data were tested
for normal distribution by the Kolmogorov-Smirnov test. These
analyses revealed that only salivary flow rate conformed to normal
distribution in control and T2DM groups. Log transformation was
used for the data that did not conform to normal distribution.
Students' paired t-test was used to compare the means of salivary
parameters between basal and stimulated saliva, and Students'
unpaired t-test was used to compare the means of salivary and
tissue biochemical parameters between the two groups. Pearson's
correlation analysis was used to determine the correlation between
parameters in saliva and tissue. Data analysis was performed using
SPSS 17.0 software (IBM Corporation Inc.). All data were presented
as mean ± standard error. Figures were prepared using GraphPad
Prism 5.0 software (GraphPad Software Inc.), P<0.05 was
considered to be indicate a statistically significant
difference.
Results
General characteristics
In the initial stage of the experiment, no
significant differences in body weight, water, food and engergy
intakes, and fasting blood glucose concentration, were found
between T2DM and control rats. After 3 weeks for STZ injection,
T2DM rats showed higher intakes of water, food and energy, and
decreased body weight compared with control rats. In addition, T2DM
rats' padding was wetter than control rats. Serum indicators showed
that T2DM rats had significantly increased fasting blood glucose
concentration and HOMA-IR index, and decreased insulin levels
(Table I). All these results
indicated that T2DM rat model had been successfully
constructed.
Salivary parameters prior and
following acid stimulation
To confirm whether there was an abnormal salivary
secretion in T2DM rats, salivary parameters were determined prior
and following acid stimulation for control and T2DM rats. The
results were showed in Tables III and IV. For the basal and
stimulated salivary parameters (Table
III), T2DM rats showed significantly lower salivary flow rate
(Pbasal=0.0005; Pstimulated=0.0006), protein
secretion rate (Pbasal=0.0042;
Pstimulated=0.010), sAA activity
(Pbasal=0.0003; Pstimulated=0.0003) and sAA
specific activity (Pbasal=0.0005;
Pstimulated=0.0007) compared with control rats. For
salivary parameters responses to acid stimulation (Table III), T2DM and control rats showed
significant increase in salivary flow rate (PT2DM
<0.001; Pcontrol=0.006), protein secretion rate
(PT2DM=0.014; Pcontrol=0.024), sAA activity
(PT2DM=0.005; Pcontrol=0.001) and sAA
specific activity (PT2DM=0.031;
Pcontrol=0.022), and pH value (PT2DM=0.011;
Pcontrol <0.001) after the acid stimulation. However,
T2DM rats showed lower delta values in salivary flow rate
(P=0.0276), protein secretion rate (P=0.0500), sAA activity
(P=0.0158) and sAA specific activity (P=0.0353) compared with
control rats (Table IV). In
addition, no significant differences in total protein concentration
were found between the two groups.
| Table IIIComparison of salivary parameters in
rats. |
Table III
Comparison of salivary parameters in
rats.
| Group | n | State | Salivary flow rate
(µl/min) | Total protein
content (mg/ml) | Protein secretion
rate (mg/min) | sAA activity
(U/ml) | sAA specific
activity (U/mg) | pH-value |
|---|
| Control | 8 | Basal saliva | 62.71±14.31 | 1.13±0.17 | 0.07±0.02 | 76.79±7.08 | 109.09±45.20 | 8.21±0.52 |
| | | Stimulated
saliva |
101.25±14.54a | 1.39±0.22 |
0.15±0.04a |
277.86±66.63a |
278.43±78.28a |
8.88±0.21a |
| T2DM | 8 | Basal saliva |
13.97±2.56b | 1.43±0.31 |
0.02±0.00b |
22.33±16.03b |
17.26±3.99b | 8.39±0.64 |
| | | Stimulated
saliva |
32.5±5.02a,b | 1.5±0.5 |
0.06±0.03a,b |
38.38±17.83a,b |
33.52±8.66a,b |
9.01±0.56a |
| Table IVComparison of the delta value in rats
salivary parameters. |
Table IV
Comparison of the delta value in rats
salivary parameters.
| Group | n | Delta value of
salivary flow rate | Delta value of
total protein content | Delta value of
protein secretion rate | Delta value of sAA
activity | Delta value of sAA
specific activity | Delta value of
pH |
|---|
| Control | 8 | 38.54±12.44 | 0.26±0.24 | 0.08±0.04 | 201.08±62.53 | 134.18±44.87 | 0.67±0.55 |
| T2DM | 8 |
18.53±3.06a | 0.07±0.46 |
0.04±0.02a |
16.05±7.99a |
17.18±13.95a | 0.62±0.68 |
Biochemical parameter observation in
salivary glands
In order to further confirm the histopathological
lesions of salivary glands, the biochemical parameters from
salivary glands were determined. The results (Table V) showed that, compared with control
rats, T2DM rats had significantly higher glucose (Pparotid
gland <0.001; Psubmandibular gland=0.011)
content, and significantly lower sAA (Pparotid
gland=0.025; Psubmandibular gland=0.050) and T-SOD
activities (Pparotid gland=0.022; Psubmandibular
gland <0.001) in parotid and submandibular glands. In
addition, the contents of TC (Pparotid gland=0.003;
Psubmandibular gland=0.176) and MDA (Pparotid
gland <0.001; Psubmandibular gland=0.625) in
T2DM rats' parotid gland, and total protein contents (Pparotid
gland=0.664; Psubmandibular gland=0.017) in T2DM
rats' submandibular gland, was significantly higher compared with
control rats. No significant differences in TG content of parotid
and submandibular glands were found between control and T2DM rats
(P>0.05).
| Table VComparison of biochemical parameters
from salivary glands in rats. |
Table V
Comparison of biochemical parameters
from salivary glands in rats.
| Group | n | Glucose
(mmol/l) | TC (mmol/l) | TG (mmol/l) | sAA activity
(U/ml) | MDA (mmol/mg) | T-SOD (U/mg) | Protein
(ug/mg) |
|---|
|
Control-parotid | 5 | 0.08±0.05 | 0.46±0.11 | 1.30±0.32 | 1,978.97±29.09 | 0.04±0.01 | 6.62±1.86 | 2.24±0.44 |
| T2DM-parotid | 5 |
0.77±0.07a |
0.63±0.01a | 1.48±0.29 |
1,791.13±88.85a |
0.08±0.01a |
2.76±0.28a | 2.48±0.74 |
|
Control-submandibular gland | 5 | 0.43±0.06 | 0.13±0.05 | 1.16±0.08 |
1,218.10±170.47 | 0.03±0.01 | 15.28±4.17 | 1.91±0.50 |
| T2DM-submandibular
gland | 5 |
0.65±0.07b | 0.21±0.07 | 1.24±0.04 |
911.97±87.50b | 0.04±0.00 |
6.53±1.11b |
2.26±0.17b |
Correlations between biochemical
parameters in saliva and tissue
Basal and stimulated salivary flow
rate(Rbasal=-0.532, P=0.005,
Rstimulatted=-0.554, P=0.003), and stimulated sAA
activity (Rstimulatted=-0.375, P=0.059), were negatively
correlated with fasting blood glucose concentration. In parotid and
submandibular glands, there were a negative correlations between
sAA activity and glucose concentration (Rparotid=-0.854,
P=0.030, Rsubmandibular=-0.805, P=0.054), between T-SOD
activity and protein content (Rparotid=-0.920, P=0.009,
Rsubmandibular=-0.980, P=0.001). In addition, TC content
was positively correlated with glucose concentration in parotid
gland (R=0.837 and P=0.038). No significant correlations were found
between the others biochemical parameters.
Histopathological observation of
salivary glands
In order to analyze the cause of disturbance in
salivary secretion in T2DM rats, the histopathological lesions of
the parotid and submandibular glands were observed in the two
groups of rats by H&E staining. The H&E staining results of
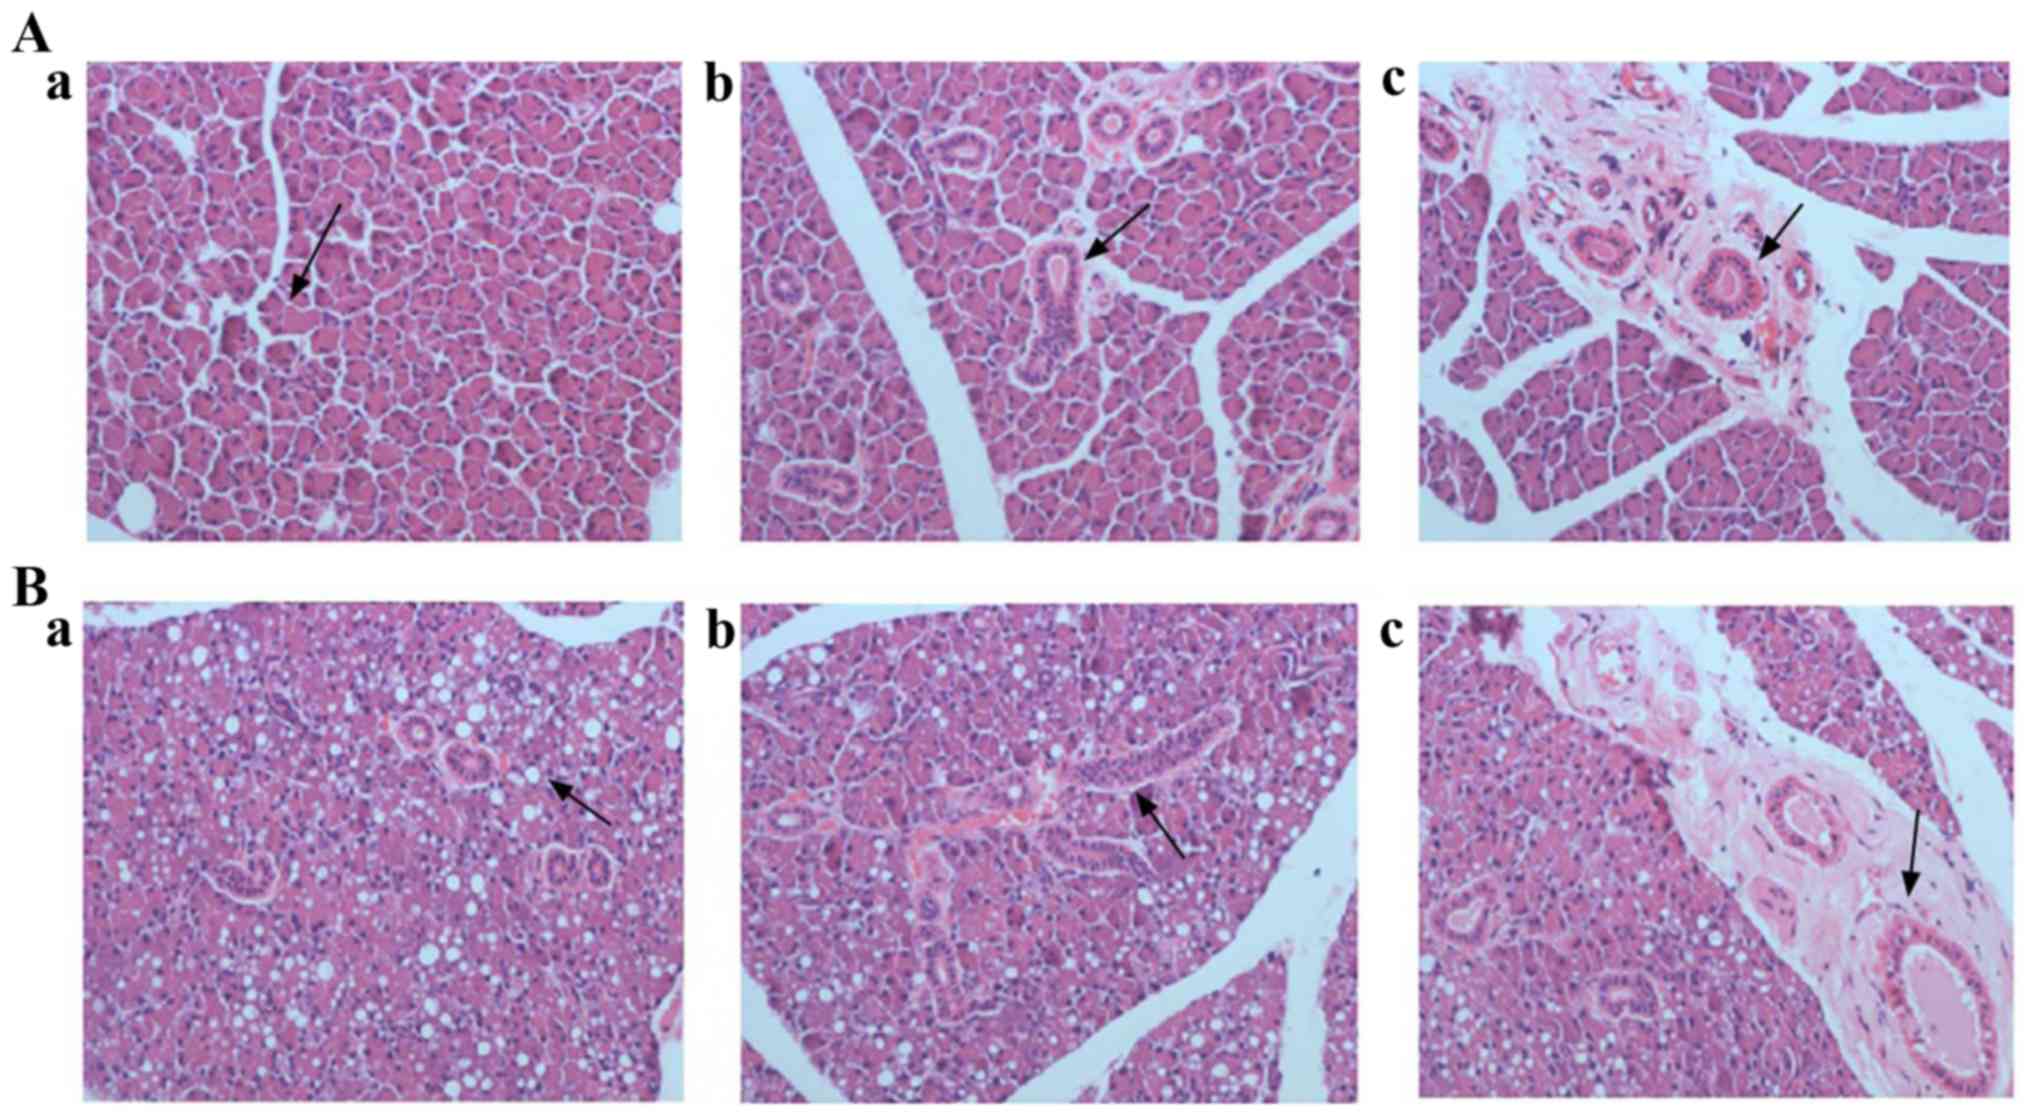
parotid gland were showed in Fig. 1.
For control rats (Fig. 1A-a-c), the
parotid lobules boundaries were clear. Normal acinar cells were
observed in terms of morphology. The lumen of gland ducts was
clearly visible and there were many secretory granules at the top
of these gland ducts. The parietal cells of gland ducts were
arranged orderly and part of gland ducts were surrounded by fibrous
tissue. For T2DM rats (Fig. 1B-a-c),
the parotid lobules boundaries were blurred. Acinar cell with
different degrees of deformation and atrophy were observed. The
cytoplasm and basal lines of acinar cells were blurred, and the
vacuolization of acinar cells was obvious. The number of ducts
reduced and their lumen was blurred. Moreover, reduced secretory
granules at the top of gland ducts were observed, and the parietal
cells of gland ducts were arranged disorderly. In addition, some
ducts were dilated, and surrounded by inflammatory cell
infiltration and fibrous tissue hyperplasia.
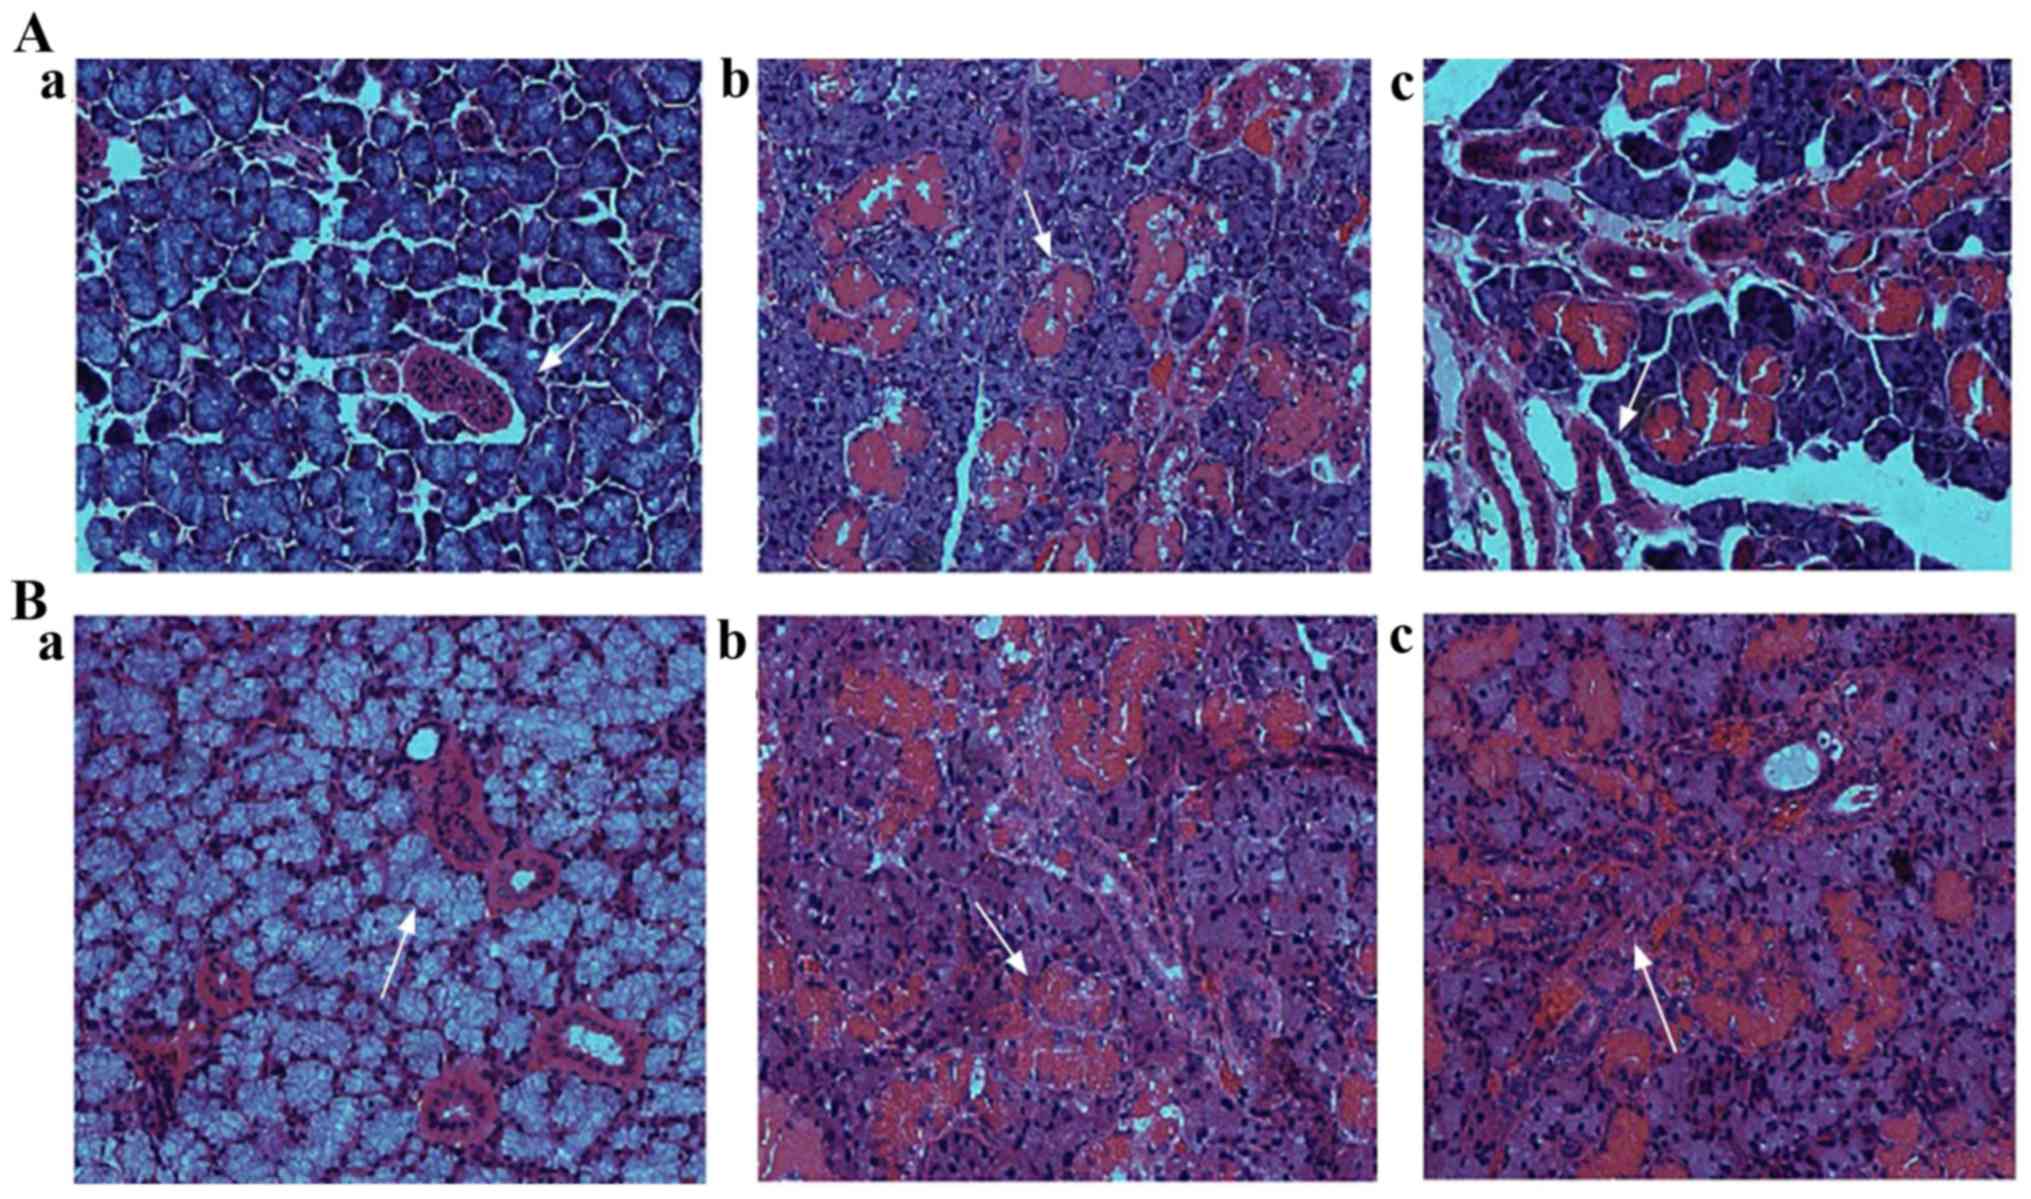
The H&E staining results of submandibular gland
were shown in Fig. 2. For control
rats, serous acinar cell (Fig. 2A-a)
and mucous acinar cell (Fig. 2A-b)
were regular in shape, uniformly arranged and distinct in interval.
Their interlobular septum was obvious, the lumen of the glandular
duct was clear, and the parietal cells were arranged neatly,
surrounded by fibrous tissue (Fig.
2A-c). For T2DM rats, the septum of serous acinar cells
disappeared and formed cell adhesion, and the cytoplasm and basal
stria of acinar cells were blurred (Fig.
2B-a). No histopathological lesions were observed in glandular
ducts and mucous acinar cells (Fig.
2B-b and -c).
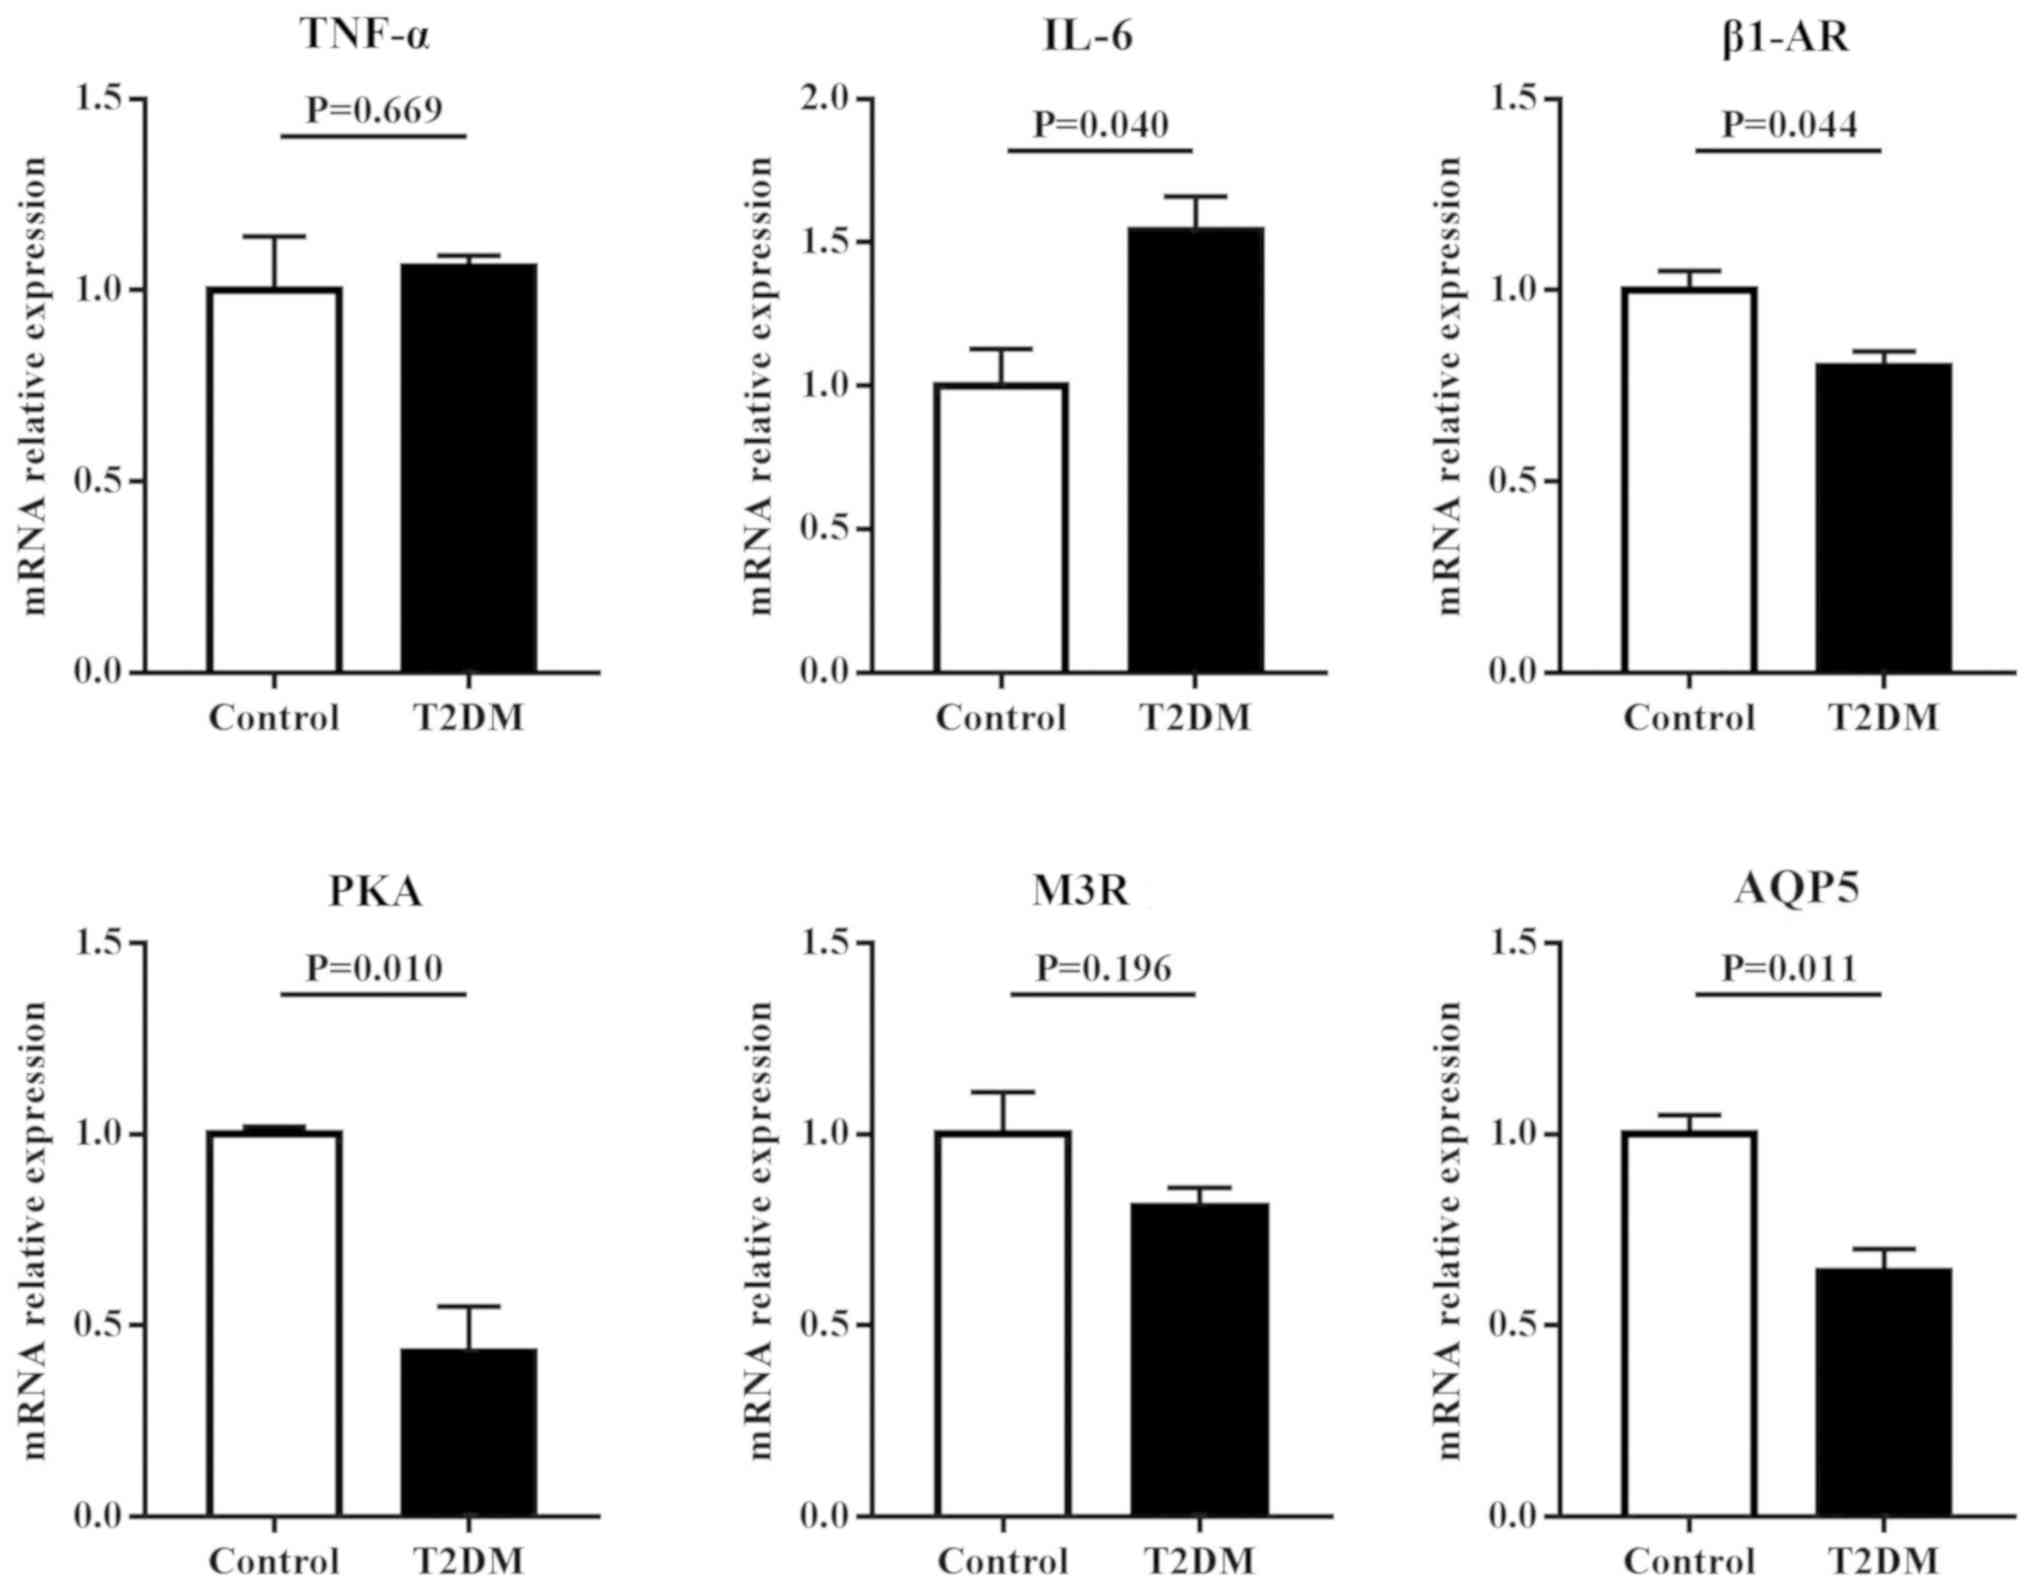
mRNA expression of candidate genes in
salivary glands
To assess the roles of inflammation and regulatory
proteins in disruption of salivary secretion in T2DM rats, the mRNA
expressions of TNF-α, IL-6, β1-AR, M3R, AQP5 and PKA were examined
in the parotid and submandibular glands. The results (Fig. 3) showed that in the parotid gland,
the mRNA expression levels of inflammatory factors, including TNF-α
and IL-6, in T2DM rats were significantly higher compared with
control rats (P<0.05). However, the mRNA expression levels of
regulatory proteins for salivary secretion, including β1-AR, M3R,
AQP5 and PKA in T2DM rats, were significantly lower compared with
control rats (P<0.05). Similar results were found in the
submandibular gland. However, no differential expression in TNF-α
and M3R were observed between T2DM and control rats (Fig. 4).
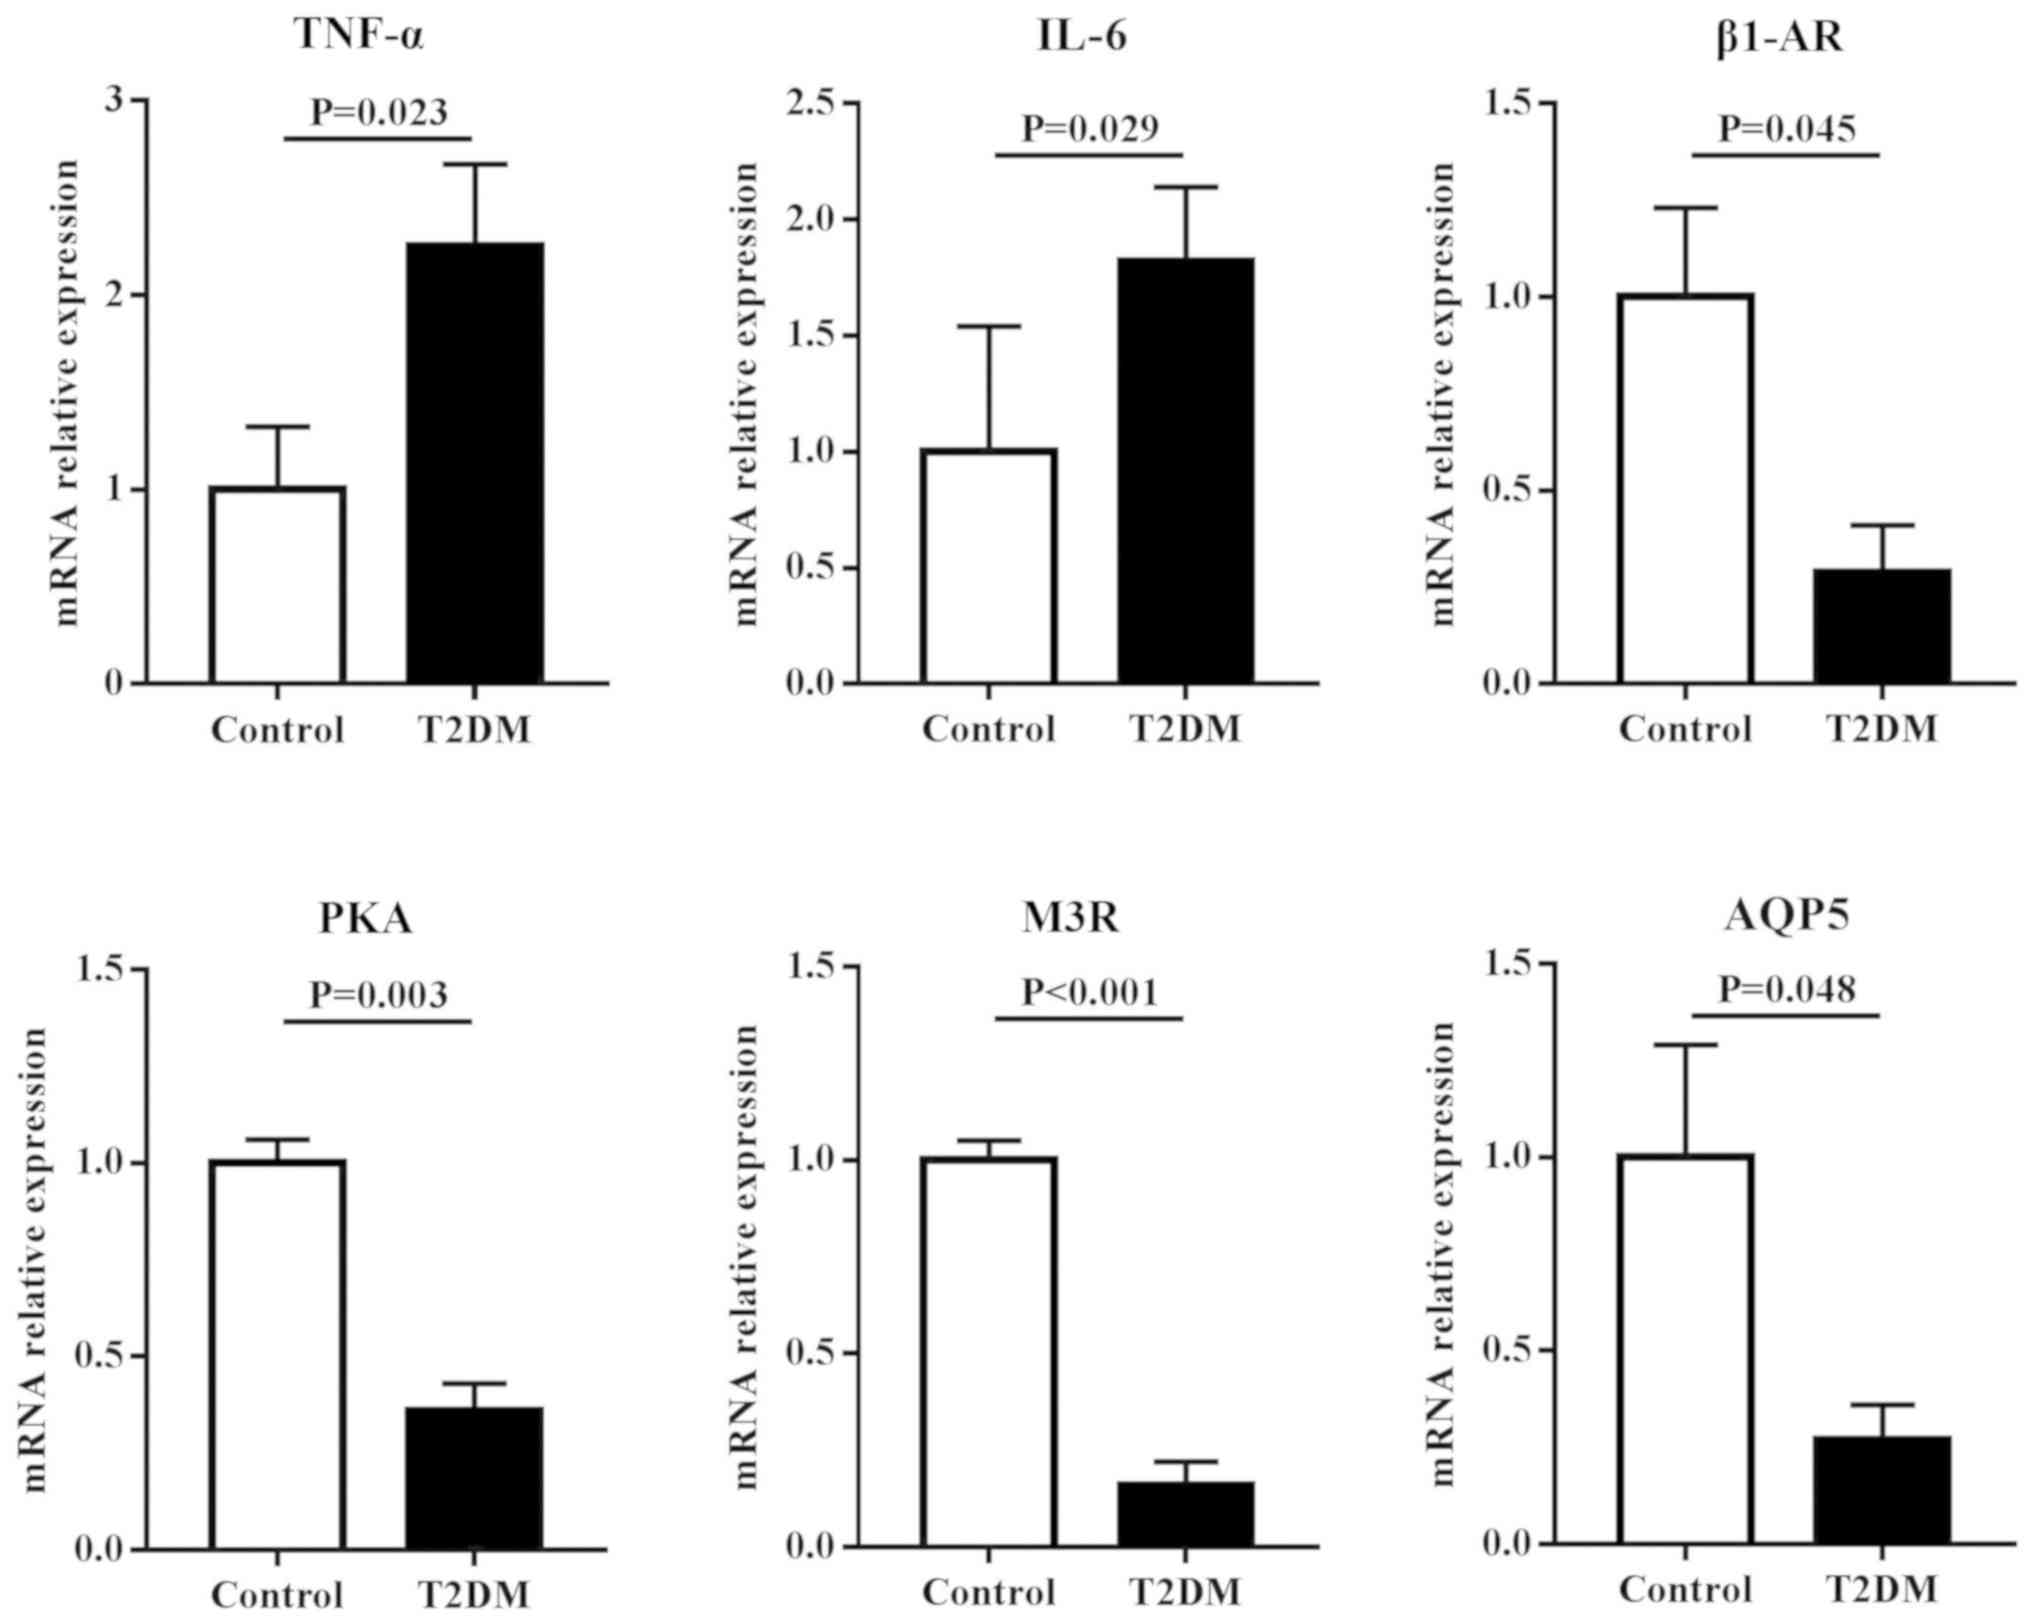 | Figure 3.mRNA expression levels of
inflammatory factors and regulatory proteins for salivary secretion
in the parotid gland of rats. T2DM rats had significantly higher
mRNA expressions of TNF-α and IL-6, and lower mRNA expressions of
β1-AR, PKA, M3R and AQP5 compared with control rats. T2DM, type 2
diabetes mellitus; TNF, tumor necrosis factor; IL, interleukin;
β1-AR, β1 adrenergic receptor; PKA, protein kinase A; M3R,
cholinergic receptor; AQP5, aquaporin-5. |
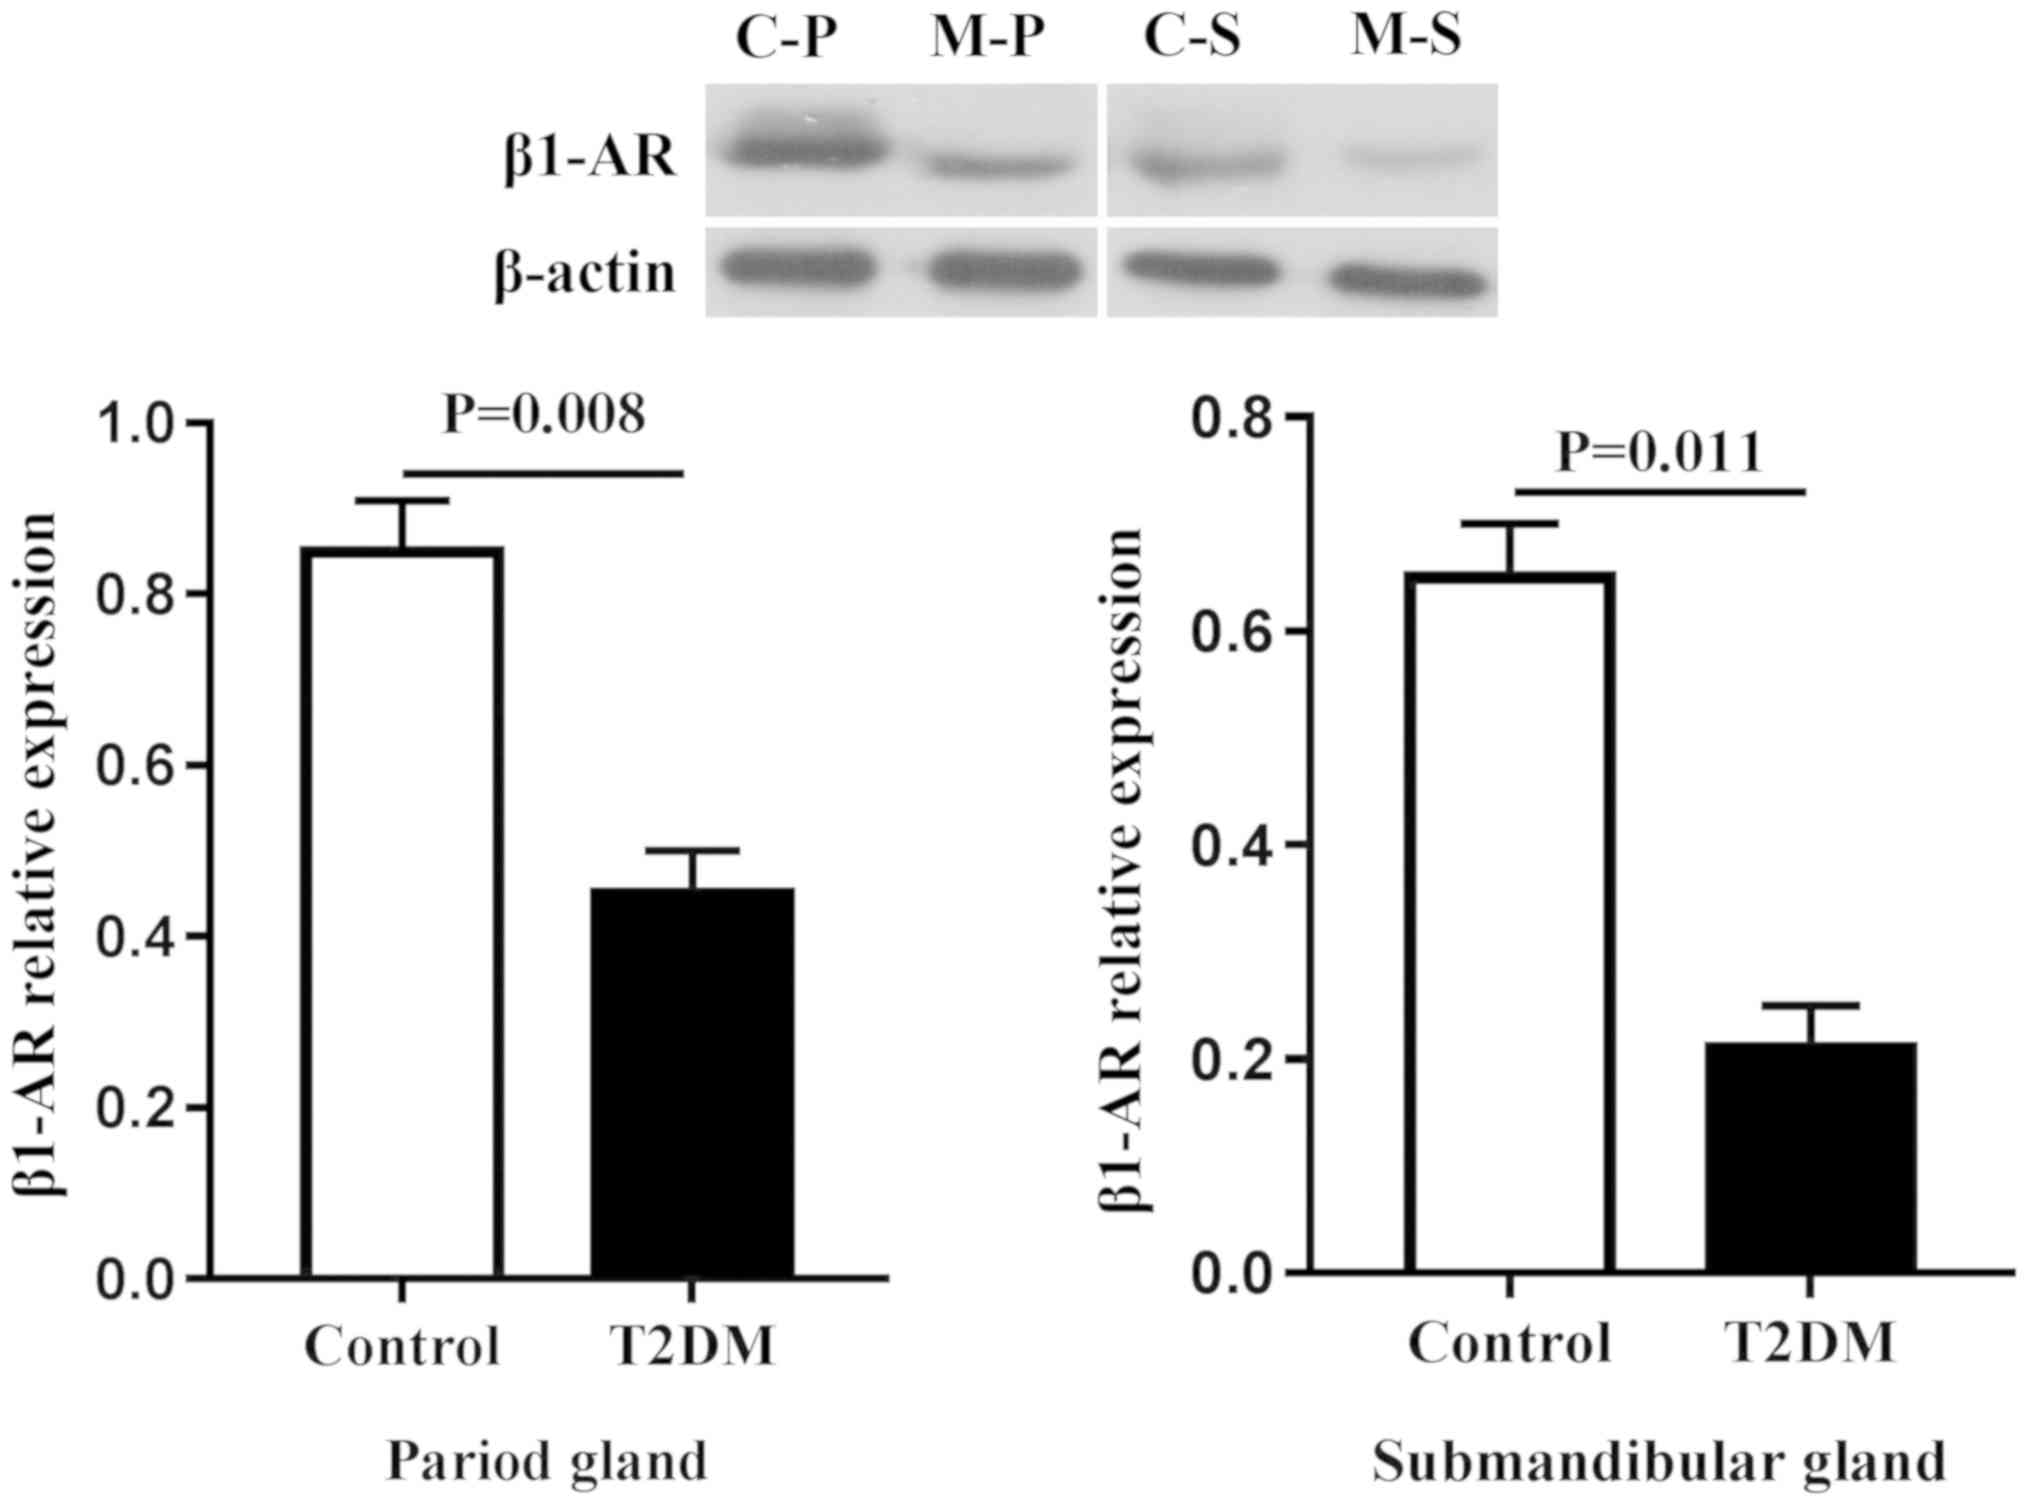
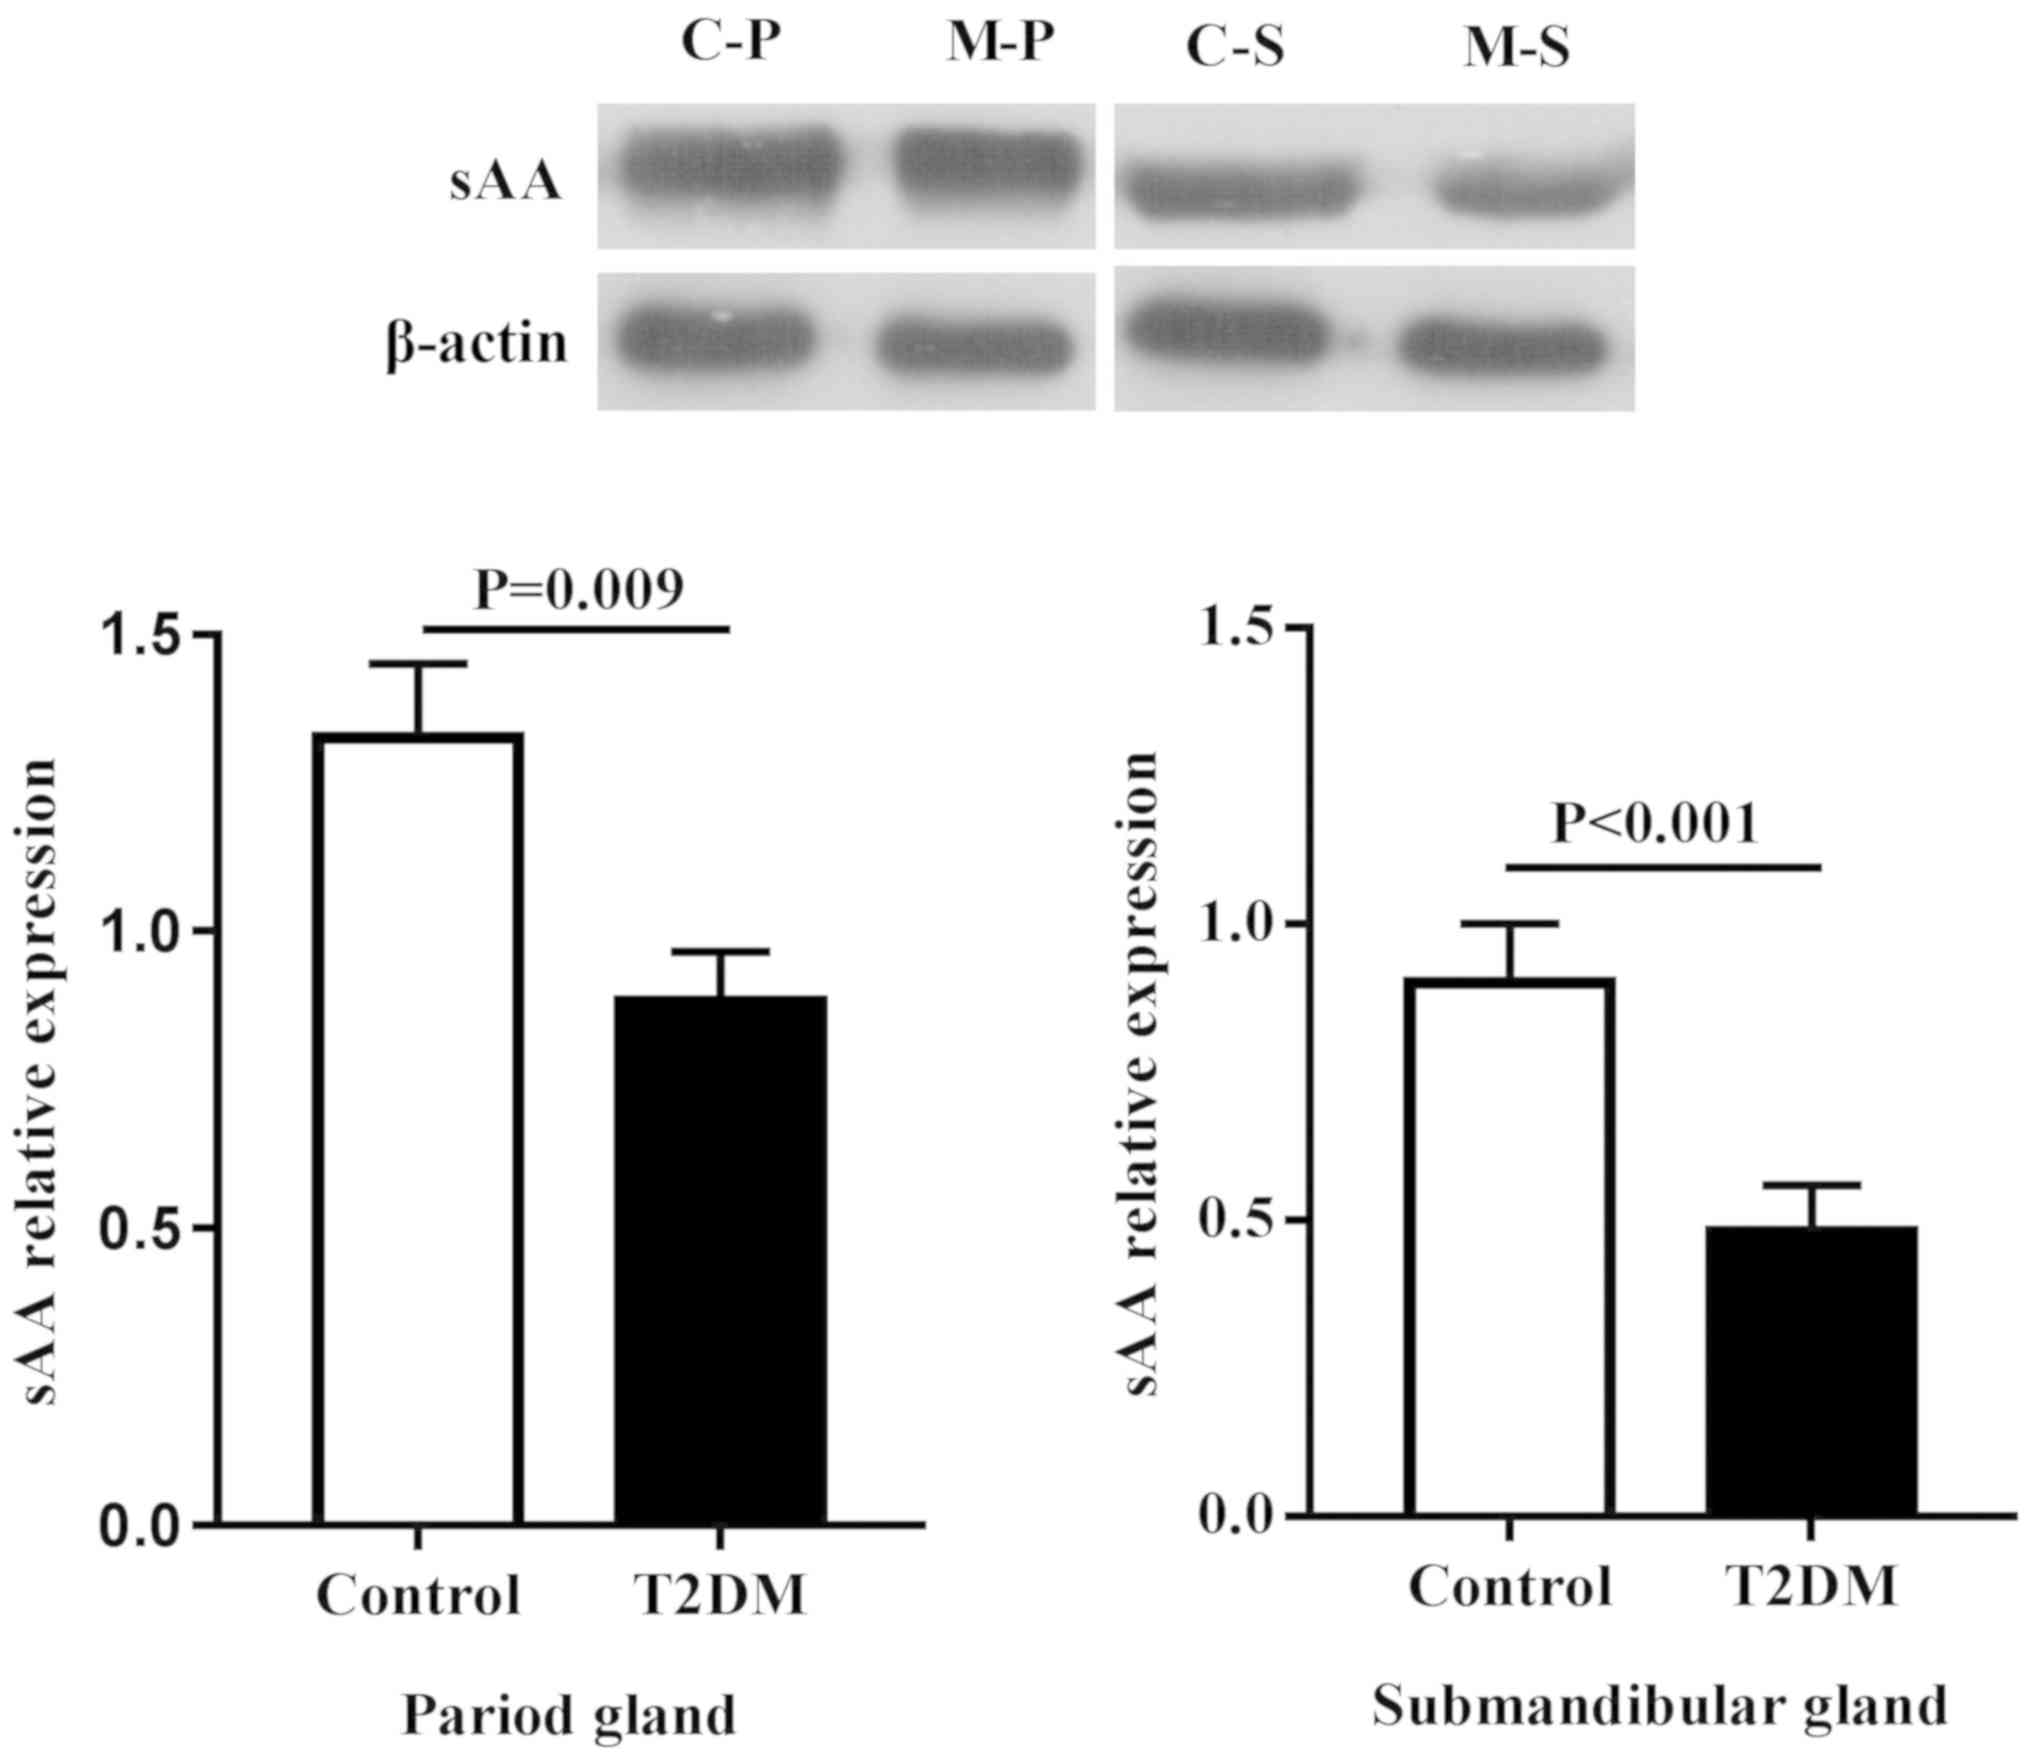
Protein expression in salivary
glands
Due to the fact that secretion of sAA in type 2
diabetic rats was more obvious, the focus of the present study was
the proteins associated with sAA secretion (Figs. 5 and 6). Compared with the control group, the
expression of β1-AR and sAA decreased regardless of the types of
gland, including the parotid and submandibular glands
(P<0.05).
Discussion
In the present study, it was indicated that T2DM
rats had decreased salivary secretion parameters and attenuated
salivary secretion responses to acid stimulation. Furthermore,
morphological and structural abnormalities were observed, in
addition to secretory dysfunction in salivary glands of T2DM rats,
especially in the parotid gland.
Saliva includes two parts of fluid and protein
saliva. The fluid saliva is mainly water and electrolyte, which is
responsible for lubricating oral mucosa, dissolving food and
facilitating swallowing. The protein saliva contains amylase and
lysozyme, which may serve an important role in starch digestion and
oral healthy. As the main component of salivary proteins, sAA was
often used as a major indicator of salivary protein secretion.
Recent studies have reported that sAA was associated with the
occurrence of metabolic diseases, including obesity and diabetes
(15,16). In our previous study on salivary
secretion in children, it was indicated that children with low body
mass index had significantly lower sAA activity ratio, calculated
as the ratio of stimulated sAA levels to those of resting sAA,
compared with that of healthy children. However, no significant
differences in resting or stimulated sAA activities between the two
groups were observed (17).
Kołodziej et al (18) found
that stimulated salivary flow rate significantly decreased (45%) in
HFD-induced insulin-resistance (IR) rats compared with the control
rats, however this did not apply for non-stimulated salivary flow
rate. The present study found that T2DM rats had significantly
lower salivary flow rate, protein secretion rate, sAA activity and
sAA specific activity in basal and stimulated saliva, and
attenuated salivary secretion responses to acid stimulation
(decreased delta values in salivary flow rate, protein secretion
rate, sAA activity and sAA specific activity), compared with
control rats. Similar results have been reported in diabetic
patients with decreased salivary flow rate and sAA activity in
unstimulated whole saliva, and a high prevalence of oral mucosal
lesions (3-5,19).
Despite this study's findings, a number of studies reported that
unstimulated sAA activity was significantly higher in diabetics
compared to healthy people (20,21), and
unstimulated saliva flow rates had no indicated variability between
the two groups (5,20). Despite existing controversy in
results, patients with T2DM or animal model have indicated abnormal
salivary secretion, especially sAA activity.
Salivary glands include the parotid gland, the
submandibular gland and the sublingual gland, which are responsible
for salivary secretion. The parotid gland serves as the main
contributor of protein and fluid saliva components, which produced
~80% of amylase. Under stimulated conditions, the contribution of
the parotid gland increases from 20% to >50% of total saliva
(22). The present study in T2DM
rats found that the parotid gland showed multiple lesions,
including inflammatory cell infiltration, vacuolization and atrophy
of acinar cells, and reduced secretory granules, while the
submandibular gland showed only serous alveolar cell deformations
and adhesion. These findings indicated that T2DM rats had
structural and functional abnormalities in salivary glands,
especially in the parotid gland. A previous study had reported that
saliva biochemical disorders in patients with T2DM were associated
with the structural changes of parotid glands (23). Xia et al (24) found that the reduction of salivary
flow rate in small pigs was associated with the atrophy of the
parotid gland. Teng et al (25) found that the parotid gland of T2DM
rats had a number of lesions, including glandular cell hyperplasia,
steatosis and interstitial hyaline degeneration. Malicka et
al (26) found that high
prevalence of xerostomia in diabetic patients was mostly due to
impaired salivary gland function.
When examining biochemical parameters in
pathological lesions of salivary glands, the present study showed
that T2DM rats had lower sAA and T-SOD activities, and higher
concentrations of blood glucose, TC and MDA in the parotid gland
compared with control rats, while similar results were found in the
submandibular gland, except for no difference in the two indicators
of TC and MDA. In addition, the correlation analysis showed fasting
glucose concentration was negatively correlated with salivary flow
rate and stimulated sAA activity. Meanwhile, negative correlations
between sAA activity and glucose concentration, and between T-SOD
activity and total protein content in the parotid and submandibular
glands was indicated. Furthermore, a positive correlation between
TC and glucose concentrations in the parotid gland was found. The
aforementioned findings led to the following conclusions: High
sugar and fat were easier to deposit in the parotid gland, and
increased TC and glucose contents decreased the synthesis and
secretion of sAA in salivary glands. However, there was a higher
oxidative stress in the parotid gland compared with the
submandibular gland, and reduced T-SOD activity increased protein
content in salivary glands. Zalewska et al (27) reported that salivary antioxidant
capacity was determined mainly by the antioxidant efficiency of the
parotid gland. The intensity of oxidative damage was much greater
in the parotid glands of HFD-induced IR rats. This may be due to
the fact that parotid gland presents adipocytes in the parenchyma,
and more sensitive to combine with ROS compared with the
submandibular gland. Kołodziej et al (18) also found that the vacuolization of
the parotid gland appeared to be a lipid nature. In contrast to the
present study's results, Kołodziej et al (18) found that HFD-induced IR rats had
significantly decreased protein concentration in both glands, with
a larger disruption in the parotid gland compared with the
submandibular gland. However, in the present study, increased
protein content was found in the submandibular gland of T2DM rats,
which may be associated with the occurrence and development of
T2DM. Taking the aforementioned into consideration, the
pathological lesions and biochemical indicators in salivary glands
can be validated by each other.
Salivary secretion is mainly controlled by the
autonomic nervous system, in which the sympathetic nerve regulates
the secretion of protein saliva via the β-AR pathway, and the
parasympathetic nerve regulates the secretion of fluid saliva via
the M3R pathway (28,29). This study's results showed that mRNA
expression levels of β1-AR and M3R were significantly
down-regulated in the parotid gland of T2DM rats, while only the
expression level of β1-AR was down-regulated in the submandibular
gland of T2DM rats. In addition, the protein expression level of
β1-AR was also down-regulated in both glands. These findings
suggested that there was an autonomic dysfunction in T2DM rats,
further verifying the decrease of salivary flow rate, protein
secretion rate, sAA activity and sAA specific activity in T2DM
rats. Kołodziej et al (18)
found that whole salivary flow rate stimulated by pilocarpine, a
muscarinic agonist, was decreased by 45% in HFD-IR rats, compared
with the control group. Anderson et al (8) confirmed that diabetic rats showed
abnormal response of the parotid gland to parasympathetic nerve
stimulation, while autonomic neuropathy was an important
factor.
In addition, AQP5, the aquaporin firstly found in
salivary glands, is a downstream signaling molecule mediated by the
M3R pathway. It serves an important role in fluid synthesis and
transport in vivo. The present study found that mRNA
expression level of AQP5 was down-regulated in the parotid and
submandibular glands of T2DM rats. These results were in accordance
to previous studies, in which saliva secretory volume decreased and
salivary components were altered in AQP5-mutant rats and knockout
mice (30,31). PKA, as a member of the salivary
protein secretion pathway, was also found to be down-regulated in
the parotid and submandibular glands of T2DM rats. These findings
provide further explanation for the reduced salivary secretion,
including salivary flow and sAA activity in T2DM rats. In addition,
the present study found that T2DM rats had a lower protein
secretion rate, however no difference in salivary total protein
content was observed. This may be associated with the simultaneous
reduction of protein and fluid saliva regulated by the
dysfunctional autonomic nerve system.
In addition, inflammation is an important factor
affecting the function of salivary glands. The present study found
that mRNA expression levels of TNF-α and IL-6 in the parotid gland
of T2DM rats were significantly higher than that of control rats,
which verified the inflammatory cell infiltration finding in the
histopathological observation of the parotid gland. Although no
inflammatory cell infiltration was found, the expression level of
IL-6 was significantly up-regulated in the submandibular gland of
T2DM rats. These findings indicated that T2DM rats had an
inflammatory reaction in salivary glands, in particular the parotid
gland. Solinas and Karin (32) found
that HFD-induced obese and type 2 diabetic parotid glands enhanced
storage of lipid droplets, which further activated secretion of
pro-inflammatory cytokines, including TNFα, IL-6, and IL-1β, and
ROS production in adipocytes and macrophages of parotid gland.
Overall, in the case of T2DM induced by HFD, the
excess fatty acid increased insulin resistance leading to glucose
and fat droplet storage in salivary glands, causing inflammation.
In addition, fatty acids increased the production of reactive
oxygen and nitrogen species in the respiratory chain, which may
lead to the development of oxidative stress and oxidative damage.
Moreover, deepening inflammation would further increase the
production of free radicals, and oxidative stress may also
aggravate inflammatory response. Finally, due to antioxidant
deficiency, oxidative stress and inflammation damaged the structure
and secretory regulation pathway of salivary glands, showing
reduced salivary secretion.
In summary, T2DM rats showed significant decrease in
salivary flow rate, protein secretion rate, sAA activity and sAA
specific activity compared with control rats, manifesting various
symptoms, including thirst and polydipsia. The pathological
mechanism may be associated with histopathological lesions,
including the inflammatory cell infiltration, oxidative stress, and
down-regulated expression of secretory regulatory genes and
proteins in salivary glands, especially in the parotid gland.
Acknowledgements
Not applicable.
Funding
This research was supported by the Natural Science
Foundation of Guangdong Province (grant no. 2017A030313837),
National Natural Science Foundation of China (grant no. 81102703),
Science and Technology Planning Project of Guangdong Province
(grant no. 2013A032500005) and the Natural Science Foundation for
Fostering of Guangdong Pharmaceutical University (grant no.
GYFYLH201303).
Availability of data and materials
The datasets used and/or analyzed during the present
study are available from the corresponding author on reasonable
request.
Authors' contributions
ZMY conceived and designed the experiments. SYC, YW
and CLZ performed the experiments. ZMY, SYC, CLZ and YW analyzed
and interpreted the data. ZMY and SYC drafted and revised the
manuscript. All authors read and approved the final manuscript.
Ethics approval and consent to
participate
The experimental protocol was established, according
to internationally recognized guidelines on animal welfare, as well
as local and national regulations, in accordance with the U.K.
Animals (Scientific Procedures) Act and associated guidelines, the
EU Directive 2010/63/EU for animal experiments. The experimental
protocol was approved by the Academic Ethics Committee of Guangdong
Pharmaceutical University (approval no. gdpu2016074).
Patient consent for publication
Not applicable.
Competing interests
The authors declare that they have no competing
interests.
References
|
1
|
Ma X, Chen Z, Wang L, Wang G, Wang Z, Dong
X, Wen B and Zhang Z: The pathogenesis of diabetes mellitus by
oxidative stress and inflammation: Its inhibition by berberine.
Front Pharmacol. 9(782)2018.PubMed/NCBI View Article : Google Scholar
|
|
2
|
Pedersen AML, Sørensen CE, Proctor GB,
Carpenter GH and Ekström J: Salivary secretion in health and
disease. J Oral Rehabil. 45:730–746. 2018.PubMed/NCBI View Article : Google Scholar
|
|
3
|
Bakianian Vaziri P, Vahedi M, Mortazavi H,
Abdollahzadeh SH and Hajilooi M: Evaluation of salivary glucose,
IgA and flow rate in diabetic patients: A case-control study. J
Dent (Tehran). 7:13–18. 2010.PubMed/NCBI
|
|
4
|
Indira M, Chandrashekar P, Kattappagari
KK, Chandra LP, Chitturi RT and BV RR: Evaluation of salivary
glucose, amylase, and total protein in type 2 diabetes mellitus
patients. Indian J Dent Res. 26:271–275. 2015.PubMed/NCBI View Article : Google Scholar
|
|
5
|
Panchbhai AS, Degwekar SS and Bhowte RR:
Estimation of salivary glucose, salivary amylase, salivary total
protein and salivary flow rate in diabetics in India. J Oral Sci.
52:359–368. 2010.PubMed/NCBI View Article : Google Scholar
|
|
6
|
Yin Z, Zhang YY and Cui LD: Clinical
significance of combined detection of serum tumor necrosis factor,
sialic acid and alpha-1 acid glycoprotein in type 2 diabetes
mellitus. J Chin Med University. 6:78–79. 2004.(In Chinese).
|
|
7
|
Marín Martínez L, Molino Pagán D and López
Jornet P: Trace elements in saliva as markers of type 2 diabetes
mellitus. Biol Trace Elem Res. 186:354–360. 2018.PubMed/NCBI View Article : Google Scholar
|
|
8
|
Anderson LC, Garrett JR, Thulin A and
Proctor GB: Effects of streptozocin-induced diabetes on sympathetic
and parasympathetic stimulation of parotid salivary gland function
in rats. Diabetes. 38:1381–1389. 1989.PubMed/NCBI View Article : Google Scholar
|
|
9
|
Stewart CR, Obi N, Epane EC, Akbari AA,
Halpern L, Southerland JH and Gangula PR: The effects of diabetes
on salivary gland protein expression of tetrahydrobiopterin and
nitric oxide synthesis and function. J Periodontol. 87:735–741.
2016.PubMed/NCBI View Article : Google Scholar
|
|
10
|
Mori Y, Muratsu K, Nara Y and Morioka T:
The histopathological observation of the salivary gland in hamsters
with streptozotocin induced diabetes. Fukuoka Igaku Zasshi.
81:298–302. 1990.(In Japanese). PubMed/NCBI
|
|
11
|
High AS, Sutton J and Hopper AH: A
morphometric study of submandibular salivary gland changes in
streptozotocin-induced diabetic rats. Arch Oral Biol. 30:667–671.
1985.PubMed/NCBI View Article : Google Scholar
|
|
12
|
Widjaja J, Dolo PR, Zhang Q, Yao L, Li C,
Hong J, Wang H, Meng S, Shao Y and Zhu X: Bypassed and preserved
stomach resulted in superior glucose control in sprague-dawley rats
with streptozotocin-induced diabetes. Sci Rep.
9(9981)2019.PubMed/NCBI View Article : Google Scholar
|
|
13
|
Lin J, Lu Q and Yang ZM: Evaluation of
saliva collection method in rat model of spleen-deficiency by using
salivary alpha-amylase activity index. J Basic Chin Med.
22:909–911+924. 2016.(In Chinese).
|
|
14
|
Lin J, Yang ZM and Lu Q: Evaluation on the
methods for collecting saliva before and after acid stimulation by
salivary flow rate and sAA activity in rats. J Guangdong Pharm
University. 30:753–757. 2014.(In Chinese).
|
|
15
|
Mandel AL and Breslin PA: High endogenous
salivary amylase activity is associated with improved glycemic
homeostasis following starch ingestion in adults. J Nutr.
142:853–858. 2012.PubMed/NCBI View Article : Google Scholar
|
|
16
|
Elder PJD, Ramsden DB, Burnett D, Weickert
MO and Barber TM: Human amylase gene copy number variation as a
determinant of metabolic state. Expert Rev Endocrinol Metab.
13:193–205. 2018.PubMed/NCBI View Article : Google Scholar
|
|
17
|
Chen LH, Yang ZM, Chen WW, Lin J, Zhang M,
Yang XR and Zhao LB: Attenuated acute salivary α-amylase responses
to gustatory stimulation with citric acid in thin children. Br J
Nutr. 113:1078–1085. 2015.PubMed/NCBI View Article : Google Scholar
|
|
18
|
Kołodziej U, Maciejczyk M, Miąsko A,
Matczuk J, Knaś M, Żukowski P, Żendzian-Piotrowska M, Borys J and
Zalewska A: Oxidative modification in the salivary glands of high
fat-diet induced insulin resistant rats. Front Physiol.
8(20)2017.PubMed/NCBI View Article : Google Scholar
|
|
19
|
Silva MF, Barbosa KG, Pereira JV, Bento
PM, Godoy GP and Gomes DQ: Prevalence of oral mucosal lesions among
patients with diabetes mellitus types 1 and 2. An Bras Dermatol.
90:49–53. 2015.PubMed/NCBI View Article : Google Scholar
|
|
20
|
Aydin S: A comparison of ghrelin, glucose,
alpha-amylase and protein levels in saliva from diabetics. J
Biochem Mol Biol. 40:29–35. 2007.PubMed/NCBI View Article : Google Scholar
|
|
21
|
Hamed M, Mina J, Maryam B and Hamidreza A:
Salivary alpha-amylase alteration as a possible indicator for
diabetes. J Basic Appl Sci Res. 4:284–288. 2014.
|
|
22
|
Rohleder N and Nater UM: Determinants of
salivary α-amylase in humans and methodological considerations.
Psychoneuroendocrinology. 34:469–485. 2009.PubMed/NCBI View Article : Google Scholar
|
|
23
|
Carda C, Mosquera-Lloreda N, Salom L,
Gomez de Ferraris ME and Peydró A: Structural and functional
salivary disorders in type 2 diabetic patients. Med Oral Patol Oral
Cir Bucal. 11:E309–E314. 2006.(In English, Spanish). PubMed/NCBI
|
|
24
|
Xia DS, Liu Y, Zhang CM, Yang SH and Wang
SL: Observation of salivary flow rate and oral bacterial changes in
small pigs after bilateral parotid atrophy. Chin J Stomatol.
42:737–740. 2007.(In Chinese).
|
|
25
|
Teng YJ, Chen P, Zhao HT, Yang XF, Nian H
and Dong DW: The effect of ginkgo biloba extract on morphological
character of parotid gland and submandibular gland of diabetic
rats. Acta Chin Med Pharmacol. 39:21–23. 2011.(In Chinese).
|
|
26
|
Malicka B, Kaczmarek U and
Skośkiewicz-Malinowska K: Prevalence of xerostomia and the salivary
flow rate in diabetic patients. Adv Clin Exp Med. 23:225–233.
2014.PubMed/NCBI View Article : Google Scholar
|
|
27
|
Zalewska A, Knaś M, Zendzian-Piotrowska M,
Waszkiewicz N, Szulimowska J, Prokopiuk S, Waszkiel D and Car H:
Antioxidant profile of salivary glands in high fat diet-induced
insulin resistance rats. Oral Dis. 20:560–566. 2014.PubMed/NCBI View Article : Google Scholar
|
|
28
|
Proctor GB and Carpenter GH: Regulation of
salivary gland function by autonomic nerves. Auton Neurosci.
133:3–18. 2007.PubMed/NCBI View Article : Google Scholar
|
|
29
|
Ishikawa Y, Cho G, Yuan Z, Skowronski MT,
Pan Y and Ishida H: Water channels and zymogen granules in salivary
glands. J Pharmacol Sci. 100:495–512. 2006.PubMed/NCBI View Article : Google Scholar
|
|
30
|
Murdiastuti K, Purwanti N, Karabasil MR,
Li X, Yao C, Akamatsu T, Kanamori N and Hosoi K: A naturally
occurring point mutation in the rat aquaporin 5 gene, influencing
its protein production by and secretion of water from salivary
glands. Am J Physiol Gastrointest Liver Physiol. 291:G1081–G1088.
2006.PubMed/NCBI View Article : Google Scholar
|
|
31
|
Ma T, Song Y, Gillespie A, Carlson EJ,
Epstein CJ and Verkman AS: Defective secretion of saliva in
transgenic mice lacking aquaporin-5 water channels. J Biol Chem.
274:20071–20074. 1999.PubMed/NCBI View Article : Google Scholar
|
|
32
|
Solinas G and Karin M: JNK1 and IKKbeta:
Molecular links between obesity and metabolic dysfunction. FASEB J.
24:2596–2611. 2010.PubMed/NCBI View Article : Google Scholar
|