Introduction
Hepatocellular carcinoma (HCC) is a highly lethal
tumor, which is the third most frequent cause of cancer-associated
mortality with an increasing incidence rate worldwide (1). Accurate and timely diagnoses of HCC are
often challenging. Diagnosis of HCC relies on a number of different
diagnostic methods, including ultrasound, computed tomography,
biopsy and blood tests (2). Liver
biopsy is regarded as the ‘gold standard’ for the diagnosis of HCC;
however, liver biopsies are invasive procedures where the patient
often experiences complications, such as bacteremia or death (risk
of death, ~0.01%) (3). Similarly,
there are certain disadvantages to ultrasound and computed
tomography, which limit their effectiveness in the diagnosis.
Currently, the serum α-fetoprotein (AFP) level is regarded as a
biomarker for HCC and is used widely in the clinical setting.
However, the specificity and sensitivity of AFP against HCC remains
unsatisfactory. As presented in the studies performed by Lok et
al (4) and Marrero et al
(5), the sensitivity of AFP in the
diagnosis of HCC when using a threshold of 20 ng/ml was 61%, while
when using a threshold of 200 ng/ml the sensitivity decreased to
22%. Therefore, novel HCC biomarkers are urgently required.
Peripheral blood mononuclear cells (PBMCs) are
immune cells that include lymphocytes and monocytes, and play a key
role in the host immune system to fight against various abnormal
conditions such as infection and carcinoma (6). Various studies have demonstrated that
the gene expression level of PBMCs was significantly changed in
patients with tumors and detection of changes in PBMCs may help to
improve the diagnosis (7,8). Ciarloni et al (9) demonstrated the potential for developing
a noninvasive and accurate inspection to identify patients at an
average risk of colorectal cancer based on gene expression analysis
of PBMCs segregated from patient blood samples. Similarly, Baine
et al (10,11) demonstrated that eight genes,
including ARG1, were differently expressed in the PBMCs of patients
with pancreatic cancer when compared with healthy controls. These
genes could potentially be developed as novel biomarkers for the
early diagnosis of pancreatic cancer. Furthermore, Mishra et
al (12) revealed that microRNA
(miR)-195-5p and miR-495 were downregulated in the PBMCs of
patients with breast cancer when compared with healthy controls,
and suggested that these two miRs could be used for the early
detection of breast cancer.
In the present study, eight hub genes from two gene
expression profiles were identified and it was revealed that these
hub genes have good diagnostic value for the diagnosis of HCC. The
diagnosis value of five hub genes was also prominent in the
additional samples used in the present study, including secreted
protein acidic and cysteine rich (SPARC), transmembrane protein 40
(TMEM40), formyl peptide receptor 2 (FPR2), protein kinase C
δ(PRKCD) and protein phosphatase, Mg2+/Mn2+
dependent 1M(PPM1M). These hub genes may have the potential to be
novel biomarkers for HCC.
Materials and methods
Data collection
The gene expression data files of GSE49515 and
GSE58208 were downloaded from the Gene Expression Omnibus database
(GEO) database (http://www.ncbi.nlm.nih.gov/geo/). The platform used
to analyze these two data files was GPL570 (Affymetrix Human Genome
U133 Plus 2.0 Array). The dataset profile of GSE49515 contained 10
PBMC specimens from normal patients and 10 PBMC specimens from
patients with HCC. The dataset profile of GSE58208 contained 5 PBMC
specimens from normal patients and 10 PBMC specimens from patients
with HCC.
Data pretreatment and identification
of DEGs
The present study first integrated all samples of
GSE49515 and GSE58208 to significantly improve the number of
samples 5 normal samples vs. 20 tumor samples) and to avoid
generating less relable results, followed by batch normalization in
the R computing environment using the sva package (13). The differential anaysis (|Log2FC|
> 0.5, adjusted P<0.05) was then performed by comparing tumor
tissues with normal tissues in the R computing environment [version
3.5.2; The R Foundation for Statistical Computing (14)] using the limma package (version 2.13;
Bioconductor). DEGs were visualized in a heatmap.
Weighted gene co-expression networks
(WGCNA) and module analysis
WGCNA is a systems biology method for identifying
patterns that have relevance among genes in microarray samples. In
the WGCNA network, modules of highly correlated genes can be
investigated; as such, clusters using a module eigengene or an
intra-modular hub gene can be summarized; modules relationship with
one another and to external sample traits can be identified, and
module membership measures can be calculated (15). In order to identify the interactions
between the DEGs in the present study, the WGCNA was performed to
identify the co-expression modules with a threshold of power, 16. A
hierarchical clustering dendrogram of the topological overlap
matrix was then constructed using the average distance with a
minimum size threshold of 30 to classify the similar gene
expression profiles into different gene modules. The modules with
an average distance<0.2 were merged. Following co-expression,
modules were identified in the WGCNA network and heatmaps and bar
charts were used to describe module eigengenes.
Functional enrichment analysis of
modules
The database for annotation, visualization and
integrated discovery (DAVID; version 6.8; http://david-d.ncifcrf.gov/) was used in the study to
perform functional annotation for genes in four modules, including
GO [biological processes (BP), molecular function (MF) and cellular
components (CC)] and KEGG pathway analysis. Analysis results were
extracted when P<0.05. Only the top five GO terms were
visualized using R software if there were more than five terms, as
with the results of the KEGG pathway analysis.
Co-expression network construction and
identification of hub genes
First, the co-expression data of all genes in each
module with a threshold weight >0.05 were exported into a
textfile. Secondly, the top 10 genes with highest module membership
in each module were selected to construct the co-expression
network. Co-expression network visualization was performed using
Cytoscape (version 3.5.1; National Institute of General Medical
Sciences). Genes with the highest module membership (MM) and degree
scores in the co-expression network were regarded as hub genes.
Diagnostic value of hub genes
The sensitivity and specificity of the hub genes
identified in the present study were evaluated through the receiver
operating characteristic (ROC) curve. The ROC curve was created
using SPSS 20.0 (IBM, Corps.). When the genes had an area under the
curve (AUC) >0.7, they were considered to have good diagnosis
value.
Patient blood samples
The clinical blood samples from normal patients
(female=9, male=33; mean age: 54±9) or patients with HCC (female=6,
male=22; mean age: 56±14) in the present study were obtained from
Renmin Hospital of Wuhan University (Wuhan, China), between April
2019 and June 2019. All patients who had samples taken had provided
informed consent. The present study was approved by the Ethics
Committee of the Renmin Hospital of Wuhan University and was
performed in accordance with the Declaration of Helsinki.
PBMC isolation
Patient blood samples were collected in
anticoagulant tubes containing EDTA. PBMCs were isolated by density
gradient centrifugation using Ficoll-Paque Plus (Invitrogen; Thermo
Fisher Scientific, Inc.) and cultured in RPMI 1640 medium (Gibco;
Thermo Fisher Scientific, Inc.) supplemented with 10% fetal bovine
serum (FBS; Gibco; Thermo Fisher Scientific, Inc.) at 37˚C with 5%
CO2.
Reverse transcription-quantitative
PCR
Total RNA was extracted from tissues and cells using
TRIzol® reagent (Yeasan). The PrimeScript RT Reagent kit
(Yeasan) was used to perform the cDNA synthesis. The following
primers were used: TMEM40: Forward, 5'-CAGAGCAACCGGAAAACATCG-3';
reverse, 5'-TCATCCTTCAAAACGTCAGGC-3'; SPARC: Forward,
5'-TGAGGTATCTGTGGGAGCTAATC-3'; reverse, 5'-CCTTGCCGTGTTTGCAGTG-3';
solute carrier family 25 member 44 (SLC25A44): Forward,
5'-ATGGAGGACAAACGCAACATC-3'; reverse, 5'-ACACTGACACGGATCATCATTG-3';
FPR2: Forward, 5'-AGTCTGCTGGCTACACTGTTC-3'; reverse,
5'-TGGTAATGTGGCCGTGAAAGA-3' (reverse); complement C8 β chain(C8B):
Forward, 5'-ATTCCTTTGGGTCAAATGCAGT-3'; reverse,
5'-GGACCAACTAGACAGCTCACA-3'; N-myristoyltransferase 1 (NMT1):
Forward, 5'-GGTCAGGGACCTGCCAAAAC-3'; reverse,
5'-CATGGGTGTTCACCACTTCG-3'; PRKCD: Forward,
5'-GTGCAGAAGAAGCCGACCAT-3'; reverse, 5'-CCCGCATTAGCACAATCTGGA-3';
PPM1M: Forward, 5'-CTTGGTGCGGAGAGATGAGAT-3'; reverse,
5'-GCTCAGGATAGACAAAGGCCAG-3' and β-actin: Forward,
5'-CATGTACGTTGCTATCCAGGC-3'; reverse,
5'-CTCCTTAATGTCACGCACGAT-3'.
The reaction was performed under the following
conditions: 95˚C 30 sec for the first initial cycle; 95˚C for 30
sec and 40 subsequent cycles at 60˚C for 30 sec each. β-actin was
used as the loading control. The relative level of gene expression
was calculated using the 2-ΔΔCt method (16).
Statistical analysis
GraphPad Prism (version 6.0; GraphPad Software,
Inc.) was used in the present study to perform the statistical
analysis. Data was presented as mean ± standard deviation.
Independent-sample t-tests were used to analyze the data. P<0.05
was considered to indicate a statistically significant
difference.
Results
Identification of DEGs
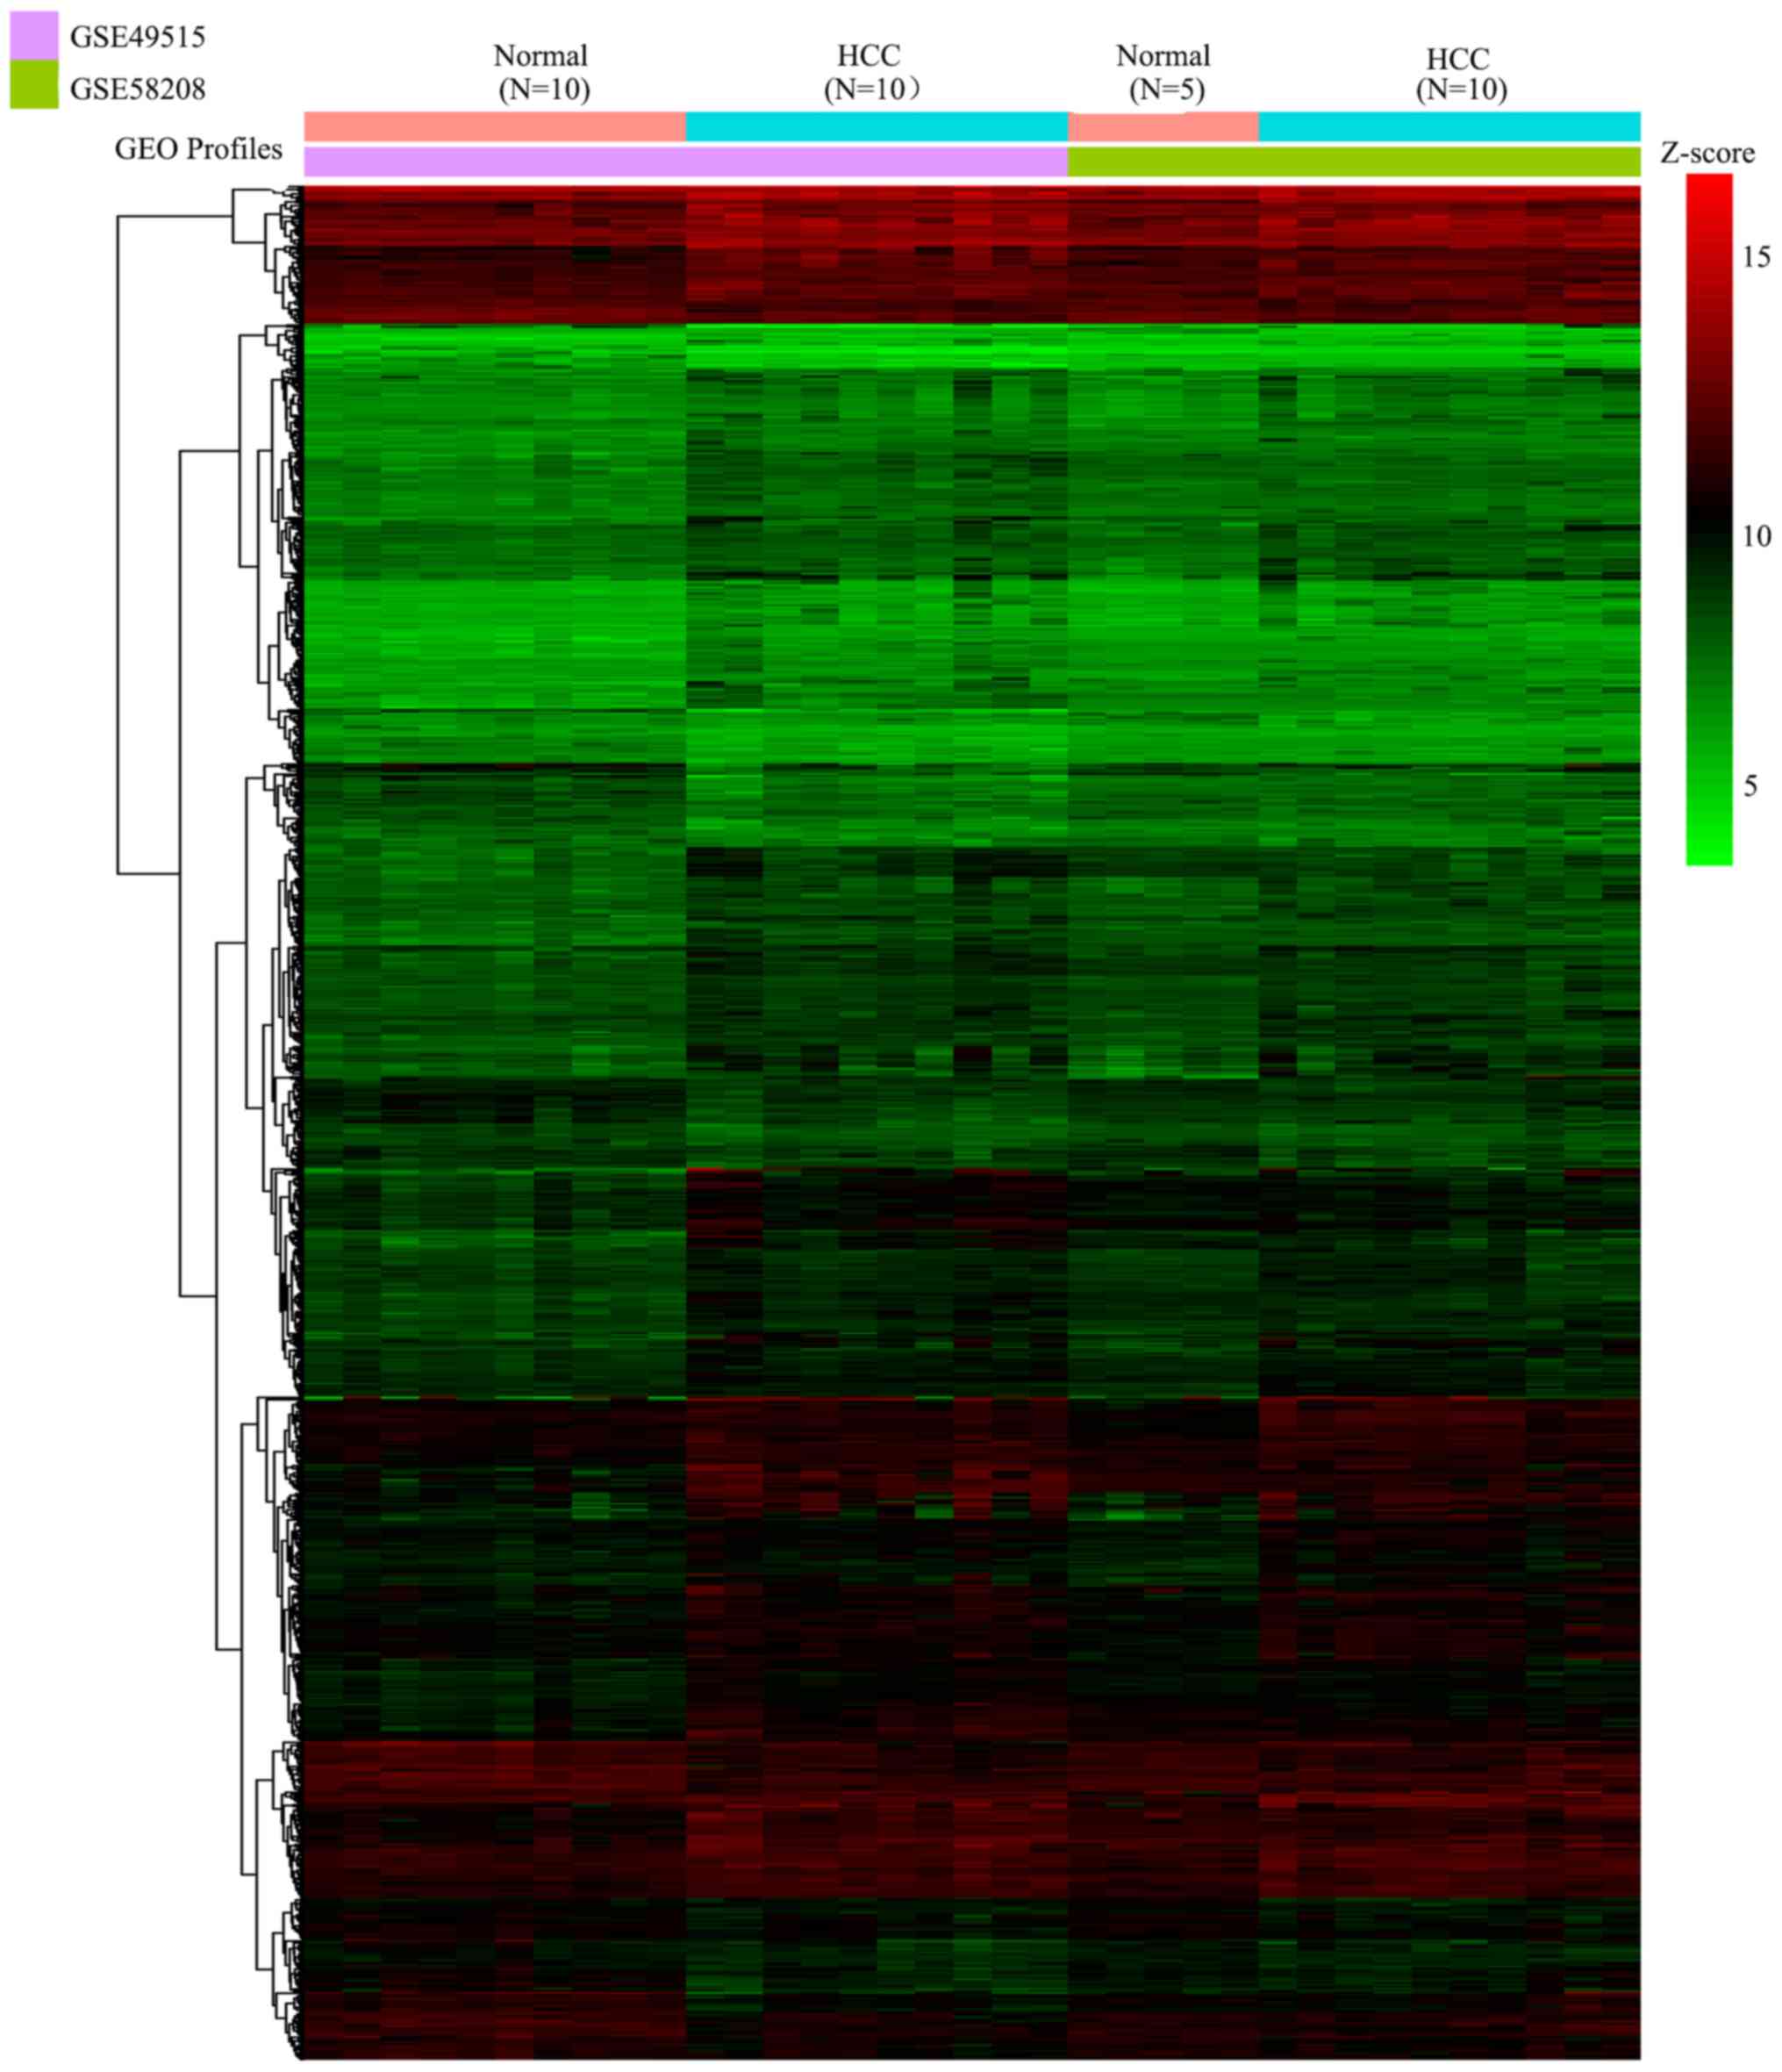
The present study first integrated all samples of
GSE49515 and GSE58208 by sva package to form a novel gene profile,
including the gene expression profile of PBMCs from 15 normal
controls and 20 patients with HCC. A total of 935 DEGs (including
686 upregulated DEGs and 249 downregulated DEGs) were identified
under the threshold of |logFC| >0.5 and adjusted P<0.05.
These 935 DEGs were presented in a heatmap (Fig. 1) and then were used for subsequent
analysis.
Construction of weighted gene
co-expression modules
In order to identify any associations between the
935 DEGs, WGCNA, a systems biology method, was used to screen
potential biomarkers and therapeutic targets via gene co-expression
network construction. DEGs involved in similar pathways or with the
same biological function tended to have the same expression
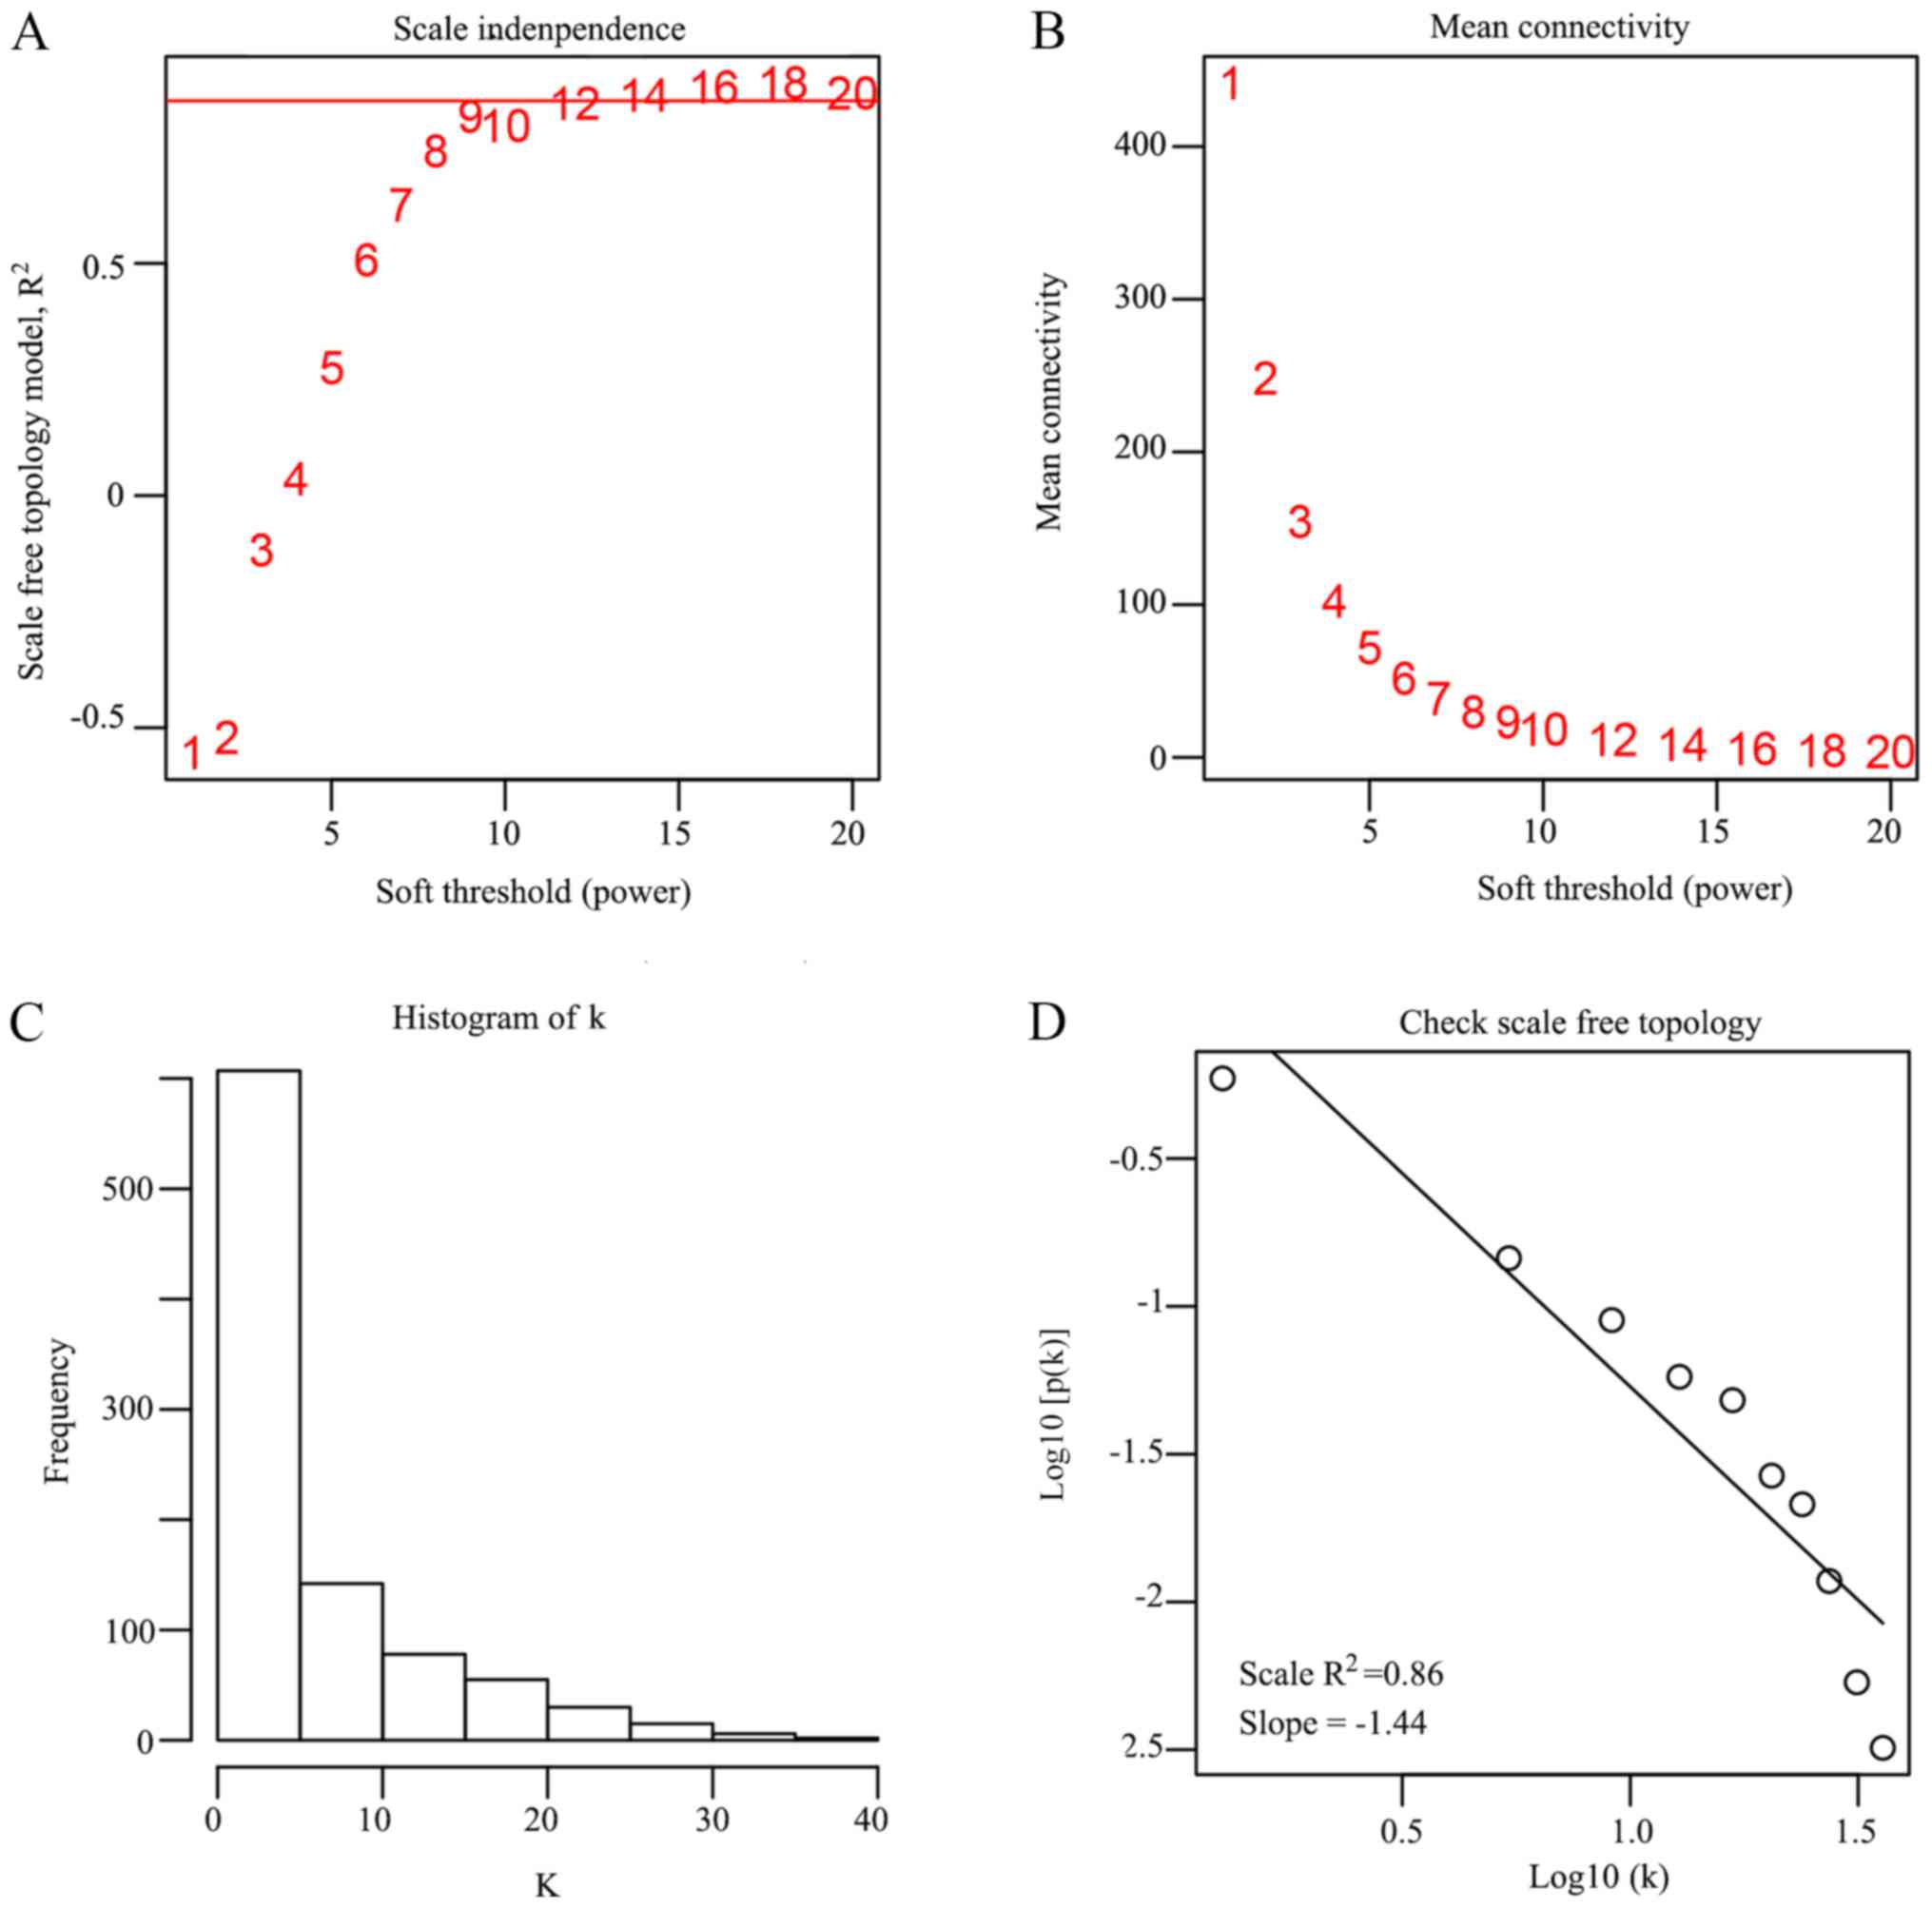
cluster. In the present study, β =16 was set to ensure high scale
independence (~0.9) and low mean connectivity (~0.0) (Fig. 2). The dissimilarity of the modules
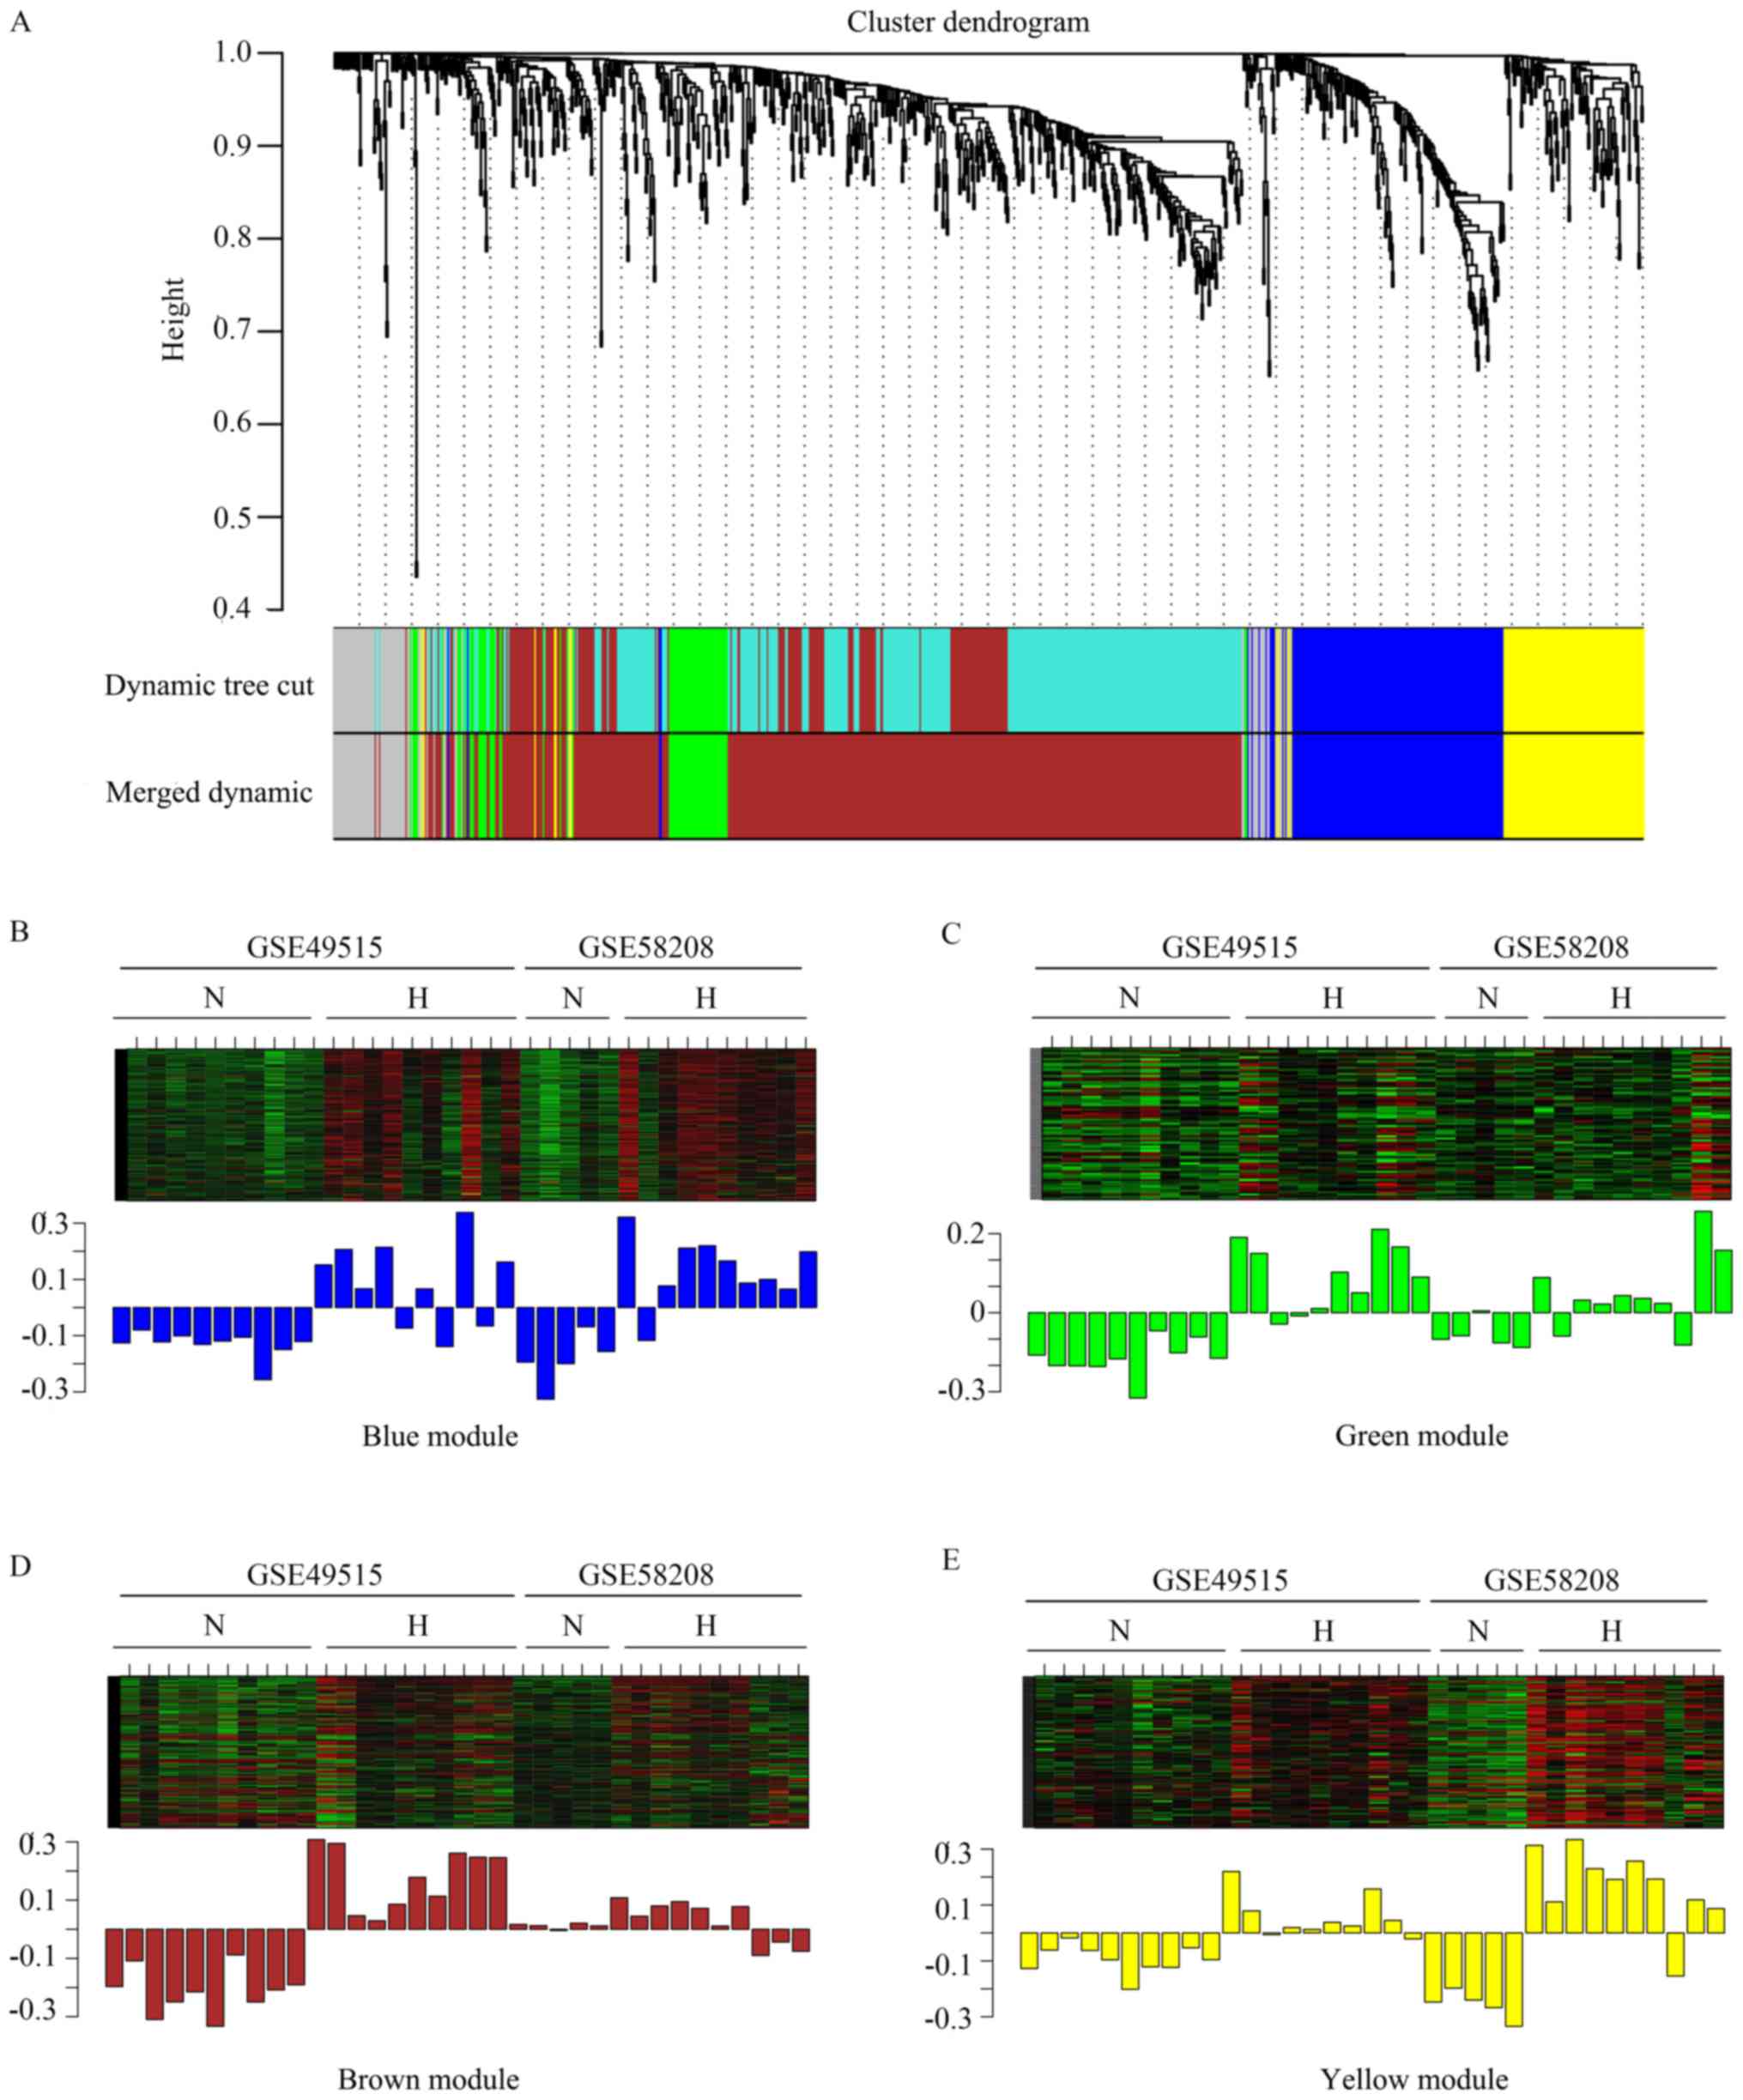
was set as 0.2 and a total of four co-expressed modules were
identified with a module size cut-off ≤30. The grey colored
clusters represent the non-clustering genes in WGCNA (Fig. 3A). Furthermore, the module eigengene
diagrams for blue, green, brown and yellow modules all exhibited a
higher average expression profile in HCC samples (Fig. 3B-E).
GO analysis for the modules
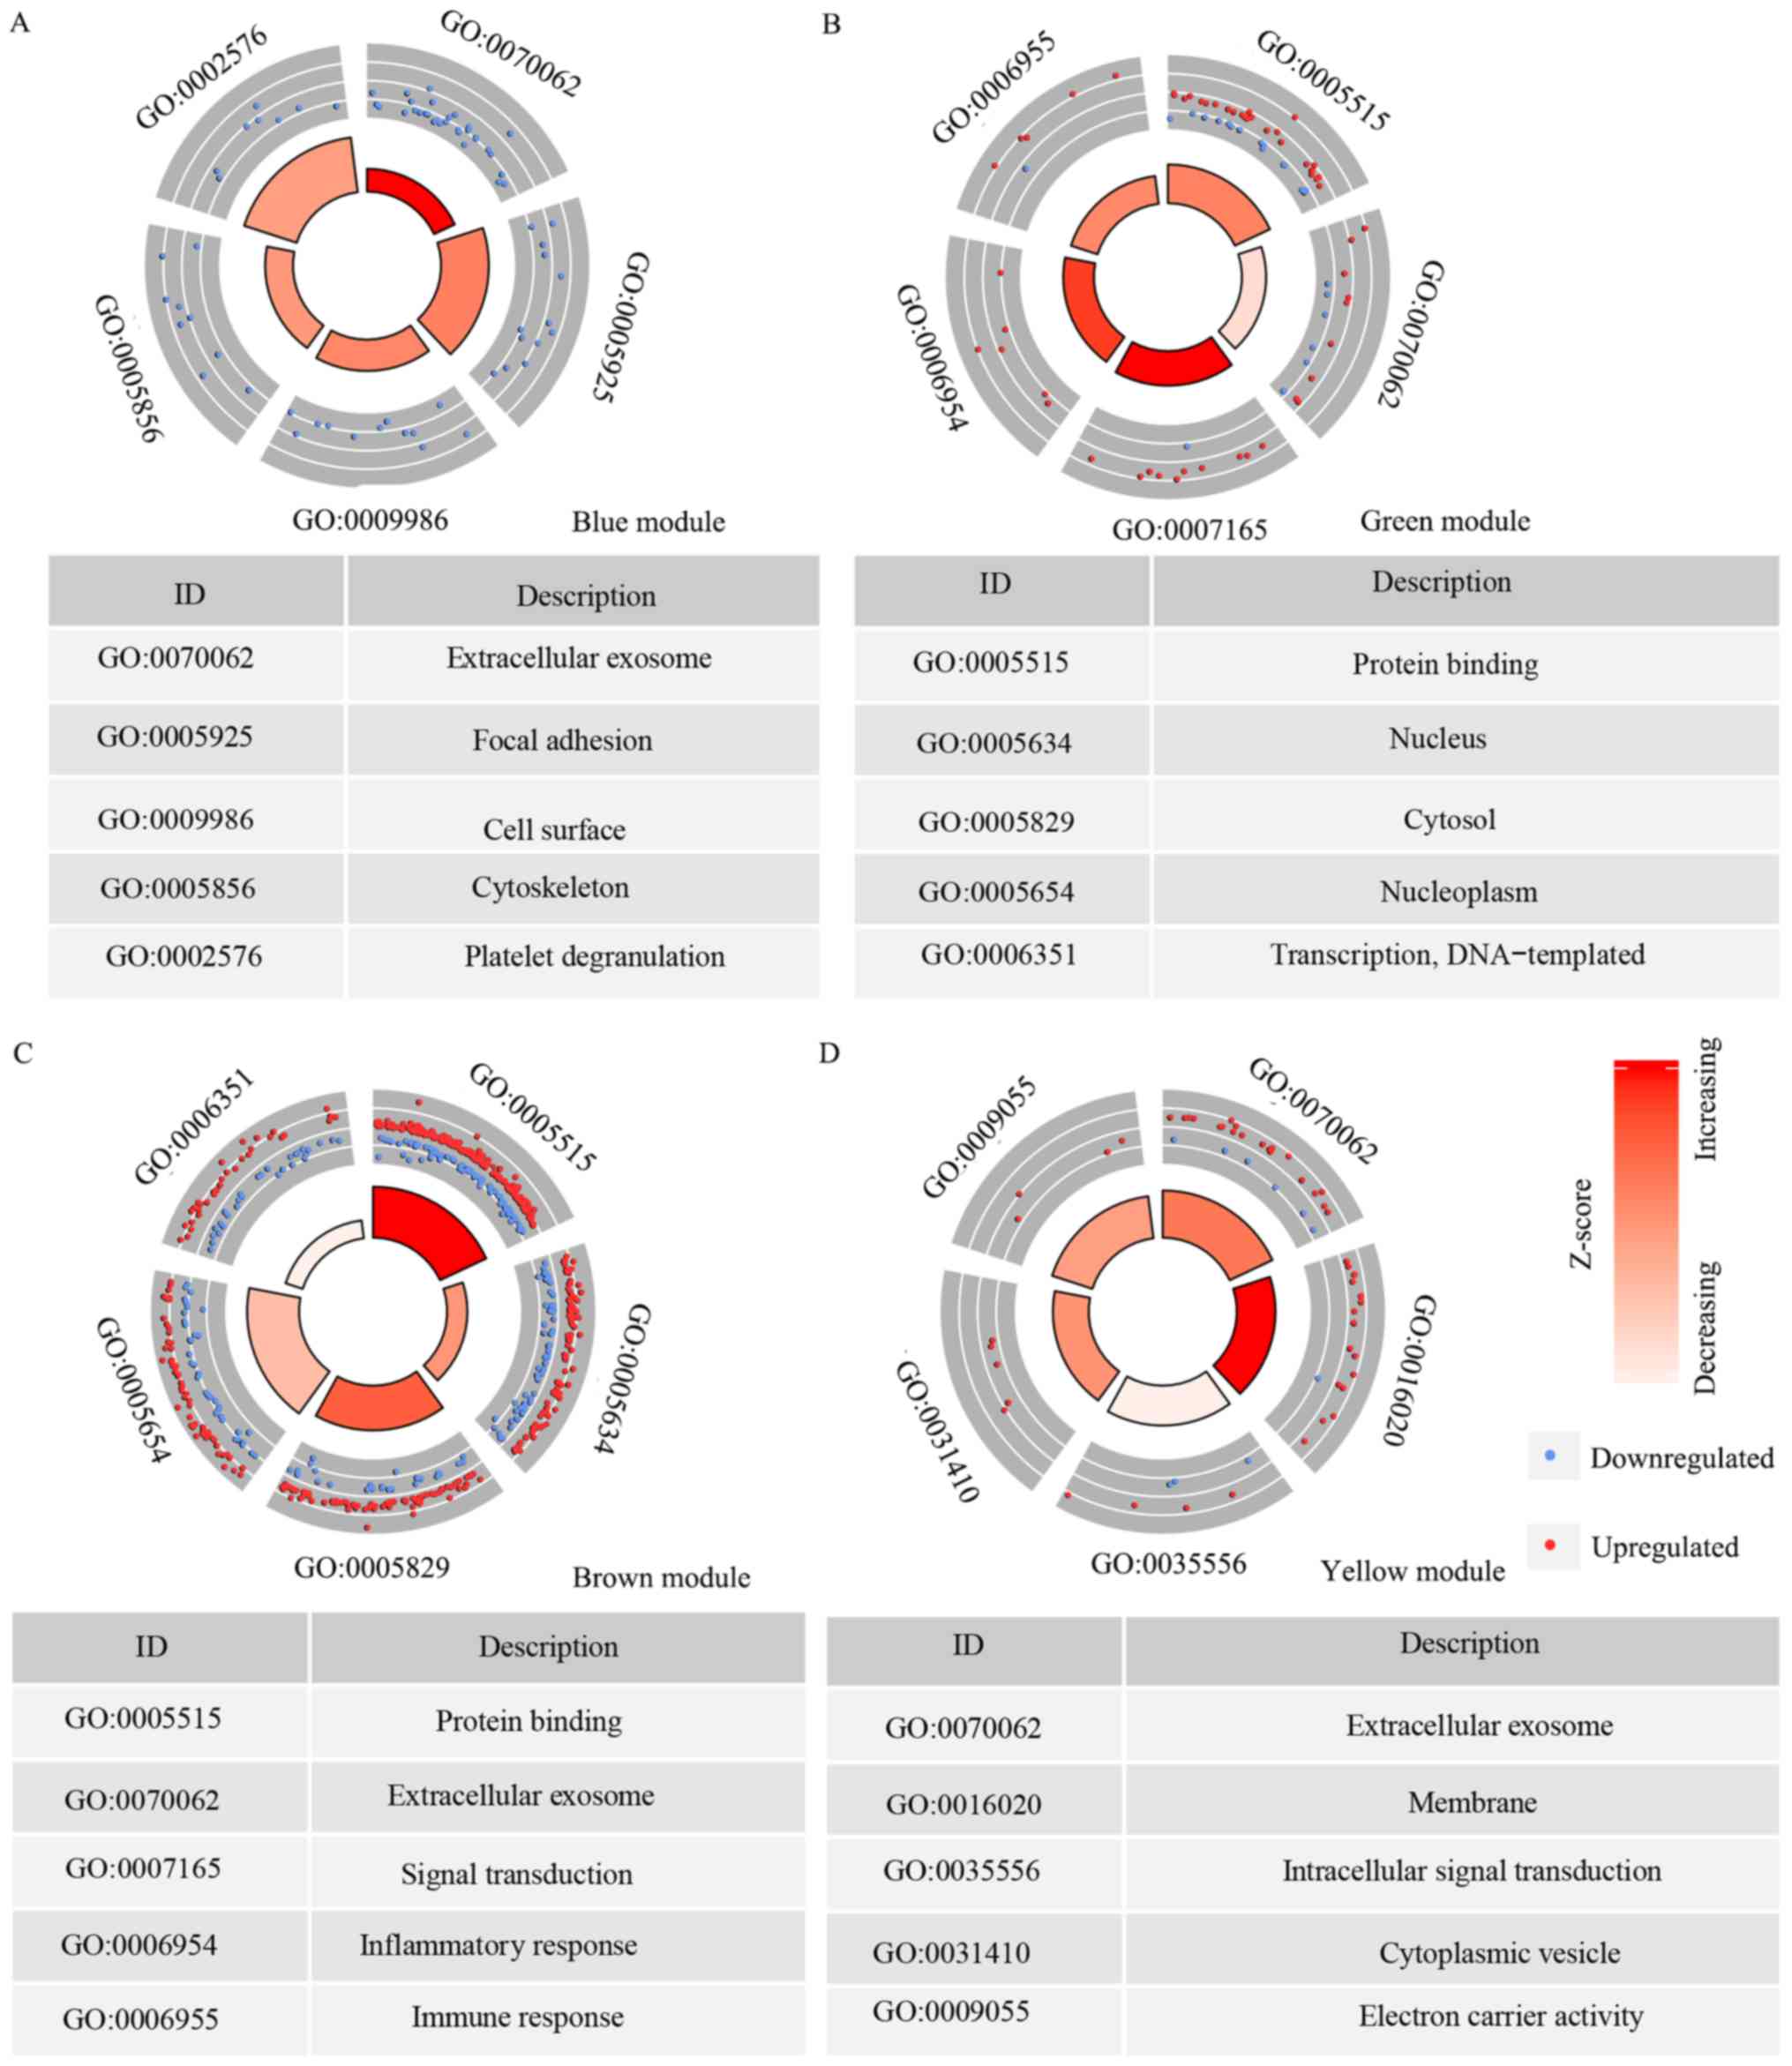
There were 165 genes in the blue module and the top
five GO terms that the genes were enriched in were: Extracellular
exosome (GO category, CC), focal adhesion (GO category, CC), cell
surface (GO category, CC), cytoskeleton (GO category, CC) and
platelet degranulation (GO category, biological BP; Fig. 4A). In the green module, there were 73
genes and the top five GO terms that they were enriched in were:
Protein binding (GO category, MF); extracellular exosome (GO
category, CC); signal transduction (GO category, BP); inflammatory
response (GO category, BP) and immune response (GO category, BP)
(Fig. 4B). The brown module had 503
genes, which were enriched in: Protein binding (GO category, MF);
nucleus (GO category, CC); cytosol (GO category, CC); nucleoplasm
(GO category, CC) and transcription (GO category, BP) (Fig. 4C). The yellow module had 111 genes
and the top five GO terms the genes enriched in were: Extracellular
exosome (GO category, CC); membrane (GO category, CC);
intracellular signal transduction (GO category, BP); cytoplasmic
vesicle (GO category, CC) and electron carrier activity (GO
category, MF; Fig. 4D).
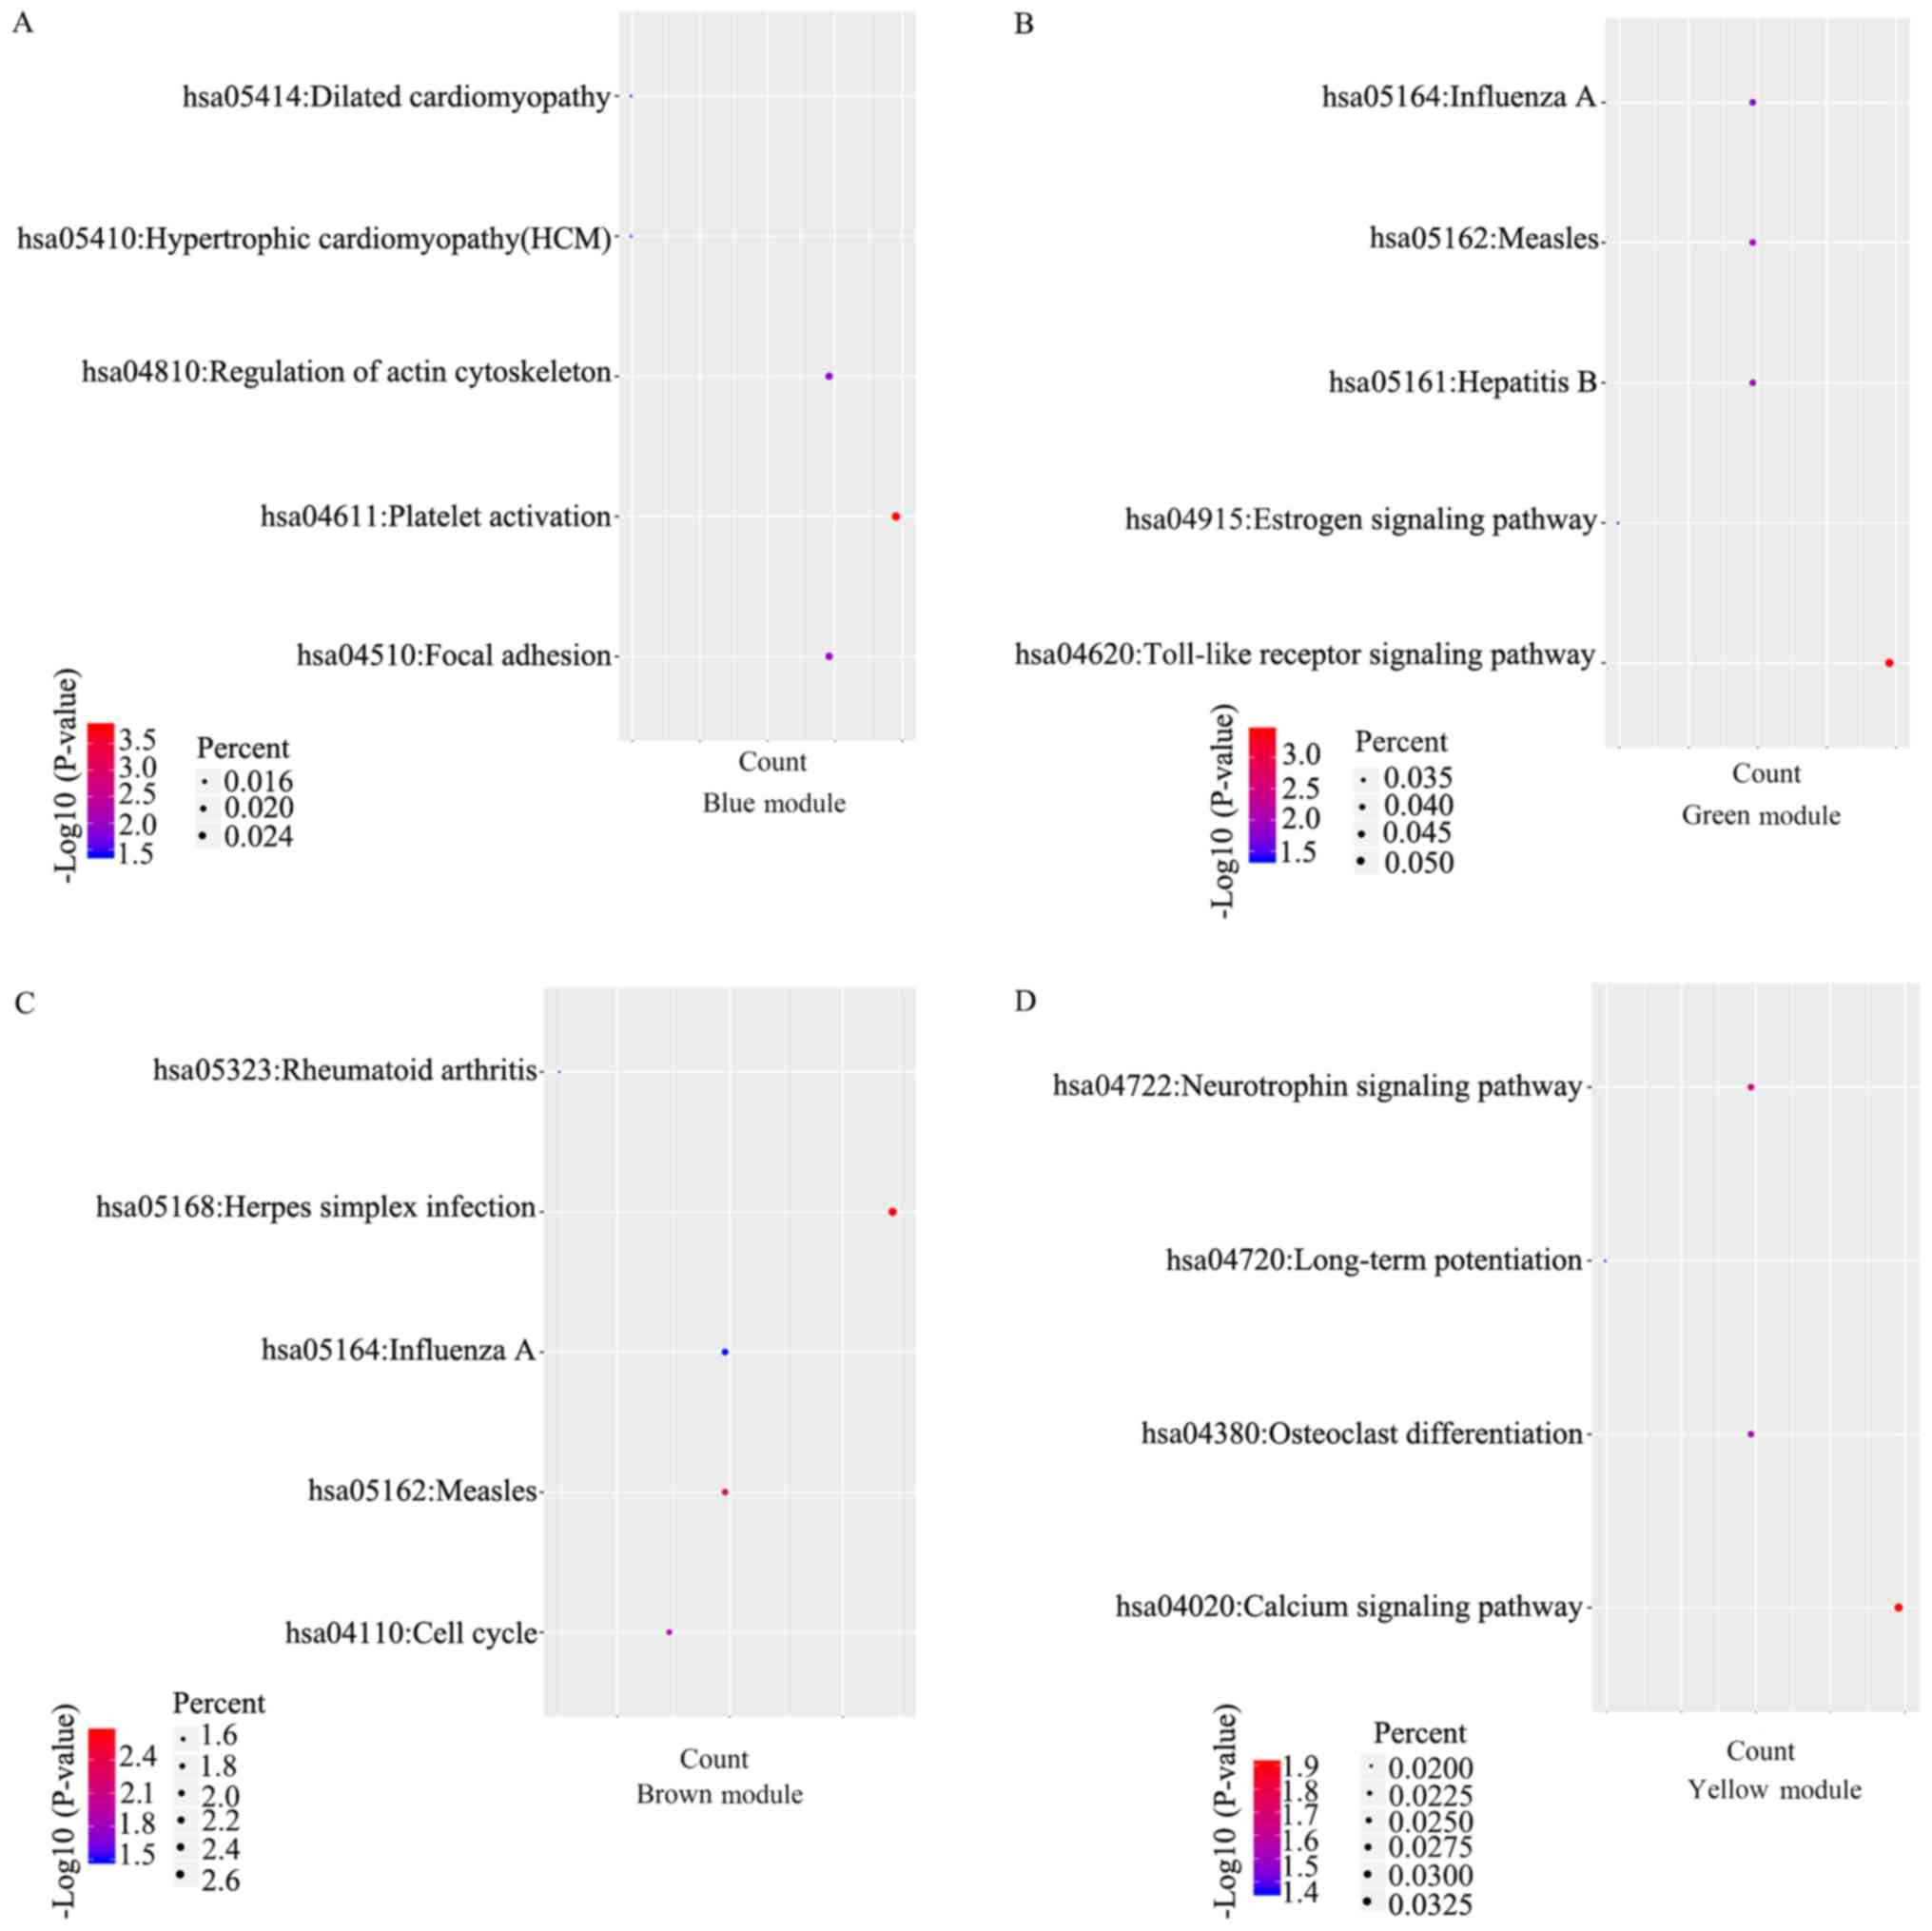
KEGG analysis for the modules
A KEGG analysis was performed using DAVID. The
results revealed that the genes in the blue module were enriched in
platelet activation, focal adhesion, regulation of actin
cytoskeleton, hypertrophic cardiomyopathy and dilated
cardiomyopathy pathway, while the genes in the green module were
enriched in the Toll-like receptor signaling pathway, measles,
hepatitis B, influenza A and the estrogen signaling pathway
(Fig. 5A and B). The genes in the brown modules were
enriched in herpes simplex infection, measles, influenza A, the
cell cycle and the rheumatoid arthritis-associated pathway
(Fig. 5C). Furthermore, the genes in
the yellow module were enriched in the calcium signaling pathway,
the neurotrophin signaling pathway, osteoclast differentiation and
the long-term potentiation assocated pathway (Fig. 5D).
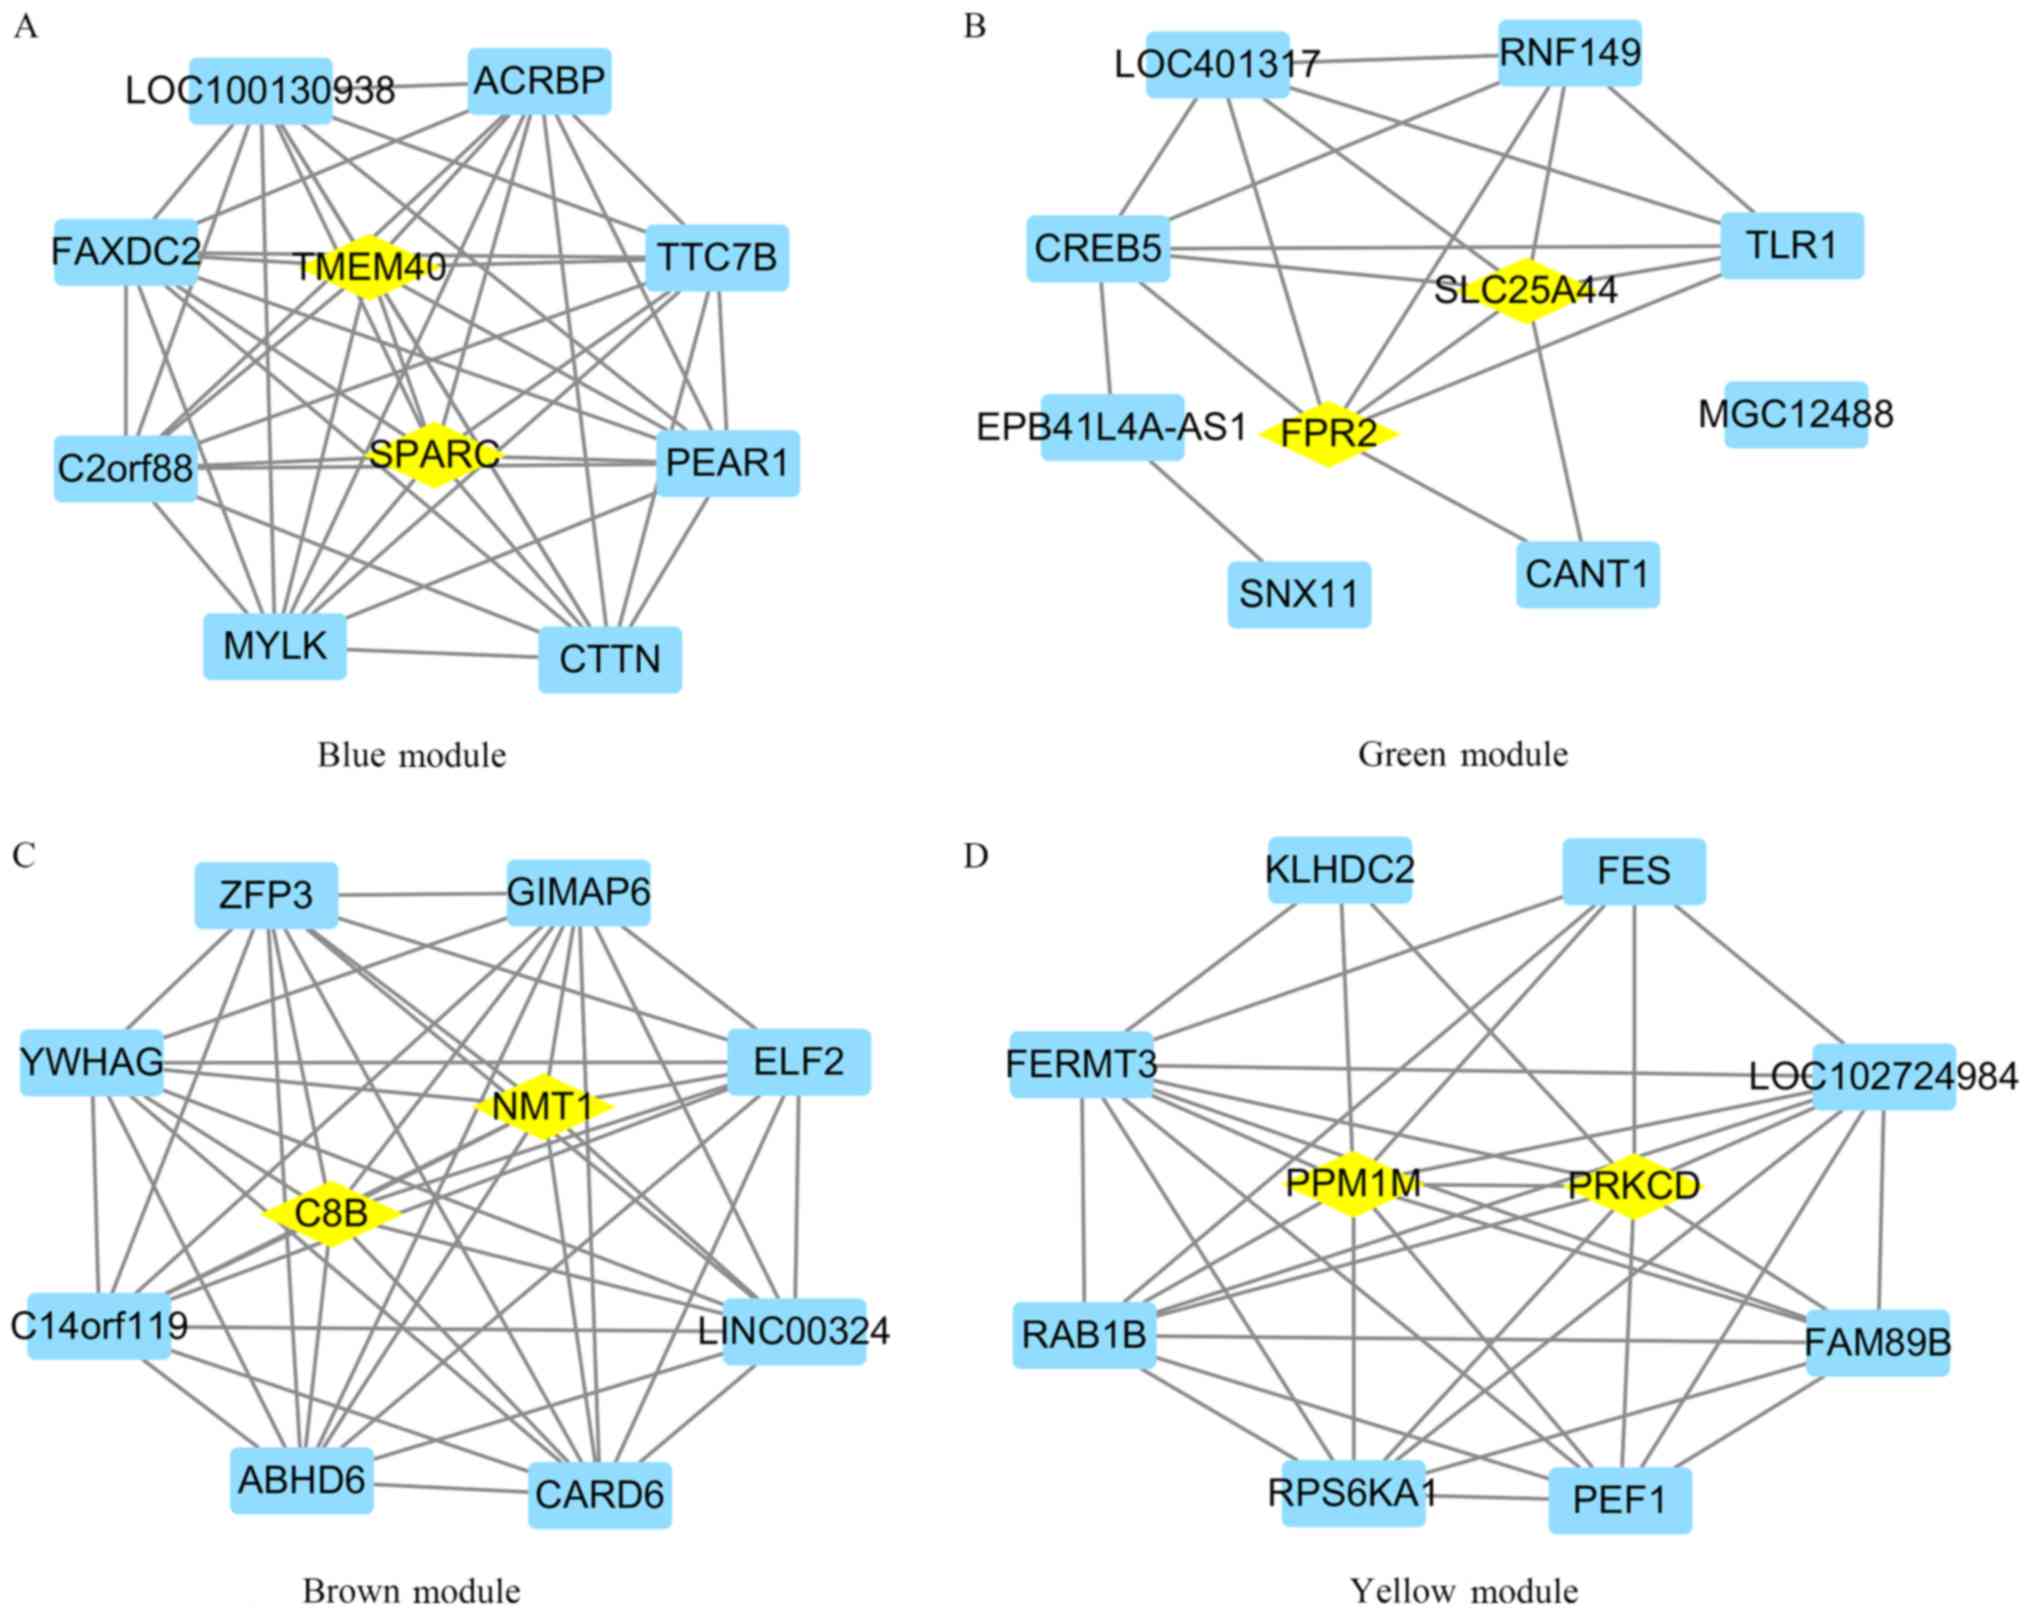
Identification of hub genes and their
diagnosis value based on the gene expression profiles
Genes in the blue, green, brown and yellow modules
with module membership scores ranked in the top 10 were used to
construct co-expression networks and were visualized in Cytoscape.
It was demonstrated that SPARC and TMEM40 were hub genes in the
blue module, SLC25A44 and FPR2 were hub genes in the green module,
C8B and NMT1 were hub genes in the brown module, and PRKCD and
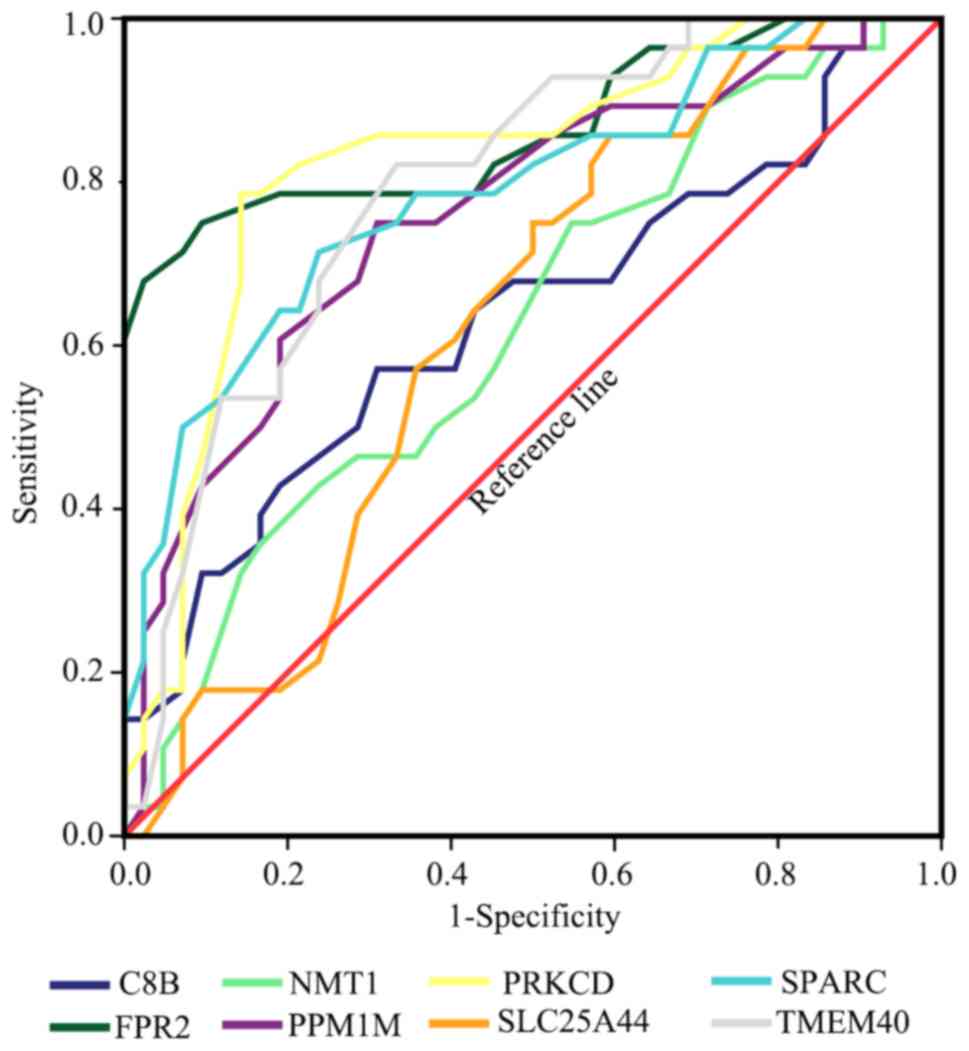
PPM1M were hub genes in the yellow module (Fig. 6). ROC curves were created and it was
revealed that all hub genes had diagnostic value: SPARC (AUC,
0.917; 95% CI, 0.811-1.000), TMEM40 (AUC, 0.887; 95% CI,
0.770-1.000), SLC25A44 (AUC, 0.943; 95% CI, 0.874-1.000), FPR2
(AUC, 0.903; 95% CI 0.796-1.000), C8B (AUC, 0.810; 95% CI,
0.654-0.966), NMT1 (AUC, 0.920; 95% CI 0.832-1.000), PRKCD (AUC,
0.923; 95% CI, 0.829-1.000) and PPM1M (AUC, 0.963; 95% CI,
0.901-1.000; Fig. 7).
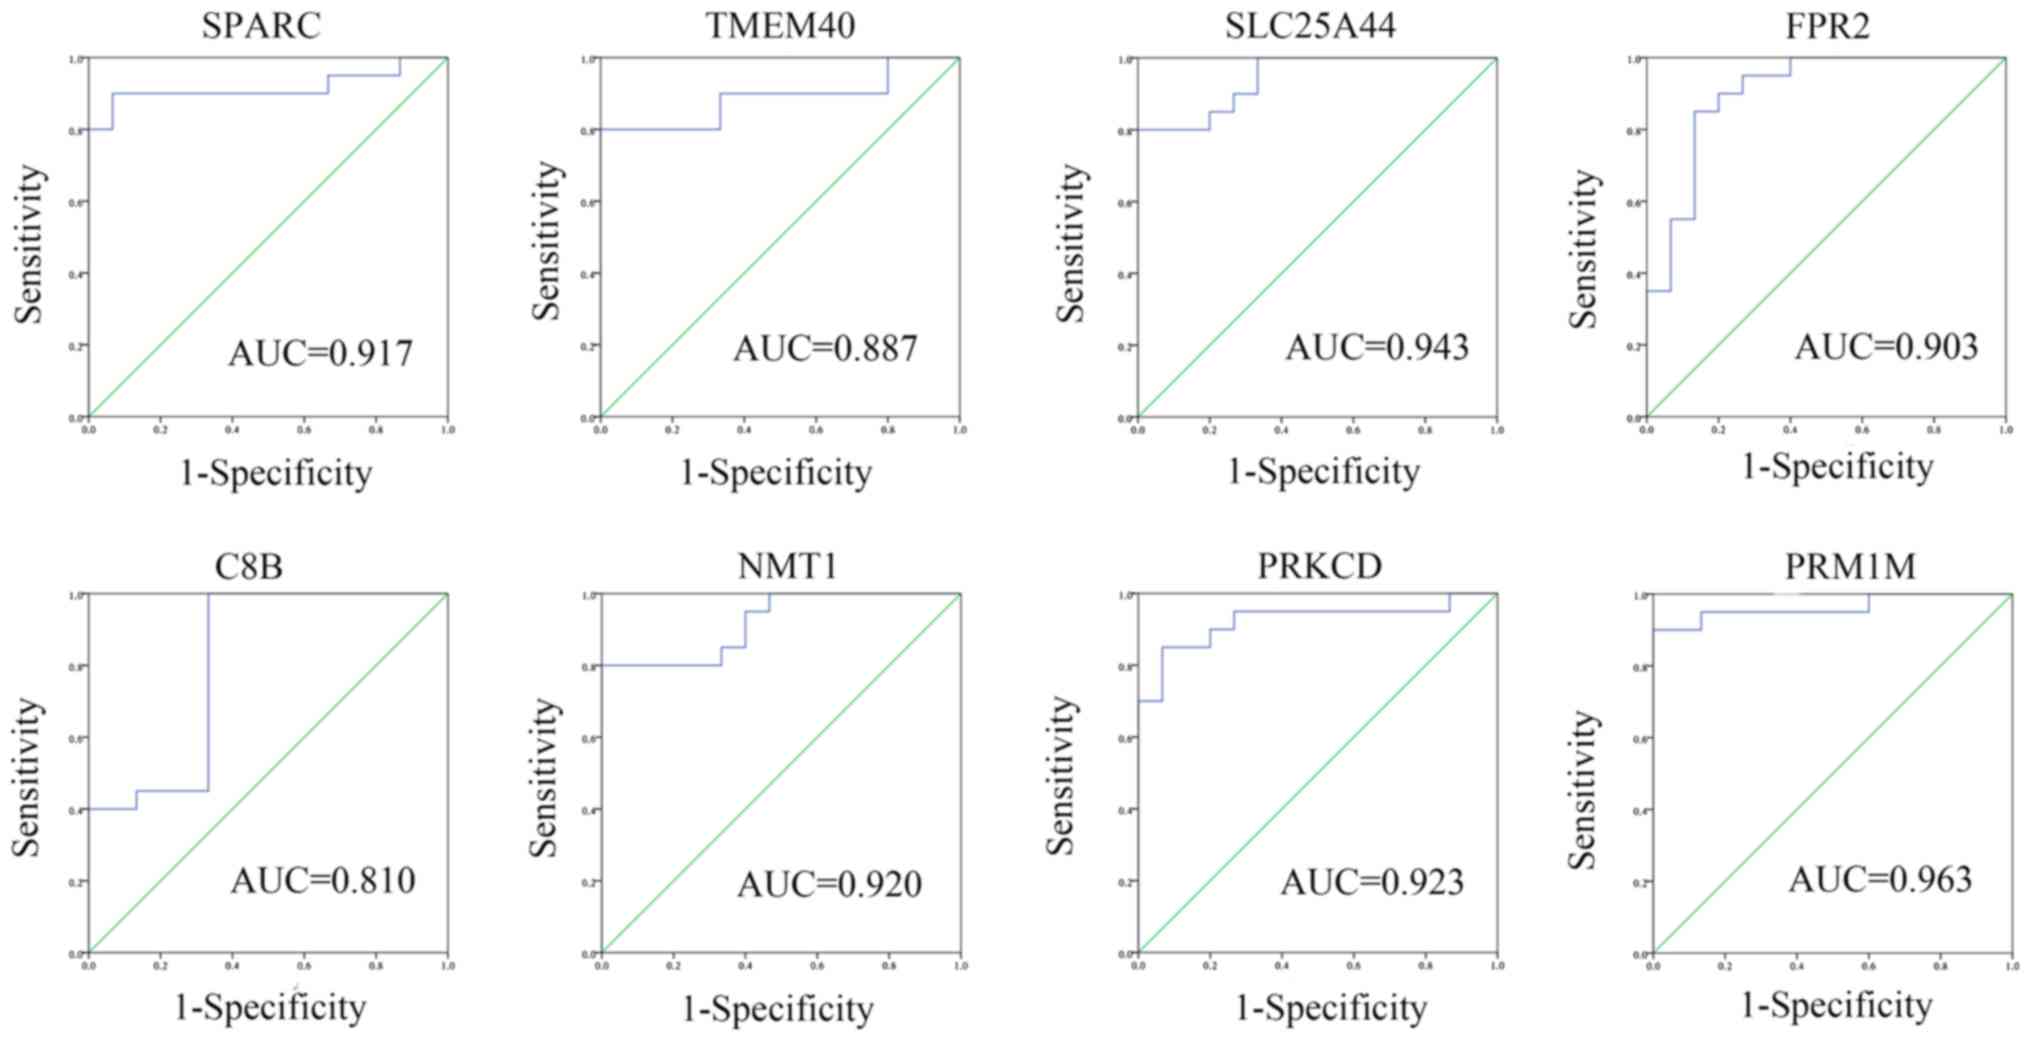 | Figure 7Receiver operator characteristic curve
of 8 hub genes (SPARC, TMEM40, SLC25A44, FPR2, C8B, NMT1, PRKCD and
PPM1M). The curves were calculated according to the two gene
expression profiles and the corresponding clinical state. AUC, area
under the curve. SPARC, secreted protein acidic and cysteine rich;
TMEM40, transmembrane protein 40; SLC25A44, solute carrier family
25 member 44; C8B, complement C8 β chain; NMT1,
N-myristoyltransferase 1; PRKCD, protein kinase C δ; PPM1M, protein
phosphatase, Mg2+/Mn2+ dependent 1M. |
Expression and diagnostic value in
patient blood samples
In order toverify the results obtained from the
prediction analyses, reverse transcription-quantitative PCR was
performed on the additional blood samples. The results revealed
that the expression levels of TMEM40, SPARC, FPR2, PRKCD and PPM1M
were significantly increased in the PBMCs from patients with HCC
compared with the normal patients (P<0.05), while the expression
levels of SLC25A44, C8B and NMT1 were not significantly different
(Fig. 8). ROC curves were also
calculated and the results revealed that TMEM40, SPARC, FPR2, PRKCD
and PPM1M all had good diagnostic value using a cut-off AUC value
of 0.7. The results of the AUC were as follows: TMEM40 (AUC, 0.796;
95% CI, 0.692-0.900), SPARC (AUC, 0.789; 95% CI 0.678-0.900),
SLC25A44 (AUC, 0.626; 95% CI, 0.496-0.756), FPR2 (AUC, 0.865; 95%
CI, 0.769-0.960), C8B (AUC, 0.635; 95% CI, 0.498-0.773), NMT1 (AUC,
0.626; 95% CI, 0.493-0.759), PRKCD (AUC, 0.827; 95% CI,
0.725-0.929) and PPM1M (AUC, 0.761; 95% CI, 0.645-0.877; Fig. 9).
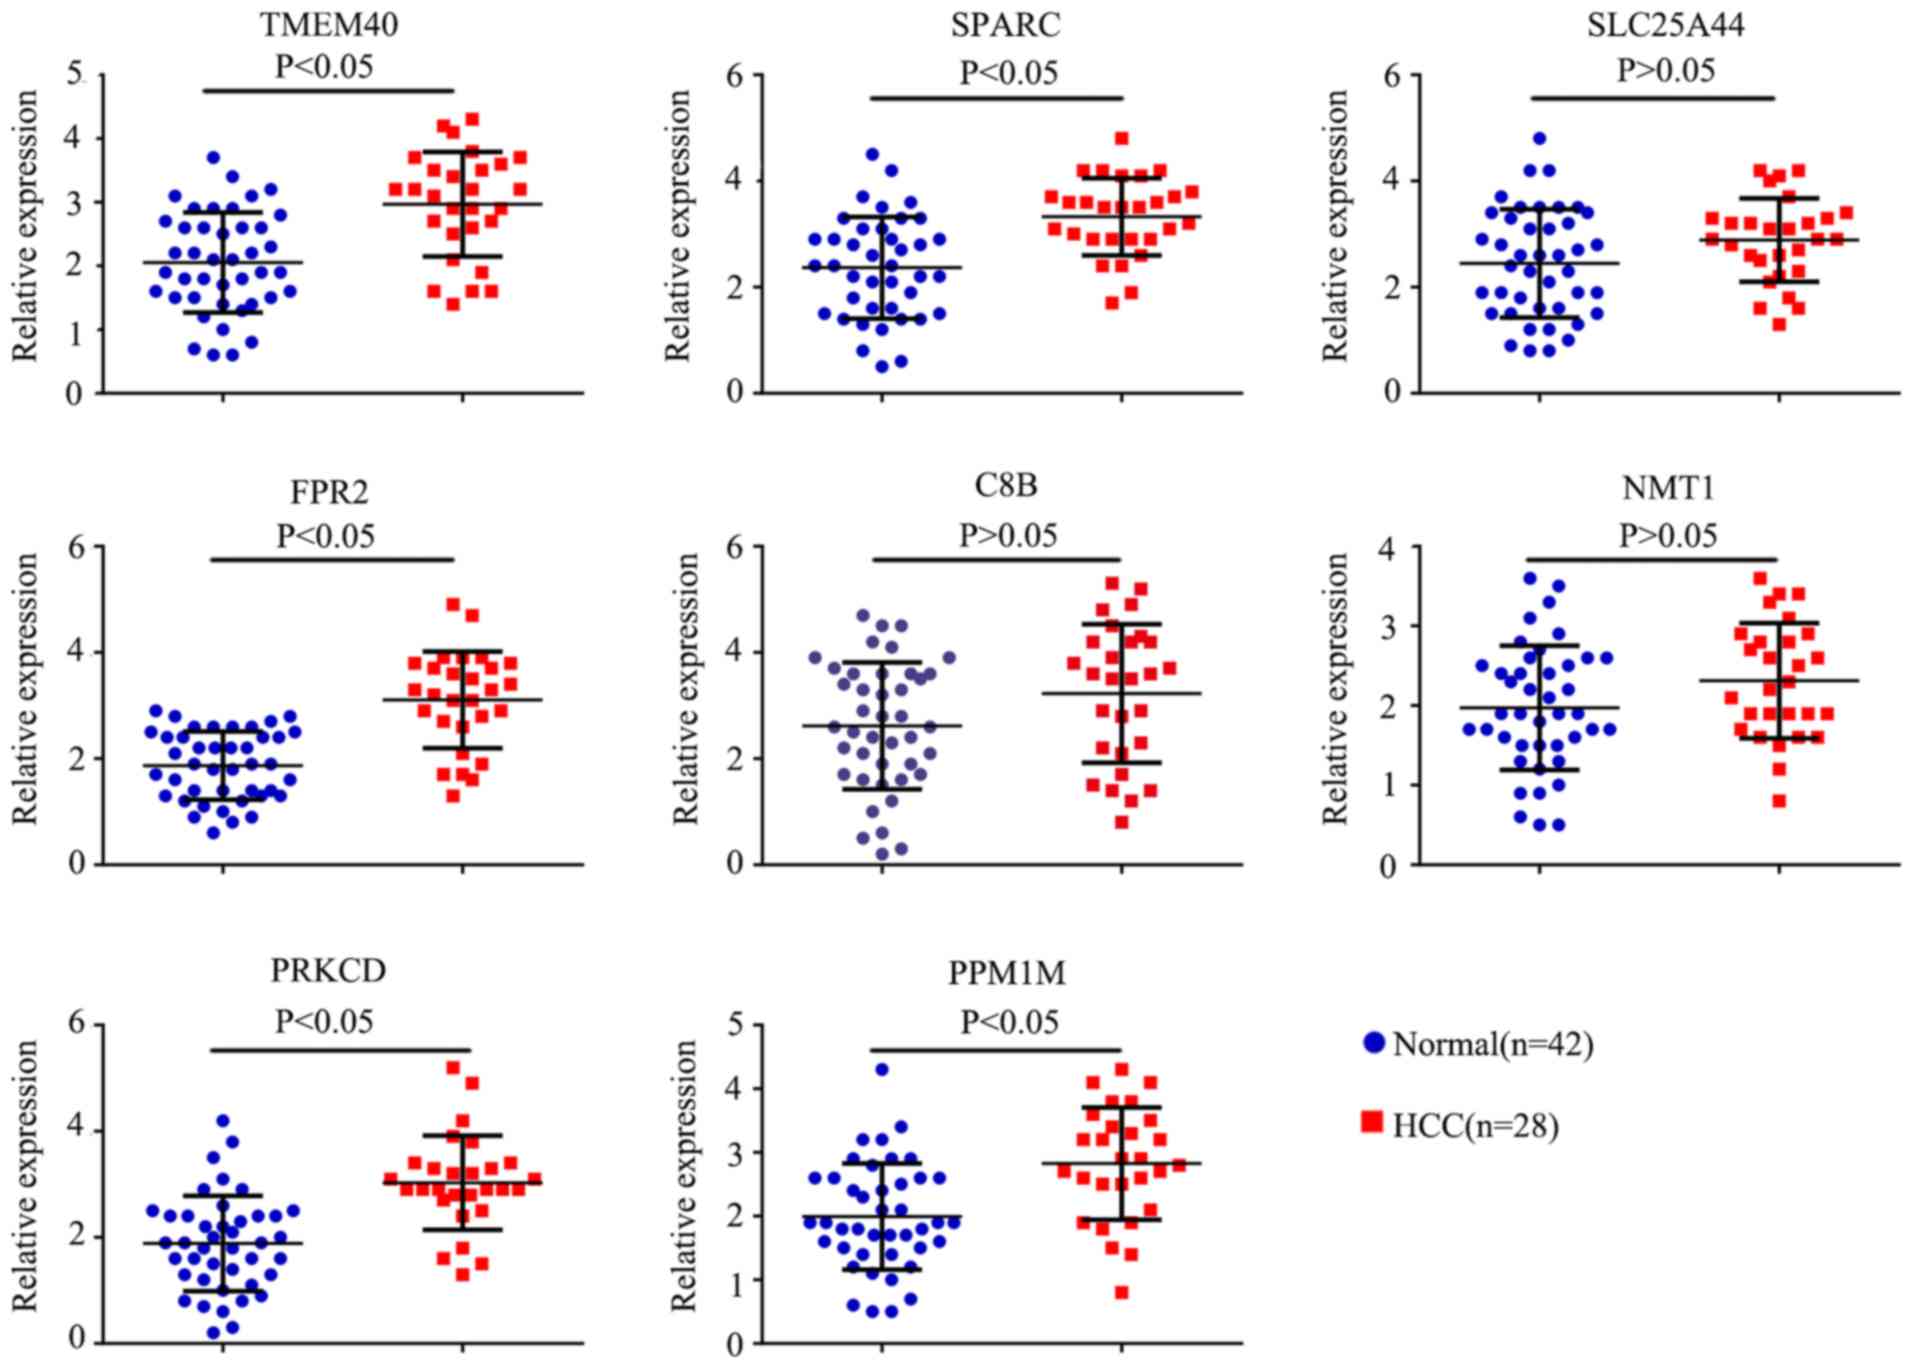 | Figure 8PCR was preformed to detect the
expression of 8 hub genes (SPARC, TMEM40, SLC25A44, FPR2, C8B,
NMT1, PRKCD and PPM1M). Blue dots represent the expression levels
of genes in normal patients (n=42), red dots represent the
expression levels of genes in patients with HCC (n=28). SPARC,
secreted protein acidic and cysteine rich; TMEM40, transmembrane
protein 40; SLC25A44, solute carrier family 25 member 44; C8B,
complement C8 β chain; NMT1, N-myristoyltransferase 1; PRKCD,
protein kinase C δ; PPM1M, protein phosphatase,
Mg2+/Mn2+ dependent 1M. |
 | Figure 9Receiver operator characteristic curve
of 8 hub genes (SPARC, TMEM40, SLC25A44, FPR2, C8B, NMT1, PRKCD and
PPM1M). The curves were calculated according to the results of the
PCR and the corresponding clinical state. SPARC, secreted protein
acidic and cysteine rich; TMEM40, transmembrane protein 40;
SLC25A44, solute carrier family 25 member 44; FPR2, formyl peptide
receptor 2; C8B, complement C8 β chain; NMT1,
N-myristoyltransferase 1; PRKCD, protein kinase C δ; PPM1M, protein
phosphatase, Mg2+/Mn2+ dependent 1M. |
Discussion
HCC is one of the most malignant tumors of the
digestive tract worldwide. Surgical excision is currently the main
treatment method for patients with HCC. Early effective diagnosis
for HCC is critical for the success of surgical excision and
improving patient survival rate. However, the commonly used
biomarkers, including AFP, have significant diagnostic limitations
and novel biomarkers identified from patient blood samples would be
valuable in screening for HCC. Furthermore, previous studies have
suggested that analyzing the genetic changes in PBMCs may be a
valid method for identifying novel biomarkers (7,8).
In the present study, 935 DEGs were identified in
the gene expression profiling analyses using the limma algorithms.
Furthermore, WGCNA was used to construct a free-scale gene
co-expression network to investigate the associations between
different sets of DEGs. To clarify the different clusters of WGCNA,
functional enrichment analysis, co-expression network and
associated experiments were performed. It was revealed that SPARC,
TMEM40, SLC25A44, FPR2, C8B, NMT1, PRKCD and PPM1M were hub genes
and five of them had good diagnostic value according to the results
from the two gene expression profiles and the additional samples,
including SPARC, TMEM40, FPR2, PRKCD and PPM1M.
SPARC encodes an extracellular protein that plays
key roles in various cancer cell processes, such as cell
proliferation, migration, matrix cell adhesion, angiogenesis and
tissue remodeling (17). A number of
studies have identified the impact of SPARC overexpression in
patients with certain types of tumor and indicated that high
expression levels of SPARC were associated with poor outcome, such
as in pancreatic cancer (18).
Furthermore, SPARC can activate the PI3K pathway and promote oral
squamous cell carcinoma proliferation and metastasis (19). TMEM40 encodes a 23 kDamulti-pass
membrane protein. A previous study revealed that TMEM40 is
localized at chromosome 3p25.2 and is believed to play a key role
in collagen-induced arthritis (20).
The expression levels of TMEM40 were significantly higher in
bladder cancer tissues and were associated with clinical grade
(21). FPR2 encodes a seven
transmembrane G protein-coupled receptor, which was first
identified in phagocytic leukocytes and plays an important role in
the host defense due to its effect on mediating leukocyte
chemotaxis upon activation by bacterial and host-derived agonists
(22). Recently, evidence has
suggested that FPR2 is associated with certain types of cancer and
that high mRNA levels of FPR2 are associated with poor prognosis in
these types of cancer (23,24). PRKCD is a member of the protein
kinase C family of serine- and threonine-specific protein kinases,
which is both a tumor suppressor and a positive regulator of cell
cycle progression. In breast cancer, PRKCD phosphorylated and
activated the transcription factor STAT3, leading to increased
expression levels of interleukin 6 and NANOG, two key mediators of
breast cancer stem cells (25).
However, in esophageal squamous cell carcinoma, increased PRKCD
enhances the stability of p21 and inhibits cell proliferation
(26). PPM1M is a phosphoprotein
phosphatase that is involved in RNA polymerization. The effect of
PPM1M on immunoreactions has been demonstrated to be associated
with Herpes Simplex virus-1 infection (27). However, the effect of PPM1M in cancer
progression remains unknown.
Overall, the present study identified that the
functions of the indicated hub genes primarily include cell
proliferation, metastasis, inflammation and immune response. These
results suggested that, when compared with healthy individuals, the
PBMCs of patients with HCC were more likely to be activated with
increased DNA, RNA synthesis, inflammatory factor secretion and
enzymatic activity. It was speculated that all these changes in the
PBMCs of patients with HCC may be caused by environmental stress
triggered by the local development of HCC, or the host's response
against the tumor. Identification of these hub genes and the
functional changes that they were involved in may contribute to the
diagnosis of HCC.
However, there were limitations to the present
study; the primary limitation was that these hub genes remain to be
verified by experiments. In addition, the diagnostic value
evaluation was performed using small sample sizes and therefore,
additional samples are required for further research. Furthermore,
the molecular mechanism of the change of key genes requires
investigation.
Acknowledgements
Not applicable.
Funding
The present study work was supported by Tackling Key
Problems in Science and Technology (grant no. 2007AA301B35-2), the
Natural Science Foundation of Hubei Province of China (grant no.
2010CDB06807), and the Important Project of Wuhan Administration of
Science &Technology (grant no. 2.008E+11).
Availability of data and materials
The datasets used and/or analyzed during the current
study are available from the corresponding author on reasonable
request.
Authors' contributions
ZY, ZZ and YS were responsible for data collection,
analysis and interpretation of the results. ZC wrote the
manuscript. All authors have read and approved the final version of
the article.
Ethics approval and consent to
participate
All patients who had samples taken had provided
informed consent. The present study was approved by the Ethics
Committee of the Renmin Hospital of Wuhan University and was
performed in accordance with the Declaration of Helsinki.
Patient consent for publication
Patients provided written consent for the
publication of the present study.
Competing interests
The authors declare that they have no competing
interests.
References
|
1
|
Raoul JL, Raimbourg J, Hiret S, Adhoute X
and Senellart H: Hepatocellular carcinoma: Increase in incidence or
future plague? Bull Cancer. 105:502–507. 2018.PubMed/NCBI View Article : Google Scholar : (In French).
|
|
2
|
Gupta M, Gabriel H and Miller FH: Role of
imaging in surveillance and diagnosis of hepatocellular carcinoma.
Gastroenterol Clin North Am. 47:585–602. 2018.PubMed/NCBI View Article : Google Scholar
|
|
3
|
Sparchez Z and Mocan T: Contemporary role
of liver biopsy in hepatocellular carcinoma. World J Hepatol.
10:452–461. 2018.PubMed/NCBI View Article : Google Scholar
|
|
4
|
Lok AS, Sterling RK, Everhart JE, Wright
EC, Hoefs JC, Di Bisceglie AM, Morgan TR, Kim HY, Lee WM, Bonkovsky
HL, et al: Des-gamma-carboxy prothrombin and alpha-fetoprotein as
biomarkers for the early detection of hepatocellular carcinoma.
Gastroenterology. 138:493–502. 2010.PubMed/NCBI View Article : Google Scholar
|
|
5
|
Marrero JA, Feng Z, Wang Y, Nguyen MH,
Befeler AS, Roberts LR, Reddy KR, Harnois D, Llovet JM, Normolle D,
et al: Alpha-fetoprotein, des-gamma carboxyprothrombin, and
lectin-bound alpha-fetoprotein in early hepatocellular carcinoma.
Gastroenterology. 137:110–118. 2009.PubMed/NCBI View Article : Google Scholar
|
|
6
|
Jiang JX, Yu C, Li ZP, Xiao J, Zhang H,
Chen MY and Sun CY: Insights into significant pathways and gene
interaction networks in peripheral blood mononuclear cells for
early diagnosis of hepatocellular carcinoma. J Cancer Res Ther.
12:981–989. 2016.PubMed/NCBI View Article : Google Scholar
|
|
7
|
Li H, Mao Y, Xiong Y, Zhao HH, Shen F, Gao
X, Yang P, Liu X and Fu D: A comprehensive proteome analysis of
peripheral blood mononuclear cells (PBMCs) to identify candidate
biomarkers of pancreatic cancer. Cancer Genomics Proteomics.
16:81–89. 2019.PubMed/NCBI View Article : Google Scholar
|
|
8
|
Papageorgiou SG, Kontos CK, Diamantopoulos
MA, Bouchla A, Glezou E, Bazani E, Pappa V and Scorilas A:
MicroRNA-155-5p overexpression in peripheral blood mononuclear
cells of chronic lymphocytic leukemia patients is a novel,
independent molecular biomarker of poor prognosis. Dis Markers.
2017(2046545)2017.PubMed/NCBI View Article : Google Scholar
|
|
9
|
Ciarloni L, Ehrensberger SH, Imaizumi N,
Monnier-Benoit S, Nichita C, Myung SJ, Kim JS, Song SY, Kim TI, van
der Weg B, et al: Development and clinical validation of a blood
test based on 29-gene expression for early detection of colorectal
cancer. Clin Cancer Res. 22:4604–4611. 2016.PubMed/NCBI View Article : Google Scholar
|
|
10
|
Baine MJ, Chakraborty S, Smith LM, Mallya
K, Sasson AR, Brand RE and Batra SK: Transcriptional profiling of
peripheral blood mononuclear cells in pancreatic cancer patients
identifies novel genes with potential diagnostic utility. PLoS One.
6(e17014)2011.PubMed/NCBI View Article : Google Scholar
|
|
11
|
Baine MJ, Menning M, Smith LM, Mallya K,
Kaur S, Rachagani S, Chakraborty S, Sasson AR, Brand RE and Batra
SK: Differential gene expression analysis of peripheral blood
mononuclear cells reveals novel test for early detection of
pancreatic cancer. Cancer Biomark. 11:1–14. 2011-2012.
|
|
12
|
Mishra S, Srivastava AK, Suman S, Kumar V
and Shukla Y: Circulating miRNAs revealed as surrogate molecular
signatures for the early detection of breast cancer. Cancer Lett.
369:67–75. 2015.PubMed/NCBI View Article : Google Scholar
|
|
13
|
Leek JT: Svaseq: Removing batch effects
and other unwanted noise from sequencing data. Nucleic Acids Res
42: 2014.
|
|
14
|
R Core Team. R: A language and environment
for statistical computing. R Foundation for Statistical Computing,
Vienna, Austria. 2013; ISBN 3-900051-07-0.
|
|
15
|
Zhao W, Langfelder P, Fuller T, Dong J, Li
A and Hovarth S: Weighted gene coexpression network analysis: State
of the art. J Biopharm Stat. 20:281–300. 2010.PubMed/NCBI View Article : Google Scholar
|
|
16
|
Livak KJ and Schmittgen TD: Analysis of
relative gene expression data using real-time quantitative PCR and
the 2(-Delta Delta C(T)) method. Methods. 25:402–408.
2001.PubMed/NCBI View Article : Google Scholar
|
|
17
|
Vaz J, Ansari D, Sasor A and Andersson R:
SPARC: A potential prognostic and therapeutic target in pancreatic
cancer. Pancreas. 44:1024–1035. 2015.PubMed/NCBI View Article : Google Scholar
|
|
18
|
Arqueros C, Salazar J, Arranz MJ, Sebio A,
Mora J, Sullivan I, Tobeña M, Martín-Richard M, Barnadas A, Baiget
M and Páez D: SPARC gene variants predict clinical outcome in
locally advanced and metastatic pancreatic cancer patients. Med
Oncol. 34(136)2017.PubMed/NCBI View Article : Google Scholar
|
|
19
|
Jing Y, Jin Y, Wang Y, Chen S, Zhang X,
Song Y, Wang Z, Pu Y, Ni Y and Hu Q: SPARC promotes the
proliferation and metastasis of oral squamous cell carcinoma by
PI3K/AKT/PDGFB/PDGFRβ axis. J Cell Physiol 2019 (Epub ahead of
print).
|
|
20
|
Zhang Q, Huang D, Zhang Z, Feng Y, Fu M,
Wei M, Zhou J, Huang Y, Liu S and Shi R: High expression of TMEM40
contributes to progressive features of tongue squamous cell
carcinoma. Oncol Rep. 41:154–164. 2019.PubMed/NCBI View Article : Google Scholar
|
|
21
|
Zhang ZF, Zhang HR, Zhang QY, Lai SY, Feng
YZ, Zhou Y, Zheng SR, Shi R and Zhou JY: High expression of TMEM40
is associated with the malignant behavior and tumorigenesis in
bladder cancer. J Transl Med. 16(9)2018.PubMed/NCBI View Article : Google Scholar
|
|
22
|
Alessi MC, Cenac N, Si-Tahar M and Riteau
B: FPR2: A novel promising target for the treatment of influenza.
Front Microbiol. 8(1719)2017.PubMed/NCBI View Article : Google Scholar
|
|
23
|
Hou XL, Ji CD, Tang J, Wang YX, Xiang DF,
Li HQ, Liu WW, Wang JX, Yan HZ, Wang Y, et al: FPR2 promotes
invasion and metastasis of gastric cancer cells and predicts the
prognosis of patients. Sci Rep. 7(3153)2017.PubMed/NCBI View Article : Google Scholar
|
|
24
|
Xiang Y, Yao X, Chen K, Wang X, Zhou J,
Gong W, Yoshimura T, Huang J, Wang R, Wu Y, et al: The G-protein
coupled chemoattractant receptor FPR2 promotes malignant phenotype
of human colon cancer cells. Am J Cancer Res. 6:2599–2610.
2016.PubMed/NCBI
|
|
25
|
Lan J, Lu H, Samanta D, Salman S, Lu Y and
Semenza GL: Hypoxia-inducible factor 1-dependent expression of
adenosine receptor 2B promotes breast cancer stem cell enrichment.
Proc Natl Acad Sci U S A. 115:E9640–E9648. 2018.PubMed/NCBI View Article : Google Scholar
|
|
26
|
Wen J, Hu Y, Liu Q, Ling Y, Zhang S, Luo
K, Xie X, Fu J and Yang H: miR-424 coordinates multilayered
regulation of cell cycle progression to promote esophageal squamous
cell carcinoma cell proliferation. EBioMedicine. 37:110–124.
2018.PubMed/NCBI View Article : Google Scholar
|
|
27
|
Yue L, Guo S, Zhang Y, Liu L, Wang Q, Wang
X, Shen D, Wang L, Sun L, Wang J, et al: The modulation of
phosphatase expression impacts the proliferation efficiency of
HSV-1 in infected astrocytes. PLoS One. 8(e79648)2013.PubMed/NCBI View Article : Google Scholar
|