Introduction
A cholestatic liver disease (CLD) arises during bile
formation and/or flow dysfunction due to genetic, immune,
environmental or other factors, developing into severe
hepatobiliary diseases and systemic sequelae (1). When cholestasis occurs, the level of
bile acids in liver and serum rises sharply and ends up with acute
hepatotoxicity, bile duct proliferation and even hepatic fibrosis
(2,3). Therefore, it is urgent to explore the
mechanism by which cholestatic hepatitis develops, and find new
targets (4,5).
Inflammatory responses are often found in the
process of fibrosis (6) as an
increase in the levels of inflammatory cytokines and a decrease in
anti-inflammatory cytokines (7,8).
Macrophages are multifunctional immune cells in the innate immune
system, which remove apoptotic cells by phagocytose, present
antigens, and produce pro-inflammatory cytokines and chemokines,
such as interleukin-1β (IL-1β), IL-6, and tumor necrosis factor-α
(TNF-α) (9,10). When an organ is infected or
overwhelmed with inflammation, macrophages first differentiate into
M1 to release pro-inflammatory cytokines against the stimulus,
including TNF-α, interleukin-1β (IL-1β), IL-12 and IL-23(11). In order to offset this, M2
macrophages secrete a large number of such anti-inflammatory
cytokines as IL-10 and transforming growth factor-β1 (TGF-β1),
while contributing to angiogenesis, tissue repair and remodeling
(12,13). It means that M2 macrophages suppress
inflammation, promote tissue remodeling, and bring a return to
tissue homeostasis, following the initial M1-macrophage-induced
response (14,15). M1/M2 macrophages are in dynamic
equilibrium under normal circumstances, but when macrophage
polarization is biased towards M1, the homeostasis evolves to an
inflammatory response to damage peripheral tissue and activate
immune system, which may be one of the major factors behind
autoimmune liver diseases.
TGF-β1 is the most involved molecule (16) and may be produced by multiple cell
types. Focus has been mainly on its biological functions in
embryonic development and tissue repair and recently on its key
regulation of the immune cell functions (17,18).
TGF-β1 has 99% (19) homology
between human and mice, and was given the only priority in the
study to explore its effect on macrophage immune responses. By
regulating the chemotaxis, activation and transformation of immune
cell varieties, TGF-β1 controls the process of inflammatory
response in the body (20). TGF-β1
is associated with polydysplasia and various human diseases,
including cancer, fibrosis and autoimmune diseases (21,22). The
severity of PBC may be indicated by TGF-β1, a marker of fibrosis
(23,24). Tang et al (25) found that TGF-β1 played a dual role in
PBC progression, inhibitiing inflammatory response while enhancing
fibrogenesis.
By animal trial and cell trial, this study explored
whether TGF-β1 can affect the progression of cholestatic cirrhosis
in mice by suppressing the immune response of Kupffer cells (KCs).
It might bring clinical treatment of cholestatic cirrhosis into a
new direction.
Materials and methods
Laboratory animals and main
reagents
Six-week-old male BALB/c mice were purchased from
Changzhou Cavens Lab Animal Co., Ltd. with an animal license number
of SCXK (Su) 2016-0010. TGF-β1 (ab50036), NF-κB (ab131546; 1:1,000
dilution), IL-6 (ab7737; 1:20 dilution), IL-1β (ab9722; 0.2 µg/ml),
TNF-α (ab6671; 1:1,000 dilution), inducible nitric oxide synthase
(iNOS) (ab15323; 1:200 dilution), Arg-1 antibody (ab91279; 1
µg/ml), goat anti-rabbit IgG secondary antibody (ab6721; 1:10,000
dilution), glyceraldehyde 3-phosphate dehydrogenase (GAPDH)
antibody (ab181602; 1:300 dilution), CD40 antibody (ab22469; 10
µl/106 cells), CD80 antibody (ab106162; 10
µl/106 cells) and CD206 antibody (ab64693; 10
µl/106 cells) were supplied by Abcam; CD204 antibody
(50129-R004-F; 10 µl/106 cells) by Sino Biological Inc.
Fetal bovine serum, DMEM and ECL were supplied by Gibco; Thermo
Fisher Scientific, Inc. RIPA lysis buffer and BCA protein assay kit
were supplied by Yubo Biology Co., Ltd. RNA extraction kit, reverse
transcription kit and polymerase chain reaction (PCR) reagent were
supplied by Baiaolaibo. Synthesized PCR primer was supplied by BGI.
Galunisertib and LPS were supplied by Selleck. IV collagenase
(17104019) was from Gibco; Thermo Fisher Scientific, Inc. Type III
procollagen N-terminal peptide (PIIINP) (SXM074), type IV collagen
(IVC) (SXM075), laminin (LN) (SXM077), hyaluronidase (HA) (SXM078)
kits were from Shanghai Runwell technology Co., Ltd.
The study was approved by the Ethics Committee of
The Affiliated Changzhou No. 2 People’s Hospital of Nanjing Medical
University (Changzhou, China).
Establishment and grouping of animal
models
As previously described (2), 40, 6-week-old BALB/c mice were included
in the trial to randomly receive a sham operation (Mock group,
n=10), bile duct ligation (BDL group, n=15) or BDL and TGF
treatment (TGF group, n=15). Mice were raised in SPF laboratory
animal room and given the same animal feed and drinking water. The
animal room was provided with natural light and was well
ventilated, with the temperature of 20-25˚C. The experiment began
after adaptive feeding for one week. After fasting for 8 h, mice
were anesthetized via intraperitoneal injection of 0.3%
pentobarbital sodium at the dose of 45 mg/kg and then dissected to
separate the common bile duct. The common bile duct was ligated in
the BDL group and TGF group, whereas, it was isolated rather than
ligated before the closure of the abdominal cavity in the Mock
group. The entire trial was carried out under aseptic conditions.
TGF group was injected subcutaneously with 1 µg TGF-β1 at multiple
sites on days 0, 2, 4, 6 and 8, respectively. They were maintained
in the specific-pathogen-free (SPF) laboratory for 11 days and
sacrificed by breaking the neck to draw blood samples through
portal veins. Liver tissue obtained was stored in liquid nitrogen.
During the experiment, no mice died due to adverse events or poor
postoperative recovery.
Total protein extraction
To extract total protein from liver tissue: 100 mg
of liver tissue was separated from mice, sliced as much as possible
with sterilized scissors and put into 1.5-ml EP tube. The tube was
added with 0.5 ml RIPA lysis buffer on ice to homogenize with an
ultrasonic homogenizer and placed on ice again for 30 min.
Subsequently, the liver tissue was centrifuged at 4˚C and 13,780 x
g for 5 min to extract the supernatant, then the supernatant was
separated in 0.2 ml centrifuge tubes and stored at -20˚C.
To extract total protein from KCs: KCs were isolated
from mouse livers according to previous research (26) and collected in a dish which was then
added with lysis buffer at the bottom. Left standing for 5 min,
cell lysate was scraped into 1.5 ml EP tubes, and centrifuged at
4˚C and 13,780 x g for 20 min after being placed on ice for 30 min,
to extract the supernatant as the total protein. Then the extract
was subpackaged in 0.2 ml centrifuge tubes and stored at -20˚C for
subsequent steps.
KCs isolation and culture
With the reported method (27), KCs in the liver of mice in Mock
group, BDL group and TGF group were isolated. In addition, 20
6-week-old BALB/c mice without any experiment were raised in SPF
laboratory animal room and given the same animal feed and drinking
water. The animal room was provided with natural light and was well
ventilated, with the temperature of 20-25˚C. Subsequently, the mice
were sacrificed by neck-breaking to isolate KCs. The specific
method was: the blood in the liver was removed by portal vein
perfusion with 10 ml of calcium-free Hank balanced salt solution.
The liver tissue was minced and incubated in a container containing
50 units of type IV collagenase for 30 min at 37˚C. The liver
homogenate filtrate was then subjected to discrete gradient
centrifugation to isolate non-parenchymal cells. The obtained cells
were further incubated at 37˚C with 5% CO2 for 2 h to
obtain KCs after removing non-adherent cells. KCs were collected
from mice in the two experiments for later use. The final density
of the collected KCs was 1x10⁶/well. Cells isolated from
the liver of 6-week-old BALB/c mice without any experiments were
divided into control group, LPS group, TGF group and Galunisertib
group. LPS group was treated with 100 ng/ml LPS for 12 h; TGF group
was pretreated with 10 ng/ml TGF for 3 h, then stimulated with 100
ng/ml LPS, and cultured for 12 h; Galunisertib group was pretreated
with 10 µM Galunisertib and 10 ng/ml TGF for 3 h, and then cultured
with 100 ng/ml LPS for 12 h.
RNA extraction
The cells were washed twice with phosphate-buffered
saline (PBS). After the addition of 1 ml of TRIzol, the cells were
put an ice until there was no significant precipitation in the
lysate; then transfer to a clean 1.5 ml EP tube and left to stand
at room temperature for 5 min.
Chloroform (200 µl) was added, the centrifuge tube
was covered, shaken at room temperature for 15 sec, and then the
solution was fully emulsified. After standing at room temperature
for 5 min, centrifugation at 13,780 x g for 15 min at 4˚C, and the
supernatant was transferred to a new EP tube.
Isopropanol (0.5 ml) was added and allowed to stand
at 4˚C for 20 min to precipitate RNA, followed by centrifugation at
13,780 x g for 15 min at 4˚C. The supernatant was removed and
transferred to a new EP tube, washed with 1 ml of 75% ethanol.
After the mixing, the mixture was centrifuged at 13,780 x g at 4˚C
for 20 min, and the supernatant was discarded.
The precipitate was dried at room temperature for
2-5 min, and an appropriate amount of DEPC water was added to
dissolve the RNA precipitate.
The nucleic acid quantifier NanoDrop2000 was used to
test the ratio of A260/A230 and A260/A280 to detect the extraction
effect of fecal DNA.
Real-time PCR detection
Real-time PCR is a technique to detect the mRNA
level of inflammatory cytokines. The sequences of the primers are
shown in Table I.
 | Table IThe sequences of the primers. |
Table I
The sequences of the primers.
| Genes | Forward
primers | Reverse
primers |
|---|
| TNF-α |
5'-CATACCAGGAGAAAGTCAGC-3 |
5'-CTAAGTACTTGGGCAGGTTG-3' |
| IL-6 |
5'-GTTCTCTGGGAAATCGTGGA-3' |
5'-TGTACTCCAGGTAGCTA-3' |
| IL-1β |
5'-CCAGGATGAGGACATGAGCA-3' |
5'-CGGAGCCTGTAGTGCAGTTG-3' |
| GAPDH |
5'-TCAACGGGGGACATAAAAGT-3' |
5'-TGCATTGTTTTACCAGTGTCAA-3' |
PCR reaction system is shown in Table II. The detailed reaction steps are
as follows: Predenaturation at 98˚C for 30 sec. After
predenaturation, 35 cycles of routine PCR amplification were
performed, including denaturation at 98˚C for 10 sec, annealing at
54˚C for 30 sec, extension at 72˚C for 45 sec and finally extended
at 72˚C for 10 min.
| Table IIPCR reaction system. |
Table II
PCR reaction system.
| PCR reaction
element | PCR reaction
volume |
|---|
| Phusion®
Hot Start Flex 2X | 12.5 µl |
| Master Mixart
version |
| Forward primer (1
µM) | 2.5 µl |
| Reverse primer (1
µM) | 2.5 µl |
| Template DNA | 50 ng |
In the experiment, three multiple wells were made
for each sample, and the starting copy number of the target gene in
the sample was calculated by comparing the measured Ct value with
the standard curve.
Western blot analysis
The protein concentration of liver extract and KCs
extract was quantified by BCA Protein Assay. Then transfered onto
PVDF membrane at 100 V after SDS-PAGE, and blocked with 5% skim
milk at room temperature for 1 h. The liver extract was incubated
overnight at 4˚C with NF-κB (diluted at 1:1,000), IL-6 (diluted at
1:20), IL-1β (0.2 µg/ml) and TNF-α (diluted at 1:1,000) primary
antibodies, which was roughly the same procedure as that for the KC
extract with the exception that the additives were iNOS (diluted at
1:200) and Arg-1 (1 µg/ml) primary antibodies. In addition, the KC
extract was subsequently incubated overnight with GAPDH (diluted at
1:300) primary antibody at 4˚C, and with secondary antibody
(diluted at 1:10,000) for 1 h at room temperature. After exposure,
the film was scanned and the molecular weight and optical density
of the target band were analyzed by ImageJ processing system.
Flow cytometry
Flow cytometry was adopted to determine the
percentages of CD40, CD80, CD204 and CD206 as macrophage surface
antigens. First, the four KC groups were cultured for 12 h and
washed with PBS once to collect 1x10⁶ adherent cells
into flow cytometry tubes. Next, the collected cells were rinsed
with 1-ml PBS twice and re-suspended with 200-µl PBS. Then KCs were
incubated with FITC-labeled CD40 antibody, CD80 antibody, CD204
antibody and CD206 antibody at 4˚C for 30 min. After washed 3 times
with 1-ml PBS, the cells were centrifuged at 1,038 x g at 4˚C for 5
min, washed, and re-suspended with 200-µl PBS to detect CD40, CD80,
CD204 and CD206 with BD FACSARIA II Flow Cytometer of
Becton-Dickinson and Company (BD). The detection results were
analyzed with Flowjo in percentage.
Liver function test
The levels of alanine aminotransferase (ALT),
aspartate aminotransferase (AST) and γ-glutamyltranspeptidase
(γ-GT) in mice were measured as indicators to evaluate liver
function. Four indicators of liver fibrosis in serum were tested to
assess the degree of fibrosis in the liver, including concentration
of PIIINP, IVC, LN and HA.
Statistical analysis
SPSS V.24.0.0 was used for statistical analysis. All
the data followed a normal distribution. One-way ANOVA was used for
comparison of multiple groups. The Bonferroni test was preferred
for pairwise comparison, whereas the t-test for comparison of means
of two independent groups. The difference obtained was
statistically significant at P<0.05.
Results
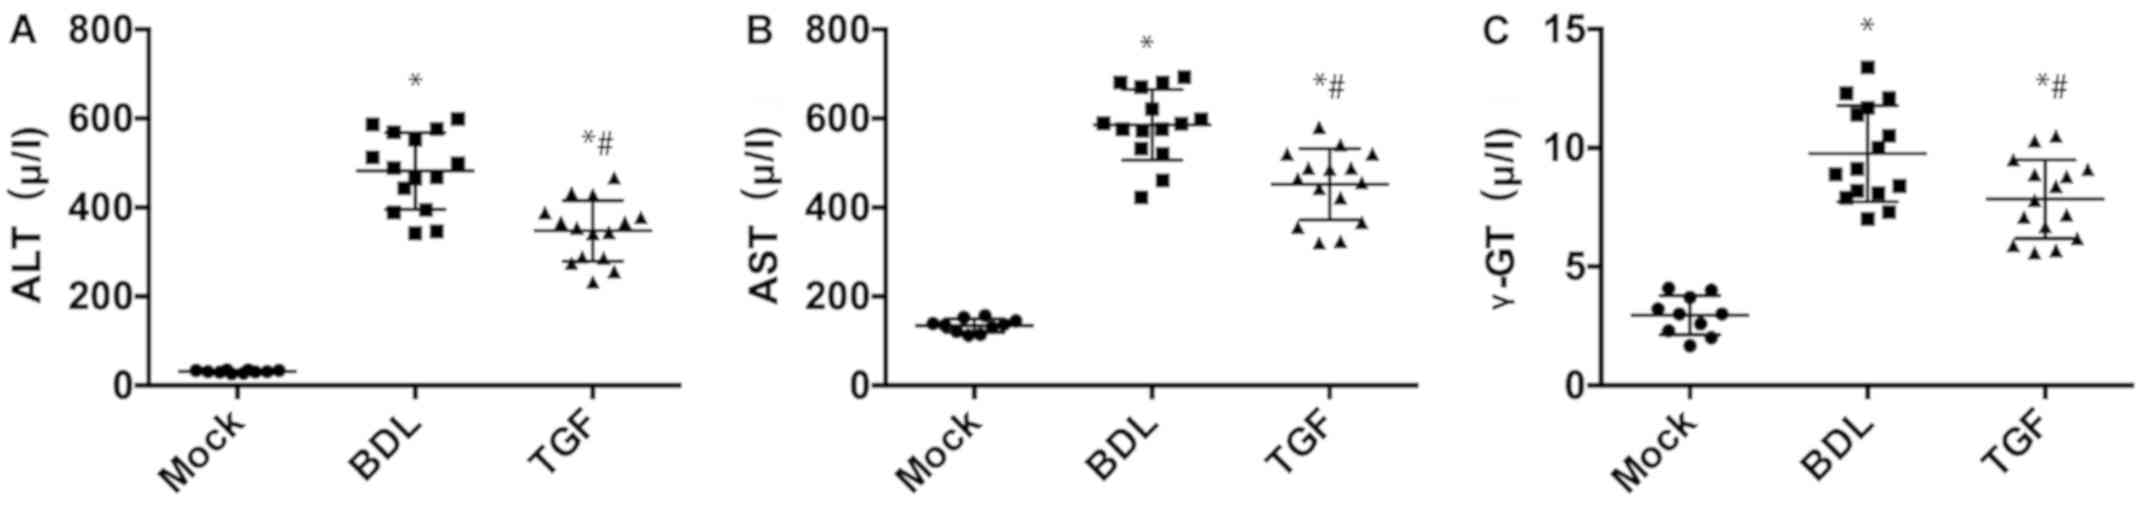
TGF-β1 improves liver function in
cholestatic mice
Compared with Mock group, mice in the BDL group had
significant increase in ALT and AST (P<0.05) but there was
significant decrease in ALT and AST in the TGF group (P<0.05)
(Fig. 1), which indicated that BDL
caused severe hepatocyte injury while TGF could mitigate the
injury. Besides, γ-GT was significantly higher in BDL group than
that in Mock group and TGF group (Fig.
1), suggesting that BDL was accompanied by cholestasis, whereas
TGF relieved this lesion. In addition, the results of liver
fibrosis, PIIINP, IVC, LN and HA in mouse serum are shown in
Table I. Compared with the Mock
group, the degree of liver fibrosis of the BDL group and the TGF
group was significantly increased, and the degree of the BDL group
was significantly higher than that in the TGF group (Table III). Thus it was considered that
TGF ameliorated noticeably hepatocyte injury, cholestasis and
degree of liver fibrosis in mice.
| Table IIIPercentages of surface antigens in
KCs in each group. |
Table III
Percentages of surface antigens in
KCs in each group.
| Molecule | Control group
(%) | LPS group (%) | TGF group (%) |
|---|
| CD40 | 33.29±4.852 |
73.86±6.674a |
51.67±5.845b |
| CD86 | 19.43±3.586 |
85.84±4.684a |
53.66±5.075b |
| CD204 | 13.60±2.821 |
29.25±4.375a |
47.23±7.826b |
| CD206 | 12.21±2.557 |
28.20±4.889a |
53.27±7.109b |
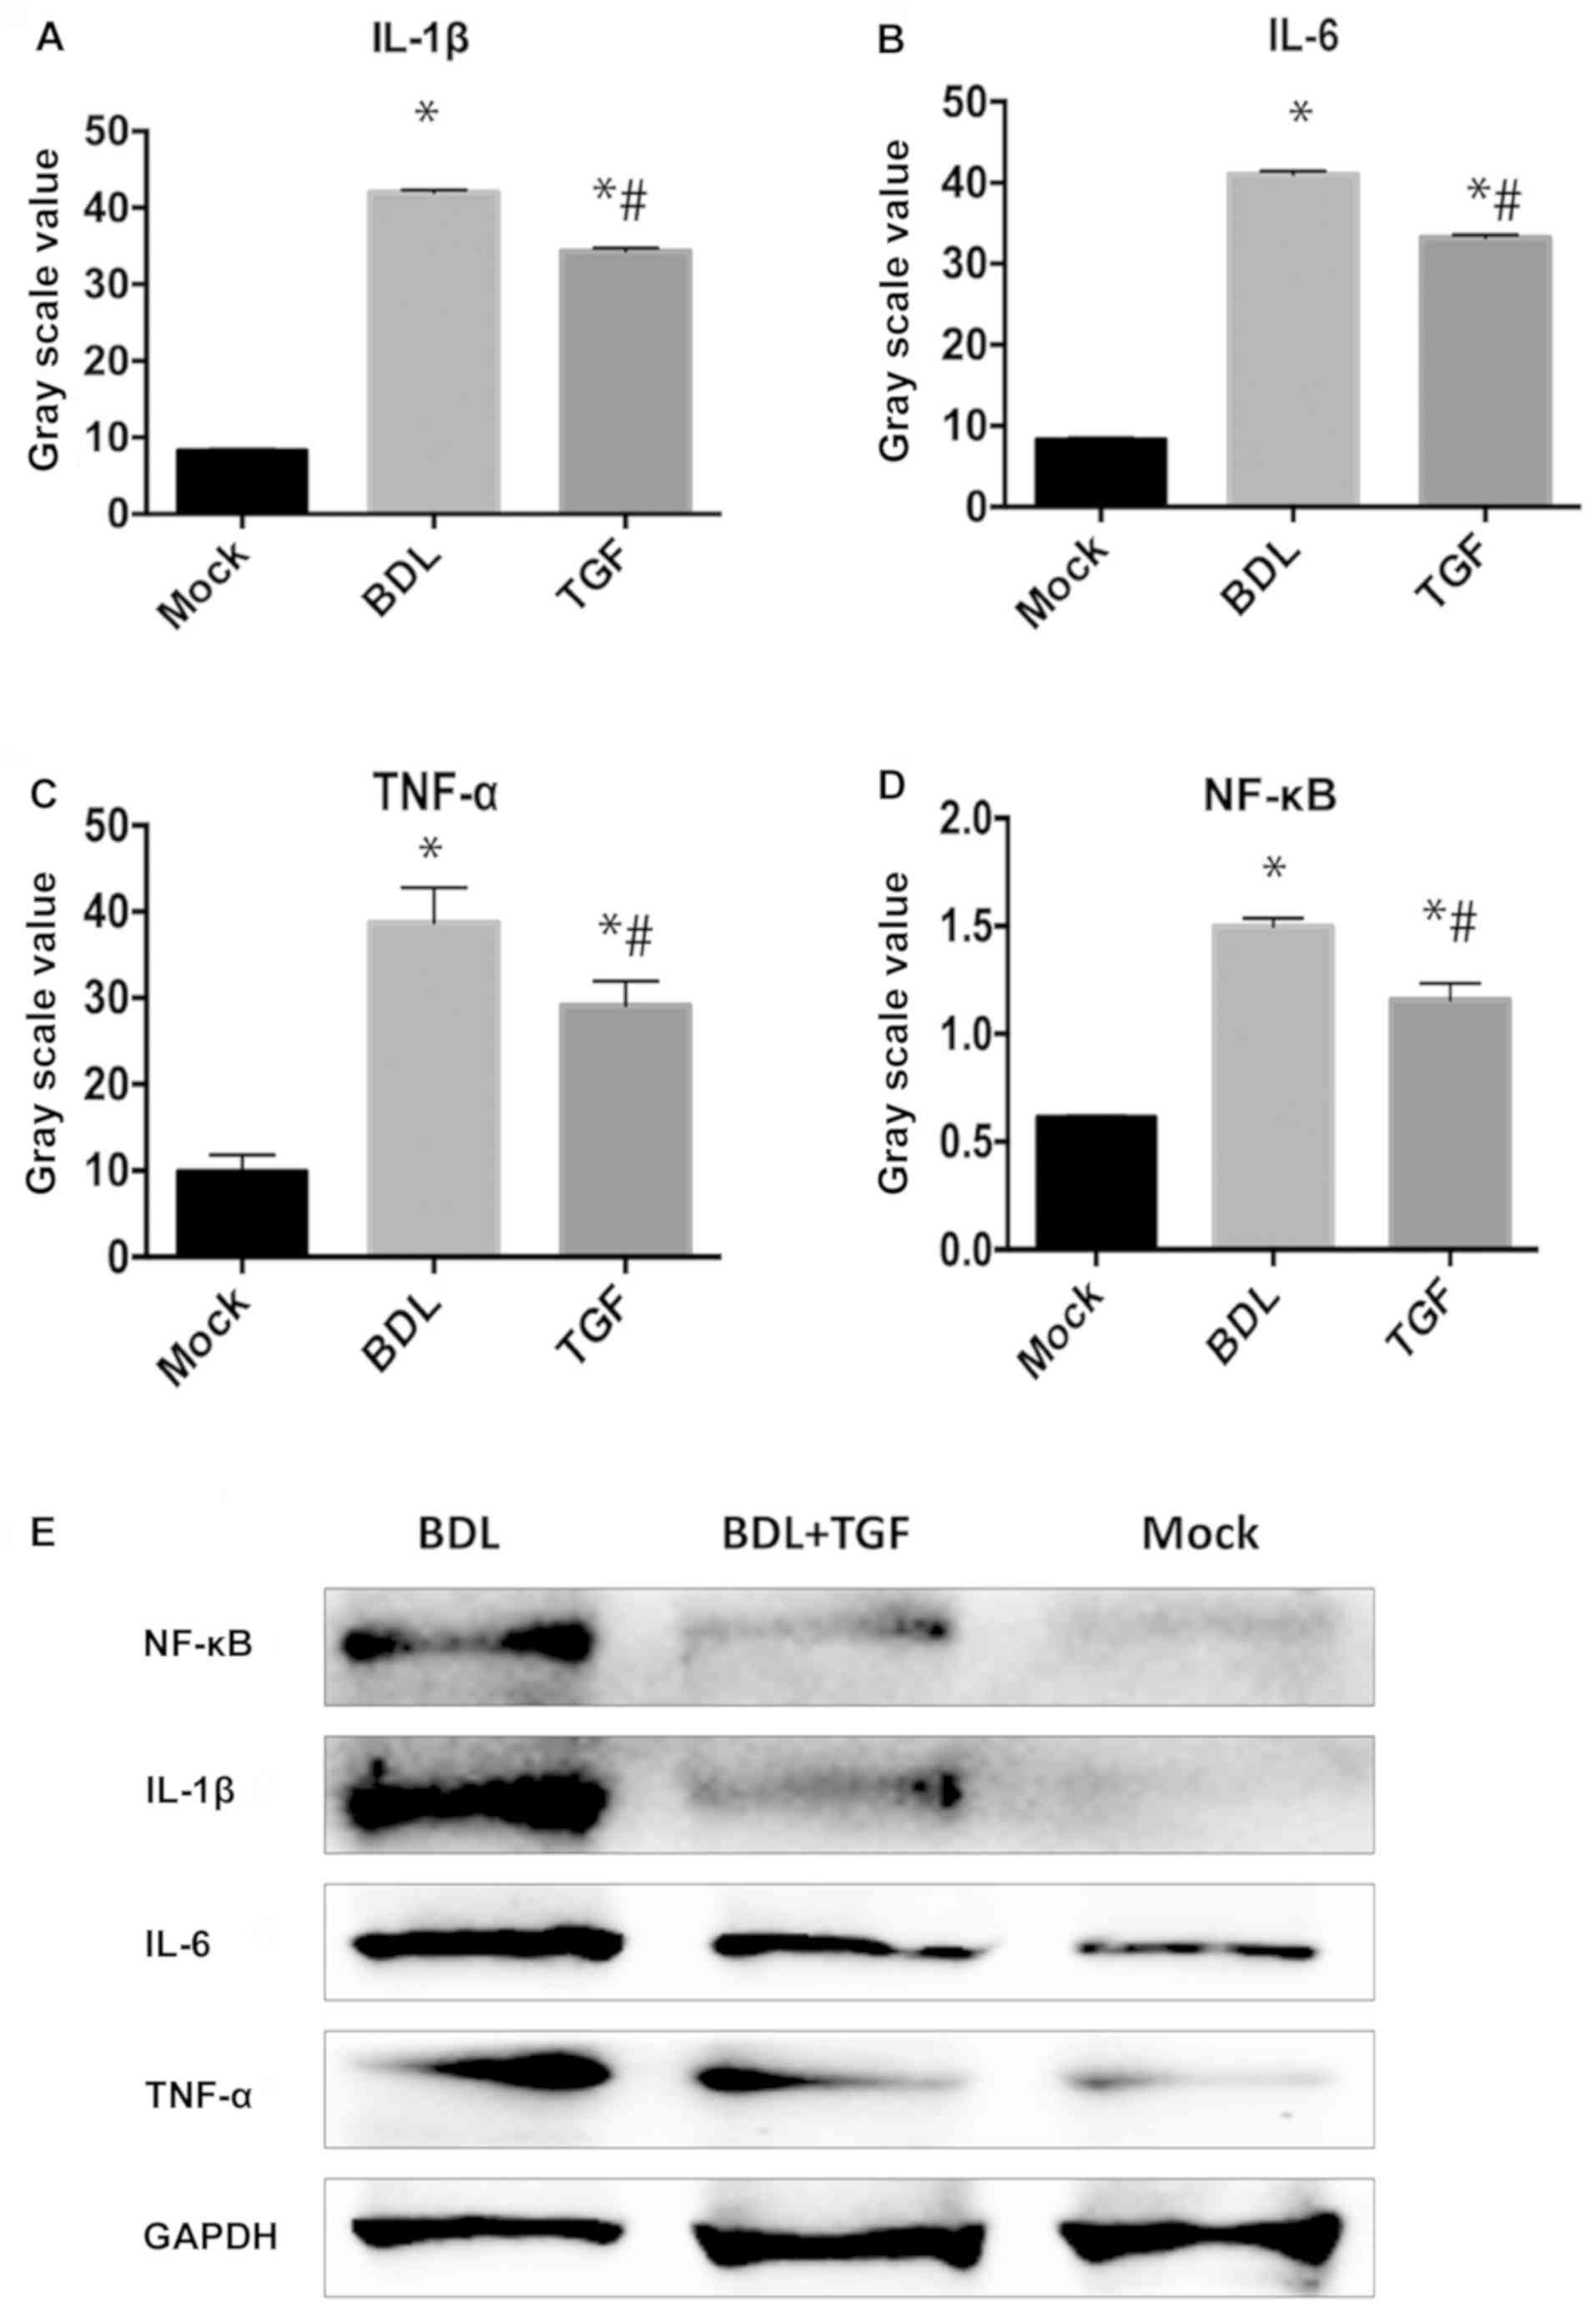
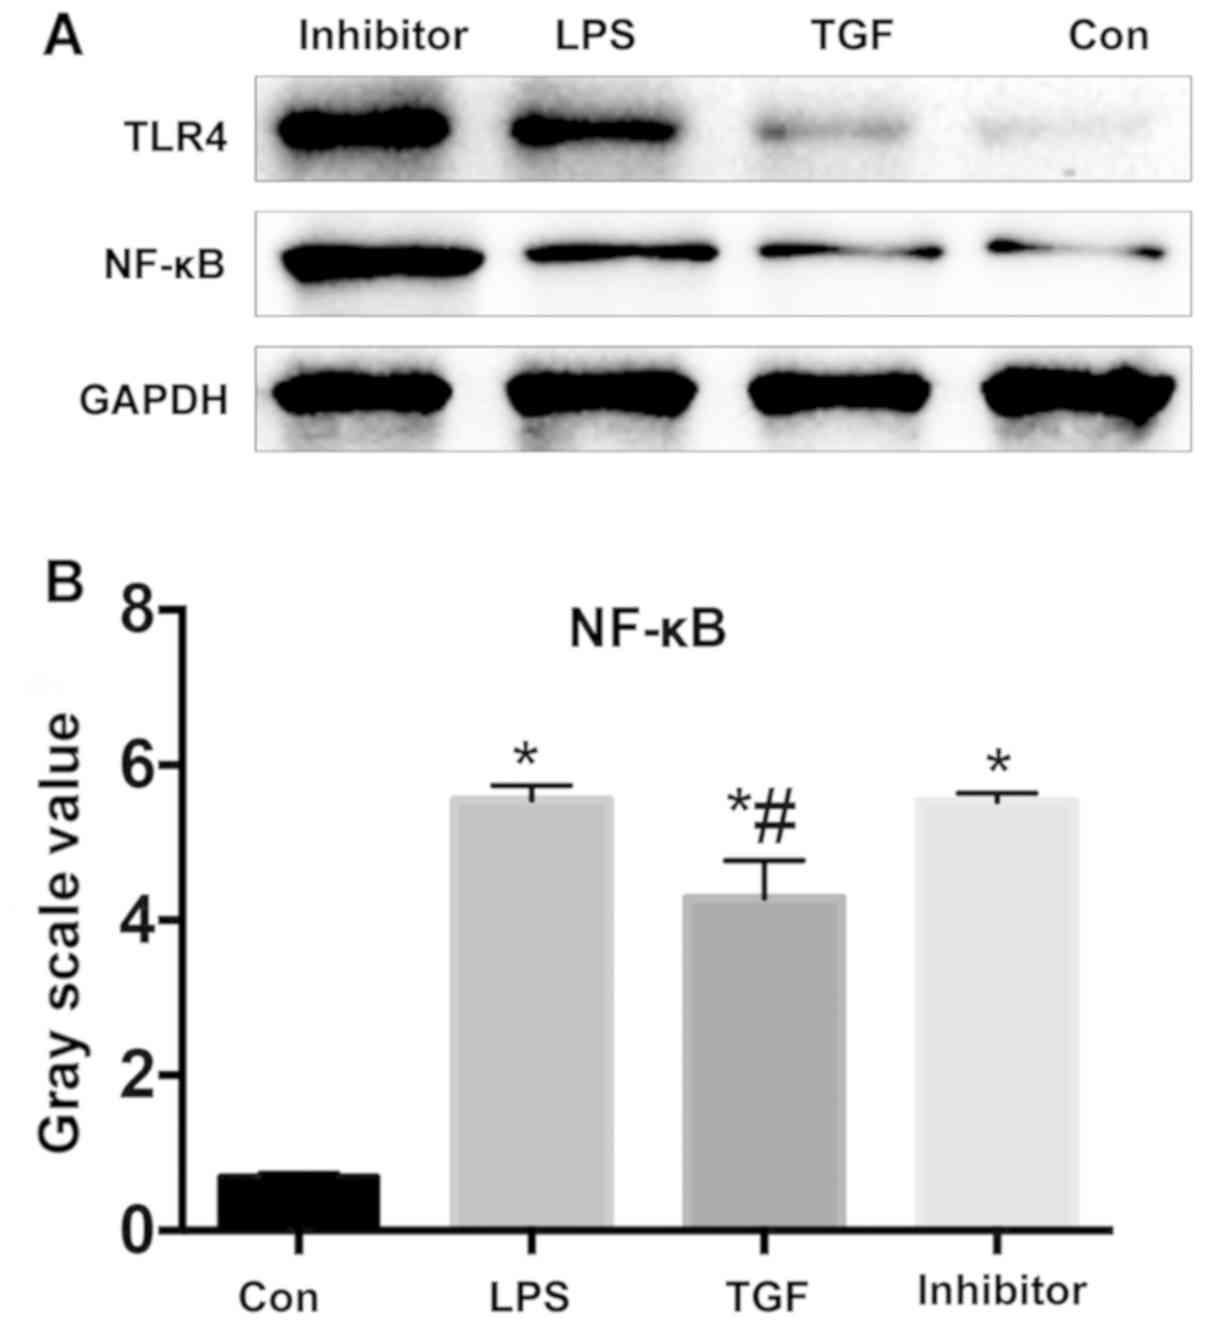
TGF-β1 decreases expression of
inflammatory cytokines in cholestatic mice
As shown in Fig. 2,
the levels of inflammatory cytokines, IL-1β, IL-6 and TNF-α, in BDL
group were significantly increased in comparison to Mock group
(P<0.05) and TGF group (P<0.05). The outcomes also included
NF-κB in hepatocytes, which were expressed significantly higher in
BDL group than that in Mock group and TGF group (P<0.05). In
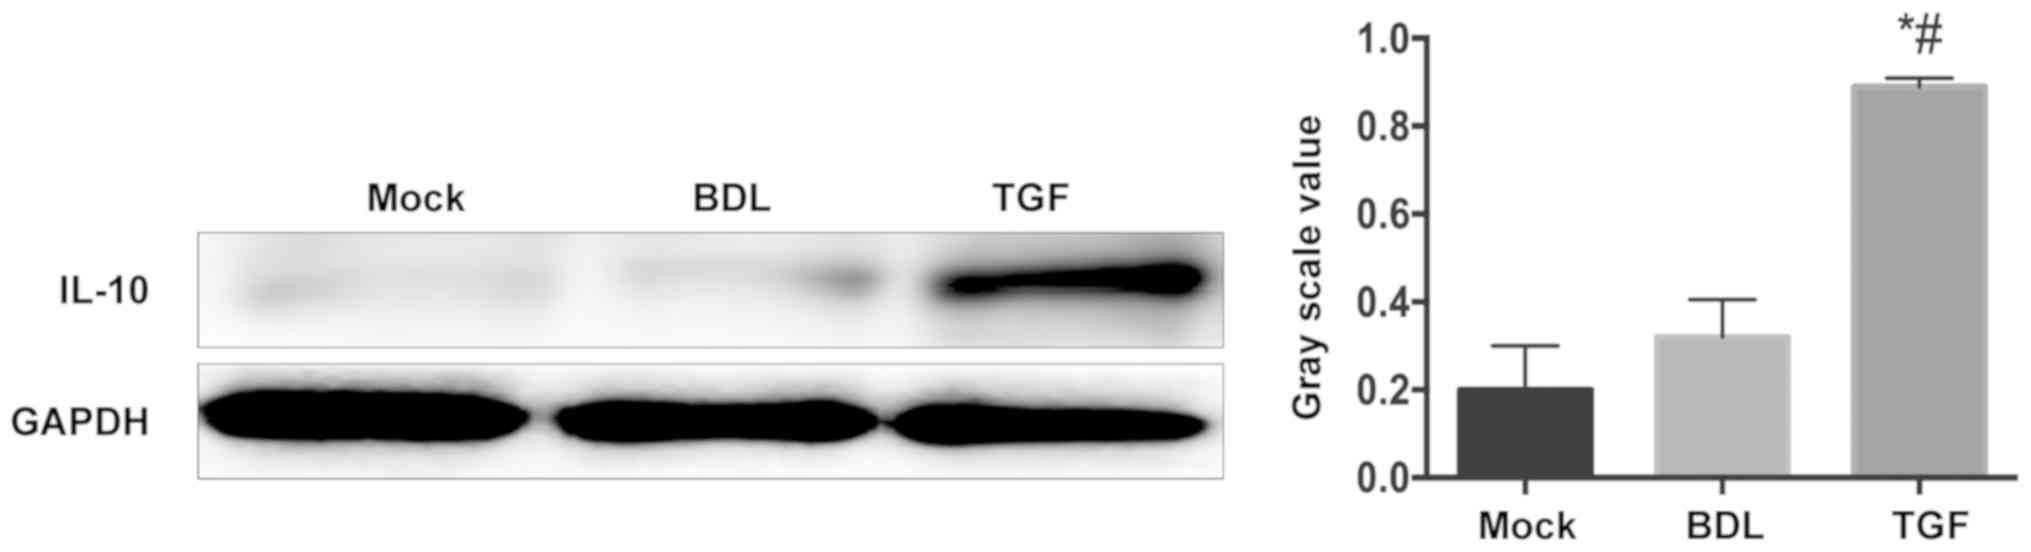
this study, the expression level of IL-10 in the liver of mice was
measured. As shown in Fig. 3, the
liver cells of mice in the BDL group and the Mock group secreted
only a small amount of IL-10, while the level of IL-10 in the TGF
group increased significantly. This showed the alleviation of TGF
in liver inflammation in cholestatic mice.
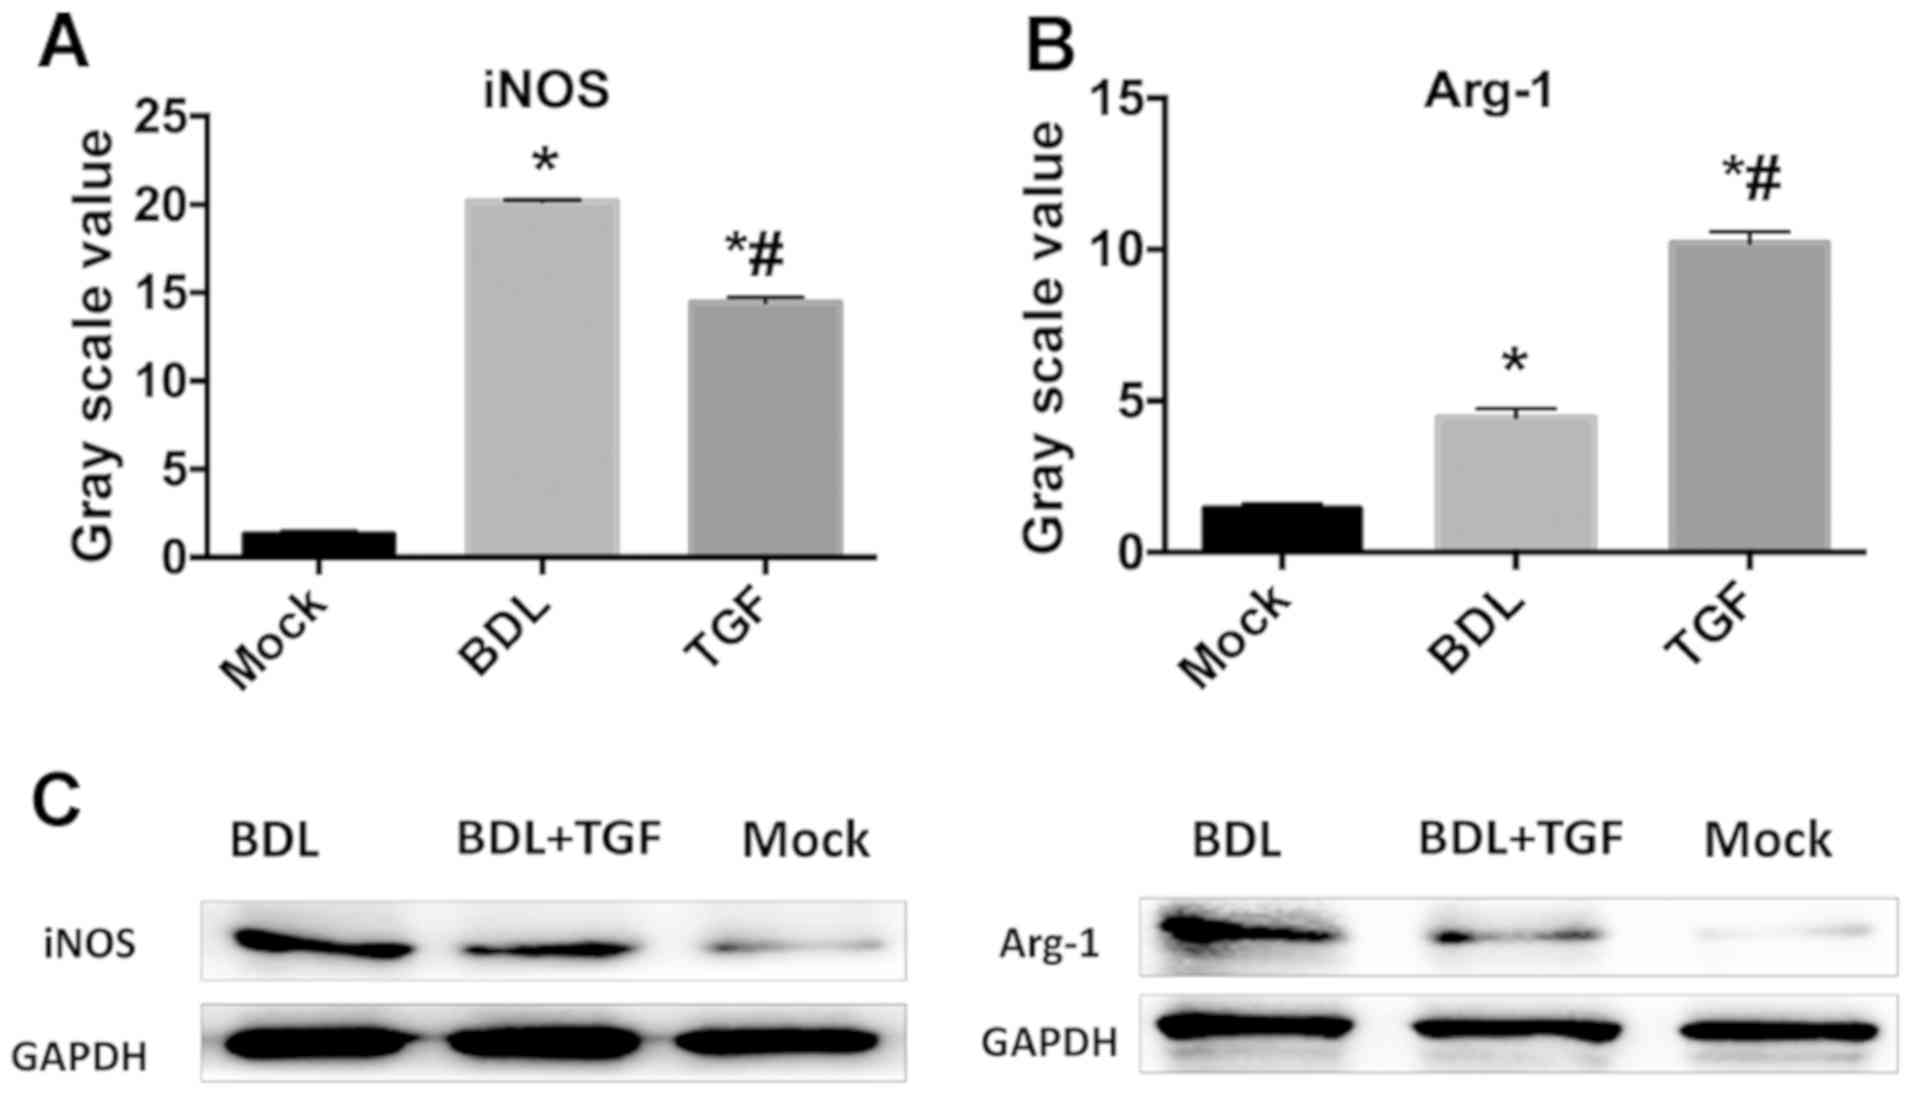
TGF-β1 induces M2 transformation of
KCs in cholestatic mice
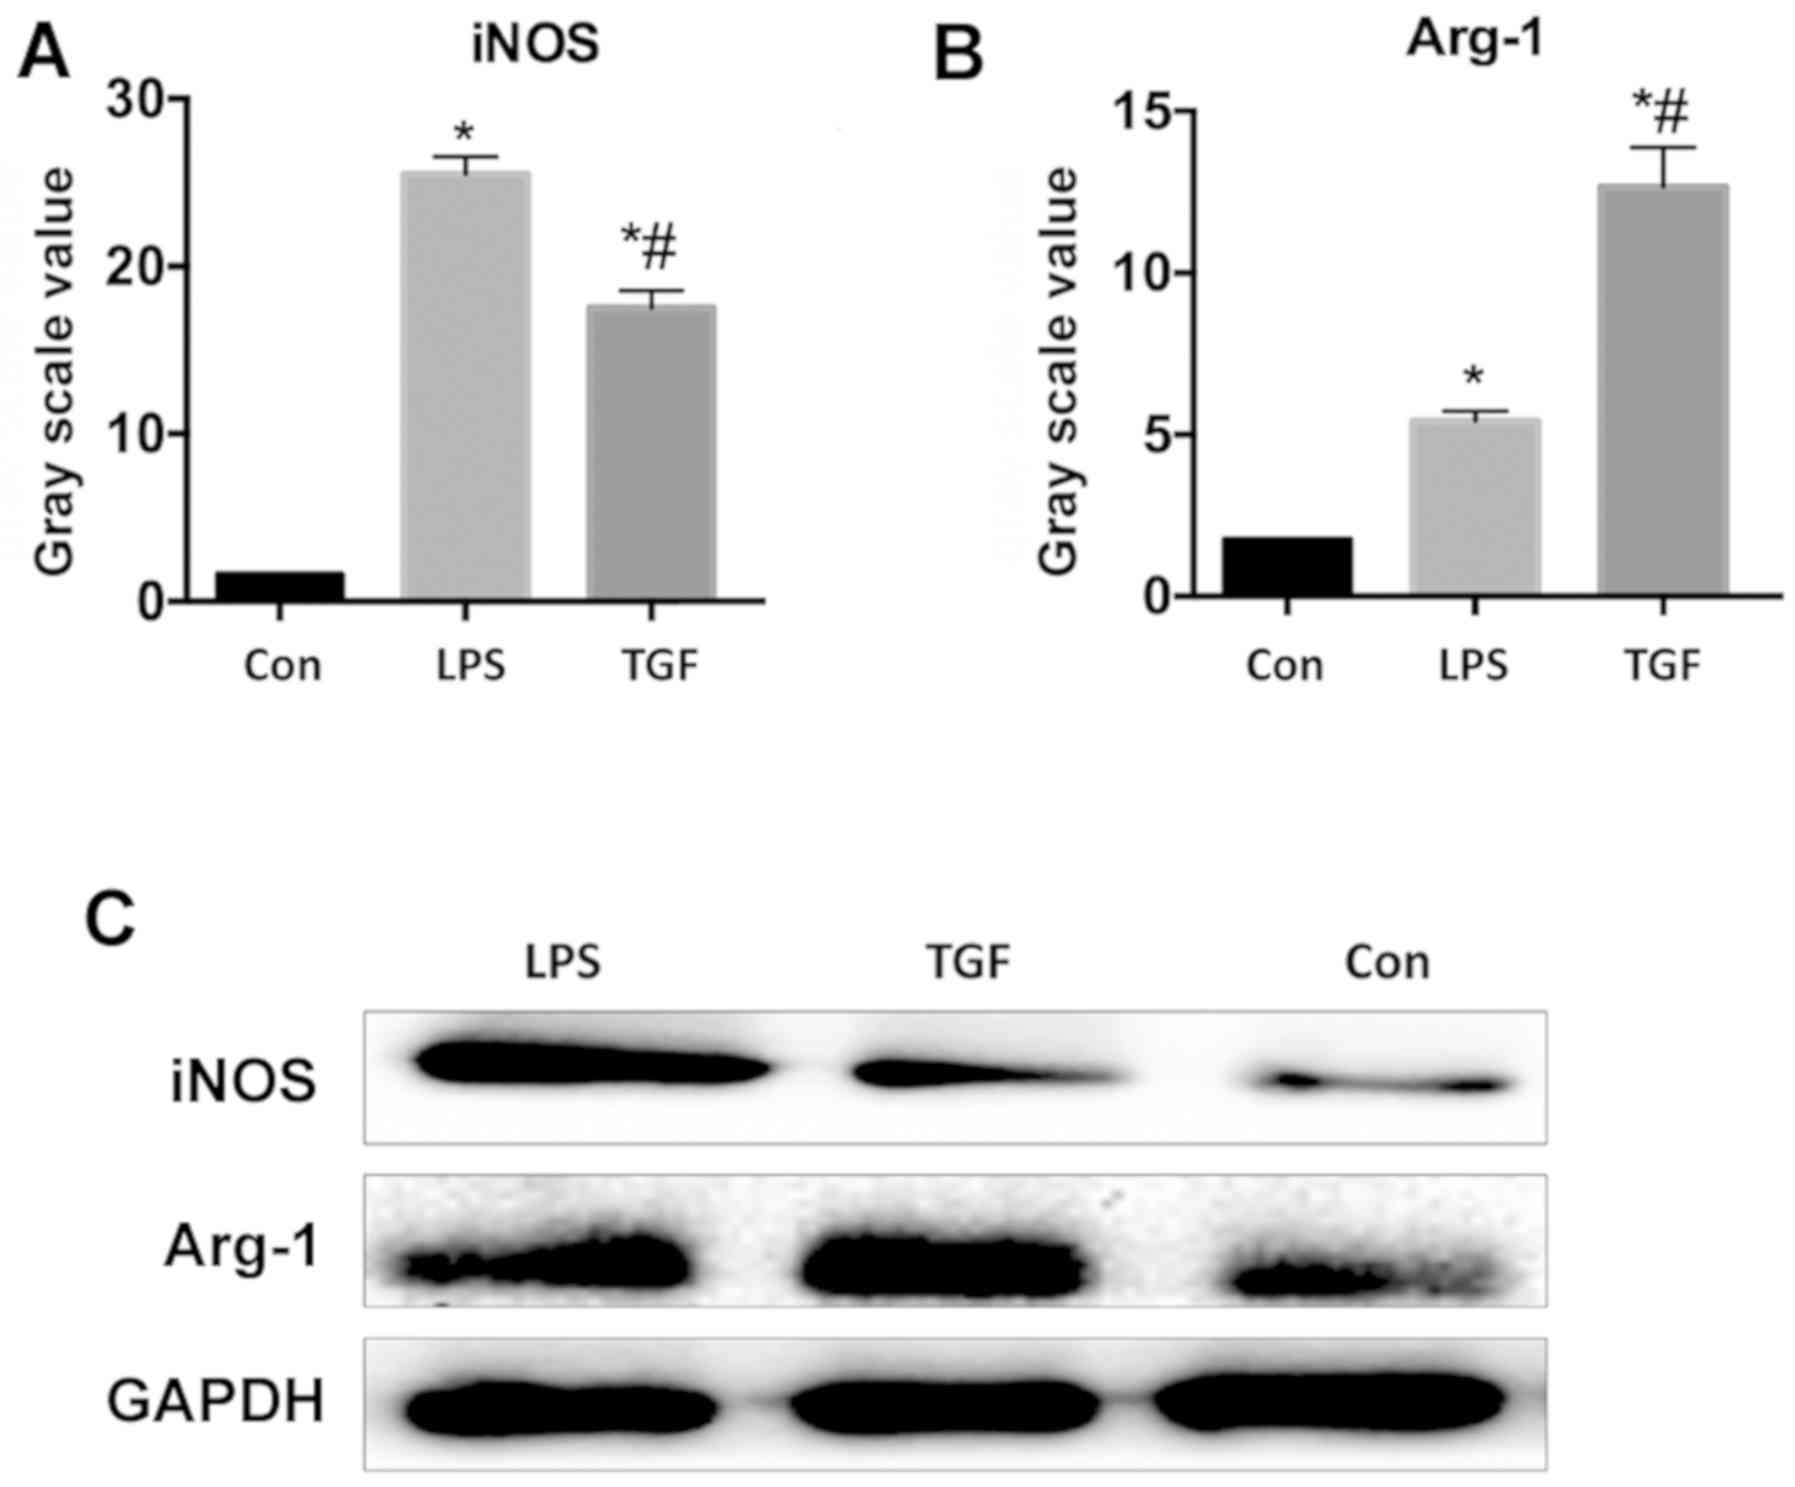
The protein expression of macrophage-specific
markers in isolated KCs shown in the results, the expression of
iNOS and Arg-1 significantly increased in BDL group, where iNOS was
more expressed than Arg-1 (P<0.05), compared with that of Mock
group. The TGF group had significantly lower iNOS protein
expression and Arg-1 was significantly higher than those in BDL
group (P<0.05). iNOS protein is an M1 macrophage-specific
marker, while Arg-1 protein is M2 macrophage-specific, so it can be
concluded that TGF treatment could induce KCs in cholestatic mice
to transform from M1 to M2 (Fig.
4).
TGF-β1 downregulates expression of
LPS-activated inflammatory cytokines in KCs
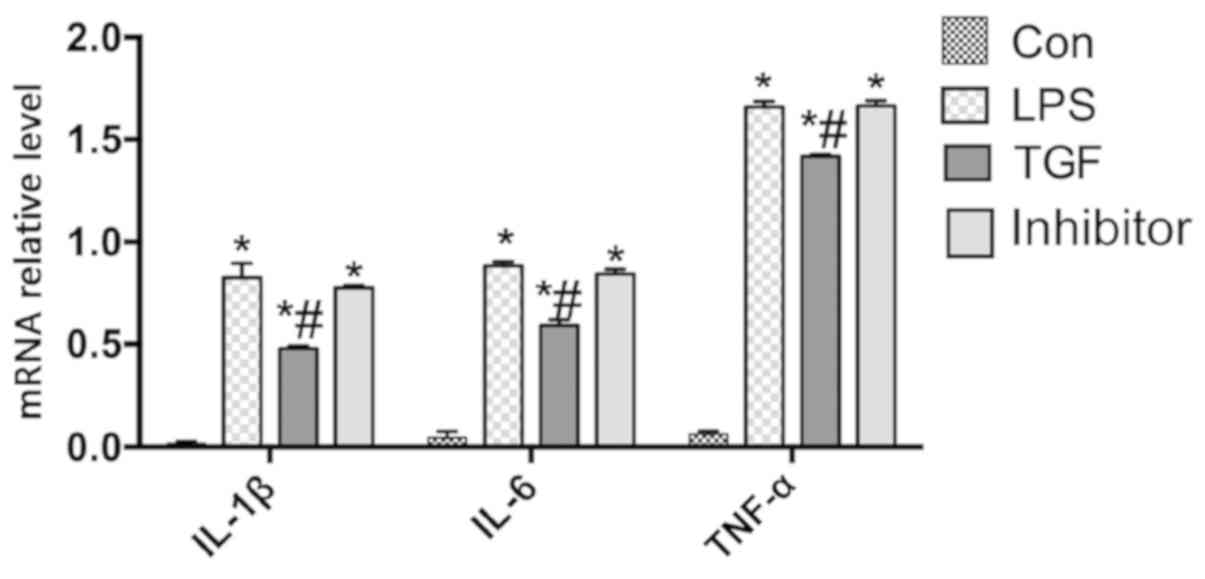
Real-time PCR showed that the relative mRNA
expression of IL-1β, IL-6 and TNF-α were significantly lower in TGF
group treated with LPS and TGF than those in mice treated with LPS
alone (P<0.05) and in Galunisertib group (P<0.05), but there
was no significant change between Galunisertib group and LPS group
(P>0.05) (Fig. 5). Fig. 6 illustrates that NF-κB expression was
significantly lower in TGF group by contrast with LPS group which
had no significant difference from Galunisertib group. TGF
downregulated NF-κB pathways in KCs, and NF-κB was a participant
and important player in inflammatory responses. Kupffer cells in
the control group, LPS group, and inhibitor group secreted only a
small amount of IL-10, while Kupffer cells in the TGF group
secreted more IL-10 (Fig. 7). TGF
was hereby demonstrated to be anti-inflammatory as it downregulated
the inflammatory pathway and inflammatory cytokines in KCs.
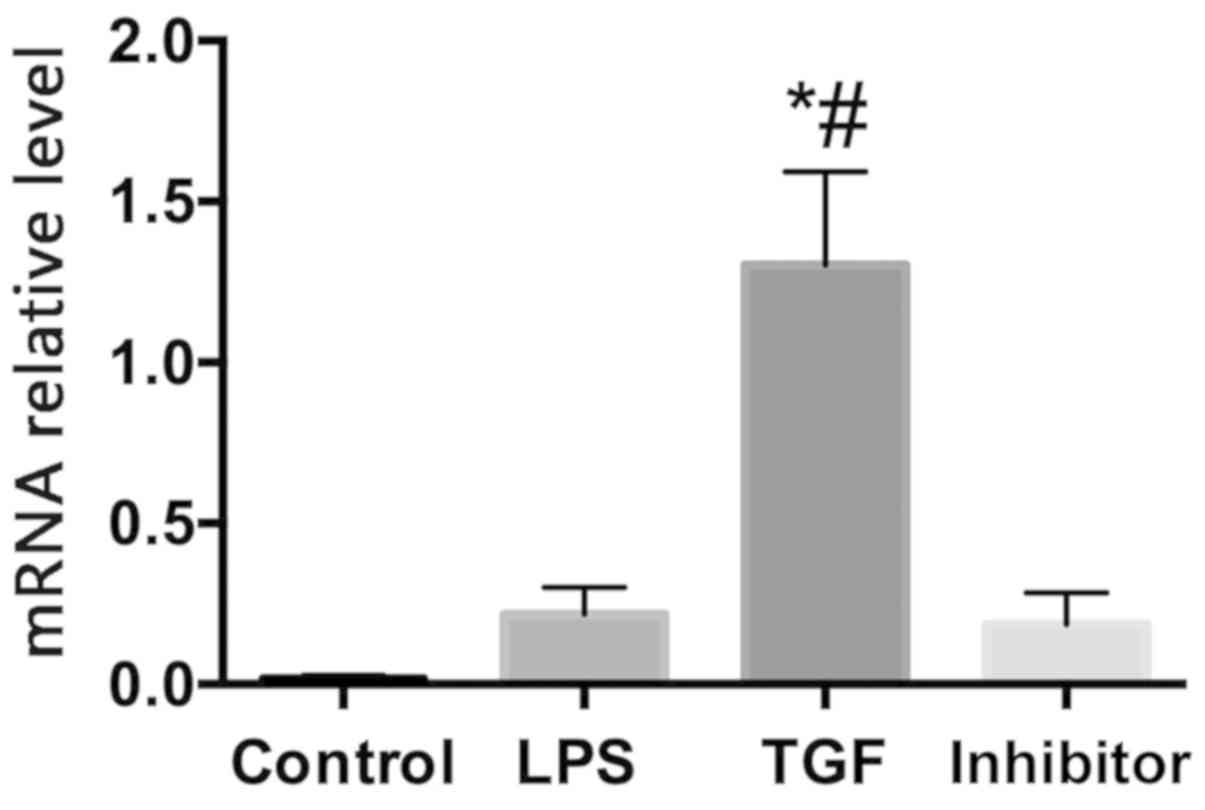 | Figure 7Relative expression of IL-10 mRNA in
Kupffer cells. control group, blank control group; LPS group,
Kupffer cells were treated with 100 ng/ml LPS; TGF group, Kupffer
cells were pretreated with 10 ng/ml TGF for 3 h, then 100 ng/ml LPS
was added to stimulate KCs, to culture for 12 h; Galunisertib
group, Kupffer cells were pretreated with 10 µM Galunisertib
inhibitor and 10 ng/ml TGF for 3 h, and then 100 ng/ml LPS was
added to culture KCs for 12 h. *P<0.05 compared with
the control group; #P<0.05 compared with the LPS
group. IL, interleukin; TGF-β1, transforming growth factor-β1; KCs,
Kupffer cells. |
TGF-β1 induces LPS-activated KCs to
transform into M2
Flow cytometry was adopted to determine the
percentages of CD40, CD80, CD204 and CD206. As seen in Table III, as M1 macrophage-specific
surface antigens, CD40 and CD86 were in significantly higher
percentages in LPS group than those in control group and TGF group
(P<0.05), while the TGF group had the CD204 and CD206 on M2
macrophage surfaces at a significantly higher level compared with
those in the other two groups (P<0.05). Fig. 8 shows that iNOS protein expression
was significantly higher in LPS group than that in control group
and TGF group, whereas Arg-1 protein expression was significantly
lower in comparison to TGF group. It indicated that TGF induced M2
transformation of LPS-activated KCs.
Discussion
Cholestasis, a multi-etiological clinical syndrome,
has gradually developed into one of the major health concerns
(28-30),
so new targets need to be found urgently in clinic.
TGF-β1 is a key player in various normal
physiological and pathological processes. It regulates macrophage
apoptosis induced by low serum concentration (26,31,32), and
effectively inhibits the occurrence of macrophage inflammatory
response as macrophages mature.
Liver function test is widely used to detect liver
condition in terms of ALT and AST, transaminase in hepatocytes and
to indicate liver injury (33).
Serum γ-GT is an indicator of biliary obstruction and hepatitis
activity (34). Bile duct ligation
(BDL), is the most common model used to induce cholestatic fibrosis
in rodents (35,36). The results showed that AST and ALT in
mice that underwent BDL increased significantly, indicating
hepatocyte necrosis, while increased γ-GT indicated cholestasis.
However, mice injected with TGF-β1 had significantly mitigated
hepatocyte injury, which suggested that TGF-β1 might relieve liver
injury and cholestasis.
It was found that the injection of TGF-β1 suppressed
the nuclear factor κ-light-chain-enhancer of activated B cells
(NF-κB) pathway in the liver and significantly reduced the
expression of IL-1β, IL-6, TNF-α in mice receiving BDL with
real-time PCR and the western blot analysis. NF-κB may cause severe
inflammation under abnormal conditions (37). It is generally expressed in cytoplasm
of almost all cell types (38).
NF-κB binding activity is normally absent in stable binding to IκB,
but in case of external stimulation, the cell surface is activated,
regulating the immune response of target genes to produce
inflammatory cytokines (39,40) such as IL-6, IL-1 and TNF-α. TGF-β1,
as an anti-inflammatory cytokine, effectively inhibits NF-κB
pathway in BDL mice. Macrophages are released and activated in the
portal area of PBC patients to release a large amount of
inflammatory cytokines, such as TNF-α, IL-1β and IL-6, causing
cascade inflammatory cytokine responses and severe liver injury
(41). The western blot analysis
concluded in this study that treating BDL mice with TGF-β1 reduced
the expression of IL-1β, IL-6 and TNF-α, members of
pro-inflammatory cytokines of which the latter two were linked to
oxygen-radical-mediated liver injury and thus cholestatic hepatitis
in recent studies (42). It suggests
that they play critical roles in the formation of acute
intrahepatic cholestasis (43).
Expression of IL-1β, IL-6, and TNF-α were significantly increased
in LPS group pretreated with TGF-β1 in comparison to LPS group.
Galunisertib is a TGF-β1 receptor inhibitor used to determine
changes in the study target TGF-β1, and the results indicate that
they returned to the levels following LPS treatment after the mice
were administered TGF-β1 inhibitor Galunisertib, showing that
TGF-β1 protected the inflammatory response of KCs. Hence, TGF-β1
inhibited the production of inflammatory cytokines, and
downregulated the expression of upstream regulatory proteins, thus
alleviating liver injury caused by inflammatory responses.
KCs are the main source of pro-inflammatory
cytokines in the liver (44-46).
Intestinal LPS has been observed to promote the pro-inflammatory
response of liver macrophages, resulting in increased transcription
of bile acid and bilirubin and cholestatic hepatocellular injury
initiated by bile acid accumulation in the liver (47). Activation of NF-κB pathway in KCs is
accompanied by high amounts of pro-inflammatory cytokines, thus
aggravating the inflammatory response in the liver, while increased
release of IL-10 by KCs reduces inflammation. The difference is
caused by different phenotypes of KCs. Macrophages secrete enzymes
and cytokines to produce anti-inflammation, promote tissue repair
and angiogenesis, and regulate immune responses; these secreted
cytokines further affect the polarization state of macrophages
(48-50).
KCs is mainly grouped into two significantly different types:
classically activated M1 KCs and alternatively activated M2 KCs.
iNOS is recognized in considerable number of studies as a specific
expression marker of M1 macrophages, whereas, Found in Inflammatory
Zone 1 (FIZZ1), arginase-1 (Arg-1) and IL-10 are those of M2
macrophages (51,52). In both the animal trial and cell
trial, TGF-β1 treatment was observed to elevate the expression of
M2-specific ARG-1 and the percentages of surface antigens CD203 and
CD206, but lower the expression of M1-specific iNOS and the
percentages of CD40 and CD86, which indicated that TGF-β1 treatment
could induce M2 transformation of macrophages in cholestatic mice.
M1 macrophages are crucial in inflammatory responses, pathogen
clearance and antitumor immunity, while by secreting cytokines such
as IL-10, M2 is anti-inflammatory, inhibiting immune responses, and
parasite clearance and angiogenesis (53). The above-mentioned trials confirmed
that TGF-β1 promoted the differentiation of macrophages into M2,
but the specific mechanism remains unknown.
This study was a preliminarily confirmation that
TGF-β1 interfered with the activation of NF-κB signal transduction
pathway in macrophages and the expression of IL-1β, IL-6 and TNF-α,
thus suppressing the inflammatory responses of cholestatic
hepatitis. It provided laboratory basis for clinical use of TGF
drugs in treatment of cholestatic hepatitis.
Acknowledgements
Not applicable.
Funding
Project Funded by National Natural Science
Foundation of China (81700537), Major Project of Changzhou Health
and Family Planning Commission (ZD201606).
Availability of data and materials
The datasets used and/or analyzed during the current
study are available from the corresponding author on reasonable
request.
Authors' contributions
JQ, YJ, HL and HY led the conception and design of
this study. JQ, GW, XC and HY were responsible for the data
collection and analysis. YJ, GW and HY were in charge of
interpreting the data and drafting the manuscript. JQ and YJ made
revision from critical perspective for important intellectual
content. The final version was read and adopted by all the
authors.
Ethics approval and consent to
participate
The study was approved by the Ethics Committee of
The Affiliated Changzhou No. 2 People's Hospital of Nanjing Medical
University (Changzhou, China).
Patient consent for publication
Not applicable.
Competing interests
The authors declare that they have no competing
interests.
References
|
1
|
Zakharia K, Tabibian A, Lindor KD and
Tabibian JH: Complications, symptoms, quality of life and pregnancy
in cholestatic liver disease. Liver Int. 38:399–411.
2018.PubMed/NCBI View Article : Google Scholar
|
|
2
|
Zhao S, Li N, Zhen Y, Ge M, Li Y, Yu B, He
H and Shao RG: Protective effect of gastrodin on bile duct
ligation-induced hepatic fibrosis in rats. Food Chem Toxicol.
86:202–207. 2015.PubMed/NCBI View Article : Google Scholar
|
|
3
|
Seca AM and Pinto DC: Plant secondary
metabolites as anticancer agents: Successes in clinical trials and
therapeutic application. Int J Mol Sci. 19(19)2018.PubMed/NCBI View Article : Google Scholar
|
|
4
|
Miyaguchi S, Ebinuma H, Imaeda H, Nitta Y,
Watanabe T, Saito H and Ishii H: A novel treatment for refractory
primary biliary cirrhosis? Hepatogastroenterology. 47:1518–1521.
2000.PubMed/NCBI
|
|
5
|
Drivdal M, Holven KB, Retterstøl K,
Aagenaes Ø and Kase BF: A nine year follow-up study of patients
with lymphoedema cholestasis syndrome 1 (LCS1/Aagenaes syndrome).
Scand J Clin Lab Invest. 78:566–574. 2018.PubMed/NCBI View Article : Google Scholar
|
|
6
|
Paquissi FC: Immunity and fibrogenesis:
The role of Th17/IL-17 axis in HBV and HCV-induced chronic
hepatitis and progression to cirrhosis. Front Immunol.
8(1195)2017.PubMed/NCBI View Article : Google Scholar
|
|
7
|
Burnevich ES, Popova EN, Ponomarev AB,
Nekrasova TP, Lebedeva MV, Filatova AL, Shchanitcyna EM, Ponomareva
LA, Beketov VD, Bondarenko IB, et al: Autoimmune liver disease
(primary biliary cholangitis/autoimmune hepatitis-overlap)
associated with sarcoidosis (clinical cases and literature review).
Ter Arkh. 91:89–94. 2019.PubMed/NCBI View Article : Google Scholar
|
|
8
|
Zhu J, Wang R, Xu T, Zhang S, Zhao Y, Li
Z, Wang C, Zhou J, Gao D, Hu Y, et al: Salvianolic acid a
attenuates endoplasmic reticulum stress and protects against
cholestasis-induced liver fibrosis via the SIRT1/HSF1 pathway.
Front Pharmacol. 9(1277)2018.PubMed/NCBI View Article : Google Scholar
|
|
9
|
Mohammadi A, Blesso CN, Barreto GE, Banach
M, Majeed M and Sahebkar A: Macrophage plasticity, polarization and
function in response to curcumin, a diet-derived polyphenol, as an
immunomodulatory agent. J Nutr Biochem. 66:1–16. 2019.PubMed/NCBI View Article : Google Scholar
|
|
10
|
Cheng Z, Zhou YZ, Wu Y, Wu QY, Liao XB, Fu
XM and Zhou XM: Diverse roles of macrophage polarization in aortic
aneurysm: Destruction and repair. J Transl Med.
16(354)2018.PubMed/NCBI View Article : Google Scholar
|
|
11
|
Sica A, Erreni M, Allavena P and Porta C:
Macrophage polarization in pathology. Cell Mol Life Sci.
72:4111–4126. 2015.PubMed/NCBI View Article : Google Scholar
|
|
12
|
Gong W, Huang F, Sun L, Yu A, Zhang X, Xu
Y, Shen Y and Cao J: Toll-like receptor-2 regulates macrophage
polarization induced by excretory-secretory antigens from
Schistosoma japonicum eggs and promotes liver pathology in
murine schistosomiasis. PLoS Negl Trop Dis: Dec 27, 2018 (Epub
ahead of print). doi: 10.1371/journal.pntd.0007000..
|
|
13
|
Cho U, Kim B, Kim S, Han Y and Song YS:
Pro-inflammatory M1 macrophage enhances metastatic potential of
ovarian cancer cells through NF-κB activation. Mol Carcinog.
57:235–242. 2018.PubMed/NCBI View
Article : Google Scholar
|
|
14
|
Wang Y, Smith W, Hao D, He B and Kong L:
M1 and M2 macrophage polarization and potentially therapeutic
naturally occurring compounds. Int Immunopharmacol. 70:459–466.
2019.PubMed/NCBI View Article : Google Scholar
|
|
15
|
Qing L, Fu J, Wu P, Zhou Z, Yu F and Tang
J: Metformin induces the M2 macrophage polarization to accelerate
the wound healing via regulating AMPK/mTOR/NLRP3 inflammasome
singling pathway. Am J Transl Res. 11:655–668. 2019.PubMed/NCBI
|
|
16
|
Wang Y, Guo X, Jiao G, Luo L, Zhou L,
Zhang J and Wang B: Splenectomy promotes macrophage polarization in
a mouse model of concanavalin A- (ConA-) induced liver fibrosis.
BioMed Res Int. 2019(5756189)2019.PubMed/NCBI View Article : Google Scholar
|
|
17
|
Lu CH, Lai CY, Yeh DW, Liu YL, Su YW, Hsu
LC, Chang CH, Catherine Jin SL and Chuang TH: Involvement of M1
macrophage polarization in endosomal Toll-like receptors activated
psoriatic inflammation. Mediators Inflamm: Dec 16, 2018 (Epub ahead
of print). doi: 10.1155/2018/3523642.
|
|
18
|
Tsuneyama K, Harada K, Kono N, Hiramatsu
K, Zen Y, Sudo Y, Gershwin ME, Ikemoto M, Arai H and Nakanuma Y:
Scavenger cells with gram-positive bacterial lipoteichoic acid
infiltrate around the damaged interlobular bile ducts of primary
biliary cirrhosis. J Hepatol. 35:156–163. 2001.PubMed/NCBI View Article : Google Scholar
|
|
19
|
Prunier C, Baker D, Ten Dijke P and Ritsma
L: TGF-β family signaling pathways in cellular dormancy. Trends
Cancer. 5:66–78. 2019.PubMed/NCBI View Article : Google Scholar
|
|
20
|
Dragotto J, Canterini S, Del Porto P,
Bevilacqua A and Fiorenza MT: The interplay between
TGF-β-stimulated TSC22 domain family proteins regulates cell-cycle
dynamics in medulloblastoma cells. J Cell Physiol. 234:18349–18360.
2019.PubMed/NCBI View Article : Google Scholar
|
|
21
|
Derynck R and Budi EH: Specificity,
versatility, and control of TGF-β family signaling. Sci Signal.
12(12)2019.PubMed/NCBI View Article : Google Scholar
|
|
22
|
Dropmann A, Dediulia T, Breitkopf-Heinlein
K, Korhonen H, Janicot M, Weber SN, Thomas M, Piiper A, Bertran E,
Fabregat I, et al: TGF-β1 and TGF-β2 abundance in liver diseases of
mice and men. Oncotarget. 7:19499–19518. 2016.PubMed/NCBI View Article : Google Scholar
|
|
23
|
Li MO, Wan YY, Sanjabi S, Robertson AK and
Flavell RA: Transforming growth factor-beta regulation of immune
responses. Annu Rev Immunol. 24:99–146. 2006.PubMed/NCBI View Article : Google Scholar
|
|
24
|
Kim KK, Sheppard D and Chapman HA: TGF-β1
signaling and tissue fibrosis. Cold Spring Harb Perspect Biol.
10(10)2018.PubMed/NCBI View Article : Google Scholar
|
|
25
|
Tang J, Gifford CC, Samarakoon R and
Higgins PJ: Deregulation of negative controls on TGF-β1 signaling
in tumor progression. Cancers (Basel). 10(10)2018.PubMed/NCBI View Article : Google Scholar
|
|
26
|
Zeng WQ, Zhang JQ, Li Y, Yang K, Chen YP
and Liu ZJ: A new method to isolate and culture rat kupffer cells.
PLoS One. 8(e70832)2013.PubMed/NCBI View Article : Google Scholar
|
|
27
|
Mishra B, Tang Y, Katuri V, Fleury T, Said
AH, Rashid A, Jogunoori W and Mishra L: Loss of cooperative
function of transforming growth factor-beta signaling proteins,
smad3 with embryonic liver fodrin, a beta-spectrin, in primary
biliary cirrhosis. Liver Int. 24:637–645. 2004.PubMed/NCBI View Article : Google Scholar
|
|
28
|
Neuman M, Angulo P, Malkiewicz I,
Jorgensen R, Shear N, Dickson ER, Haber J, Katz G and Lindor K:
Tumor necrosis factor-alpha and transforming growth factor-beta
reflect severity of liver damage in primary biliary cirrhosis. J
Gastroenterol Hepatol. 17:196–202. 2002.PubMed/NCBI View Article : Google Scholar
|
|
29
|
Martinez OM, Villanueva JC, Gershwin ME
and Krams SM: Cytokine patterns and cytotoxic mediators in primary
biliary cirrhosis. Hepatology. 21:113–119. 1995.PubMed/NCBI
|
|
30
|
Liu B, Zhang X, Zhang FC, Zong JB, Zhang W
and Zhao Y: Aberrant TGF-β1 signaling contributes to the
development of primary biliary cirrhosis in murine model. World J
Gastroenterol. 19:5828–5836. 2013.PubMed/NCBI View Article : Google Scholar
|
|
31
|
Hasan MS, Karim AB, Rukunuzzaman M, Haque
A, Akhter MA, Shoma UK, Yasmin F and Rahman MA and Rahman MA: Role
of liver biopsy in the diagnosis of neonatal cholestasis due to
biliary atresia. Mymensingh Med J. 27:826–833. 2018.PubMed/NCBI
|
|
32
|
Houwen R: Chapter 6.4. Diagnostic Progress
in Cholestasis. J Pediatr Gastroenterol Nutr. 66 (Suppl
1):S134–S136. 2018.PubMed/NCBI View Article : Google Scholar
|
|
33
|
Trauner M, Meier PJ and Boyer JL:
Molecular pathogenesis of cholestasis. N Engl J Med. 339:1217–1227.
1998.PubMed/NCBI View Article : Google Scholar
|
|
34
|
Virani S, Akers A, Stephenson K, Smith S,
Kennedy L, Alpini G and Francis H: Comprehensive review of
molecular mechanisms during cholestatic liver injury and
cholangiocarcinoma. J Liver. 7(7)2018.PubMed/NCBI View Article : Google Scholar
|
|
35
|
Cies JJ and Giamalis JN: Treatment of
cholestatic pruritus in children. Am J Health Syst Pharm.
64:1157–1162. 2007.PubMed/NCBI View Article : Google Scholar
|
|
36
|
Hirschfield GM and Heathcote EJ:
Cholestasis and cholestatic syndromes. Curr Opin Gastroenterol.
25:175–179. 2009.PubMed/NCBI View Article : Google Scholar
|
|
37
|
Sun X, Xie Z, Ma Y, Pan X, Wang J, Chen Z
and Shi P: TGF-β inhibits osteogenesis by upregulating the
expression of ubiquitin ligase SMURF1 via MAPK-ERK signaling. J
Cell Physiol. 233:596–606. 2018.PubMed/NCBI View Article : Google Scholar
|
|
38
|
Hu B, Xu C, Cao P, Tian Y, Zhang Y, Shi C,
Xu J, Yuan W and Chen H: TGF-β stimulates expression of chondroitin
polymerizing factor in nucleus pulposus cells through the Smad3,
RhoA/ROCK1, and MAPK signaling pathways. J Cell Biochem.
119:566–579. 2018.PubMed/NCBI View Article : Google Scholar
|
|
39
|
Du M, Chen W, Zhang W, Tian XK, Wang T, Wu
J, Gu J, Zhang N, Lu ZW, Qian LX, et al: TGF-β1 regulates the
ERK/MAPK pathway independent of the SMAD pathway by repressing
miRNA-124 to increase MALAT1 expression in nasopharyngeal
carcinoma. Biomed Pharmacother. 99:688–696. 2018.PubMed/NCBI View Article : Google Scholar
|
|
40
|
Coppola N, Zampino R, Sagnelli C, Bellini
G, Marrone A, Stanzione M, Capoluongo N, Boemio A, Minichini C,
Adinolfi LE, et al: Cannabinoid receptor 2-63 QQ variant is
associated with persistently normal aminotransferase serum levels
in chronic hepatitis C. PLoS One. 9(e99450)2014.PubMed/NCBI View Article : Google Scholar
|
|
41
|
Mazzella G, Salzetta A, Casanova S,
Morelli MC, Villanova N, Miniero R, Sottili S, Novelli V, Cipolla
A, Festi D, et al: Treatment of chronic sporadic-type non-A, non-B
hepatitis with lymphoblastoid interferon: Gamma GT levels
predictive for response. Dig Dis Sci. 39:866–870. 1994.PubMed/NCBI View Article : Google Scholar
|
|
42
|
Van Campenhout S, Van Vlierberghe H and
Devisscher L: Common bile duct ligation as model for secondary
biliary cirrhosis. Methods Mol Biol. 1981:237–247. 2019.PubMed/NCBI View Article : Google Scholar
|
|
43
|
Lotowska JM, Sobaniec-Lotowska ME,
Lebensztejn DM, Daniluk U, Sobaniec P, Sendrowski K, Daniluk J,
Reszec J, Debek W, Festi D, et al: Ultrastructural characteristics
of rat hepatic oval cells and their intercellular contacts in the
model of biliary fibrosis: New insights into experimental liver
fibrogenesis. Gastroenterol Res Pract. 2017(2721547)2017.PubMed/NCBI View Article : Google Scholar
|
|
44
|
Liu TZ, Lee KT, Chern CL, Cheng JT, Stern
A and Tsai LY: Free radical-triggered hepatic injury of
experimental obstructive jaundice of rats involves overproduction
of proinflammatory cytokines and enhanced activation of nuclear
factor kappaB. Ann Clin Lab Sci. 31:383–390. 2001.PubMed/NCBI
|
|
45
|
Huang ZH, Huang X and Li Y: Changes and
significance of tumor necrosis factor-alpha and interleukin-6 level
in plasma and bile during the formation of acute intrahepatic
cholestasis in New Zealand white rabbits. Zhonghua Gan Zang Bing Za
Zhi. 11(313)2003.(In Chinese). PubMed/NCBI
|
|
46
|
Sen R and Baltimore D: Inducibility of
kappa immunoglobulin enhancer-binding protein NF-kappaB by a
posttranslational mechanism. Cell. 47:921–928. 1986.
|
|
47
|
Ghosh S and Hayden MS: New regulators of
NF-kappaB in inflammation. Nat Rev Immunol. 8:837–848.
2008.PubMed/NCBI View Article : Google Scholar
|
|
48
|
Editors PO: PLOS ONE Editors: Expression
of Concern: The interplay between NF-kappaB and E2F1 coordinately
regulates inflammation and metabolism in human cardiac cells. PLoS
One. 14(e0216434)2019.PubMed/NCBI View Article : Google Scholar
|
|
49
|
Park J, Ha SH, Abekura F, Lim H, Magae J,
Ha KT, Chung TW, Chang YC, Lee YC, Chung E, et al:
4-O-carboxymethyl ascochlorin inhibits expression levels of on
inflammation-related cytokines and matrix metalloproteinase-9
through NF-κB/MAPK/TLR4 signaling pathway in LPS-activated RAW264.7
cells. Front Pharmacol. 10(304)2019.PubMed/NCBI View Article : Google Scholar
|
|
50
|
van der Tuin SJ, Li Z, Berbée JF,
Verkouter I, Ringnalda LE, Neele AE, van Klinken JB, Rensen SS, Fu
J, de Winther MP, et al: Lipopolysaccharide lowers cholesteryl
ester transfer protein by activating F4/80+Clec4f+Vsig4+Ly6C-
Kupffer cell subsets. J Am Heart Assoc. 7(7)2018.PubMed/NCBI View Article : Google Scholar
|
|
51
|
Feng P, Zhu W, Chen N, Li P, He K and Gong
J: Cathepsin B in hepatic Kupffer cells regulates activation of
TLR4-independent inflammatory pathways in mice with
lipopolysaccharide-induced sepsis. Nan Fang Yi Ke Da Xue Xue Bao.
38:1465–1471. 2018.(In Chinese). PubMed/NCBI View Article : Google Scholar
|
|
52
|
Zhang WJ, Fang ZM and Liu WQ: NLRP3
inflammasome activation from Kupffer cells is involved in liver
fibrosis of Schistosoma japonicum-infected mice via NF-κB.
Parasit Vectors. 12(29)2019.PubMed/NCBI View Article : Google Scholar
|
|
53
|
Ohtani N and Kawada N: Role of the
gut-liver axis in liver inflammation, fibrosis, and cancer: A
special focus on the gut microbiota relationship. Hepatol Commun.
3:456–470. 2019.PubMed/NCBI View Article : Google Scholar
|