Introduction
Wound healing and scarring can be divided into three
stages: Inflammation, proliferation and tissue remodeling; these
are complex processes, involving a variety of cell types, cytokines
and signaling pathways (1).
Hypertrophic scarring (HS) is a manifestation of a dysfunctional
response to dermal injury and is characterized by excessive
deposition of the extracellular matrix and excessive proliferation
of fibroblasts (2). HS is one of the
most frequent skin diseases, mainly occurring in 30-72% of patients
with thermal injury and trauma (3).
HS can cause cosmetic disfiguring or produce restriction of motion
(1). Growth factors, such as
transforming growth factor-β (4),
cytokines [including interleukin (IL)-4, 8 and 10, and interferon-γ
(5,6)], chemokines [including stromal
cell-derived factor-1(7), CXC
chemokine receptor 3 (CXCR3) (8) and
monocyte chemotactic protein-1(9)]
and proteolytic enzymes [including matrix metalloproteinase
(MMP)-1, 2 and 9 (10,11)] have been suggested to be involved in
the molecular mechanism of the pathogenesis of HS. However, due to
the complexity of HS, a complete understanding of the molecular
mechanism underlying the formation of HS has not yet been
elucidated.
High throughput RNA-sequencing (RNA-Seq) using
next-generation sequencing technology enabled effective and
comprehensive analysis of the gene expression profile in previous
studies (12-14).
In the present study, an animal model of HS was established using a
rabbit ear (6,15), and then the general pattern of the
gene expression profile in HS and control samples was investigated
during different stages using RNA-Seq. The differentially expressed
genes (DEGs) and biological pathway alterations were identified.
The present study may provide a better understanding of the
molecular mechanisms involved in the formation of HS.
Materials and methods
Hypertrophic scar model and sample
collection
All animal experiments were approved by The
Institutional Animal Care and Use Committee of The Second Military
Medical University. Hypertrophic scars were created in 50 one-year
old female New Zealand White rabbits (Shanghai SLRC Experimental
Animal Co., Ltd.) (6). Rabbits
weighed 2.5 kg at the beginning of the experiment. Each rabbit was
raised in separate cages at 25˚C with constant laminar flow and
circadian light/dark cycle (light, 6 am-4 pm; dark 4 pm-6 am).
Rabbits had access to food and water 4-5 times a day. The rabbits
were anesthetized with 30 mg/kg sodium pentobarbital. A total of
four full-thickness wounds (1.5x1.5 cm) were created down to the
bare cartilage on the ventral surface of each ear, in which the
incision interval was >1.5 cm. After bleeding was stopped by
applying pressure, the ventral surface of the ear was bandaged with
dressing. Scar formation was checked daily. The stages of wounding
were divided according to the average time of peak inflammation
(Stage 1), peak scar hypertrophy (Stage 2) and complete degraded
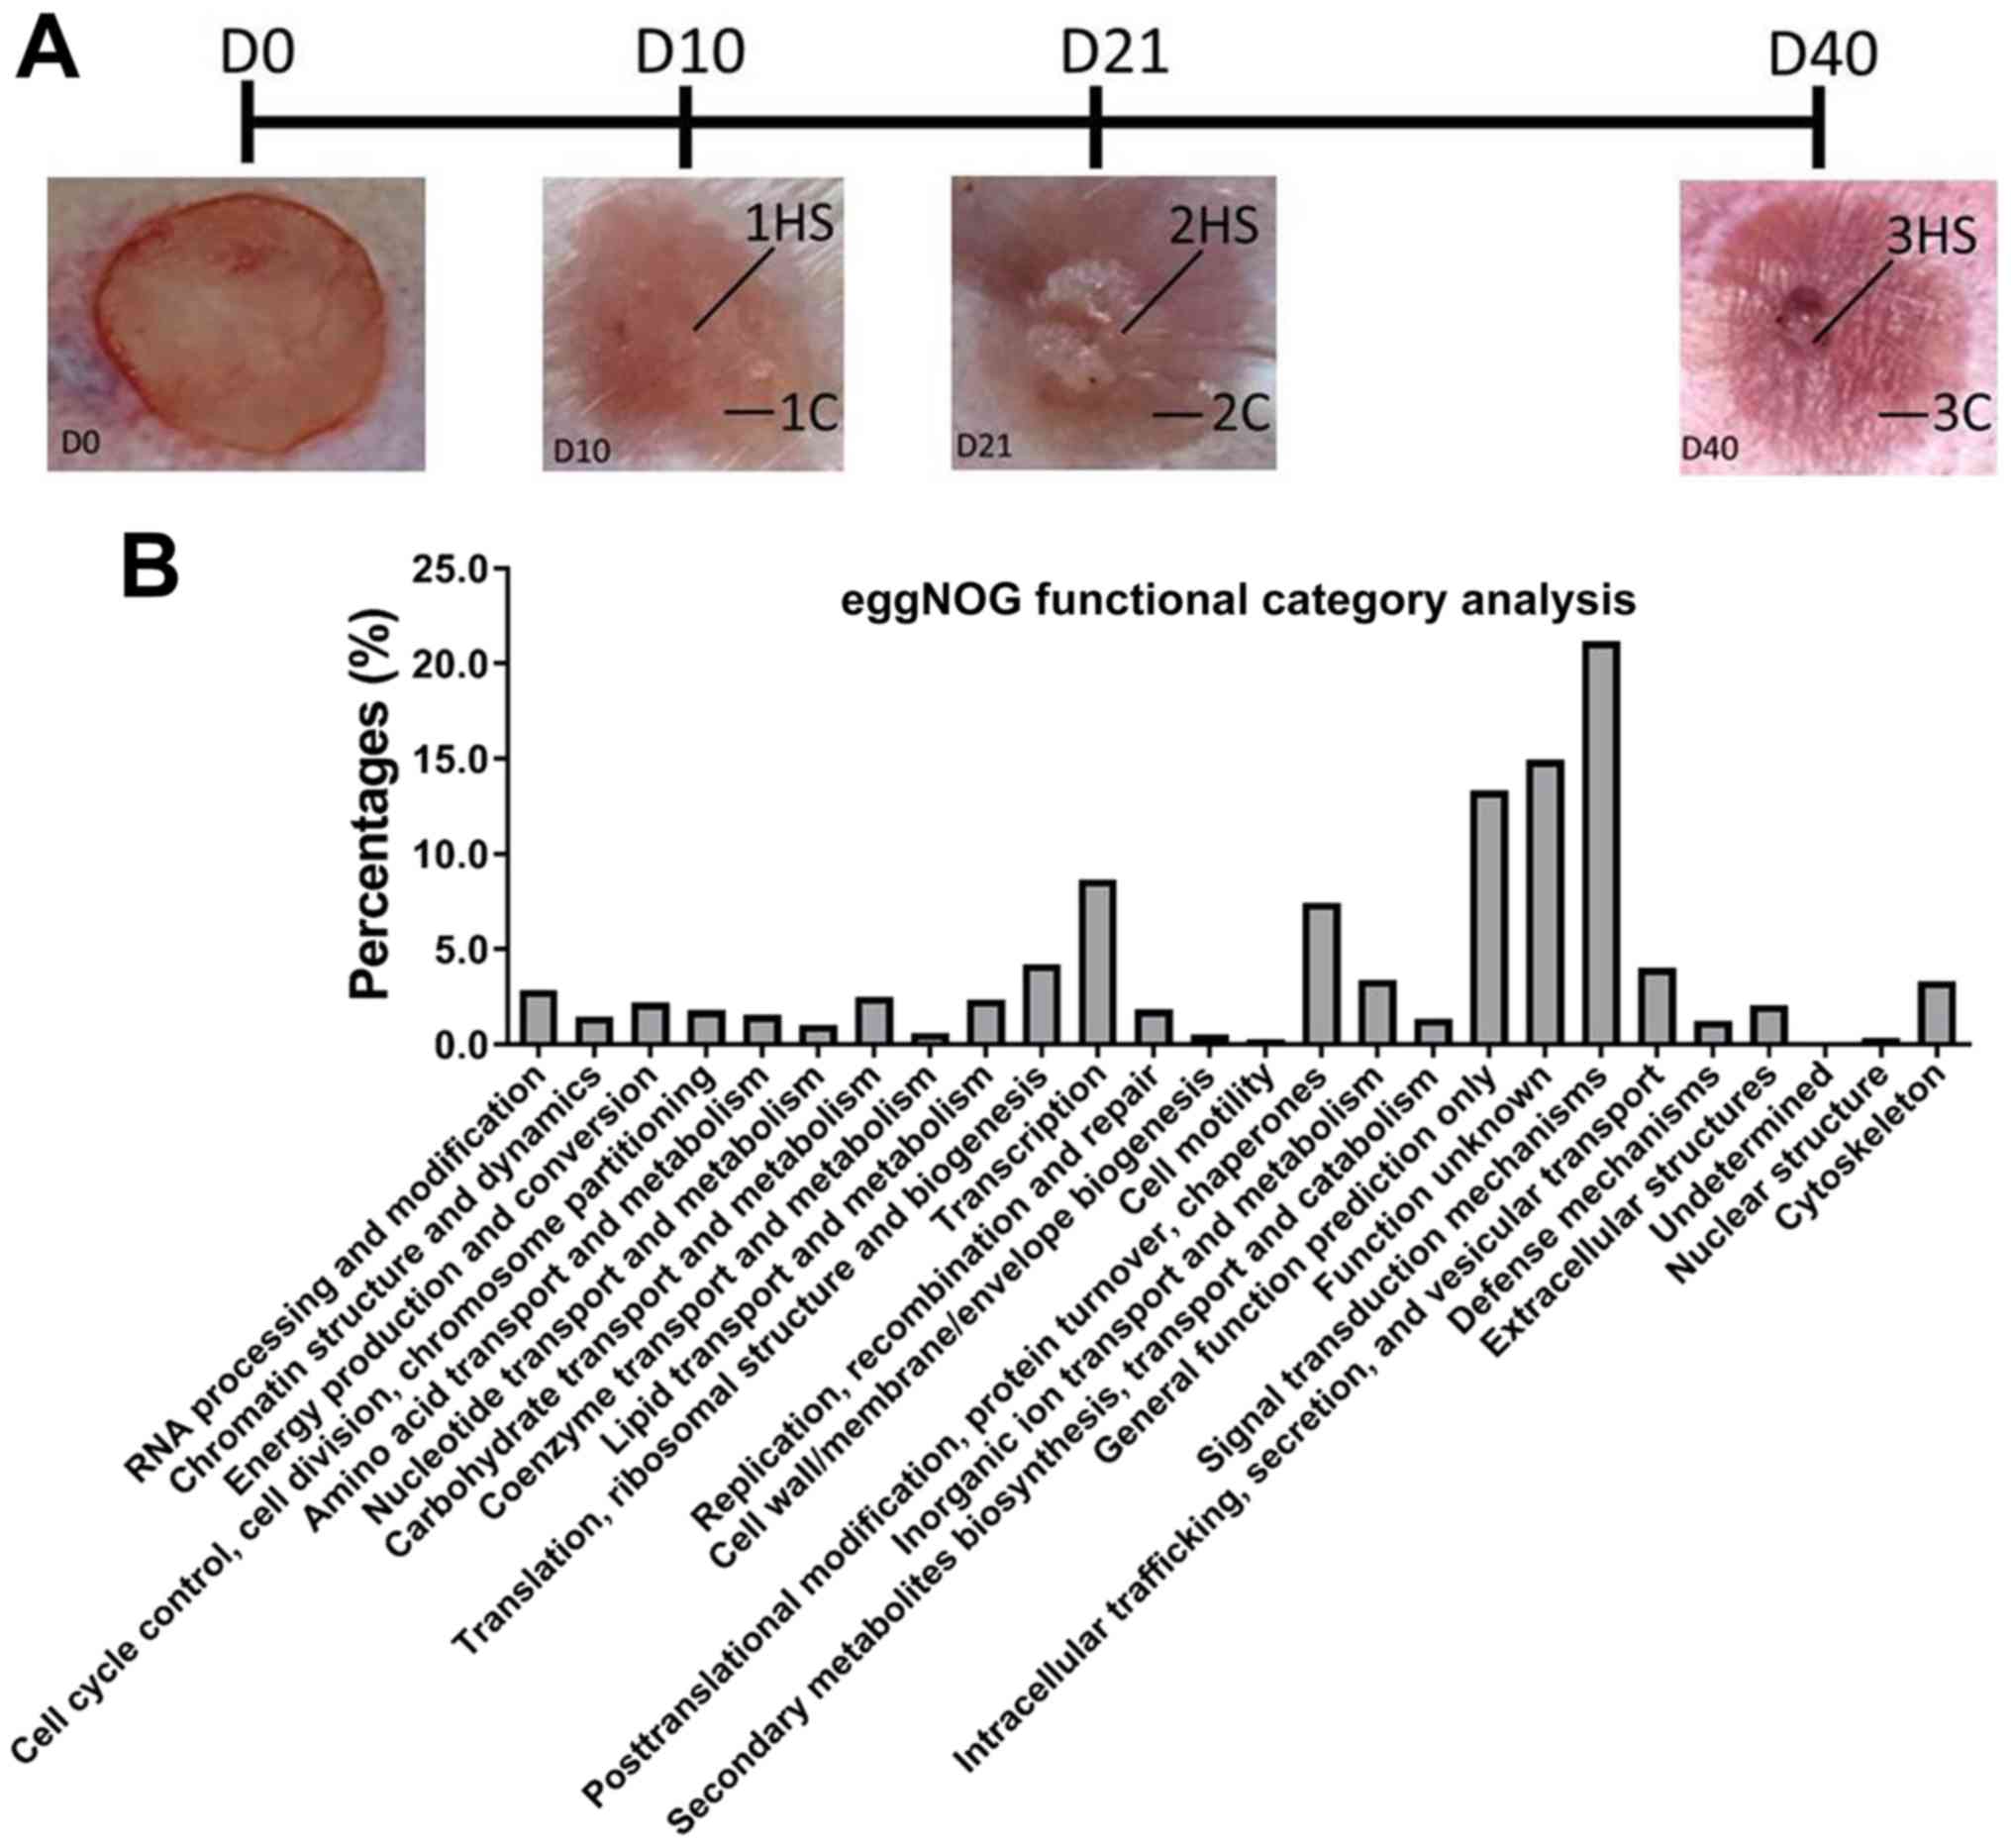
appearance of scarring (Stage 3) (6). At 10 (Stage 1), 21 (Stage 2) and 40
(Stage 3) days post-wounding the rabbits were sacrificed, and
hypertrophic scarring (HS; 1HS, 2HS and 3HS) tissues and
corresponding control (C) samples (1C, 2C and 3C) were collected,
snap frozen in liquid nitrogen and stored at -80˚C (Fig. 3A). The surrounding scars are as
control (C) samples (1C, 2C, 3C).
Hematoxylin & eosin (H&E)
staining and Masson's trichrome staining
H&E staining was performed as previously
described (16). Tissue samples with
mean border thickness of 1.9 mm were stored overnight in 10%
formalin at room temperature, dehydrated in ethanol, cleared in
xylene and paraffin embedded. Cross-sections (6 µm) were prepared
for staining with H&E and Masson's trichrome for histological
evaluation. Masson's trichrome staining was applied to examine
collagen deposition with a light microscope at x40 and x100
objective (Olympus).
RNA isolation
Total RNA was extracted using TRIzol®
reagent (Invitrogen; Thermo Fisher Scientific, Inc.) according to
the manufacturer's instructions. The isolated RNA was then treated
with DNase I (Thermo Fisher Scientific, Inc.) to remove the genomic
DNA. The quantity and quality of the RNA were assessed using
Agilent 2100 Bioanalyzer (Agilent Technologies, Inc.).
cDNA library construction, sequencing,
data filtering and alignment
In the present study, mRNA was enriched from total
RNA with magnetic beads with oligo-dT, and then mixed with 10X
fragmentation buffer (Enzymatics) to obtain short fragments of
200-300 nt. First-strand cDNA was synthesized from the fragments
with random hexamer primers, and then transformed into
double-strand cDNA using RNase H and DNA polymerase I (Takara Bio,
Inc.). Fragments of desirable lengths (200-300 bp) were purified
using the QIAquick PCR Extraction kit (Qiagen) and linked with
sequencing adaptors after end repair. Once inappropriate fragments
were removed using AMPure XP beads (Beckman Coulter, Inc.), the
sequencing library was constructed using PCR. The following
thermocycling conditions were used for the PCR: U-chain degradation
at 37˚C for 10 min; Initial denaturation at 98˚C for 30 sec; 12
cycles of 98˚C for 10 sec, 60˚C for 30 sec, 72˚C for 30 sec; and a
final extension step of 72˚C for 5 min. DNA fragments with ligated
adaptor molecules on both ends were selectively enriched using
Illumina PCR Primer Cocktail (Illumina, Inc.) in a 12-cycle PCR
reaction. The quantity, length and the distribution of the
fragments in the cDNA libraries were checked using PicoGreen
(Quantifluor™-ST fluorometer E6090; Promega Corporation)
and a fluorospectrometer (Quant-iT PicoGreen dsDNA Assay kit;
Invitrogen; Thermo Fisher Scientific, Inc.), and then quantified
with Agilent 2100 Bioanalyzer.
The libraries were diluted to 4-5 pM and sequenced
using the Illumina NextSeq™ 500 platform (Illumina,
Inc.). The raw reads were filtered by removing the adapter
sequences and the low-quality sequences (length <50 bp or Q
score <20). RNA-Seq data were aligned to the rabbit genome
(Oryctolagus_cuniculus.OryCun2.0.dna.toplevel.fa) using Bowtie 2
(http://tophat.cbcb.umd.edu/).
Gene functional annotation and
classification
The gene annotation was obtained from ENSEMBL
(http://ensemblgenomes.org/). The genes
were also annotated with the eggNOG database (http://www.ncbi.nlm.nih.gov/COG/; http://eggnog.embl.de/version_3.0/). DEGs with
2-fold up- or downregulation with a P-value <0.05, were
identified using HTSeq (http://www-huber.embl.de/users/anders/HTSeq) followed
by DESeq (http://www-huber.embl.de/users/anders/DESeq). The
volcano plot was used to visualize DEGs. For a further functional
understanding of the DEGs, Gene Ontology (GO) (http://www.geneontology.org/) annotations were
determined based on the GOSlim database (http://www.geneontology.org/). The Kyoto Encyclopedia
of Genes and Genomes (KEGG) database (version 90.1; http://www.genome.jp/kegg/) was utilized to achieve
pathway annotations.
Reverse transcription-quantitative PCR
(RT-qPCR)
mRNA in the total RNA was reverse transcribed using
a first strand cDNA synthesis kit (Toyobo Life Science) according
to the manufacturer's protocol. RT-qPCR reactions were performed
with SYBR Green Master Mix (Takara Bio, Inc.) on an Applied
Biosystems 7300 detection system (Applied Biosystems; Thermo Fisher
Scientific, Inc.). β-actin was utilized as an internal control. The
sequences of the primers used in the study were obtained from
https://pga.mgh.harvard.edu/primerbank/ and are shown
in Data S3. The following
thermocycling conditions were used for the PCR: Initial
denaturation at 94˚C for 30 sec; 35 cycles of 94˚C for 10 sec, 60˚C
for 10 sec, 72˚C for 10 sec; and a final extension step of 72˚C for
3 min. Expression levels of the different genes were analyzed using
the 2-ΔΔCq method (17).
Statistical analysis
The results from three experimental repeats were
presented as the mean ± standard deviation. Differences between
groups were analyzed with Student's t-test. P<0.05 was
considered to indicate a statistically significant difference. Data
were analyzed with SPSS 21.0 (IBM Corp.).
Results
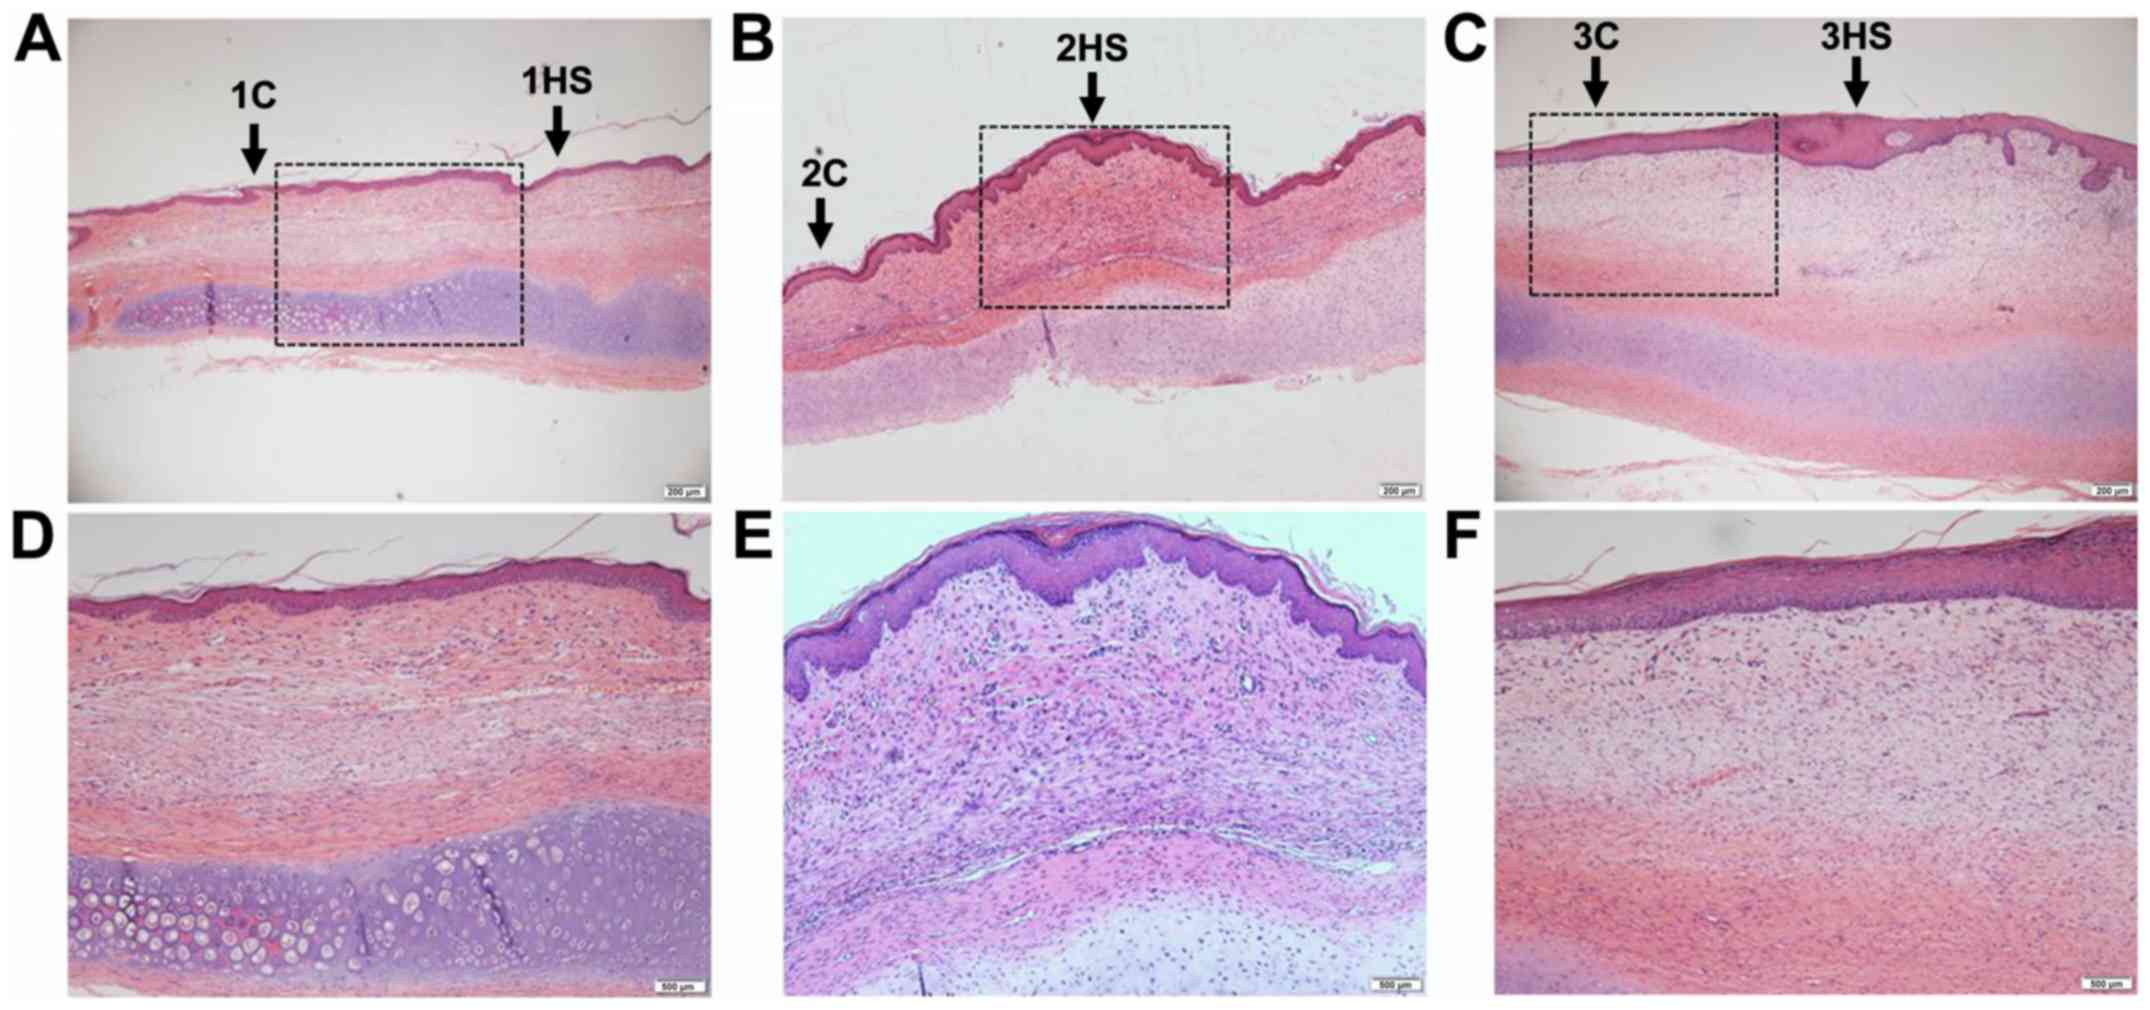
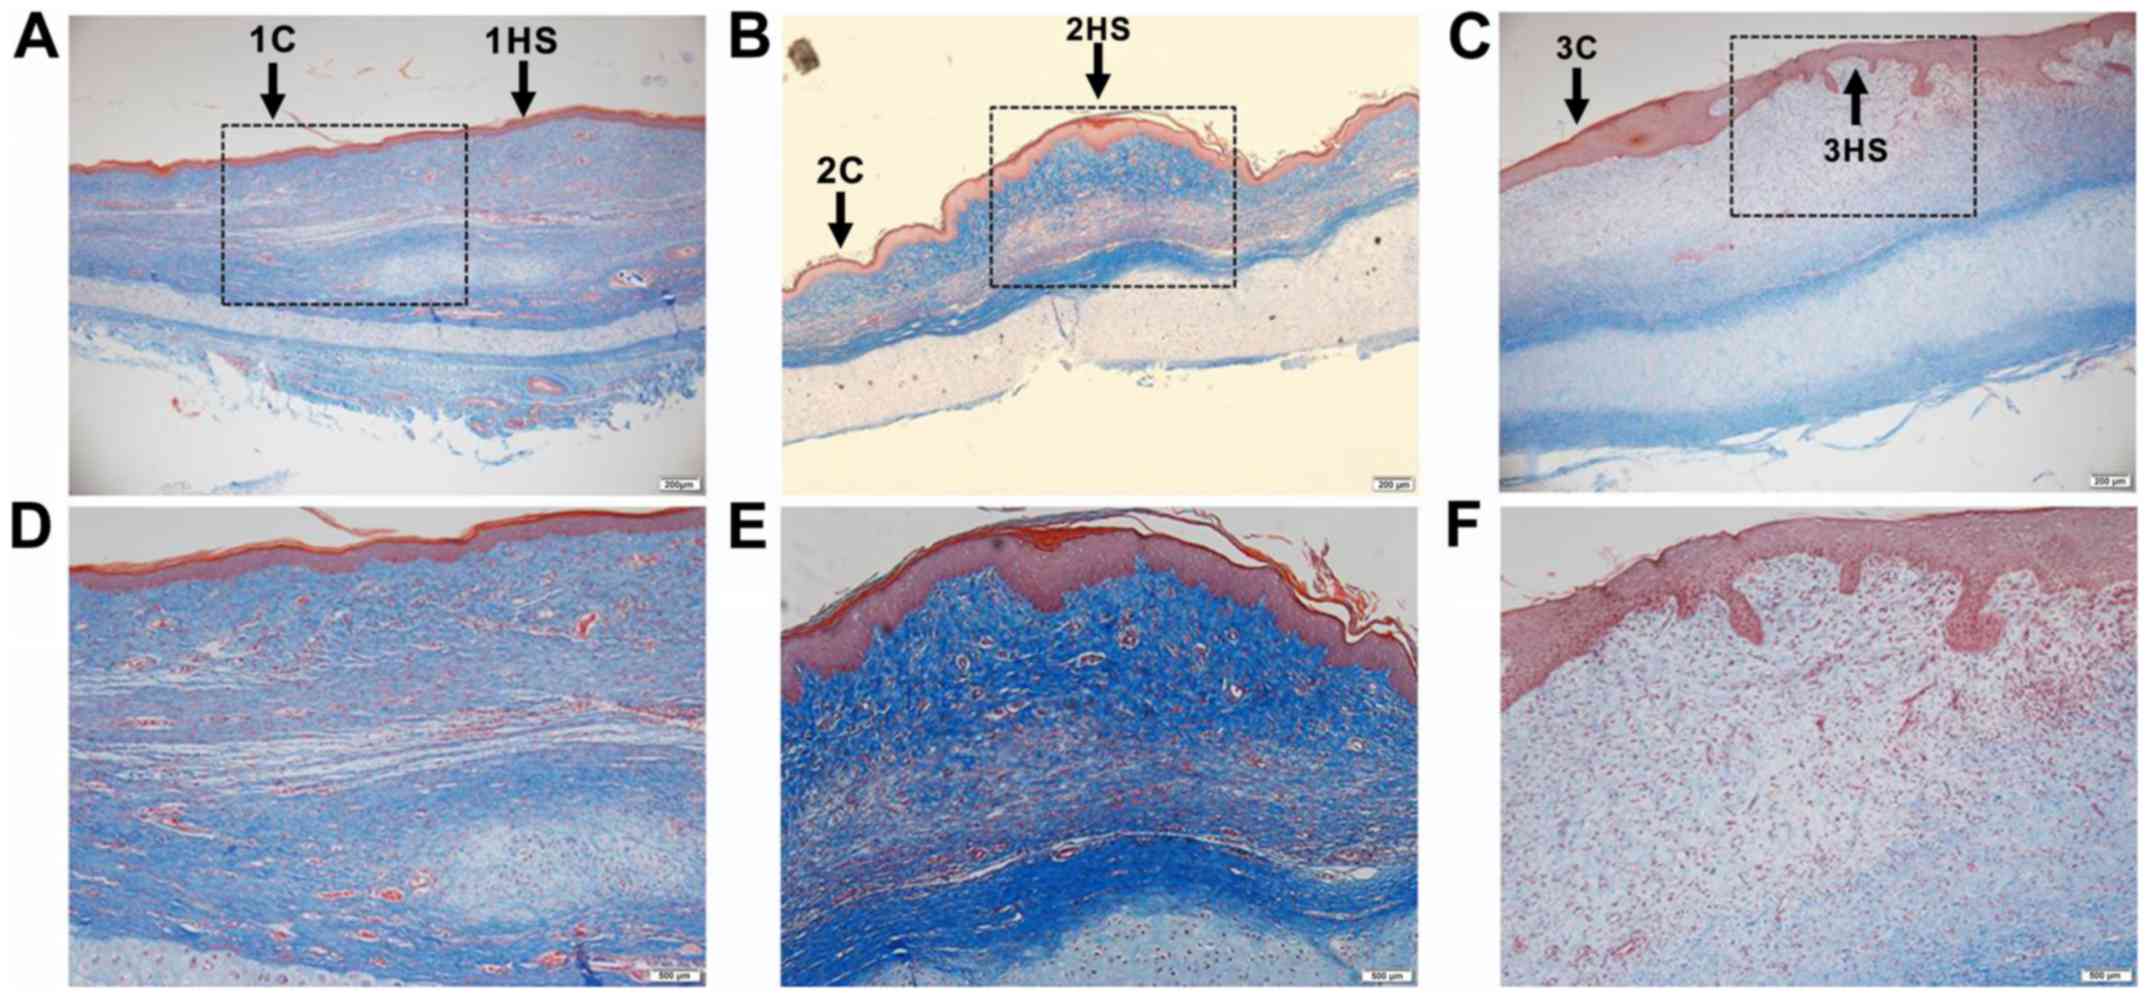
Histological staining of scars
H&E staining and Masson's trichrome staining
were performed on the tissues at different healing stages of the
rabbit ear wounds. In Figs. 1 and
2 it was observed that the
neovascularization and collagen synthesis at the inflammatory stage
increased, compared with the area outside the wound in each
corresponding sample, and inflammatory cells were scattered in
infiltration. Collagen synthesis in the proliferative stage was
increased and cell proliferation was observed as well. Collagen
synthesis in the tissue remodeling stage was decreased, and the
thickness of the epidermis in the latter two stages was thicker
than that in the former (Figs. 1 and
2).
RNA-Seq and mapping
In order to better understand the transcriptomes of
HS at different stages, high-throughput Illumina sequencing was
performed for RNA samples extracted from the HS and C samples at 10
(1HS and 1C), 21 (2HS and 2C) and 40 (3HS and 3C) days
post-wounding. The three stages are illustrated in Fig. 3A. From the RNA-Seq, a total of 223.4
million 150 bp paired-end raw reads were generated, with an average
of 37.2 million reads per sample (Q20 >90% and Q30 >82%).
After quality filtering, an average of 37.0 million clean reads per
sample remained, with utilization of ~99% of the reads. After
alignment to the rabbit genome, >70% mapped percentage was
achieved and the majority of reads were mapped to unique positions
(>94%; Table I).
 | Table IMapping results. |
Table I
Mapping results.
| Sample | Useful reads | Map events count | Mapped reads | Mapped, % | Multiple mapped
reads | Multiple mapped,
% | Uniquely mapped
reads | Uniquely mapped,
% |
|---|
| 1HS | 38,267,666 | 31,678,684 | 28,051,392 | 73.30 | 1,592,461 | 5.68 | 26,458,931 | 94.32 |
| 1C | 38,590,244 | 31,198,001 | 28,285,531 | 73.30 | 1,366,137 | 4.83 | 26,919,394 | 95.17 |
| 2HS | 39,054,466 | 30,707,726 | 28,477,397 | 72.92 | 1,063,918 | 3.74 | 27,413,479 | 96.26 |
| 2C | 35,269,558 | 28,070,605 | 26,132,568 | 74.09 | 990,225 | 3.79 | 25,142,343 | 96.21 |
| 3HS | 35,543,910 | 28,868,026 | 26,660,182 | 75.01 | 1,004,164 | 3.77 | 25,656,018 | 96.23 |
| 3C | 35,078,178 | 28,628,227 | 26,151,005 | 74.55 | 1,096,865 | 4.19 | 25,054,140 | 95.81 |
Annotation and classification of
unigenes
A total of 17,386 unigenes (73.5%) were annotated
using the eggNOG Functional Category database (18). All of these unigenes were matched to
25 eukaryotic orthologous groups (Fig.
3B). The largest category was ‘signal transduction mechanisms’
(3,785; 20.99%). ‘Function unknown’ (2,663; 14.77%) and ‘general
function prediction only’ (2,371; 13.15%) were the second and third
largest categories, respectively.
Identification of DEGs
Genes that exhibited >2-fold differential
expression with a P-value <0.05 were then defined as the DEGs.
The hierarchical clusters separated DEGs according to their
expression levels (Fig. 4A). The
volcano plots showed the difference in expression levels of
unigenes in HS and C tissues of each stage; the blue dots represent
the number of DEGs (Fig. 4B-D). A
total of 514, 413 and 305 DEGs were identified at days 10, 21 and
40 post-wounding, respectively Compared with the corresponding C
group (1C, 2C and 3C), there were 261 upregulated DEGs at day 10,
141 at day 21 and 247 at day 40 post-wounding, as well as 253
downregulated DEGs at day 10, 272 at day 21 and 58 at day 40
post-wounding.
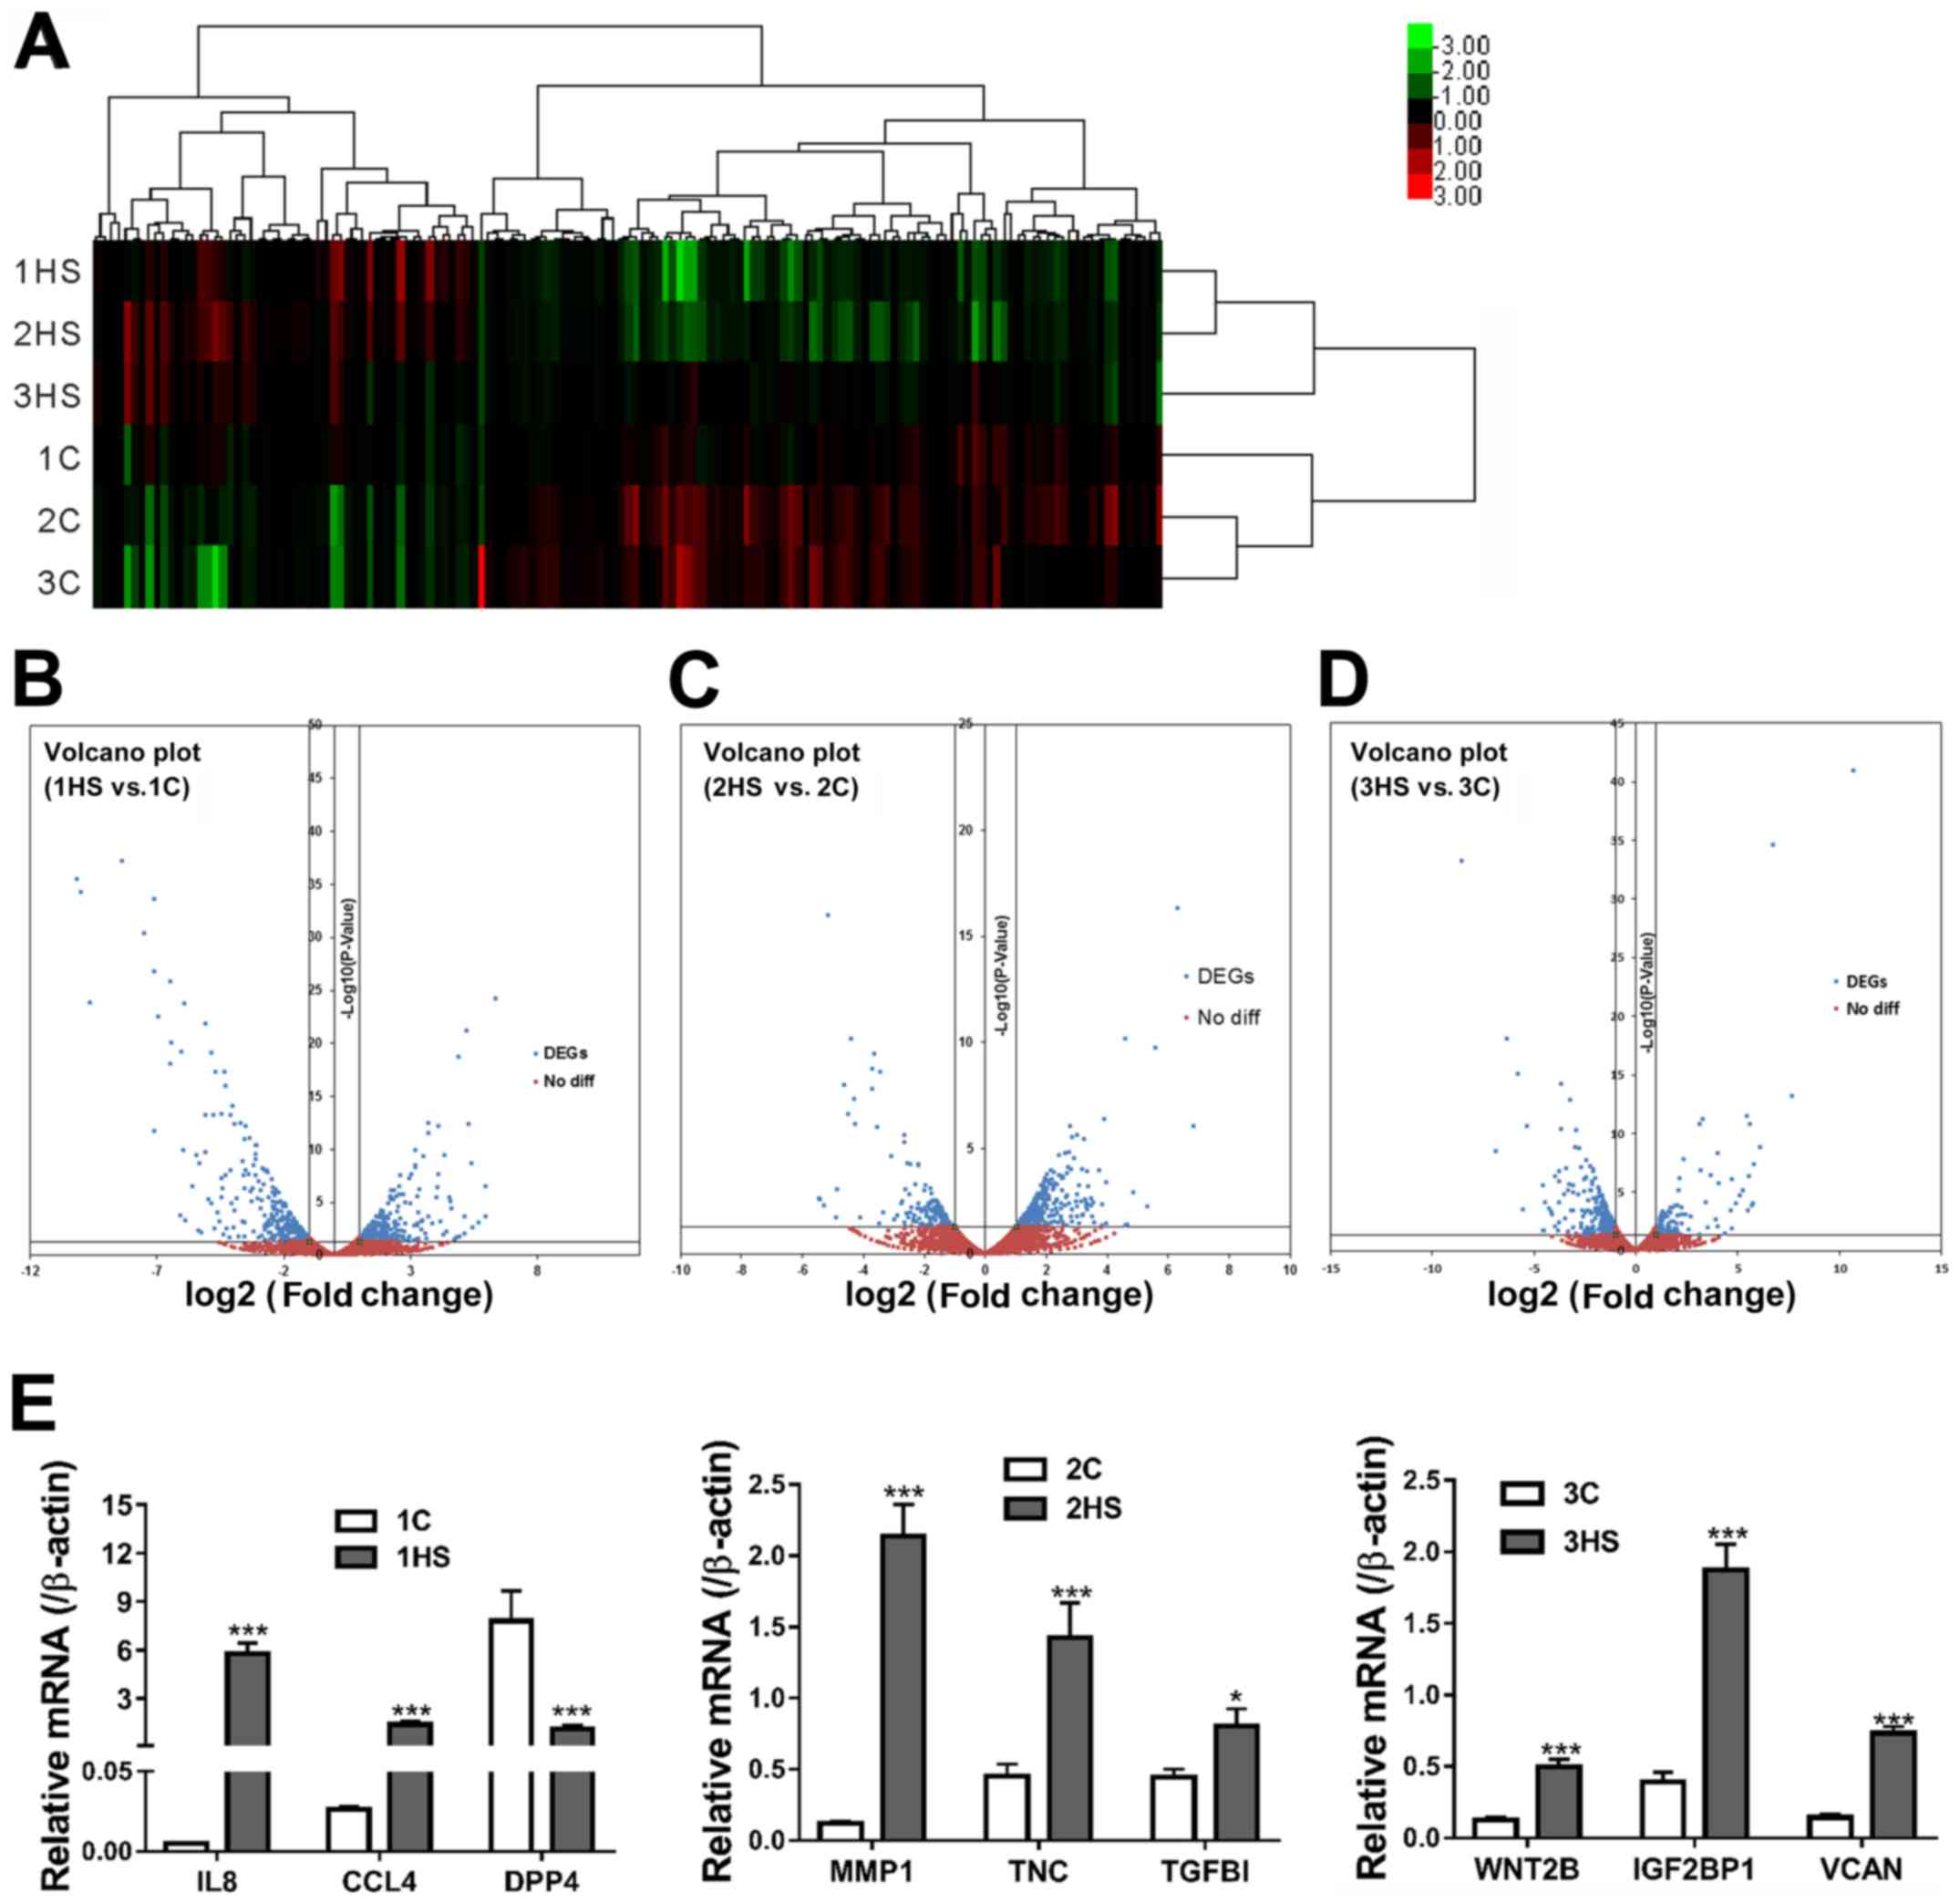 | Figure 4Identification of DEGs. (A) A heat map
shows hierarchical clustering of gene expression in different
samples. (B-D) Volcano plots depict fold changes (log2, x-axis) in
individual gene expression in HS tissues (1HS, 2HS and 3HS) vs.
corresponding C samples (1C, 2C and 3C), and statistical
significance [-log10 (P-value), y-axis]. (E) Validation of
RNA-sequencing data by reverse transcription-quantitative PCR.
*P<0.05, ***P<0.001 vs. respective C.
DEGs, differentially expressed genes; HS, hypertrophic scarring; C,
control; IL8, interleukin-8; CCL4, C-C motif chemokine ligand 4;
DPP4, dipeptidyl peptidase 4; MMP-1, matrix metalloproteinase-1;
TNC, tenascin C; TGFβ1, transforming growth factor β-1; WNT2B, Wnt
family member 2B; IGF2BP1, insulin-like growth factor 2
mRNA-binding protein 1; VCAN, versican; diff, difference. |
To validate data, DEGs at Stage 1 [IL8, C-C motif
chemokine ligand 4 (CCL4) and dipeptidyl peptidase 4 (DPP4)], Stage
2 [MMP1, tenascin C (TNC) and transforming growth factor β-1
(TGFB1)] and at Stage 3 [Wnt family member 2B (WNT2B), insulin-like
growth factor 2 mRNA-binding protein 1 (IGF2BP1) and versican
(VCAN)] were randomly picked for RT-qPCR analysis. As shown in
Fig. 4E, nine significantly
differentially expressed genes were randomly selected for
validation experiments. Changes in the expression levels of
detected genes by RT-qPCR were consistent with the results of
RNA-Seq.
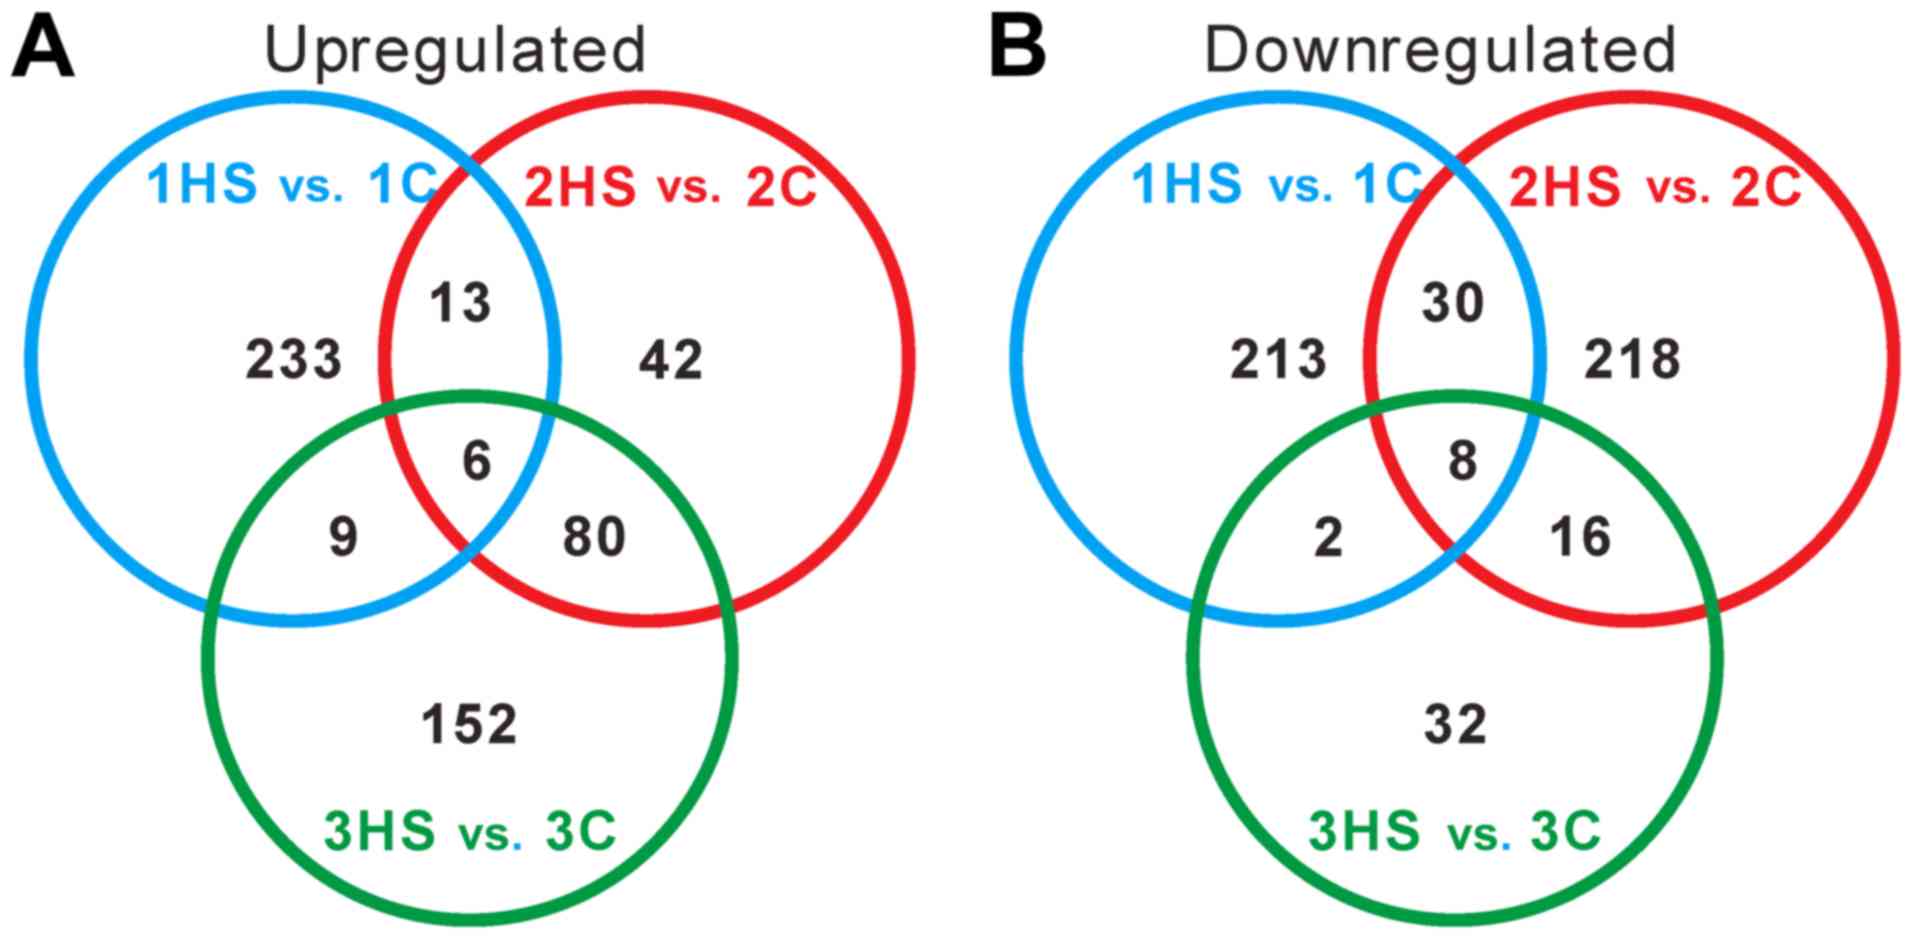
To further identify genes showing a significant
change in expression level during different stages, Venn diagrams
were constructed (Fig. 5). Only 6
and 8 DEGs were upregulated and downregulated in all three stages,
respectively. The data suggested that the DEGs were varied during
different stages.
Classification of DEGs
To determine the function terms in which DEGs were
significantly enriched, GO function enrichment analysis was carried
out. All DEGs were mapped into three main categories (molecular
function, cellular component and biological process) in the GOSlim
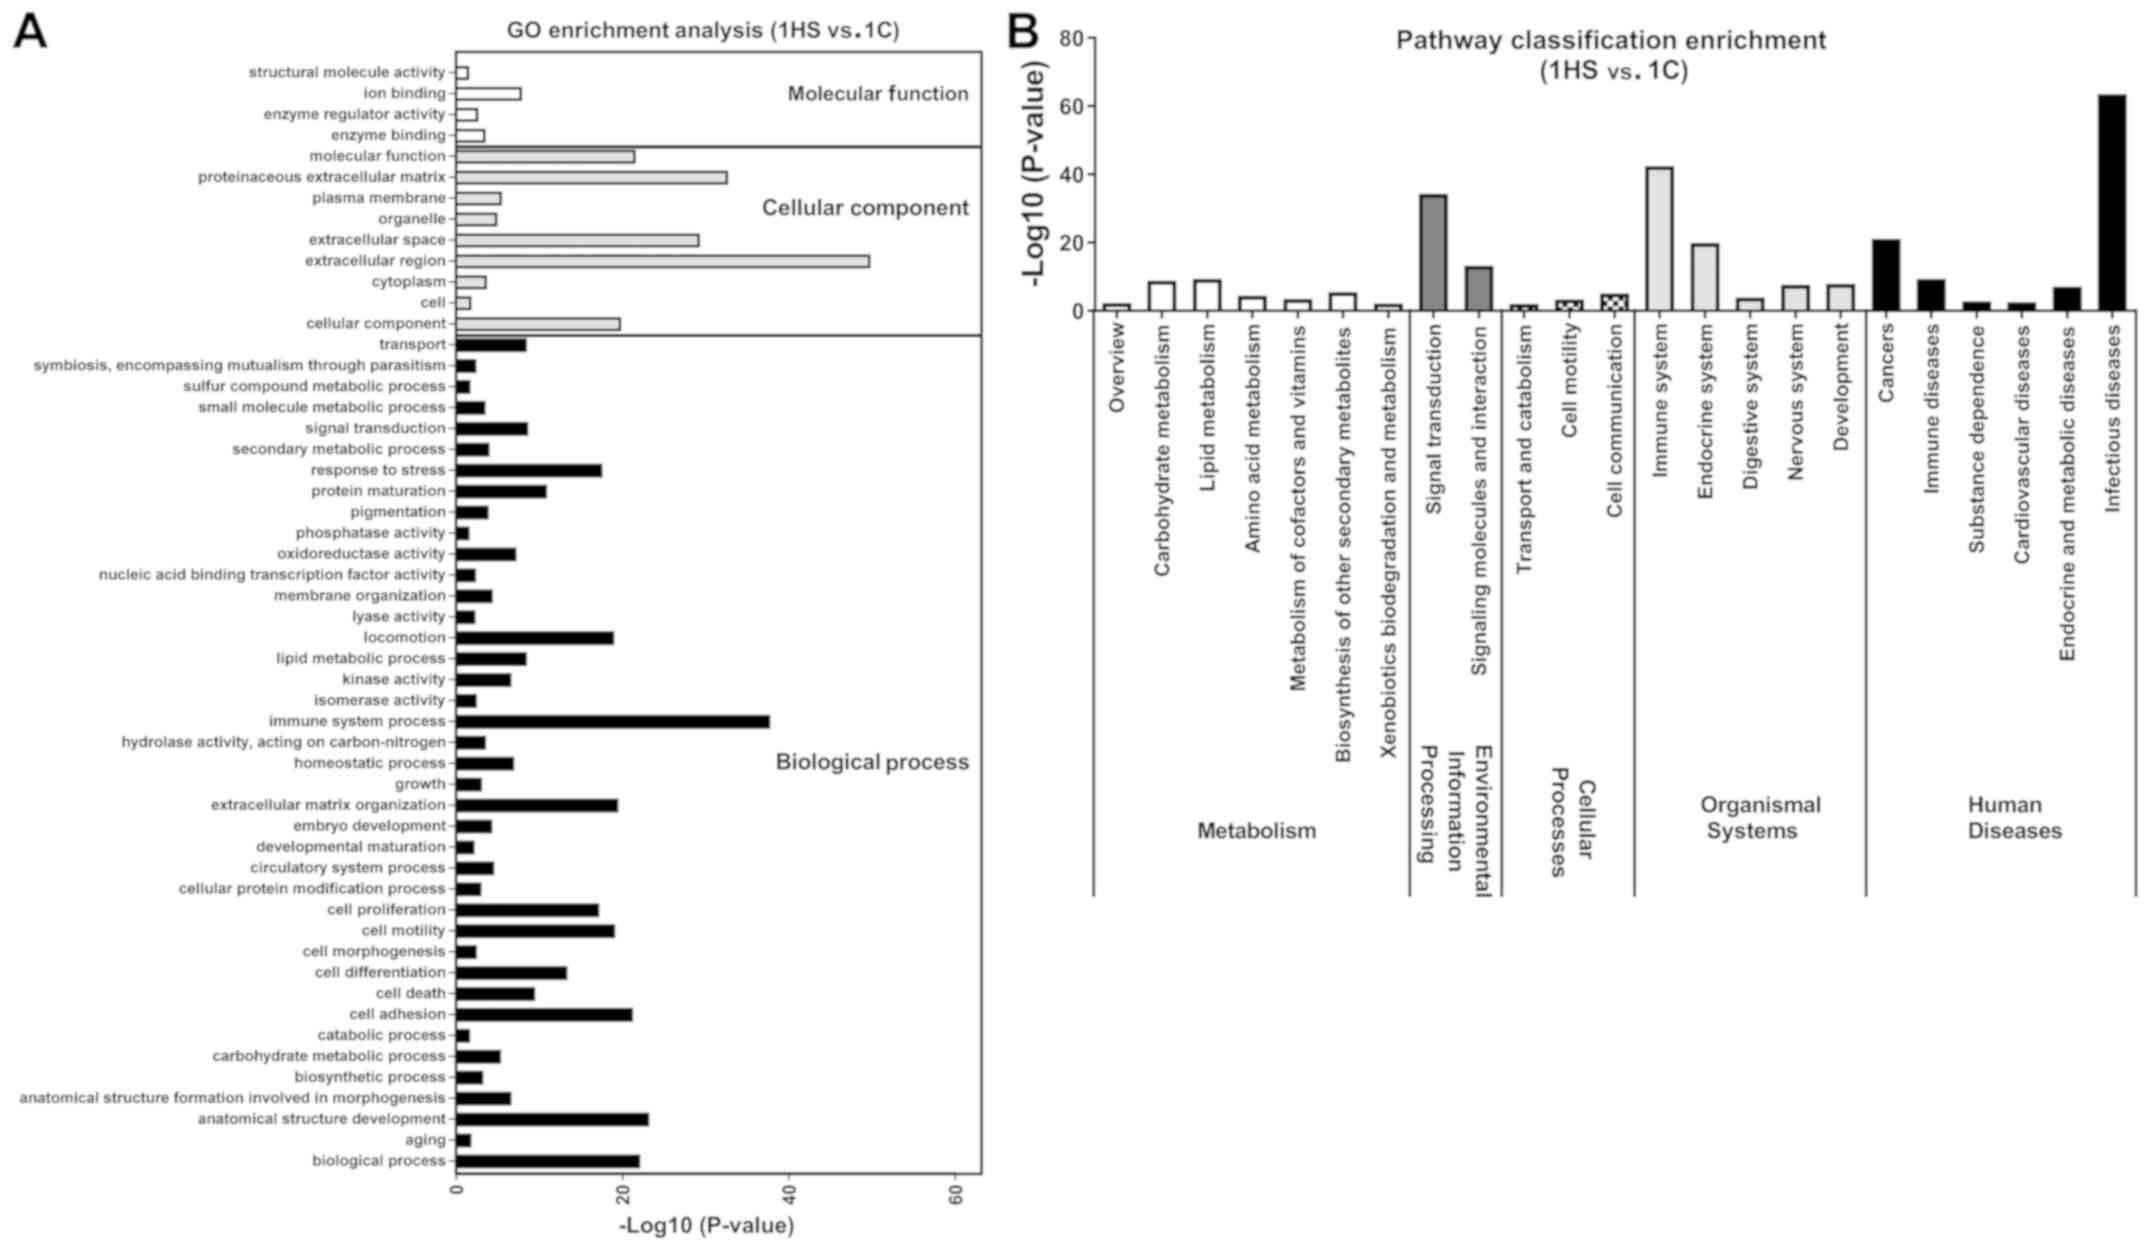
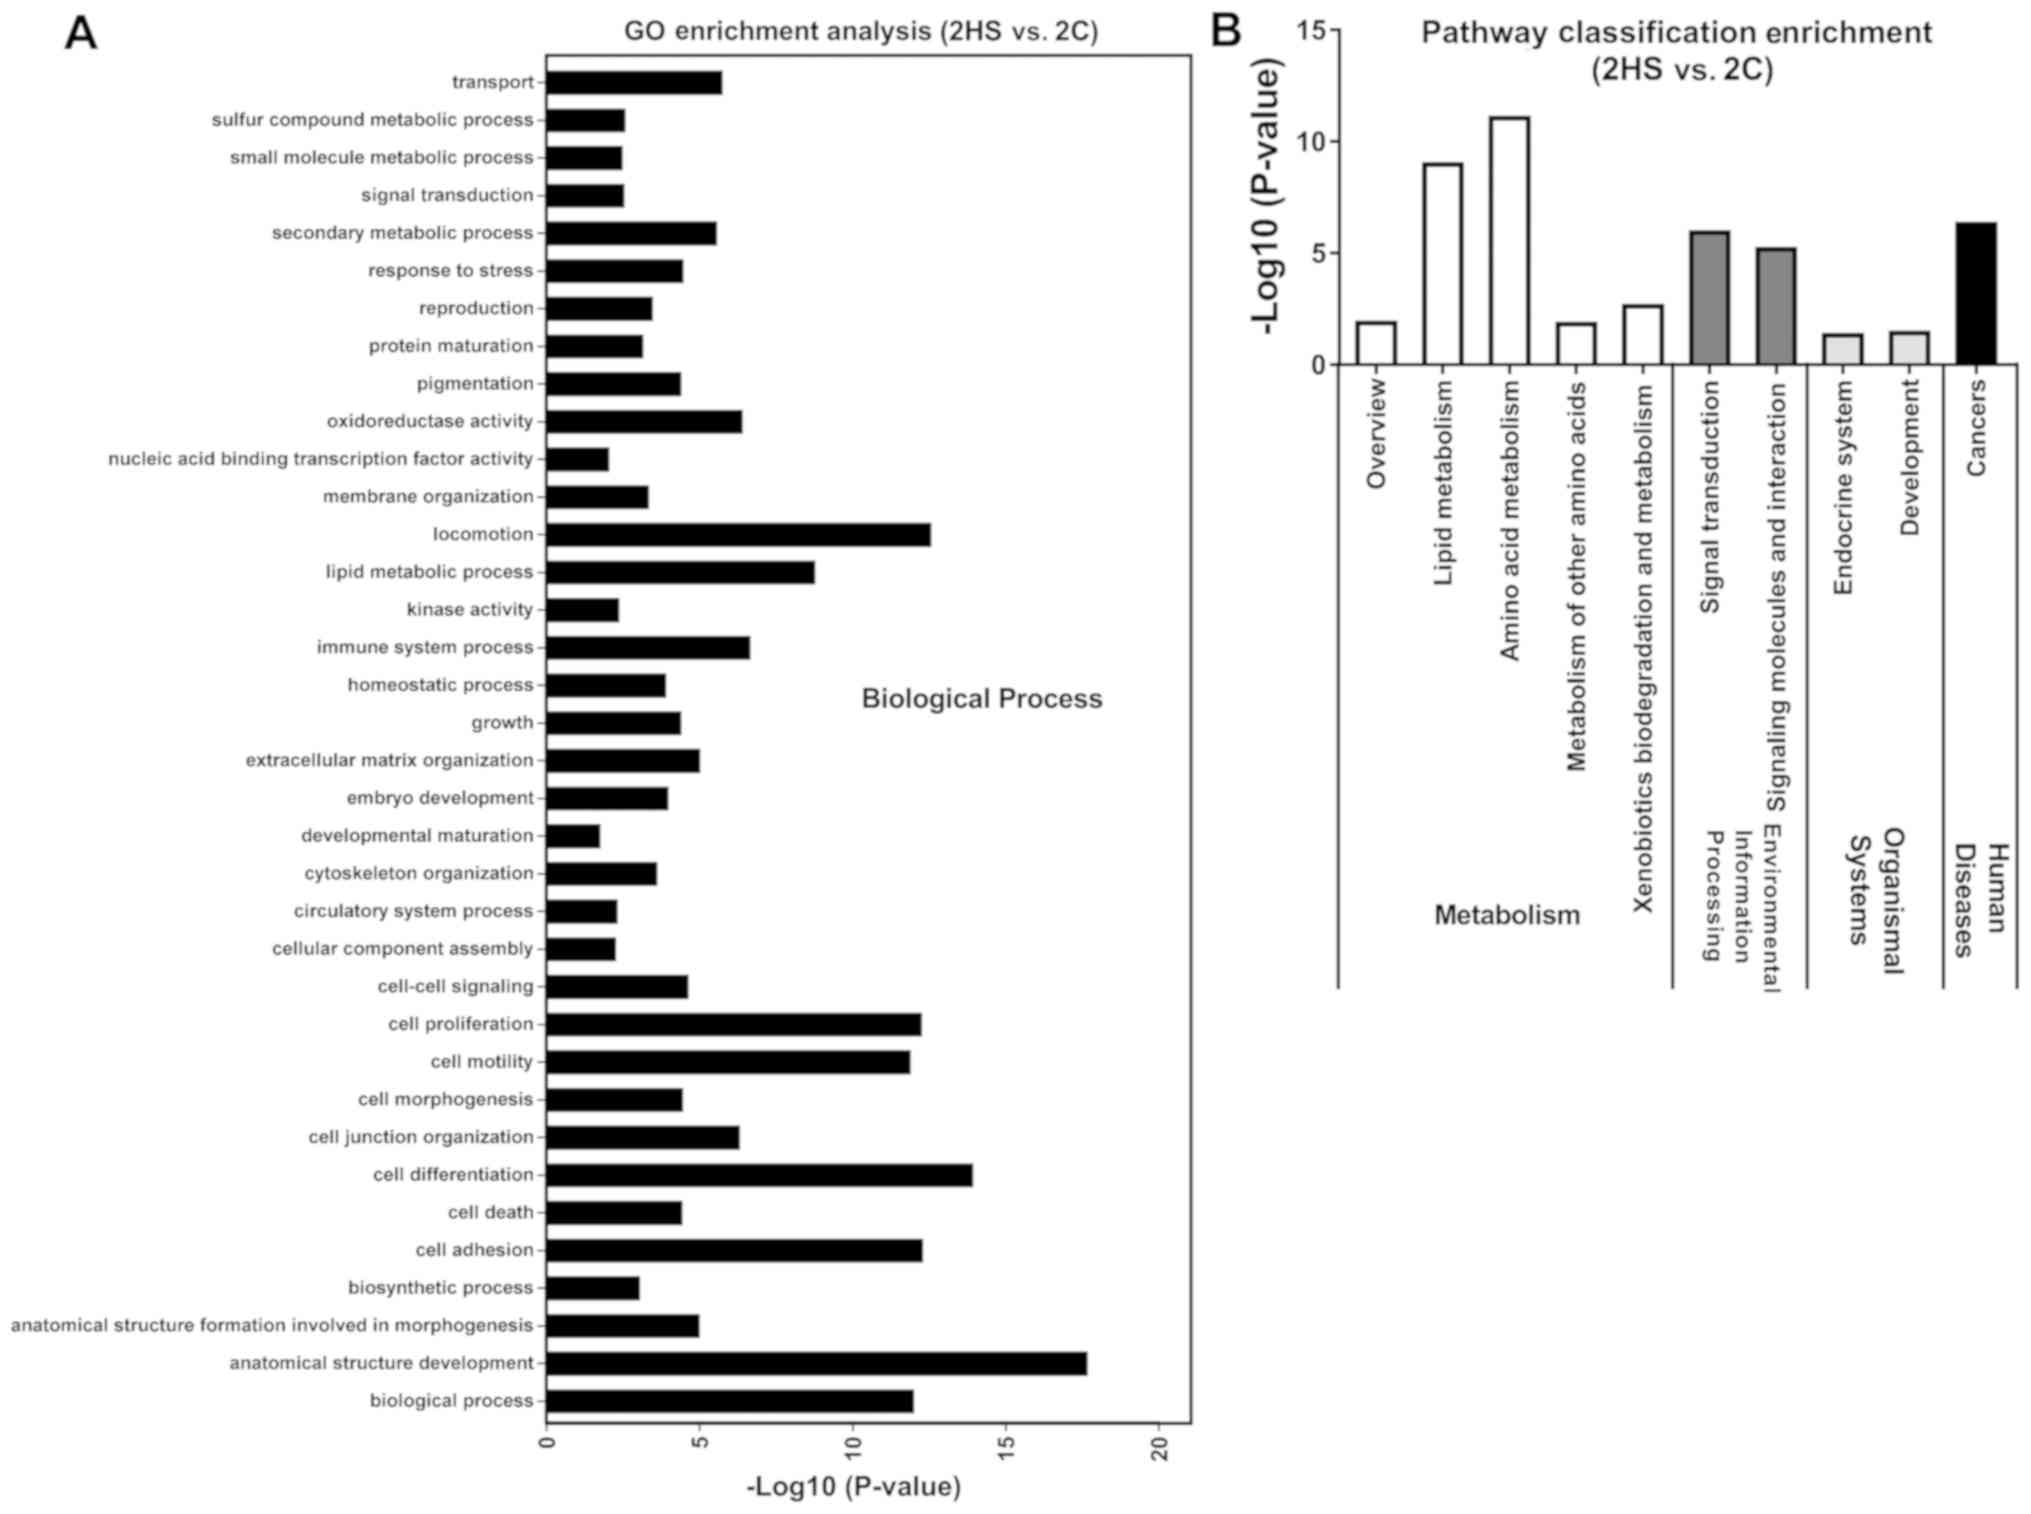
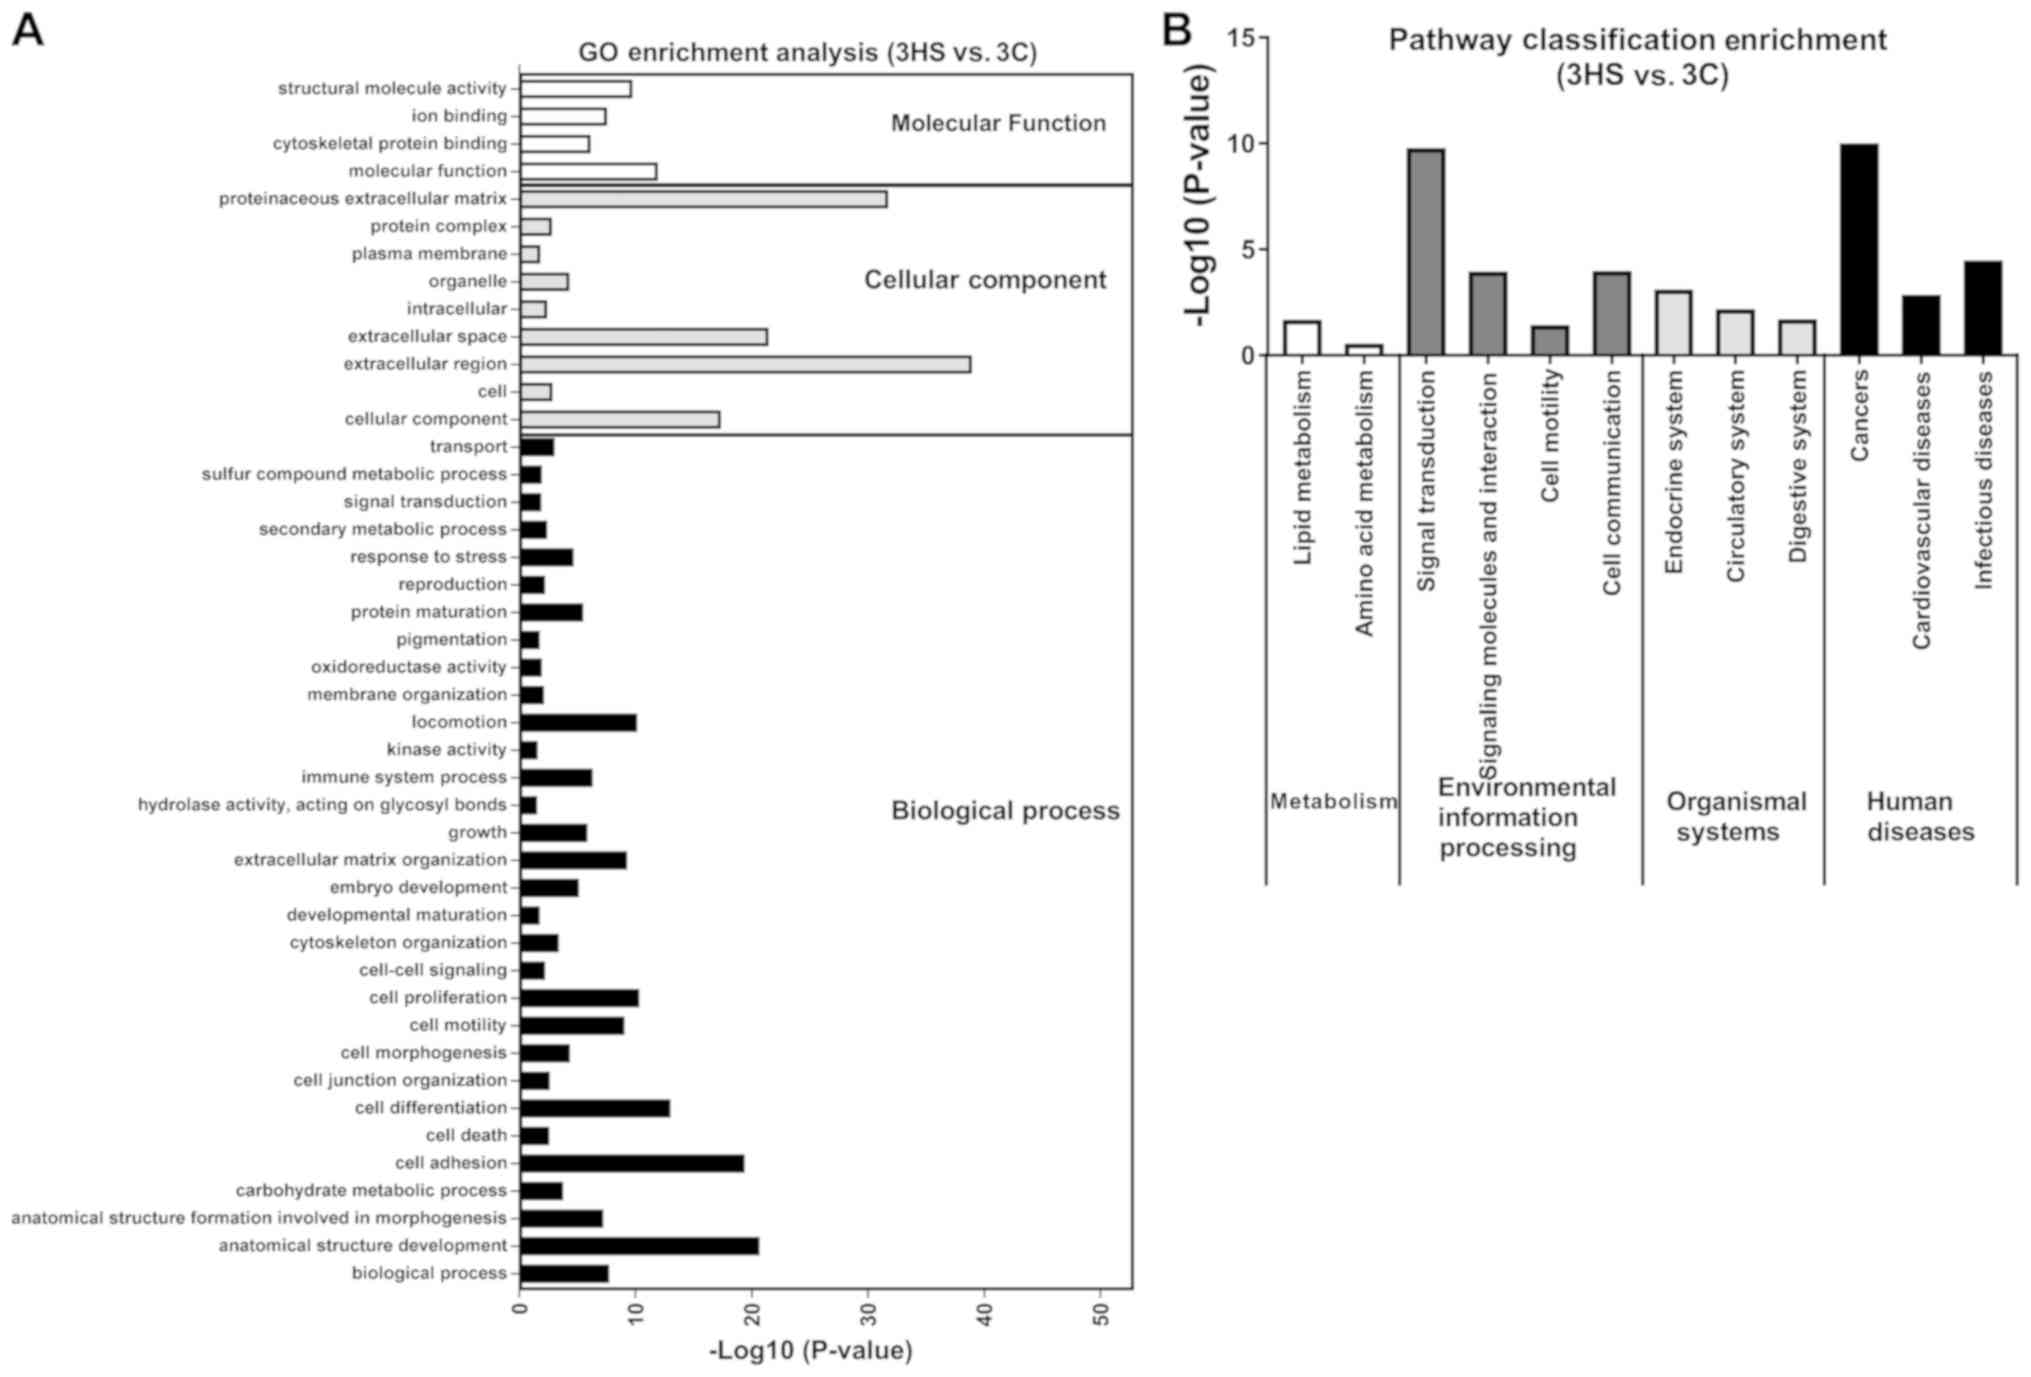
database. As illustrated in Figs.
6-8, 53 GO terms at 10 (Stage 1), 36 at 21 day (Stage 2), and
44 at 40 days post-wounding (Stage 3) were significantly enriched
in DEGs (P<0.05). At Stage 1, ‘extracellular region’, ‘immune
system process’ and ‘proteinaceous extracellular matrix’ were
notably enriched in DEGs (Fig. 6A);
at Stage 2, ‘anatomical structure development’, ‘cell
differentiation’, ‘locomotion’, ‘cell adhesion’, ‘cell
proliferation’, ‘biological process’ and ‘cell motility’ were
markedly enriched in DEGs (Fig. 7A);
at Stage 3, ‘extracellular region’, ‘proteinaceous extracellular
matrix’ and ‘extracellular space’ were significantly enriched in
DEGs (Fig. 8A).
KEGG pathway enrichment analysis was performed to
identify the significant pathways associated with the DEGs. There
were 23 pathways at day 10, 10 at day 21 and 12 at day 40 of
post-wounding that were significantly enriched in DEGs (P<0.05;
Figs.
6-8). These KEGG pathways were associated with ‘metabolism’,
‘environmental information processing’, ‘organismal systems’, and
‘human diseases’. At Stage 1, ‘infectious diseases’ were markedly
enriched in DEGs (Fig. 6B); at Stage
2, ‘amino acid metabolism’ and ‘lipid metabolism’ were also
enriched in DEGs (Fig. 7B); at Stage
3, ‘cancers’ and ‘signal transduction’ were significantly enriched
in DEGs (Fig. 8B). The present data
suggested that the functions of DEGs were varied during different
stages.
Identification of signaling
pathways
Through further analysis of the differences in
signaling pathways in different stages, it was identified that
among several differently expressed signaling pathways from the
proliferative stage to the tissue remodeling stage, the expressions
of Wnt2B, Wnt-5, secreted frizzled-related protein 4 (SFRP4) and
dishevelled binding antagonist of β catenin 2 (DACT2) genes,
related to the Wnt/β-catenin signaling pathway, were significantly
different. The expression of Wnt 2B and Wnt-5 in the hypertrophic
scar was several times higher than that in the remodeling scar.
However, the expression of SFRP4, an antagonist of the Wnt
signaling pathway, was significantly higher in the remodeling scar
than that in HS (Data S1 and
S2). In contrast to scars in the HS
region, the differences in the expression were more significant in
the normal receding surrounding scars (Table II).
| Table IIDifferential expression of
Wnt/β-catenin signaling pathway-related genes in different stages
of scarring. |
Table II
Differential expression of
Wnt/β-catenin signaling pathway-related genes in different stages
of scarring.
| | Proliferation
stage/tissue remodeling stage |
|---|
| Gene | Control
samples | P-value | HS | P-value |
|---|
| Wnt2B | 3.371 | 0.032 | - | - |
| Wnt-5 | 4.348 | 0.000 | 2.941 | 0.014 |
| SFRP4 | 0.0267 | 0.000 | 0.140 | 0.013 |
| DACT2 | 0.071 | 0.000 | - | - |
Discussion
The roles of various fibrotic and anti-fibrotic
molecules in the formation of HS have been studied (5,9,11). In the present study, an animal model
of HS using rabbit ears was established and was then analyzed using
RNA-Seq for both HS and C samples at different stages. To the best
of the authors' knowledge, this is the first investigation on the
gene expression profiling of HS using the RNA-Seq technique. A
total of 17,386 unigenes were functionally annotated to the eggNOG
database. ‘Signal transduction mechanisms’ was the largest
category, which indicated that the unigenes were mainly involved in
regulating signal transduction post-wounding. A total of 514, 413
and 305 DEGs were identified at days 10, 21 and 40 post-wounding,
respectively, compared with the corresponding C group (1C, 2C and
3C). RT-qPCR assays validated the RNA-Seq results. Several DEGs
have been linked to the pathogenesis of HS, such as TGFβ1(4), connective tissue growth factor
(4), CXCR3(8), CXCR4(7),
IL8, DPP4(19), toll like receptor
4(9), TNC (8), VCAN (20), MMP1 and MMP9 (10,11).
Numerous genes, such as CCL4, WNT2B, IGF2BP1, fatty acid
binding-protein 9 and cadherin 20 have not previously been studied
in HS, to the best of the authors' knowledge. The data suggested
the robustness of RNA-Seq in quantifying and annotating
transcriptomes. The present results suggested that the inflammatory
reaction and immune response were the main reactions in the wound
healing process, which was consistent with the human wound healing
process, and also demonstrated the reliability of the results of
the transcriptional analysis.
The hierarchical clusters and Venn diagrams
indicated that the identified DEGs were varied among different
stages. Furthermore, the GO function enrichment and KEGG pathway
enrichment analyses on these DEGs provided information for
understanding the molecular mechanisms of HS pathogenesis. A total
of three stages, including inflammation, proliferation and tissue
remodeling, were defined during wound healing and scarring
(1). At Stage 1, DEGs were enriched
in GO terms and KEGG pathways involved in ‘immune system process’,
‘proteinaceous extracellular matrix’, which is consistent with that
the initial stage of healing, that includes cell migration and
inflammation (21). Cell
proliferation, angiogenesis and matrix synthesis occurred,
following the initial stage of healing (1). As hypothesized at Stage 2, DEGs were
enriched in GO terms and KEGG pathways involved in ‘anatomical
structure development’, ‘cell differentiation’, ‘cell adhesion’,
‘cell proliferation’, ‘cell motility’, ‘amino acid metabolism’ and
‘lipid metabolism’. In the tissue remodeling phase of wound
healing, inflammatory cells and mesenchymal cells underwent
apoptosis with a reduction in vascularity and collagen synthesis.
It was identified that DEGs were enriched in the functions
associated with ‘cancers’, ‘proteinaceous extracellular matrix’,
and ‘signal transduction’ at Stage 3. Moreover, other GO terms and
KEGG pathways were enriched at each stage, which provided
comprehensive expression and functional profiles during the
formation of HS.
To identify more effective treatment methods for
patients with HS, the differences in the molecular signaling
pathway between HS and remodeled scars were compared to explore the
breakthrough point to promote the regression of HS. The differences
in the Wnt/β-catenin signaling pathway related to gene expression
were highly significant in scar transition from the proliferative
stage to the tissue remodeling stage. The expressions of Wnt-2 and
Wnt-5 in HS were several times higher than that in tissue
remodeling scars, while the expression of SFRP4 in hypertrophic
scars was notably lower than that in tissue remodeling scars, and
the difference was more significant in the C samples than in HS. As
an antagonist of Wnt ligands, SFRP4 can inhibit the classical Wnt
signaling pathway (22). SFRP4 was
first found to be upregulated in increased apoptosis in C3H/10T½
cells (23). Several tumors, such as
endometrial, cervical, ovarian, prostate, bladder, colorectal,
mesothelioma, pancreatic, renal and esophageal are characterized by
aberrant promoter hypermethylation, which causes variations in the
expression levels of SFRP4 when compared to normal cells (24). Upregulated SFRP4 alleviated
myocardial fibrosis induced by ischemic injury and improved
myocardial function (25), and
inhibited angiogenesis in vivo and in vitro (26). These previous results suggested that
the Wnt signaling pathway may play a pivotal role in the transition
from HS to the tissue remodeling stage, and regulation of the Wnt
signaling pathway may promote the regression of HS.
In summary, gene expression profiling in HS and C
samples demonstrated significant differences in transcriptional
levels among different stages of HS. Novel DEGs were also
identified during the formation of HS. Furthermore, GO terms and
KEGG pathways identified differences in biological pathways and
processes among different stages. The Wnt signaling pathway was
found to play an important role in the regression of HS. The
present study provided insight for the comprehensive understanding
of the mechanisms of HS formation and might be helpful in the
development of potential therapeutic treatments for individuals
with HS following injury.
Supplementary Material
Data S1
Data S2
Data S3
Acknowledgements
Not applicable.
Funding
The present study was supported by The Shanghai
Natural Science Foundation (grant no. 15ZR1413500).
Availability of data and materials
The datasets used and/or analyzed during the current
study are available from the corresponding author on reasonable
request.
Authors' contributions
JZ and MS performed the experiments. MS drafted the
manuscript. JZ revised the manuscript. YW and HB analyzed the data.
CX and JZ designed the study. All authors read and approved the
final manuscript.
Ethics approval and consent to
participate
All animal experiments were approved by The
Institutional Animal Care and Use of The Second Military Medical
University.
Patient consent for publication
Not applicable.
Competing interests
The authors declare that they have no competing
interests.
References
|
1
|
Zhu Z, Ding J, sky Shankowsky HA and
Tredget EE: The molecular mechanism of hypertrophic scar. J Cell
Commun Signal. 7:239–252. 2013.PubMed/NCBI View Article : Google Scholar
|
|
2
|
Aarabi S, Longaker MT and Gurtner GC:
Hypertrophic scar formation following burns and trauma: New
approaches to treatment. PLoS Med. 4(e234)2007.PubMed/NCBI View Article : Google Scholar
|
|
3
|
Tyack Z, Simons M, Spinks A and Wasiak J:
A systematic review of the quality of burn scar rating scales for
clinical and research use. Burns. 38:6–18. 2012.PubMed/NCBI View Article : Google Scholar
|
|
4
|
Penn JW, Grobbelaar AO and Rolfe KJ: The
role of the TGF-β family in wound healing, burns and scarring: A
review. Int J Burns Trauma. 2:18–28. 2012.PubMed/NCBI
|
|
5
|
Niessen FB, Schalkwijk J, Vos H and Timens
W: Hypertrophic scar formation is associated with an increased
number of epidermal Langerhans cells. J Pathol. 202:121–129.
2004.PubMed/NCBI View Article : Google Scholar
|
|
6
|
Morris DE, Wu L, Zhao LL, Bolton L, Roth
SI, Ladin DA and Mustoe TA: Acute and chronic animal models for
excessive dermal scarring: Quantitative studies. Plast Reconstr
Surg. 100:674–681. 1997.PubMed/NCBI View Article : Google Scholar
|
|
7
|
Ding J, Hori K, Zhang R, Marcoux Y,
Honardoust D, Shankowsky HA and Tredget EE: Stromal cell-derived
factor 1 (SDF-1) and its receptor CXCR4 in the formation of
postburn hypertrophic scar (HTS). Wound Repair Regen. 19:568–578.
2011.PubMed/NCBI View Article : Google Scholar
|
|
8
|
Yates CC, Krishna P, Whaley D, Bodnar R,
Turner T and Wells A: Lack of CXC chemokine receptor 3 signaling
leads to hypertrophic and hypercellular scarring. Am J Pathol.
176:1743–1755. 2010.PubMed/NCBI View Article : Google Scholar
|
|
9
|
Wang J, Hori K, Ding J, Huang Y, Kwan P,
Ladak A and Tredget EE: Toll-like receptors expressed by dermal
fibroblasts contribute to hypertrophic scarring. J Cell Physiol.
226:1265–1273. 2011.PubMed/NCBI View Article : Google Scholar
|
|
10
|
Eto H, Suga H, Aoi N, Kato H, Doi K, Kuno
S, Tabata Y and Yoshimura K: Therapeutic potential of fibroblast
growth factor-2 for hypertrophic scars: Upregulation of MMP-1 and
HGF expression. Lab Invest. 92:214–223. 2012.PubMed/NCBI View Article : Google Scholar
|
|
11
|
Ulrich D, Noah EM, von Heimburg D and
Pallua N: TIMP-1, MMP-2, MMP-9, and PIIINP as serum markers for
skin fibrosis in patients following severe burn trauma. Plast
Reconstr Surg. 111:1423–1431. 2003.PubMed/NCBI View Article : Google Scholar
|
|
12
|
Zhu S, Qing T, Zheng Y, Jin L and Shi L:
Advances in single-cell RNA sequencing and its applications in
cancer research. Oncotarget. 8:53763–53779. 2017.PubMed/NCBI View Article : Google Scholar
|
|
13
|
Liu YJ, Zhang F, Liu HD and Sun X: The
application of next-generation sequencing techniques in studying
transcriptional regulation in embryonic stem cells. Yi Chuan.
39:717–725. 2017.PubMed/NCBI View Article : Google Scholar
|
|
14
|
Sarig O and Sprecher E: The molecular
revolution in cutaneous biology: Era of next-generation sequencing.
J Invest Dermatol. 137:e79–e82. 2017.PubMed/NCBI View Article : Google Scholar
|
|
15
|
Saulis AS, Mogford JH and Mustoe TA:
Effect of Mederma on hypertrophic scarring in the rabbit ear model.
Plast Reconstr Surg. 110:177–183. 2002.PubMed/NCBI View Article : Google Scholar
|
|
16
|
Syed F, Ahmadi E, Iqbal SA, Singh S,
McGrouther DA and Bayat A: Fibroblasts from the growing margin of
keloid scars produce higher levels of collagen I and III compared
with intralesional and extralesional sites: Clinical implications
for lesional site-directed therapy. Br J Dermatol. 164:83–96.
2011.PubMed/NCBI View Article : Google Scholar
|
|
17
|
Livak KJ and Schmittgen TD: Analysis of
relative gene expression data using real-time quantitative PCR and
the 2(-Delta Delta C(T)) method. Methods. 25:402–408.
2001.PubMed/NCBI View Article : Google Scholar
|
|
18
|
Jensen LJ, Julien P, Kuhn M, von Mering C,
Muller J, Doerks T and Bork P: eggNOG: Automated construction and
annotation of orthologous groups of genes. Nucleic Acids Res.
36:D250–D254. 2008.PubMed/NCBI View Article : Google Scholar
|
|
19
|
Walmsley GG, Rinkevich Y and Hu MS:
Identification and targeted inhibition of a fibroblast lineage
responsible for skin scarring and cancer stroma. J Am Coll Surg.
219:S84–S85. 2014.
|
|
20
|
Scott PG, Dodd CM, Tredget EE, Ghahary A
and Rahemtulla F: Immunohistochemical localization of the
proteoglycans decorin, biglycan and versican and transforming
growth factor-beta in human post-burn hypertrophic and mature
scars. Histopathology. 26:423–431. 1995.PubMed/NCBI View Article : Google Scholar
|
|
21
|
Aarabi S, Bhatt KA, Shi Y, Paterno J,
Chang EI, Loh SA, Holmes JW, Longaker MT, Yee H and Gurtner GC:
Mechanical load initiates hypertrophic scar formation through
decreased cellular apoptosis. FASEB J. 21:3250–3261.
2007.PubMed/NCBI View Article : Google Scholar
|
|
22
|
Kawano Y and Kypta R: Secreted antagonists
of the Wnt signaling pathway. J Cell Sci. 116:2627–2634.
2003.PubMed/NCBI View Article : Google Scholar
|
|
23
|
Melkonyan HS, Chang WC, Shapiro JP,
Mahadevappa M, Fitzpatrick PA, Kiefer MC, Tomei LD and Umansky SR:
SARPs: A family of secreted apoptosis-related proteins. Proc Natl
Acad Sci USA. 94:13636–13641. 1997.PubMed/NCBI View Article : Google Scholar
|
|
24
|
Maganga R, Giles N, Adcroft K, Unni A,
Keeney D, Wood F, Fear M and Dharmarajan A: Secreted frizzled
related protein-4 (sFRP4) promotes epidermal differentiation and
apoptosis. Biochem Biophys Res Commun. 377:606–611. 2008.PubMed/NCBI View Article : Google Scholar
|
|
25
|
Matsushima K, Suyama T, Takenaka C,
Nishishita N, Ikeda K, Ikada Y, Sawa Y, Jakt LM, Mori H and
Kawamata S: Secreted frizzled related protein 4 reduces fibrosis
scar size and ameliorates cardiac function after ischemic injury.
Tissue Eng Part A. 16:3329–3341. 2010.PubMed/NCBI View Article : Google Scholar
|
|
26
|
Muley A, Majumder S, Kolluru GK, Parkinson
S, Viola H, Hool L, Arfuso F, Ganss R, Dharmarajan A and Chatterjee
S: Secreted frizzled-related protein 4: An angiogenesis inhibitor.
Am J Pathol. 176:1505–1516. 2010.PubMed/NCBI View Article : Google Scholar
|