Introduction
Sepsis is a clinical syndrome characterized by organ
dysfunction caused by a dysregulated immune response to infection
(1). Acute kidney injury (AKI) is a
serious clinical problem with high levels of mortality (2). Sepsis accounts for more than 50% of
all AKI cases, and the combination of sepsis and AKI increases the
risk of mortality compared with sepsis alone (3,4).
However, to the best of our knowledge, the specific mechanism by
which sepsis causes AKI has not yet been fully elucidated, and
there is no targeted therapy for sepsis-associated AKI
(SA-AKI).
Although the pathophysiological mechanism has not
yet been elucidated, it has been suggested that the deleterious
inflammatory cascade characteristic of sepsis contributes to AKI
(5). Compared with patients with
sepsis without AKI, those with AKI have a higher risk of mortality
(6,7). However, the renal function of some
patients with SA-AKI can return to a normal level (8). A previous study reported that
resuscitation of lipopolysaccharide-treated mice with warmed 0.9%
saline can increase survival rates to >80%, which allows to
study the prognosis of SA-AKI (9).
It is therefore vital to investigate the heterogeneity and
molecular mechanisms related to the prognosis of SA-AKI, which may
provide new therapeutic targets for SA-AKI.
RNA sequencing (RNA-Seq) has become a routine
technique for genome-wide expression analysis as it can provide
high-resolution sequence information (10). The present study investigated gene
expression profiles using RNA-Seq and subsequent bioinformatics
analyses to assess the function of differentially expressed genes
(DEGs) and molecular mechanisms relevant to the prognosis of
SA-AKI.
Materials and methods
Mouse cecal ligation and puncture
(CLP) model
A total of 20 8-week-old male C57BL/6J mice (weight,
20-25 g) were obtained from Shanghai SLAC Laboratory Animal Co.,
Ltd., and housed in a room at 22±1˚C, 40-60% humidity, with a 12-h
light/dark cycle (8:00 a.m.-8:00 p.m.), with free access to food
and drinking water. All operations on mice were performed by one
individual who was skilled in animal modeling. As described
previously (9), a 1-cm midline
laparotomy was performed following anesthesia with 3% inhaled
isoflurane. The base of the cecum was ligated and punctured at its
distal tip using a single 21-gauge needle. Subsequently, a small
amount of stool content (about 1 mm length) was extruded and put
back into the abdominal cavity. The abdomen was sealed and 1 ml
warm sterile 0.9% saline was injected subcutaneously to resuscitate
mice. The sham group (n=8) underwent laparotomy and cecum exposure
but no cecal ligation or puncture.
At 24 h or 48 h post-surgery, all mice were
anesthetized by inhalation of 3% isoflurane, and then 50 µl
retro-orbital venous blood was collected to measure Scr and BUN
levels. Following collection of retro-orbital venous blood to
assess Scr and BUN levels, 4 mice were sacrificed (24 h post-CLP,
SA-AKI group) and 8 mice were given an additional 10 ml/kg warmed
sterile 0.9% saline, and then sacrificed at 48 h post-CLP by
cervical dislocation. AKI was defined as a serum creatinine (Scr)
level >20 µmol/l and blood urea nitrogen (BUN) >28.3 mg/dl.
Mice were grouped into persistent injury (PI; n=3) and recovery
(RE; n=5) groups according to renal function at 48 h post-CLP. The
RE group consisted of mice whose Scr and BUN levels returned to
normal (<20 µmol/l and <28.3 mg/dl, respectively) at 48 h.
The PI group contained mice with high levels of Scr (>20 µmol/l)
and BUN (>28.3 mg/dl) at 48 h. Mice in the SA-AKI group were
sacrificed to collect blood and kidneys at 24 h (n=4). Mice in the
PI (n=3) and RE (n=5) group were sacrificed to collect blood and
kidneys at 48 h. Mice in the sham group were sacrificed via
cervical dislocation to collect blood and kidneys at 24 h (n=4) and
48 h (n=4), respectively.
All protocols of this study were approved by the
Animal Ethics Committee of the First Affiliated Hospital, College
of Medicine, Zhejiang University, Hangzhou, Zhejiang (approval ID.
2016160; 25 February 2016), which follows the institutional
guidelines.
Renal function assessment
Blood samples were centrifuged at 13,000 x g for 10
min at 4˚C to collect the supernatant. Scr and BUN
levels were measured using the DRI-CHEM dry biochemical analyzer
(FUJIFILM Wako Pure Chemical Corporation).
Hematoxylin-eosin staining
The kidney tissues of mice were fixed in 4%
paraformaldehyde at room temperature overnight, embedded in
paraffin wax, sliced into 4-mm-thick sections, and stained with
hematoxylin and eosin at 37˚C for 24 h. Slides were
prepared in triplicate, and sections were evaluated under a light
microscope (magnification, x400). The pathological injury score of
all the samples was assessed twice in a blinded fashion by
independent investigators, and the mean score from the two
assessments was recorded as the composite score. The grading
criteria for renal injury were as follows: Edema of tubular
epithelial cells, loss of normal morphology, and cytoplasmic
vacuoles. The grading standard for renal tubular involvement were
as follows: Observing the aforementioned characteristics of the
samples under the same microscope at x400 magnification. Renal
tissue pathological injury score was assessed with a 0-5 scoring
system: 0, no renal tubular involvement; 1, <25% renal tubular
involvement; 2, 25-<50% renal tubular involvement; 3, 50-75%
renal tubular involvement; 4, >75% renal tubular
involvement.
RNA-Seq and gene expression
analysis
Total RNA of 3 kidneys in the PI group and 3 kidneys
in the RE group were extracted using TRlzol® reagent
(Invitrogen; Thermo Fisher Scientific, Inc.) according to the
manufacturer's instructions. RNA purity was assessed using the
kaiaoK5500® Spectrophotometer (Kaiao). RNA integrity and
concentration were detected using the RNA Nano 6000 assay kit of
the Bioanalyzer 2100 system (Agilent Technologies, Inc.). A total
amount of 2 µg RNA per sample was used as input material for the
RNA sample preparations. Sequencing libraries were built using the
NEBNext® Ultra™ RNA Library Prep kit for
Illumina® (cat. no. E7530L; New England Biolabs, Inc.)
following the manufacturer's instructions, and index codes were
added to attribute sequences to each sample.
Based on the manufacturer's instructions, the
index-coded samples were clustered on a cBot cluster generation
system using HiSeq PE Cluster kit v4-cBot-HS (Illumina, Inc.).
After the cluster was generated, the libraries were sorted on an
Illumina platform to generate 150 bp paired-end reads. Genes with a
false discovery rate (FDR) <0.1 and fold-change (FC) >2 were
identified as DEGs.
Data analysis and pathway enrichment analysis were
performed using integrated Differential Expression and Pathway
analysis (iDEP, version 0.90; http://ge-lab.org/idep) (11). iDEP is an online application that
integrates many Bioconductor packages and annotation databases to
enable users to perform intensive bioinformatics analysis. In the
present study, DESeq2 package, hierarchical clustering and κ-means
clustering analysis, principal component analysis, Gene Ontology
(GO) analysis, and transcription factor binding motifs and microRNA
enrichment analysis were used in iDEP application.
Gene set enrichment analysis
(GSEA)
GSEA was conducted using the software GSEA v2.2.2
(www.broadinstitute.org/gsea). The
enrichment degree and statistical significance were quantified by
normalized enrichment score (NES), nominal P-value and FDR
(12). Kyoto Encyclopedia of Genes
and Genomes (KEGG) pathways were conducted by using GSEA
software.
Statistical analysis
All data are presented as mean ± standard deviation.
The results were analyzed by one-way analysis of variance and
Tukey's post hoc test using SPSS 22.0 software (IBM Corp.).
P<0.05 was considered to indicate a statistically significant
difference.
Results
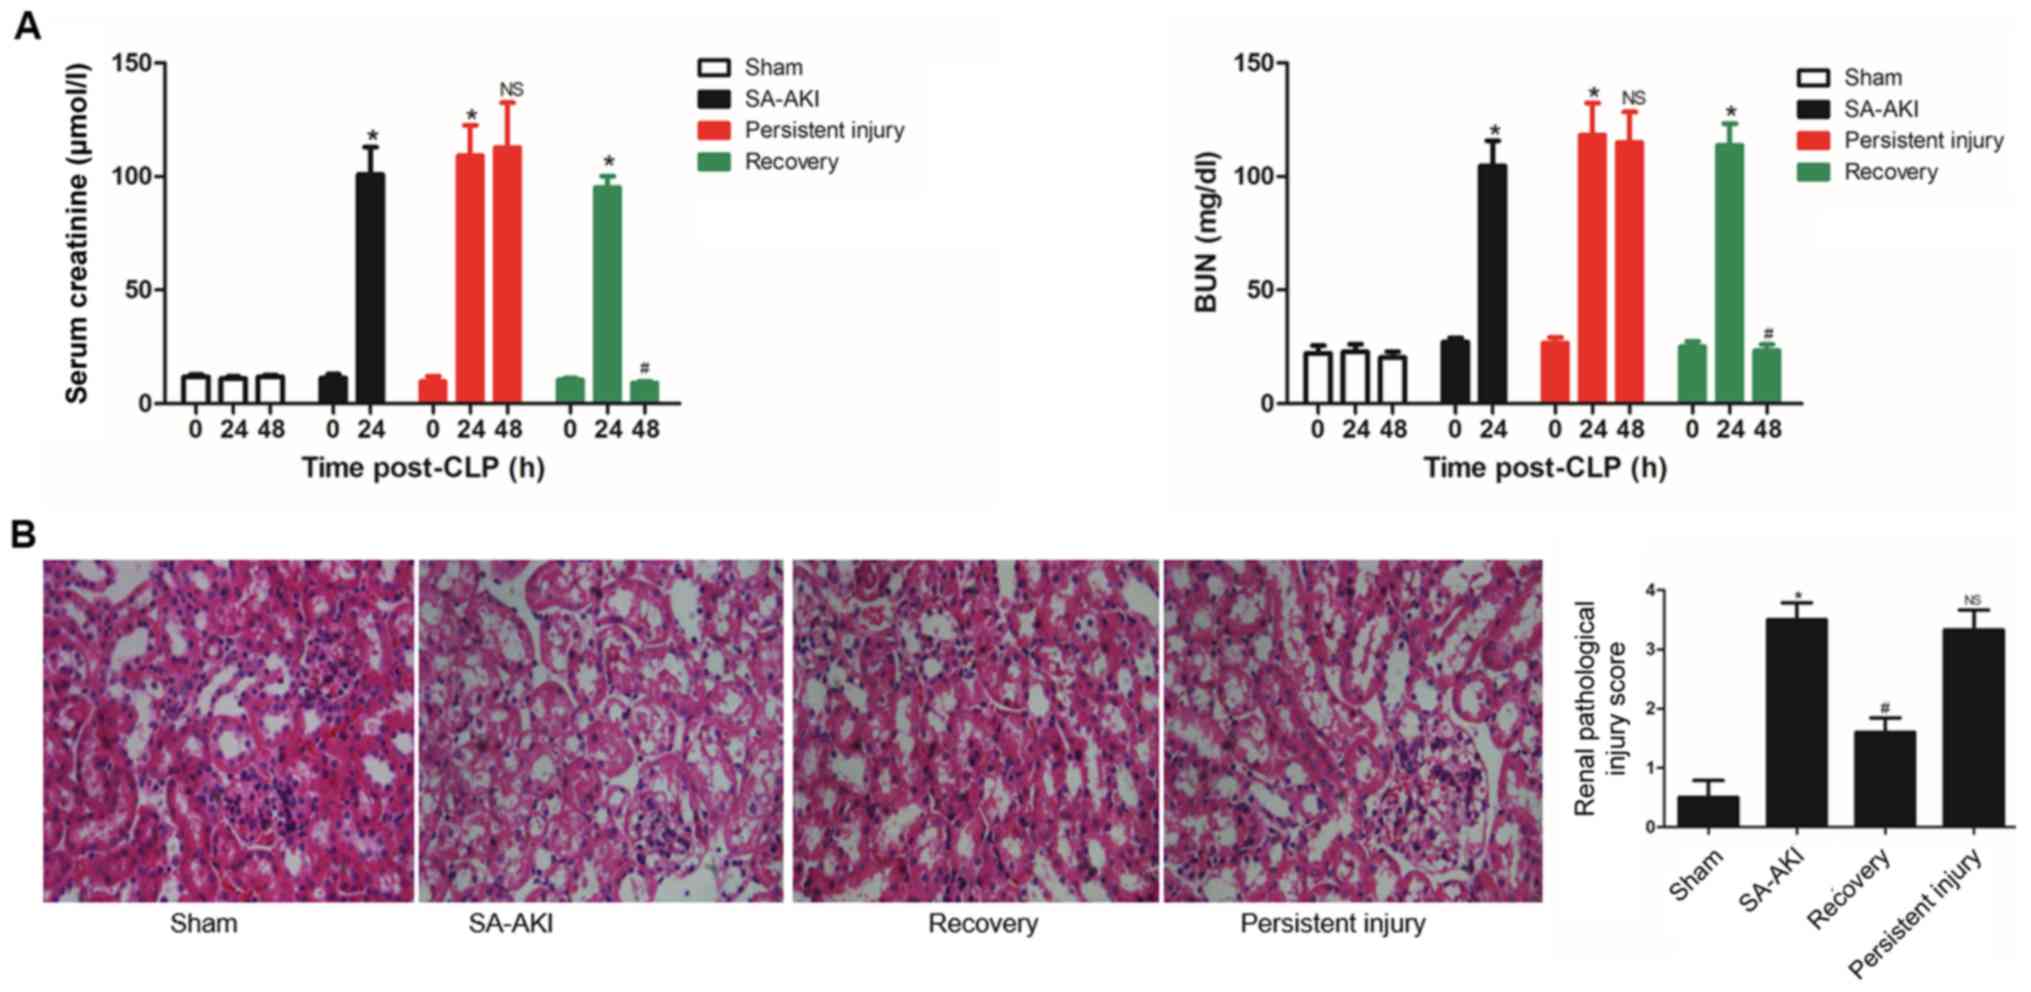
Sepsis-associated AKI mice
CLP was performed in 8-week-old male C57BL/6J mice.
At 24 h after the CLP procedure, kidney function biomarkers BUN and
Scr were significantly elevated. Following resuscitation, 5 mice
exhibited recovery to normal kidney function by 48 h post-CLP
operation, however 3 mice had persistent AKI. The levels of kidney
function biomarkers are presented in Fig. 1A. It was identified that Scr and BUN
levels did not significantly change in sham group at each time
point. Renal tissue pathological staining and injury score were
used to evaluate renal injury in the present study. In the sham
group, the kidney tissue was demonstrated to be normal and no signs
of damage were present. To further quantify the degree of renal
damage in each group of mice, the pathological grading of renal
pathological sections was evaluated. The renal tissue pathological
injury score in the SA-AKI group (3.50±0.58) was significantly
higher compared with that in the sham group (0.50±0.58) and RE
group (1.60±0.55; P<0.05). There was no significant difference
in renal tissue pathological injury score between the SA-AKI and PI
groups (3.50± 0.58 vs. 3.33± 0.58; P=0.72; Fig. 1B). To investigate this
heterogeneity, expression profiling was performed with the
kidney-derived RNA obtained from the PI and RE groups 48 h
post-CLP.
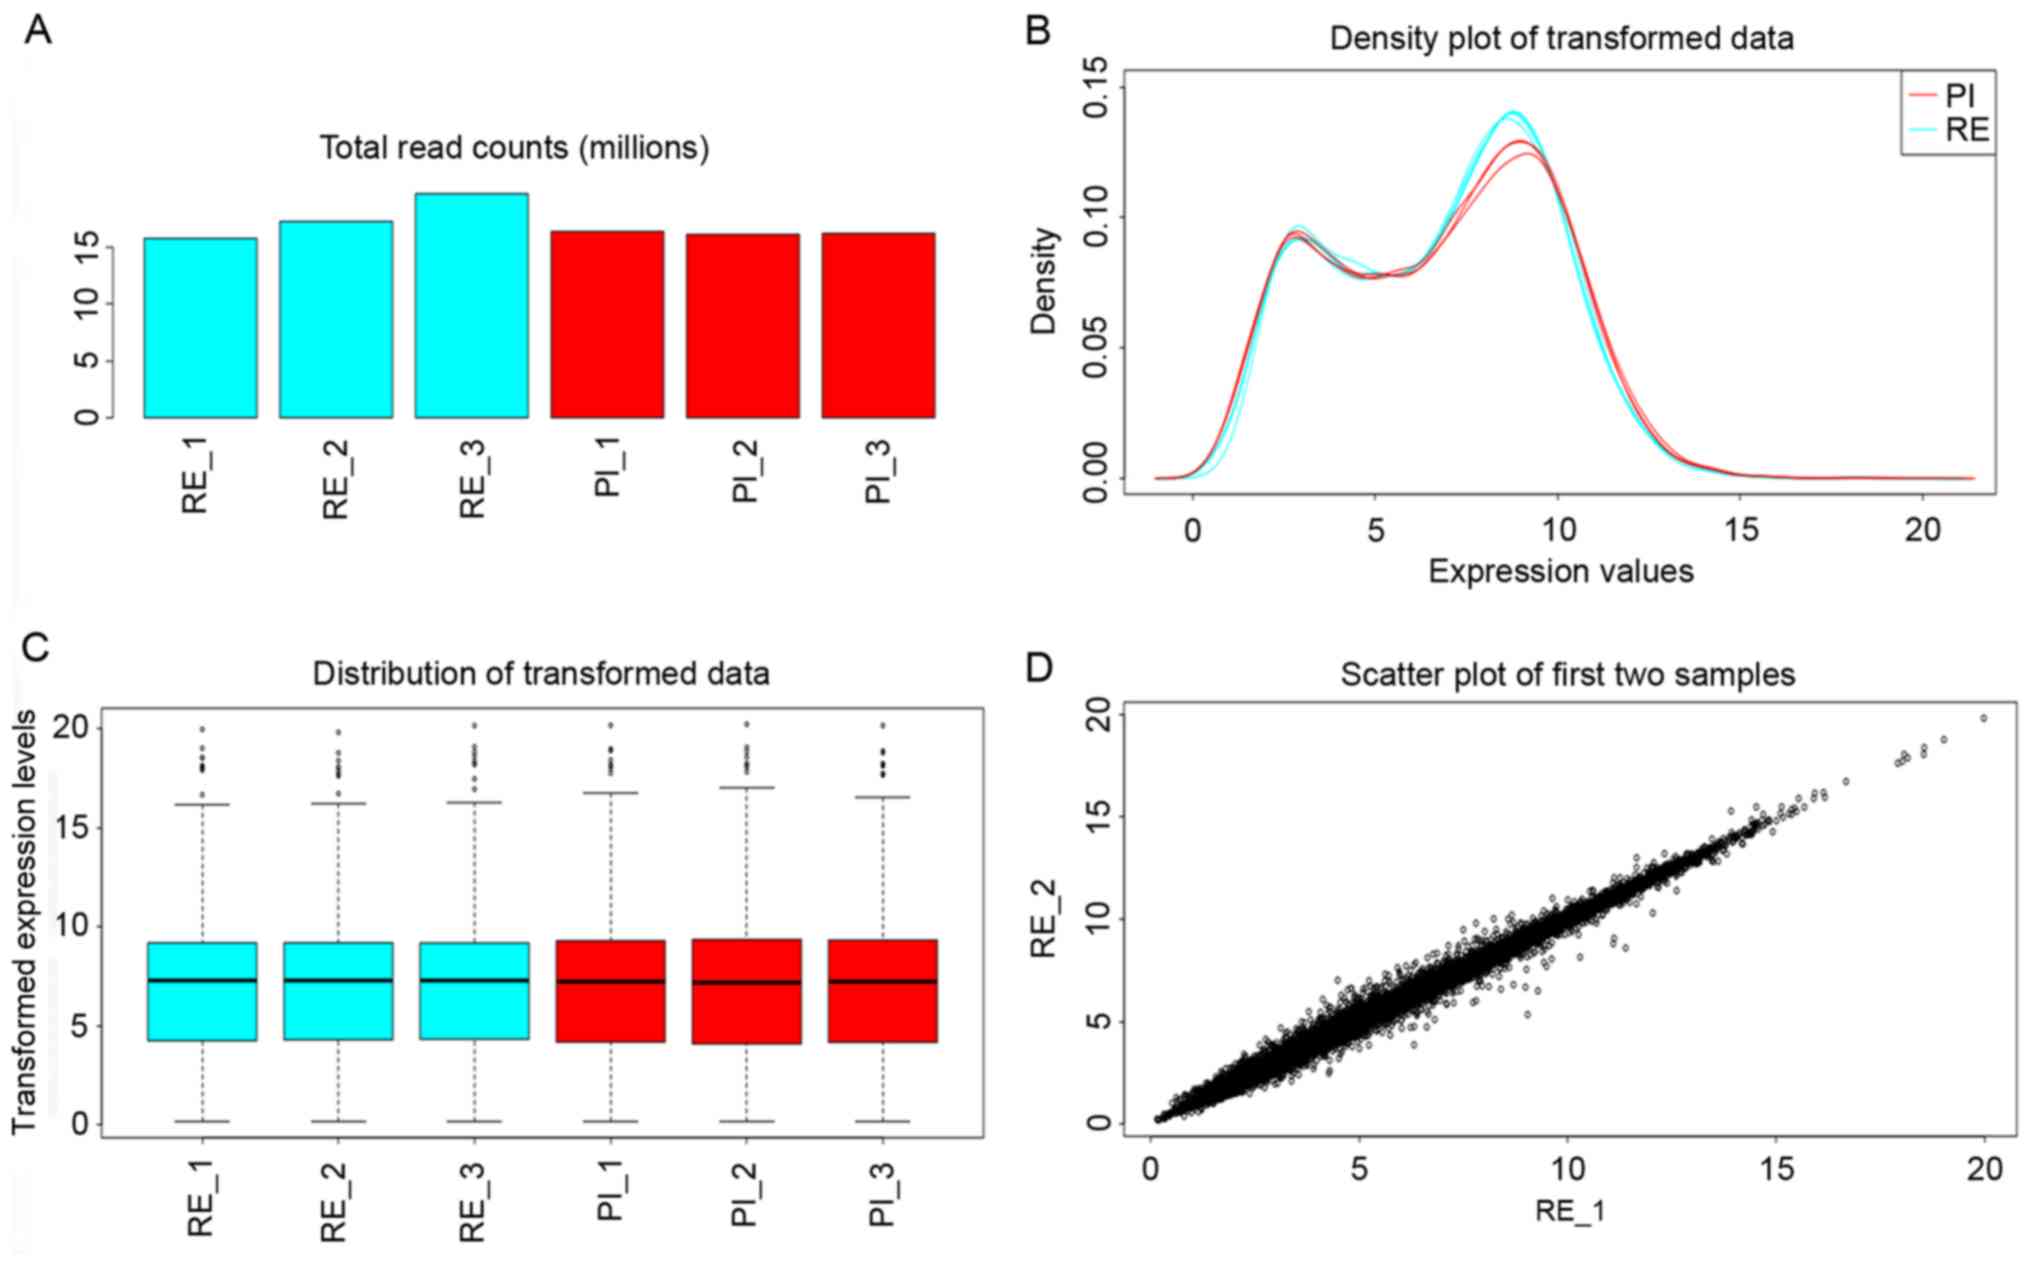
Expression profiling analyses of
kidneys from mice with SA-AKI
iDEP was used to analyze the RNA-Seq dataset. The
total read counts per library exhibited a small amount of variation
in size (Fig. 2A). Regularized log
transformation was performed using the DESeq2 package, and the
distribution of the transformed data is presented in Fig. 2B and C, D
presented the variation between the RE 1 and RE 2 samples to
represent the variation among each replicate. Variation among each
replicate was small.
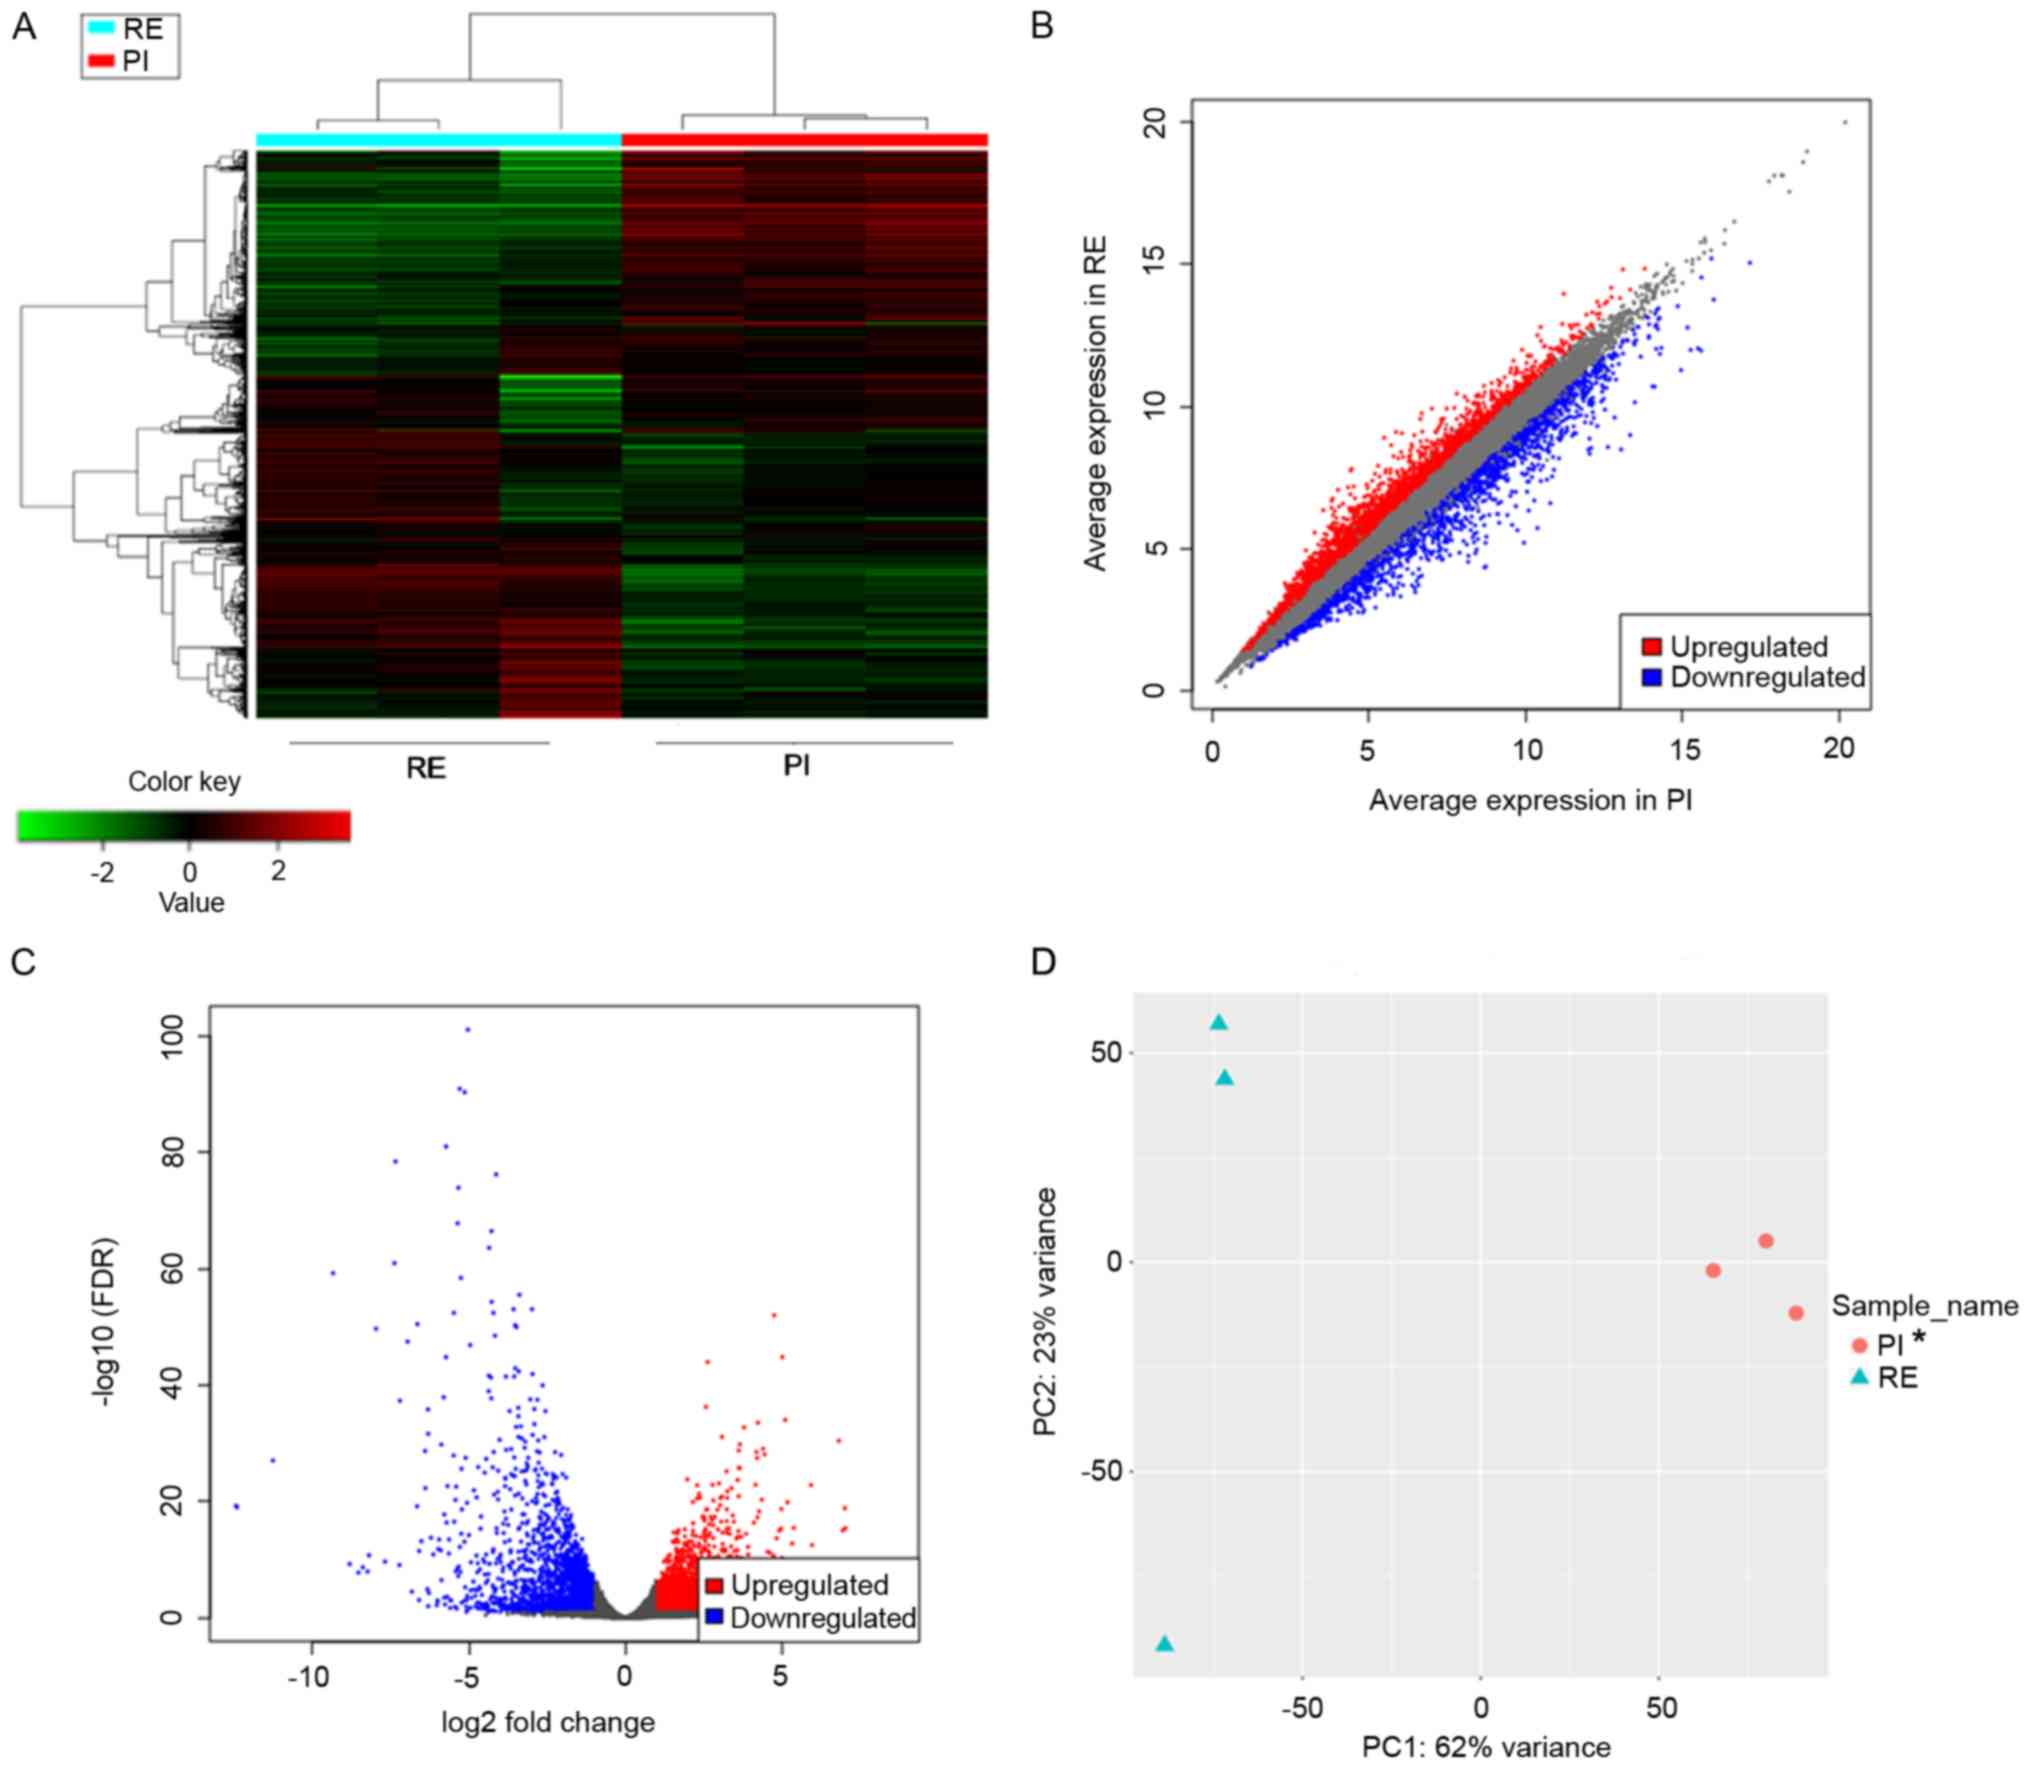
Hierarchical clustering and κ-means
clustering analysis
Hierarchical clustering analysis evaluated the top
2,000 significant DEGs among all DEGs, including the 2256
downregulated and 3146 upregulated DEGs, which were ranked by their
standard deviation across all samples. The results of hierarchical
clustering analysis results are presented in Fig. 3A, in which each column represents
the expression pattern of one sample, the red lines represent the
upregulated genes, and the green lines represent the downregulated
genes (Fig. 3A). A scatter plot was
generated to depict the gene expression distribution (Fig. 3B), and a volcano map was created to
visualize significant DEGs (Fig.
3C). A principal component analysis (PCA) plot using the first
and second principal components is presented in Fig. 3D. There was a significant difference
between the RE and PI groups along the first principal component,
which explained the 62% variance.
Subsequently, κ-means clustering was used to divide
the top 2,000 DEGs into groups. Based on the within-group sum of
squares plot as a reference, κ=4 was selected and indicated the
number of clusters used for further analysis (Fig. 4A). The four gene clusters underwent
GO analysis and the results are presented in Fig. 4B and Table I.
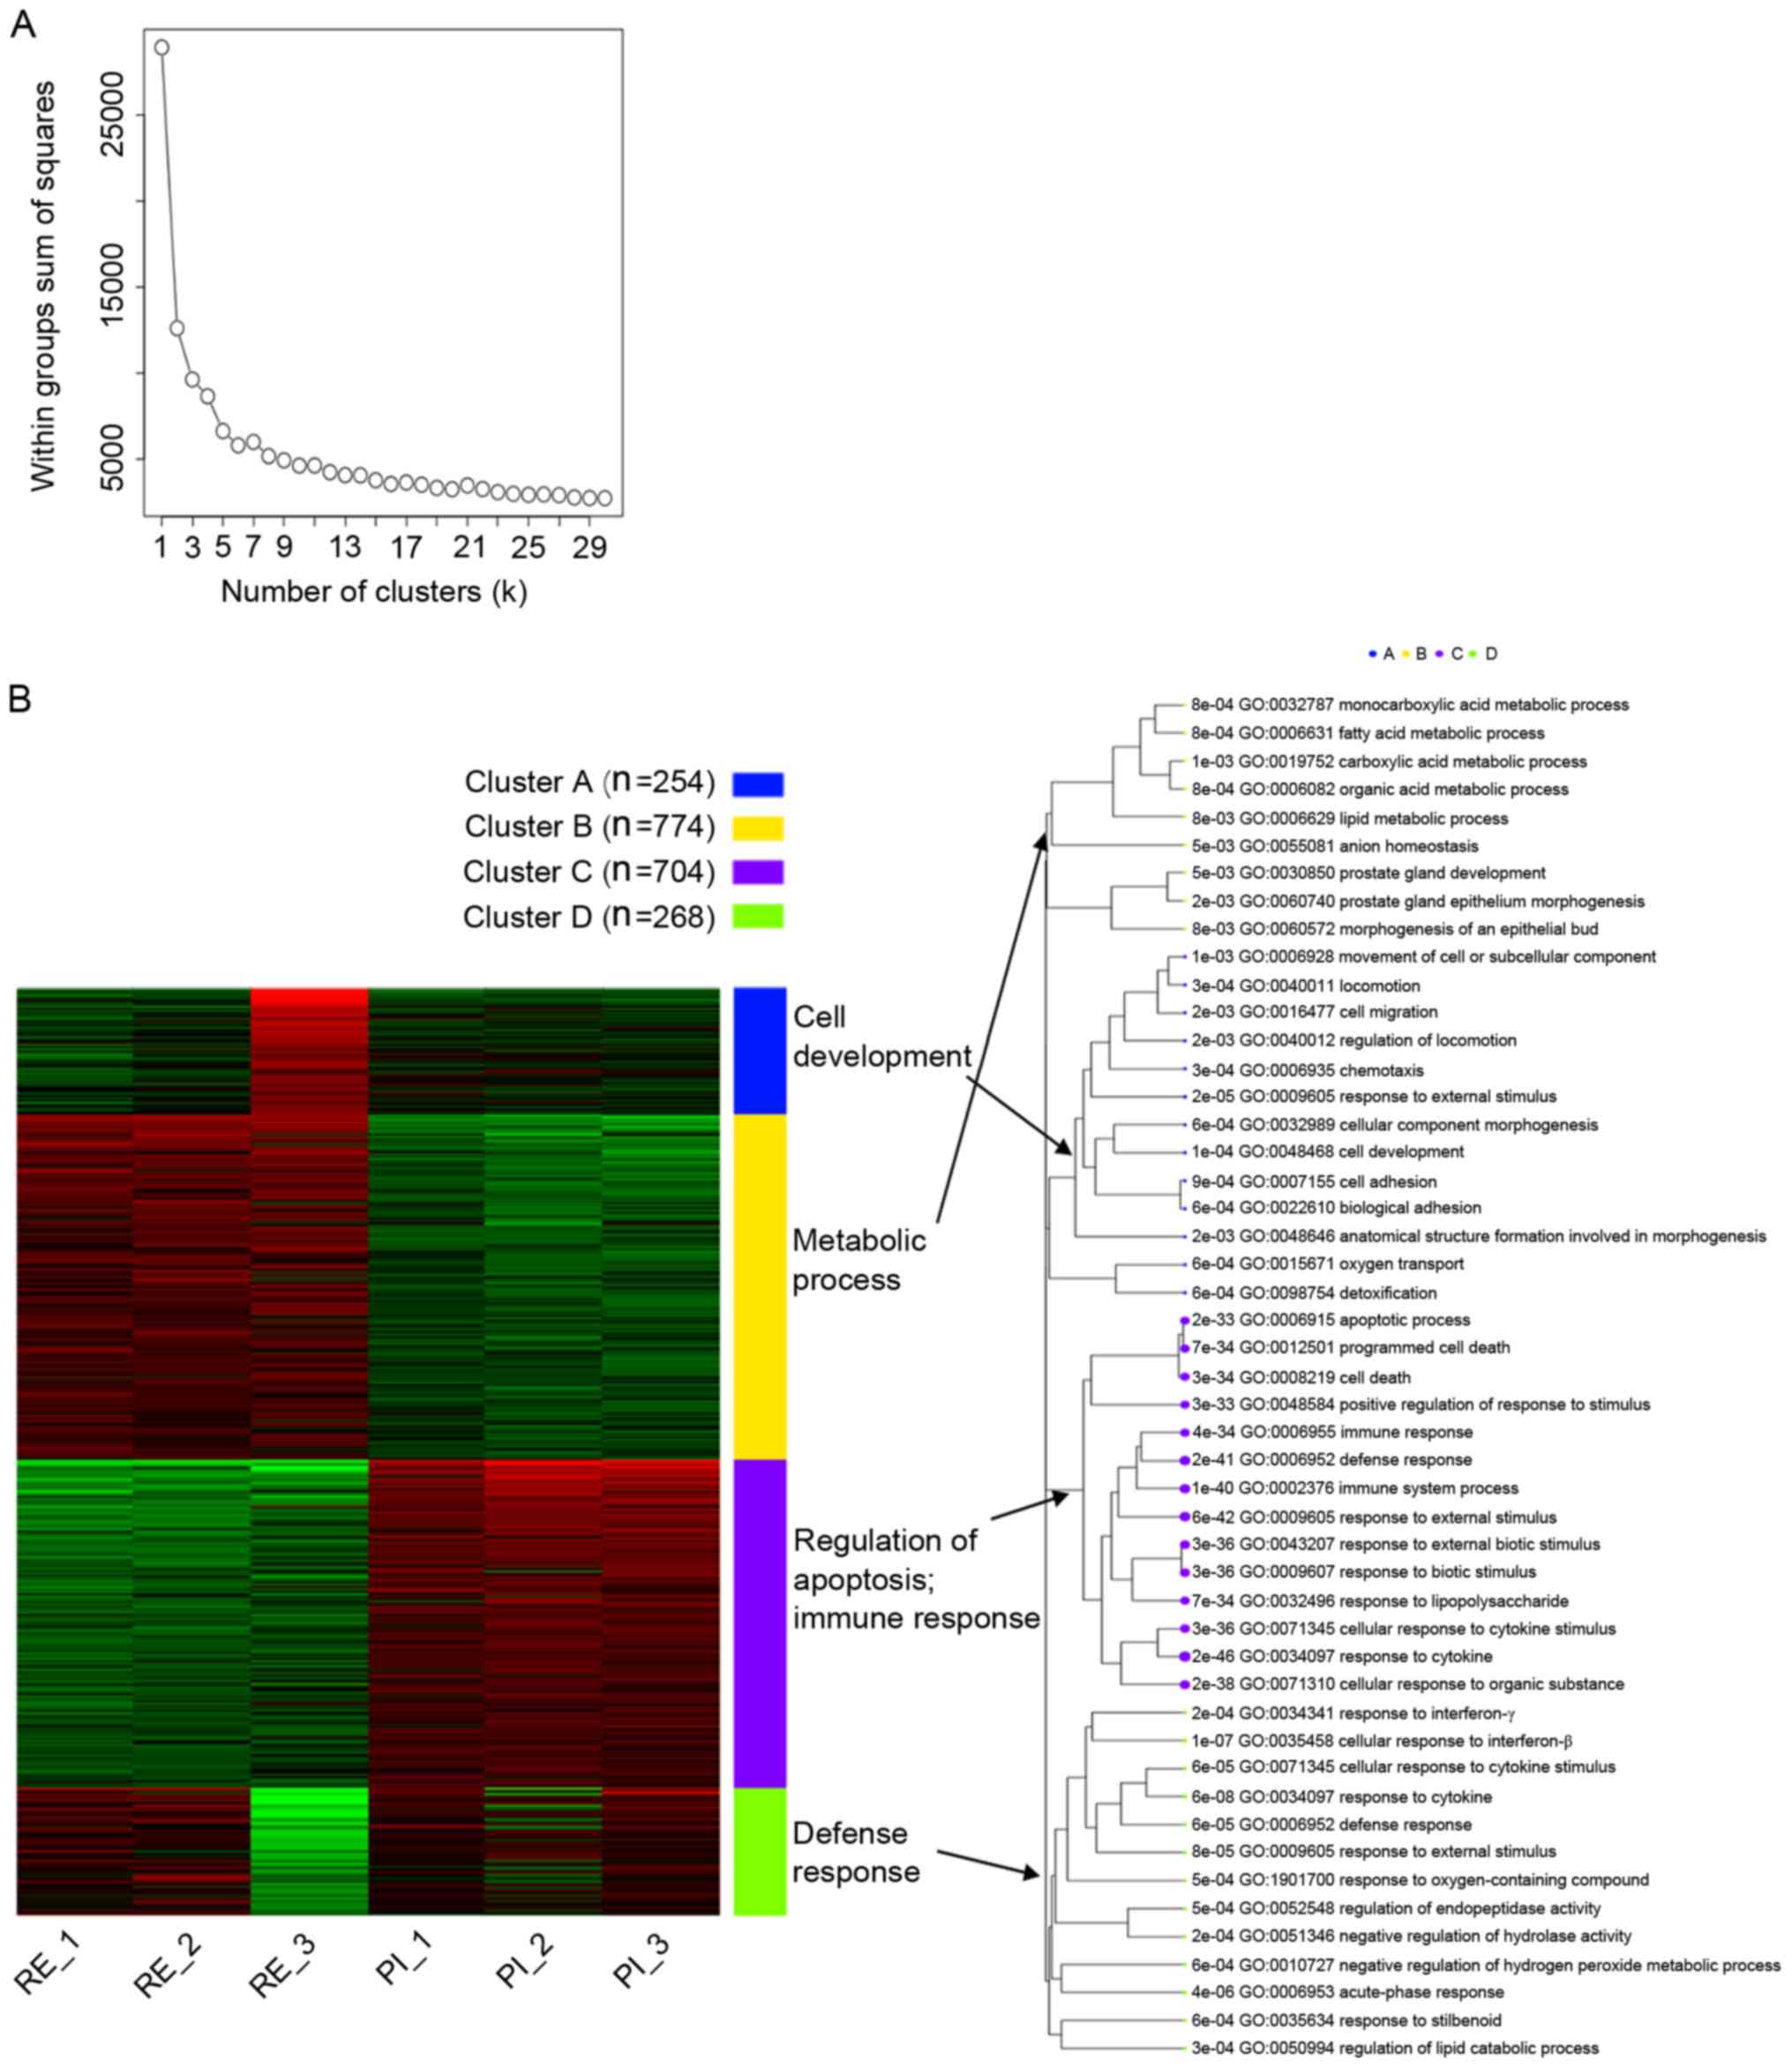 | Figure 4κ-means clustering and GO enrichment
analysis of the RE and PI group samples. (A) Based on the
within-group sum of squares plot as a reference, a larger κ=4 was
selected. (B) The clusters A, B, C and D were predominantly
enriched in cell development, metabolic process, regulation of
apoptosis and immune response, and defense response, respectively.
RE, recovery; PI, persistent injury; GO, Gene Ontology. |
 | Table IEnrichment analysis of k-means
clusters using various gene sets. |
Table I
Enrichment analysis of k-means
clusters using various gene sets.
| Cluster | Adjusted
P-value | Genes (n) | Pathway |
|---|
| A |
2.03x10⁻⁵ | 42 | GO:0009605 response
to external stimulus |
| A | 0.000133 | 40 | GO:0048468 cell
development |
| A | 0.000311 | 17 | GO:0006935
chemotaxis |
| A | 0.000311 | 31 | GO:0040011
locomotion |
| A | 0.000555 | 32 | GO:0022610
biological adhesion |
| A | 0.000555 | 8 | GO:0098754
detoxification |
| A | 0.000613 | 4 | GO:0015671 oxygen
transport |
| A | 0.000613 | 27 | GO:0032989 cellular
component morphogenesis |
| A | 0.0009 | 31 | GO:0007155 cell
adhesion |
| A | 0.001458 | 31 | GO:0006928 movement
of cell or subcellular component |
| A | 0.001516 | 25 | GO:0016477 cell
migration |
| A | 0.001626 | 24 | GO:0048646
anatomical structure formation involved in morphogenesis |
| A | 0.001668 | 19 | GO:0040012
regulation of locomotion |
| B | 0.000751 | 46 | GO:0006082 organic
acid metabolic process |
| B | 0.000751 | 26 | GO:0006631 fatty
acid metabolic process |
| B | 0.000751 | 33 | GO:0032787
monocarboxylic acid metabolic process |
| B | 0.000991 | 41 | GO:0019752
carboxylic acid metabolic process |
| B | 0.001931 | 7 | GO:0060740 prostate
gland epithelium morphogenesis |
| B | 0.004579 | 8 | GO:0030850 prostate
gland development |
| B | 0.004829 | 6 | GO:0055081 anion
homeostasis |
| B | 0.00809 | 52 | GO:0006629 lipid
metabolic process |
| B | 0.00809 | 5 | GO:0060572
morphogenesis of an epithelial bud |
| C |
2.48x10-46 | 109 | GO:0034097 response
to cytokine |
| C |
5.84x10-42 | 174 | GO:0009605 response
to external stimulus |
| C |
2.22x10-41 | 135 | GO:0006952 defense
response |
| C |
1.04x10-40 | 174 | GO:0002376 immune
system process |
| C |
1.71x10-38 | 168 | GO:0071310 cellular
response to organic substance |
| C |
2.96x10-36 | 104 | GO:0009607 response
to biotic stimulus |
| C |
2.96x10-36 | 101 | GO:0043207 response
to external biotic stimulus |
| C |
2.96x10-36 | 88 | GO:0071345 cellular
response to cytokine stimulus |
| C |
3.22x10⁻³⁴ | 153 | GO:0008219 cell
death |
| C |
3.57x10⁻³⁴ | 118 | GO:0006955 immune
response |
| C |
6.62x10⁻³⁴ | 64 | GO:0032496 response
to lipopolysaccharide |
| C |
7.23x10⁻³⁴ | 147 | GO:0012501
programmed cell death |
| C |
1.98x10⁻³³ | 145 | GO:0006915
apoptotic process |
| C |
3.00x10⁻³³ | 148 | GO:0048584 positive
regulation of response to stimulus |
| D |
6.27x10⁻⁸ | 25 | GO:0034097 response
to cytokine |
| D |
1.24x10⁻⁸ | 8 | GO:0035458 cellular
response to interferon-beta |
| D |
4.1x10⁻⁶ | 7 | GO:0006953
acute-phase response |
| D |
5.58x10⁻⁵ | 27 | GO:0006952 defense
response |
| D |
5.77x10⁻⁵ | 18 | GO:0071345 cellular
response to cytokine stimulus |
| D |
7.70x10⁻⁵ | 35 | GO:0009605 response
to external stimulus |
| D | 0.00017 | 8 | GO:0034341 response
to interferon-gamma |
| D | 0.000215 | 14 | GO:0051346 negative
regulation of hydrolase activity |
| D | 0.000269 | 6 | GO:0050994
regulation of lipid catabolic process |
| D | 0.000509 | 13 | GO:0052548
regulation of endopeptidase activity |
| D | 0.000515 | 27 | GO:1901700 response
to oxygen-containing compound |
| D | 0.00062 | 3 | GO:0010727 negative
regulation of hydrogen peroxide metabolic process |
| D | 0.00062 | 4 | GO:0035634 response
to stilbenoid |
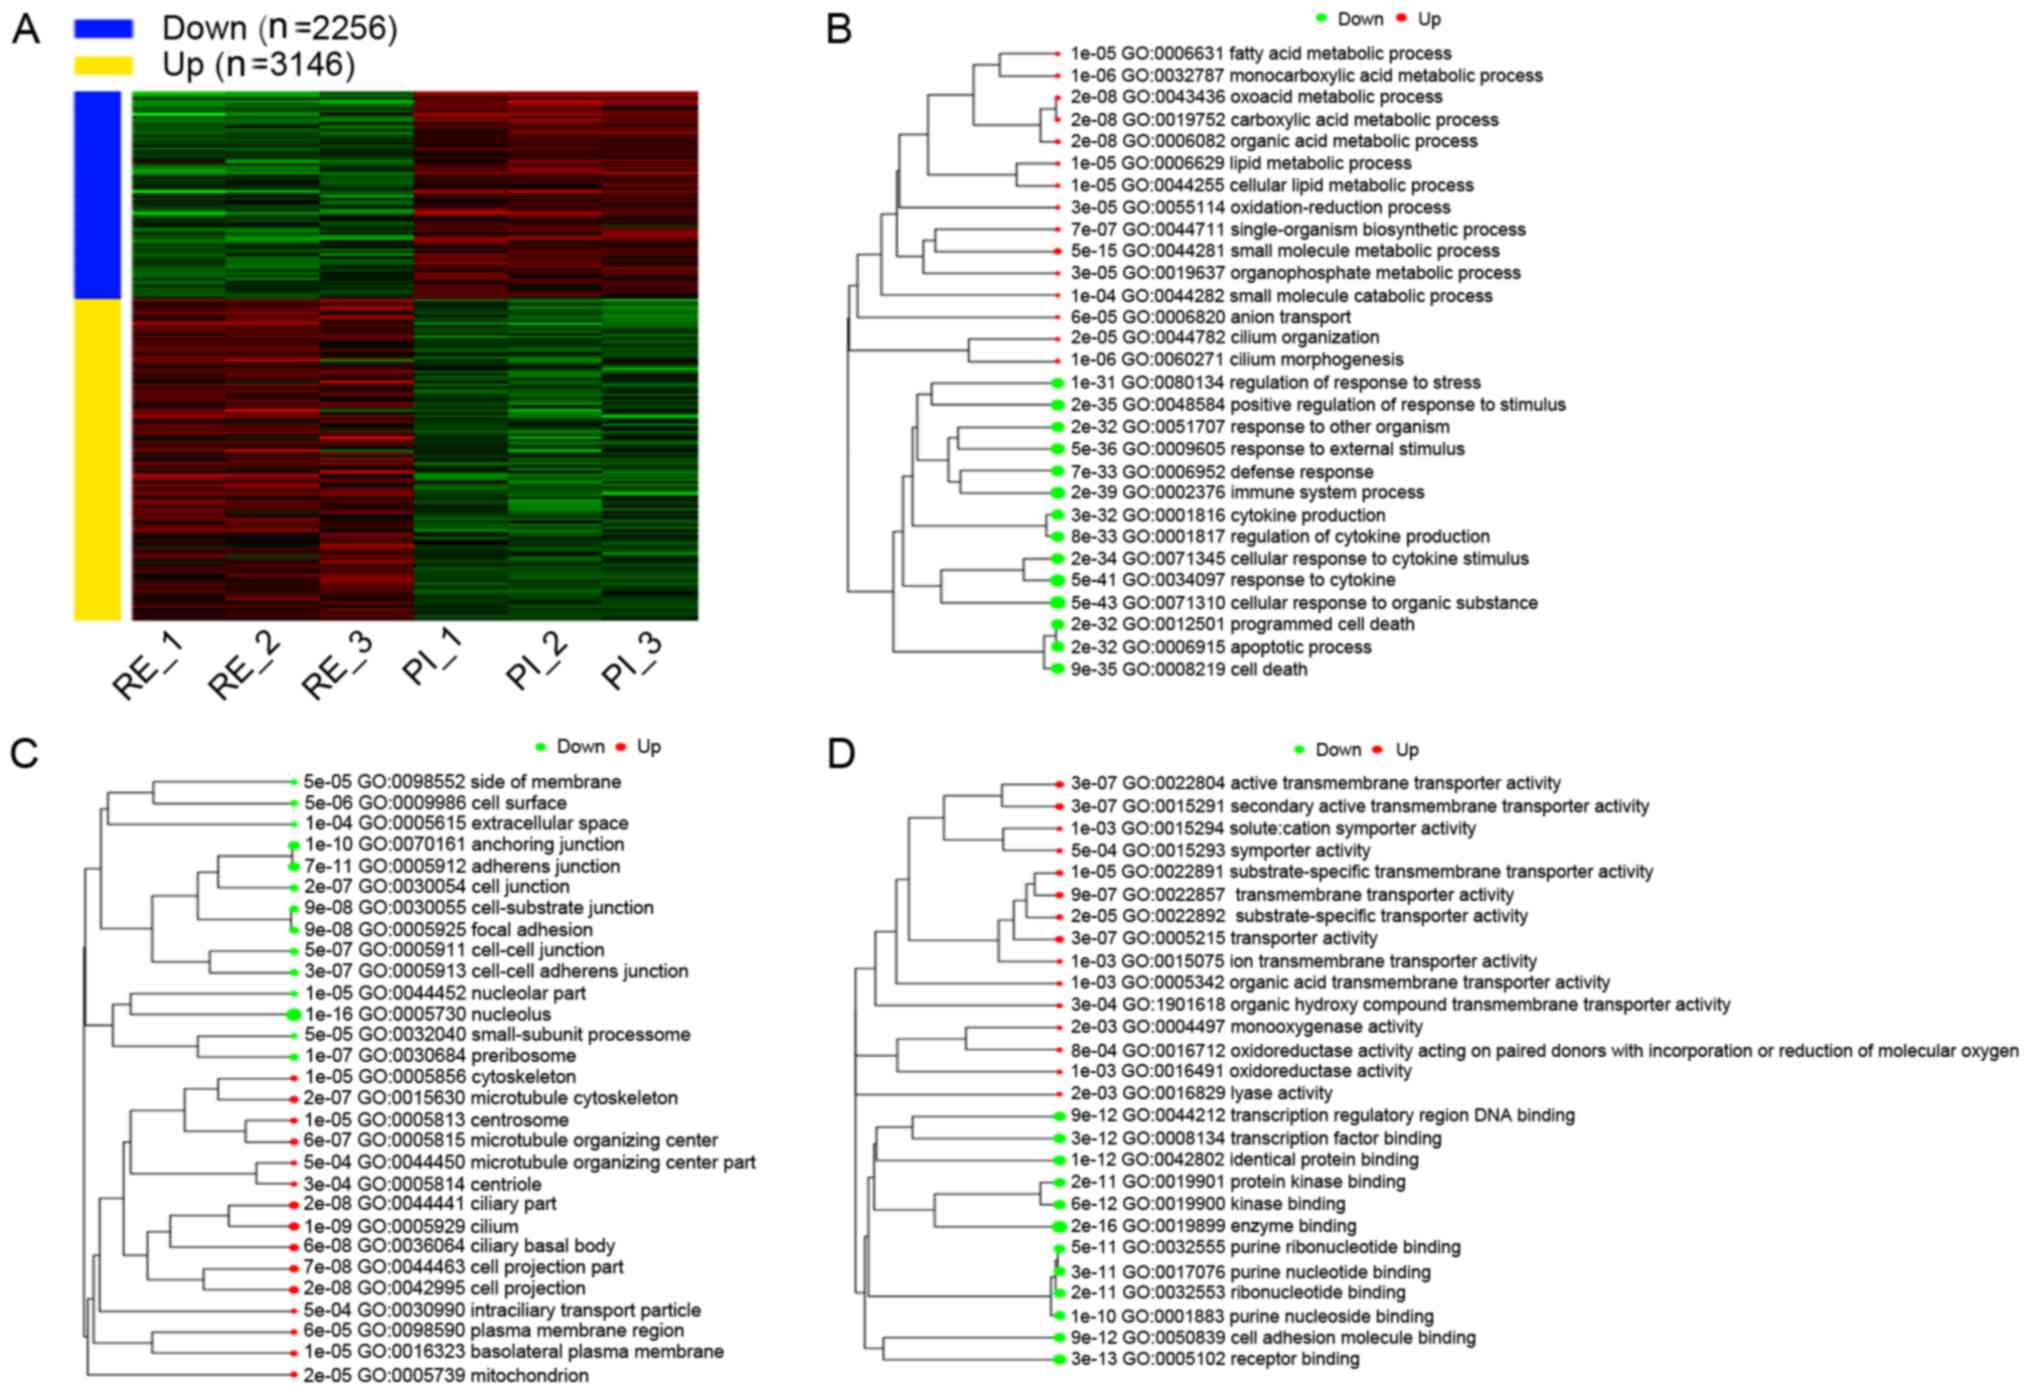
Identification of DEGs
Compared with the PI group, a total of 2,256
downregulated and 3,146 upregulated DEGs were identified in the RE
group using a threshold of FDR <0.1 and FC >2 (Fig. 5A). The upregulated and downregulated
DEGs then underwent GO analysis for Biological Process terms. In
Fig. 5B, the upregulated DEGs were
mainly involved in ‘metabolic processes’, the downregulated DEGs
were enriched in ‘regulation of response to stress’, ‘cytokine
production’, ‘apoptotic process’ and ‘cell death’. The details of
the enriched GO Biological Process terms are presented in Table Ⅱ.
For GO Cellular Component terms, it was identified that the
upregulated DEGs in the RE group were enriched in the
‘mitochondrion’, ‘cytoskeleton’ and ‘centrosome’; the downregulated
DEGs in the RE group were enriched in the ‘cell surface’, ‘cell
junction’ and ‘adherens junction’ (Fig.
5C and Table III). For GO
Molecular Function terms, it was identified the downregulated DEGs
in the RE group were enriched in ‘enzyme binding’ and ‘receptor
binding’. Furthermore, the upregulated DEGs were enriched in
‘transporter activity and active transmembrane transporter
activity’ (Fig. 5D and Table IV).
| Table IIIEnriched GO Cellular Component terms
for the upregulated and downregulated genes. |
Table III
Enriched GO Cellular Component terms
for the upregulated and downregulated genes.
| A, Downregulated
genes |
|---|
| Adjusted
P-value | Genes (n) | Cellular
component |
|---|
| <0.001 | 159 | GO:0005730
nucleolus |
| <0.001 | 115 | GO:0005912 adherens
junction |
| <0.001 | 116 | GO:0070161
anchoring junction |
| <0.001 | 71 | GO:0005925 focal
adhesion |
| <0.001 | 72 | GO:0030055
cell-substrate junction |
| <0.001 | 24 | GO:0030684
preribosome |
| <0.001 | 180 | GO:0030054 cell
junction |
| <0.001 | 59 | GO:0005913
cell-cell adherens junction |
| <0.001 | 98 | GO:0005911
cell-cell junction |
| <0.001 | 108 | GO:0009986 cell
surface |
| <0.001 | 36 | GO:0044452
nucleolar part |
| <0.001 | 13 | GO:0032040
small-subunit processome |
| <0.001 | 69 | GO:0098552 side of
membrane |
| <0.001 | 178 | GO:0005615
extracellular space |
| B, Upregulated
genes |
| Adjusted
P-value | Genes (n) | Cellular
component |
| <0.001 | 104 | GO:0005929
cilium |
| <0.001 | 276 | GO:0042995 cell
projection |
| <0.001 | 72 | GO:0044441 ciliary
part |
| <0.001 | 35 | GO:0036064 ciliary
basal body |
| <0.001 | 157 | GO:0044463 cell
projection part |
| <0.001 | 176 | GO:0015630
microtubule cytoskeleton |
| <0.001 | 116 | GO:0005815
microtubule organizing center |
| <0.001 | 89 | GO:0005813
centrosome |
| <0.001 | 275 | GO:0005856
cytoskeleton |
| <0.001 | 46 | GO:0016323
basolateral plasma membrane |
| <0.001 | 243 | GO:0005739
mitochondrion |
| <0.001 | 141 | GO:0098590 plasma
membrane region |
| <0.001 | 28 | GO:0005814
centriole |
| <0.001 | 13 | GO:0030990
intraciliary transport particle |
| <0.001 | 34 | GO:0044450
microtubule organizing center part |
| Table IVEnriched GO Molecular Function terms
for the upregulated and downregulated genes. |
Table IV
Enriched GO Molecular Function terms
for the upregulated and downregulated genes.
| A, Downregulated
genes |
|---|
| Adjusted
P-value | Genes (n) | Molecular
function |
|---|
| <0.001 | 266 | GO:0019899 enzyme
binding |
| <0.001 | 213 | GO:0005102 receptor
binding |
| <0.001 | 204 | GO:0042802
identical protein binding |
| <0.001 | 100 | GO:0008134
transcription factor binding |
| <0.001 | 109 | GO:0019900 kinase
binding |
| <0.001 | 133 | GO:0044212
transcription regulatory region DNA binding |
| <0.001 | 87 | GO:0050839 cell
adhesion molecule binding |
| <0.001 | 256 | GO:0032553
ribonucleotide binding |
| <0.001 | 99 | GO:0019901 protein
kinase binding |
| <0.001 | 254 | GO:0017076 purine
nucleotide binding |
| <0.001 | 252 | GO:0032555 purine
ribonucleotide binding |
| <0.001 | 247 | GO:0001883 purine
nucleoside binding |
| B, Upregulated
genes |
| Adjusted
P-value | Genes (n) | Molecular
function |
| <0.001 | 204 | GO:0005215
transporter activity |
| <0.001 | 56 | GO:0015291
secondary active transmembrane transporter activity |
| <0.001 | 78 | GO:0022804 active
transmembrane transporter activity |
| <0.001 | 165 | GO:0022857
transmembrane transporter activity |
| <0.001 | 145 | GO:0022891
substrate-specific transmembrane transporter activity |
| <0.001 | 166 | GO:0022892
substrate-specific transporter activity |
| <0.001 | 13 | GO:1901618 organic
hydroxy compound transmembrane transporter activity |
| <0.001 | 33 | GO:0015293
symporter activity |
| <0.001 | 18 | GO:0016712
oxidoreductase activity acting on paired donors with incorporation
or reduction of molecular oxygen reduced flavin or flavoprotein as
one donor and incorporation of one atom of oxygen |
| <0.001 | 124 | GO:0016491
oxidoreductase activity |
| 0.001 | 27 | GO:0005342 organic
acid transmembrane transporter activity |
| 0.001 | 118 | GO:0015075 ion
transmembrane transporter activity |
| 0.001 | 24 | GO:0015294
solute:cation symporter activity |
| 0.002 | 33 | GO:0004497
monooxygenase activity |
| 0.002 | 37 | GO:0016829 lyase
activity |
According to the enriched genes in the upregulated
genes of the RE group, it was identified that solute carrier family
7 member 7 (Slc7a7) was highly enriched in the top six pathways
(Table SI).
Transcription factor (TF) binding
motifs and microRNA (miRNA or miR) target gene sets
As presented in Table Ⅴ, using the TF target gene
sets in the enrichment analysis, it was detected that target genes
of v-rel reticuloendotheliosis viral oncogene homolog A (RELA; FDR
<1.92x10⁻⁸) and signaling transducer and activator of
transcription 3 (STAT3; FDR <4.57x10⁻⁷) were enriched
for the downregulated genes. After analysis, the upregulated genes
did not enrich any TF. The present study then analyzed the enriched
TF binding motifs in the promoters of DEGs. DEG promoters were
revealed to contain a number of G-rich motifs, and would be bound
by activator protein-2 (AP-2), and other factors such as basic
helix-loop-helix protein (bHLH) and Cys2-His2 zinc finger (C2H2 ZF;
Table VI).
| Table VITF motifs enriched in gene promoters
(300 bp) of the upregulated or downregulated genes. |
Table VI
TF motifs enriched in gene promoters
(300 bp) of the upregulated or downregulated genes.
| A, Downregulated
genes |
|---|
| Motif | TF | TF family | FDR |
|---|
| GCCTCAGG | Tcfap2a | AP-2 | <0.001 |
| TCGCCTCAGG | Tcfap2b | AP-2 | <0.001 |
| GCCCGAGGC | Tcfap2c | AP-2 | <0.001 |
| GCCTGAGG | Tcfap2e | AP-2 | <0.001 |
| CACGCG | Hes1 | bHLH | <0.001 |
| CGCGTG | Hes7 | bHLH | <0.001 |
| CGTGC | Sohlh2 | bHLH | <0.001 |
| CACGTG | Tcfl5 | bHLH | <0.001 |
| GGGGGCGG | Sp1 | C2H2 ZF | <0.001 |
| GGGGGGTC | Glis2 | C2H2 ZF | <0.001 |
| GGGGC | Plagl1 | C2H2 ZF | <0.001 |
| GGGGGCGG | Sp4 | C2H2 ZF | <0.001 |
| GGGGGCGG | Sp4 | C2H2 ZF | <0.001 |
| GGCC | Zfp711 | C2H2 ZF | <0.001 |
| GGGG | Zfp202 | C2H2 ZF | <0.001 |
| GGGCGTG | Klf7 | C2H2 ZF | <0.001 |
| GGGGGC | Zbtb7b | C2H2 ZF | <0.001 |
| CACAGCGGG | Zic1 | C2H2 ZF | <0.001 |
| TGCGGG | Zbtb1 | C2H2 ZF | <0.001 |
| CGTGGGCG | Egr3 | C2H2 ZF | <0.001 |
| B, Upregulated
genes |
| Motif | TF | TF family | FDR |
| GGGGGCGG | Sp1 | C2H2 ZF | <0.001 |
| GGGGGCGG | Sp4 | C2H2 ZF | <0.001 |
| GGGGGCGG | Sp4 | C2H2 ZF | <0.001 |
| GGGCGTG | Klf7 | C2H2 ZF | <0.001 |
| TGCGGG | Zbtb1 | C2H2 ZF | <0.001 |
| GGGCG | Klf8 | C2H2 ZF | <0.001 |
| GGGGGGG | Zfp740 | C2H2 ZF | <0.001 |
| GGGGGG | Zfp740 | C2H2 ZF | <0.001 |
| CGCGC | Zfp161 | C2H2 ZF | <0.001 |
| CG | Cxxc1 | CxxC | <0.001 |
| CG | Kdm2b | CxxC | <0.001 |
| GCGC | E2f3 | E2F | <0.001 |
| GGCGC | E2f2 | E2F | <0.001 |
| GTGGGGGCGGGAG | E2f3 | E2F | <0.001 |
| GGGGGCGGGGC | Sp2 | C2H2 ZF | <0.001 |
| GGGCGGGGC | Klf5 | C2H2 ZF | <0.001 |
| GGGGGGGGGCC | Patz1 | C2H2 ZF | <0.001 |
| CACAGCGGGGGGTC | Zic4 | C2H2 ZF | <0.001 |
| GTGGGGGGG | Zfp740 | C2H2 ZF | <0.001 |
| CACAGCGGGGGGTC | Zic3 | C2H2 ZF | <0.001 |
The predicted target genes for numerous miRNAs were
then analyzed. As presented in Table Ⅶ, it was identified that
miR-30e-5p, miR-181a-5p and miR-340-5p were significantly enriched
target genes for the downregulated genes. In addition, miR-466d-5p
and miR-466l-5p were significantly enriched target genes for the
upregulated DEGs.
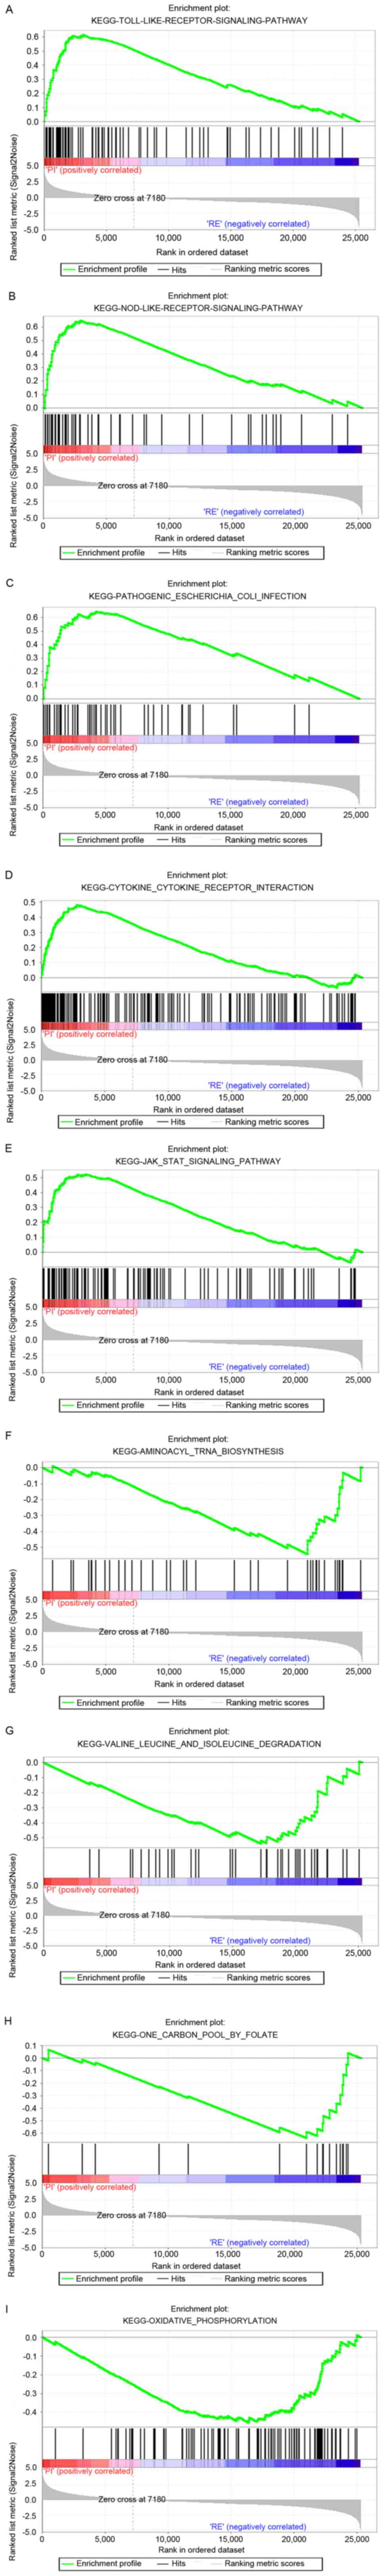
GSEA
To detect KEGG pathways that were differentially
enriched in the PI and RE groups, GSEA was conducted between the PI
and RE groups. The most significantly enriched signaling pathways
were selected based on their NES (Fig.
6 and Table VIII). As
presented in Fig. 6, ‘toll like
receptor (TLR) signaling’, ‘nod like receptor (NLR) signaling’,
‘pathogenic Escherichia coli infection’, ‘cytokine-cytokine
receptor interaction’ and ‘Janus kinase (JAK)/STAT signaling’ were
differentially enriched in the PI group. Furthermore, ‘aminoacyl
tRNA biosynthesis’, ‘valine leucine and isoleucine degradation’,
‘one carbon pool by folate’ and ‘oxidative phosphorylation’ were
differentially enriched in the RE group.
| Table VIIIDifferentially expressed pathways
enriched in the PI and RE mice according to gene set enrichment
analysis. |
Table VIII
Differentially expressed pathways
enriched in the PI and RE mice according to gene set enrichment
analysis.
| A, PI group |
|---|
| Pathway name | NES | Nominal
P-value | FDR value |
|---|
|
Toll_Like_Receptor_Signaling | 2.90 | <0.001 | <0.001 |
|
Nod_Like_Receptor_Signaling | 2.81 | <0.001 | <0.001 |
|
Pathogenic_Escherichia_Coli_Infection | 2.74 | <0.001 | <0.001 |
|
Cytokine_Cytokine_Receptor_Interaction | 2.60 | <0.001 | <0.001 |
|
JAK_STAT_Signaling_Pathway | 2.59 | <0.001 | <0.001 |
|
RIG_I_Like_Receptor_Signaling | 2.53 | <0.001 | <0.001 |
|
Leishmania_Infection | 2.51 | <0.001 | <0.001 |
|
Small_Cell_Lung_Cancer | 2.45 | <0.001 | <0.001 |
|
Cytosolic_Dna_Sensing | 2.42 | <0.001 | <0.001 |
|
Chronic_Myeloid_Leukemia | 2.33 | <0.001 | <0.001 |
| B, RE group |
| Pathway name | NES | Nominal
P-value | FDR value |
|
Aminoacyl_tRNA_Biosynthesis | -1.75 | 0.001 | 0.095 |
|
Valine_Leucine_And_Isoleucine_Degradation | -1.73 | <0.001 | 0.065 |
|
One_Carbon_Pool_By_Folate | -1.70 | 0.006 | 0.065 |
|
Oxidative_Phosphorylation | -1.69 | <0.001 | 0.053 |
Discussion
Sepsis is a clinically common and refractory
critical illness. As a serious complication of sepsis, SA-AKI is
the most common type of AKI in the clinic, with a high mortality
rate (8). At present, owing to the
lack of specific and effective means of SA-AKI prevention and
treatment, it is of critical importance to study the
pathophysiological mechanism and investigate new therapeutic
targets in SA-AKI. Therefore, RNA-Seq was used in the present study
to investigate gene expression profiles related to mice with SA-AKI
that exhibited persistent injury or recovery. The current study
identified some prognosis-related genes, transcription factors,
miRNAs and pathways associated with the differential gene
expression profiles, including metabolic process, the transcription
factor RELA and miR-30e-5p.
κ-means clustering was used to gain insight into the
molecular pathways underlying different gene expression patterns.
This divided the top 2,000 DEGs into four clusters. Genes in
cluster B were upregulated in the RE group, and this cluster was
strongly enriched in genes related to cellular metabolic processes,
such as lipid metabolism and fatty acid metabolism. It has been
reported that lipoproteins play an important role in preventing
infection and inflammation (13).
All lipoproteins can bind and neutralize toxic bacterial substances
to modulate cytokine production during the inflammatory response,
which can weaken the host response (14-16).
Therefore, low lipoprotein levels may damage the innate immune
response to endotoxins, leading to a deterioration of the systemic
inflammatory cascade (15,17-20).
Svahn et al (21) reported
that dietary omega-3 fatty acids can increase sepsis survival and
stimulate the immune system. Omega-3 fatty acids can be metabolized
into a novel substance group termed resolvins (Rv) (22). It has been suggested that treatment
with RvD1 and RvD2 can increase the survival of patients with
sepsis (22-24).
One putative mechanism underlying this process may be the
combination of an increased frequency of neutrophils and precursor
cells in bone marrow and restored phagocytotic capacity (21).
Genes in cluster C were highly upregulated in the PI
group, and this cluster was associated with cytokines, cell death
and apoptosis. Multiple pathways related to cell death are involved
in sepsis due to the pro-inflammatory, anti-inflammatory,
coagulation and complement systems. Apoptosis is a natural process
of cell death, which is genetically programmed and plays a crucial
role in normal physiology and in the pathophysiology of sepsis
(25,26). Apoptosis can be initiated by
pro-inflammatory cytokines, such as tumor necrosis factor α
(TNF-α), interleukin (IL)-1 and IL-6(27). It has been suggested that prevention
of cell apoptosis can improve survival in animal models of sepsis
and endotoxemia (27).
With FDR <0.1 and FC >2 as the cutoff, 5,402
DEGs (2,256 downregulated and 3,146 upregulated genes) were
identified, which have potential to be novel regulators and may
play a role in the pathophysiological mechanism underlying SA-AKI
development. To further understand the molecular pathways,
enrichment analysis of the DEGs was performed. For the GO
Biological Process analysis, consistent with the results of k-means
clustering analysis, it was identified that the upregulated genes
were predominantly involved in cellular metabolic processes.
Furthermore, the downregulated genes were associated with cell
response to stress, cytokine production, apoptosis and cell
death.
As for the GO Cellular Component analysis, it was
identified that upregulated DEGs in the RE group were enriched in
the mitochondrion, cytoskeleton and centrosome. Mitochondria are
cytoplasmic organelles with a double phospholipid membrane that
generate energy via oxidative phosphorylation (28). Mitochondria are also associated with
calcium homeostasis, intracellular reactive oxygen species (ROS)
generation and cell signaling functions (29,30).
In response to sepsis, the inflammatory cytokines of the innate
immune response, including TNF-α, IL-1 and IL-6, can promote
mitochondrial permeability transition, inhibit oxidative
phosphorylation and improve ROS production (31,32).
It has been demonstrated that mitochondrial dysfunction plays a
critical role in SA-AKI (33).
However, further studies are still needed to clarify the molecular
mechanism underlying mitochondrial dysfunction in SA-AKI.
The cytoskeleton is a necessary dynamic structure
for cells that plays an important role in regulating cell
permeability under physiological and pathophysiological conditions
(34). The cytoskeleton pathway is
a known modulator of endothelial barrier function and microvascular
permeability (35). It is well
known that an inflammatory stimulus can lead to the development of
capillary leak and tissue edema due to cytoskeletal rearrangement,
which is a characteristic feature of sepsis; its development is one
of the causes of organ dysfunction in sepsis (36). A meta-analysis of transcriptomic
data demonstrated that the cytoskeletal pathway was upregulated in
sepsis patients compared with controls (37). Previous studies have found that the
breakdown in blood/endothelial barrier function plays a vital role
in the pathogenesis and organ function and could be a new
therapeutic target for sepsis (38,39).
Cytokine production is a milestone in the immune
response during inflammation and is associated with mortality
during sepsis (40). Vertii et
al (41) found that centrosome
integrity is critical for cytokine production. Impaired cytokine
production may predispose the host to infection.
For the GO Molecular Function analysis, it was
confirmed that the downregulated genes in the RE group were
enriched in enzyme binding and receptor binding. Furthermore, the
upregulated genes in the RE group were enriched in transporter
activity and active transmembrane transporter activity. This could
indicate that transporter activity and active transmembrane
transporter activity may be involved in sepsis recovery. The Slc7a7
gene provides instructions for the production of a protein termed
y+L amino acid transporter 1 (y+LAT-1), which is involved in
transporting certain protein building blocks (amino acids), namely,
lysine, arginine and ornithine. The transport of amino acids from
the small intestines and kidneys to the rest of the body is
necessary for the body to utilize proteins. The y+LAT-1 protein
forms one part (the light subunit) of a complex called the
heterodimeric cationic amino acid transporter. This subunit is
responsible for binding to the amino acids that are transported
(42). However, whether the Slc7a7
gene is involved in the recovery of sepsis requires further
study.
The present study identified that the TF target
genes RELA and STAT3 were significantly associated with the
downregulated genes in the RE group. RELA is a REL-associated
protein involved in NF-κB heterodimer formation, nuclear
translocation and activation (43).
As a nuclear transcription factor of various cells, NF-κB plays a
crucial role in the coordination of innate and adaptive immune
responses in sepsis (44). NF-κB
binds with IκB-α and forms a p65/p60 dimer in the cytoplasm in
physiological conditions (45). In
stress, IκB-α isolates NF-κB and is transferred to the nucleus,
where it binds proinflammatory cytokines and promotes the gene
transcription of TNF-α and IL-6 to further activate NF-κB to expand
the inflammatory response (46).
STAT3 is a member of the STAT protein family and can mediate the
expression of various genes that stimulate cells. In response to
cytokines and growth factors, STAT3 can be phosphorylated by
receptor-related JAK and translocate to the cell nucleus where it
acts as a transcriptional activator (47). The STAT3 pathway plays an important
role in inflammatory signaling cascades and its activation can play
a crucial role in host-bacterial interactions (48). Cytokines, such as IL-6 and IL-10,
can cause the phosphorylation of the tyrosine and serine residues
of STAT3 via JAK. Activated STAT3 can in turn translocate into the
nucleus where it binds to specific promotor sequences and regulate
the transcription of target genes (49). Zhuo et al (24) demonstrated that RvD1 may improve
survival and attenuate the degree of lung inflammation of septic
mice by suppressing STAT3 and NF-κB expression through a mechanism
that is partly dependent on SIRT1.
TF binding motifs (TFBMs) have conserved DNA
sequence elements in their promoter regions. TFBMs can act as
binding sites for transcription factors and coordinate the
expression of genes in the promoter regions that they appear
(50). As TFs typically bind to DNA
at sites matching specific sequences motifs, knowledge of the
motifs for a TF will be useful to determine a potential binding
site of the TF (51). The present
study detected that the DEG promoters were overrepresented with
numerous G-rich motifs that are bound by AP-2 and other factors,
such as bHLH and C2H2 ZF. AP-2 transcription factors (TFAP-2)
constitute a family of closely related and evolutionarily conserved
proteins that bind to the DNA consensus sequence
GCCN3GGC and stimulate target gene transcription
(52). AP-2 consists of five
different proteins in human and mouse: AP-2α, AP-2β, AP-2γ, AP-2δ
and AP-2ε (53). A previous study
found that various inflammatory cytokines and prostaglandins can
induce the expression of TFAP-2, which in turn causes aberrant
activation of genes associated with hyperproliferation of mesangial
cells and nephrosclerosis (54).
Knocking down TFAP2A significantly decreases TF binding and the
gene expression of collagen IV, which may play a critical role in
diabetic nephropathy (55).
Our study demonstrated that miR-30e-5p, miR-181a-5p
and miR-340-5p were significantly enriched target genes for the
downregulated genes, and miR-466d-5p and miR-466l-5p were
significantly enriched target genes for the upregulated DEGs.
miRNAs and TFs share a common link as two vital gene regulatory
molecules in multicellular organisms (56). miRNAs are a family of small
non-coding RNAs that modulate gene expression in a
sequence-specific manner, and as a result they regulate numerous
cellular processes at the post-transcriptional level (57). miR-30e-5p is a member of the miR-30
family, and plays a critical role in renal development and
maintaining renal function (58).
Sun et al (59) reported
that the circulating miR-30e-5p level is significantly elevated in
contrast-induced AKI. This may be associated with the
pathophysiology of AKI. The miR-181 family has been demonstrated to
control inflammation under physiological and pathological
conditions by modulating various key aspects of growth, development
and activation (60). A previous
study demonstrated that miR-340 can inhibit cell proliferation,
tumor migration and invasion by targeting JAK via the JAK1/STAT3
signaling pathway (61). It has
been indicated that miR-466l may to be a negative regulator of
multiple proinflammatory cytokines, such as interferons and IL-10
(62,63). These miRNAs may be potential
therapeutic targets for SA-AKI.
The innate immune system is the first line of
defense against microbial invasion, relying on pattern recognition
receptors to recognize external pathogenic microorganisms and then
remove them (64). TLRs and NLRs
are important receptors that mediate immune recognition by
recognizing pathogen-associated molecular patterns derived from
various microbes. These processes are bridges between innate
immunity and adaptive immunity (65).
In conclusion, the present study examined gene
expression profiles of a SA-AKI model that exhibited persistent
renal injury or renal recovery using RNA-Seq. A number of
prognosis-related genes, transcription factors, miRNAs and pathways
were identified to be associated with the differential expression
profile, including metabolic process, the transcription factor RELA
and miR-30e-5p, which provide some basis for future experimental
studies. Further validation, particularly in human tissues, may
provide a more comprehensive understanding of the underlying
pathophysiology during SA-AKI.
Supplementary Material
Table SI. Enriched genes in the
upregulated genes of the recovery group according to the GO
Molecular Function terms.
Acknowledgements
The authors wish to thank Dr Wanling Yang
(Department of Pediatrics and Adolescent Medicine, Li Ka Shing
Faculty of Medicine, University of Hong Kong, Hong Kong, SAR, P.R.
China) for providing constructive instructions and comments on the
design of the present study.
Funding
This work was supported by a grant from the National
Nature Science Foundation of China (grant no. 81670621) and the
Nature Science Foundation of Zhejiang Province (grant no.
LY16H050001).
Availability of data and materials
The datasets used and/or analysed during the current
study are available from the corresponding author on reasonable
request.
Authors' contributions
YY conceived the study, participated in its design
and coordination, and drafted the manuscript. JY participated in
the experiments and bioinformatics analysis, and contributed to
drafting the manuscript. BW performed all statistical analysis. FH
participated in its design and coordination, drafted the manuscript
and revised the manuscript for important intellectual content. JC
conceived the study and revised the manuscript important
intellectual content. All authors read and approved the final
manuscript.
Ethics approval and consent to
participate
All protocols of this study were approved by the
Animal Ethics Committee of the First Affiliated Hospital, College
of Medicine, Zhejiang University, Hangzhou, Zhejiang (approval ID.
2016160; 25 February 2016), which follows the institutional
guidelines.
Patient consent for participation
Not applicable.
Competing interests
The authors declare that they have no competing
interests.
References
|
1
|
Singer M, Deutschman CS, Seymour CW,
Shankar-Hari M, Annane D, Bauer M, Bellomo R, Bernard GR, Chiche
JD, Coopersmith CM, et al: The third international consensus
definitions for sepsis and septic shock (Sepsis-3). JAMA.
315:801–810. 2016.PubMed/NCBI View Article : Google Scholar
|
|
2
|
Kellum JA and Lameire N: KDIGO AKI
Guideline Work Group: Diagnosis, evaluation, and management of
acute kidney injury: A KDIGO summary (Part 1). Crit Care.
17(204)2013.PubMed/NCBI View
Article : Google Scholar
|
|
3
|
Hoste EA, Lameire NH, Vanholder RC, Benoit
DD, Decruyenaere JM and Colardyn FA: Acute renal failure in
patients with sepsis in a surgical ICU: Predictive factors,
incidence, comorbidity, and outcome. J Am Soc Nephrol.
14:1022–1030. 2003.PubMed/NCBI View Article : Google Scholar
|
|
4
|
Uchino S, Kellum JA, Bellomo R, Doig GS,
Morimatsu H, Morgera S, Schetz M, Tan I, Bouman C, Macedo E, et al:
Acute renal failure in critically ill patients: A multinational,
multicenter study. JAMA. 294:813–818. 2005.PubMed/NCBI View Article : Google Scholar
|
|
5
|
Morrell ED, Kellum JA, Pastor-Soler NM and
Hallows KR: Septic acute kidney injury: Molecular mechanisms and
the importance of stratification and targeting therapy. Crit Care.
18(501)2014.PubMed/NCBI View Article : Google Scholar
|
|
6
|
Bagshaw SM, Uchino S, Bellomo R, Morimatsu
H, Morgera S, Schetz M, Tan I, Bouman C, Macedo E, Gibney N, et al:
Septic acute kidney injury in critically ill patients: Clinical
characteristics and outcomes. Clin J Am Soc Nephrol. 2:431–439.
2007.PubMed/NCBI View Article : Google Scholar
|
|
7
|
Bouchard J, Acharya A, Cerda J,
Maccariello ER, Madarasu RC, Tolwani AJ, Liang X, Fu P, Liu ZH and
Mehta RL: A prospective international multicenter study of AKI in
the intensive care unit. Clin J Am Soc Nephrol. 10:1324–1331.
2015.PubMed/NCBI View Article : Google Scholar
|
|
8
|
Poston JT and Koyner JL: Sepsis associated
acute kidney injury. BMJ. 364(k4891)2019.PubMed/NCBI View Article : Google Scholar
|
|
9
|
Tran M, Tam D, Bardia A, Bhasin M, Rowe
GC, Kher A, Zsengeller ZK, Akhavan-Sharif MR, Khankin EV,
Saintgeniez M, et al: PGC-1α promotes recovery after acute kidney
injury during systemic inflammation in mice. J Clin Invest.
121:4003–4014. 2011.PubMed/NCBI View
Article : Google Scholar
|
|
10
|
Stark R, Grzelak M and Hadfield J: RNA
sequencing: The teenage years. Nat Rev Genet. 20:631–656.
2019.PubMed/NCBI View Article : Google Scholar
|
|
11
|
Ge SX, Son EW and Yao R: iDEP: An
integrated web application for differential expression and pathway
analysis of RNA-Seq data. BMC Bioinformatics.
19(534)2018.PubMed/NCBI View Article : Google Scholar
|
|
12
|
Subramanian A, Tamayo P, Mootha VK,
Mukherjee S, Ebert BL, Gillette MA, Paulovich A, Pomeroy SL, Golub
TR, Lander ES and Mesirov JP: Gene set enrichment analysis: A
knowledge-based approach for interpreting genome-wide expression
profiles. Proc Natl Acad Sci USA. 102:15545–15550. 2005.PubMed/NCBI View Article : Google Scholar
|
|
13
|
Goldstein B, Giroir B and Randolph A:
International Consensus Conference on Pediatric Sepsis:
International pediatric sepsis consensus conference: Definitions
for sepsis and organ dysfunction in pediatrics. Pediatr Crit Care
Med. 6:2–8. 2005.PubMed/NCBI View Article : Google Scholar
|
|
14
|
Wu A, Hinds CJ and Thiemermann C:
High-density lipoproteins in sepsis and septic shock: Metabolism,
actions, and therapeutic applications. Shock. 21:210–221.
2004.PubMed/NCBI View Article : Google Scholar
|
|
15
|
Murch O, Collin M, Hinds CJ and
Thiemermann C: Lipoproteins in inflammation and sepsis. I. Basic
science. Intensive Care Med. 33:13–24. 2007.PubMed/NCBI View Article : Google Scholar
|
|
16
|
Vyroubal P, Chiarla C, Giovannini I,
Hyspler R, Ticha A, Hrnciarikova D and Zadak Z: Hypocholesterolemia
in clinically serious conditions-review. Biomed Pap Med Fac Univ
Palacky Olomouc Czech Repub. 152:181–189. 2008.PubMed/NCBI View Article : Google Scholar
|
|
17
|
Tsai MH, Peng YS, Chen YC, Lien JM, Tian
YC, Fang JT, Weng HH, Chen PC, Yang CW and Wu CS: Low serum
concentration of apolipoprotein A-I is an indicator of poor
prognosis in cirrhotic patients with severe sepsis. J Hepatol.
50:906–915. 2009.PubMed/NCBI View Article : Google Scholar
|
|
18
|
Chenaud C, Merlani PG, Roux-Lombard P,
Burger D, Harbarth S, Luyasu S, Graf JD, Dayer JM and Ricou B: Low
apolipoprotein A-I level at intensive care unit admission and
systemic inflammatory response syndrome exacerbation. Crit Care
Med. 32:632–637. 2004.PubMed/NCBI View Article : Google Scholar
|
|
19
|
Barlage S, Gnewuch C, Liebisch G, Wolf Z,
Audebert FX, Glück T, Fröhlich D, Krämer BK, Rothe G and Schmitz G:
Changes in HDL-associated apolipoproteins relate to mortality in
human sepsis and correlate to monocyte and platelet activation.
Intensive Care Med. 35:1877–1885. 2009.PubMed/NCBI View Article : Google Scholar
|
|
20
|
Bonville DA, Parker TS, Levine DM, Gordon
BR, Hydo LJ, Eachempati SR and Barie PS: The relationships of
hypocholesterolemia to cytokine concentrations and mortality in
critically ill patients with systemic inflammatory response
syndrome. Surg Infect (Larchmt.). 5:39–49. 2004.PubMed/NCBI View Article : Google Scholar
|
|
21
|
Svahn SL, Ulleryd MA, Grahnemo L, Ståhlman
M, Borén J, Nilsson S, Jansson JO and Johansson ME: Dietary omega-3
fatty acids increase survival and decrease bacterial load in mice
subjected to staphylococcus aureus-induced sepsis. Infect Immun.
84:1205–1213. 2016.PubMed/NCBI View Article : Google Scholar
|
|
22
|
Spite M, Norling LV, Summers L, Yang R,
Cooper D, Petasis NA, Flower RJ, Perretti M and Serhan CN: Resolvin
D2 is a potent regulator of leukocytes and controls microbial
sepsis. Nature. 461:1287–1291. 2009.PubMed/NCBI View Article : Google Scholar
|
|
23
|
Chen F, Fan XH, Wu YP, Zhu JL, Wang F, Bo
LL, Li JB, Bao R and Deng XM: Resolvin D1 improves survival in
experimental sepsis through reducing bacterial load and preventing
excessive activation of inflammatory response. Eur J Clin Microbiol
Infect Dis. 33:457–464. 2014.PubMed/NCBI View Article : Google Scholar
|
|
24
|
Zhuo Y, Zhang S, Li C, Yang L, Gao H and
Wang X: Resolvin D1 promotes SIRT1 expression to counteract the
activation of STAT3 and NF-κB in mice with septic-associated lung
injury. Inflammation. 41:1762–1771. 2018.PubMed/NCBI View Article : Google Scholar
|
|
25
|
Kerr JF, Wyllie AH and Currie AR:
Apoptosis: A basic biological phenomenon with wide-ranging
implications in tissue kinetics. Br J Cancer. 26:239–257.
1972.PubMed/NCBI View Article : Google Scholar
|
|
26
|
Ayala A, Perl M, Venet F, Lomas-Neira J,
Swan R and Chung CS: Apoptosis in sepsis: Mechanisms, clinical
impact and potential therapeutic targets. Curr Pharm Des.
14:1853–1859. 2008.PubMed/NCBI View Article : Google Scholar
|
|
27
|
Harjai M, Bogra J, Kohli M and Pant AB: Is
suppression of apoptosis a new therapeutic target in sepsis?
Anaesth Intensive Care. 41:175–183. 2013.PubMed/NCBI View Article : Google Scholar
|
|
28
|
Green DR, Galluzzi L and Kroemer G:
Mitochondria and the autophagy-inflammation-cell death axis in
organismal aging. Science. 333:1109–1112. 2011.PubMed/NCBI View Article : Google Scholar
|
|
29
|
Galley HF: Oxidative stress and
mitochondrial dysfunction in sepsis. Br J Anaesth. 107:57–64.
2011.PubMed/NCBI View Article : Google Scholar
|
|
30
|
Rocha M, Herance R, Rovira S,
Hernandez-Mijares A and Victor VM: Mitochondrial dysfunction and
antioxidant therapy in sepsis. Infect Disord Drug Targets.
12:161–178. 2012.PubMed/NCBI View Article : Google Scholar
|
|
31
|
Siskind LJ, Kolesnick RN and Colombini M:
Ceramide channels increase the permeability of the mitochondrial
outer membrane to small proteins. J Biol Chem. 277:26796–26803.
2002.PubMed/NCBI View Article : Google Scholar
|
|
32
|
Garcia-Ruiz C, Colell A, Mari M, Morales A
and Fernandez-Checa JC: Direct effect of ceramide on the
mitochondrial electron transport chain leads to generation of
reactive oxygen species. Role of mitochondrial glutathione. J Biol
Chem. 272:11369–11377. 1997.PubMed/NCBI View Article : Google Scholar
|
|
33
|
Sureshbabu A, Patino E, Ma KC, Laursen K,
Finkelsztein EJ, Akchurin O, Muthukumar T, Ryter SW, Gudas L, Choi
AMK and Choi ME: RIPK3 promotes sepsis-induced acute kidney injury
via mitochondrial dysfunction. JCI Insight.
3(e98411)2018.PubMed/NCBI View Article : Google Scholar
|
|
34
|
Rodgers LS and Fanning AS: Regulation of
epithelial permeability by the actin cytoskeleton. Cytoskeleton
(Hoboken). 68:653–660. 2011.PubMed/NCBI View Article : Google Scholar
|
|
35
|
Jacobson JR and Garcia JG: Novel therapies
for microvascular permeability in sepsis. Curr Drug Targets.
8:509–514. 2007.PubMed/NCBI View Article : Google Scholar
|
|
36
|
Gustot T: Multiple organ failure in
sepsis: Prognosis and role of systemic inflammatory response. Curr
Opin Crit Care. 17:153–159. 2011.PubMed/NCBI View Article : Google Scholar
|
|
37
|
Ma J, Chen C, Barth AS, Cheadle C, Guan X
and Gao L: Lysosome and cytoskeleton pathways are robustly enriched
in the blood of septic patients: A meta-analysis of transcriptomic
data. Mediators Inflamm. 2015(984825)2015.PubMed/NCBI View Article : Google Scholar
|
|
38
|
de Montmollin E and Annane D: Year in
review 2010: Critical care-multiple organ dysfunction and sepsis.
Crit Care. 15(236)2011.PubMed/NCBI View Article : Google Scholar
|
|
39
|
Goldenberg NM, Steinberg BE, Slutsky AS
and Lee WL: Broken barriers: A new take on sepsis pathogenesis. Sci
Transl Med. 3(88ps25)2011.PubMed/NCBI View Article : Google Scholar
|
|
40
|
Chousterman BG, Swirski FK and Weber GF:
Cytokine storm and sepsis disease pathogenesis. Semin Immunopathol.
39:517–528. 2017.PubMed/NCBI View Article : Google Scholar
|
|
41
|
Vertii A, Ivshina M, Zimmerman W, Hehnly
H, Kant S and Doxsey S: The centrosome undergoes Plk1-independent
interphase maturation during inflammation and mediates cytokine
release. Dev Cell. 37:377–386. 2016.PubMed/NCBI View Article : Google Scholar
|
|
42
|
Sperandeo MP, Andria G and Sebastio G:
Lysinuric protein intolerance: Update and extended mutation
analysis of the SLC7A7 gene. Hum Mutat. 29:14–21. 2008.PubMed/NCBI View Article : Google Scholar
|
|
43
|
Lesina M, Wörmann SM, Morton J,
Diakopoulos KN, Korneeva O, Wimmer M, Einwächter H, Sperveslage J,
Demir IE, Kehl T, et al: RelA regulates CXCL1/CXCR2-dependent
oncogene-induced senescence in murine Kras-driven pancreatic
carcinogenesis. J Clin Invest. 126:2919–2932. 2016.PubMed/NCBI View Article : Google Scholar
|
|
44
|
Chen Y, Guo L, Lang H, Hu X, Jing S, Luo
M, Xu G and Zhou Z: Effect of a stellate ganglion block on acute
lung injury in septic rats. Inflammation. 41:1601–1609.
2018.PubMed/NCBI View Article : Google Scholar
|
|
45
|
Zhu T, Wang DX, Zhang W, Liao XQ, Guan X,
Bo H, Sun JY, Huang NW, He J, Zhang YK, et al: Andrographolide
protects against LPS-induced acute lung injury by inactivation of
NF-κB. PLoS One. 8(e56407)2013.PubMed/NCBI View Article : Google Scholar
|
|
46
|
Ni S, Miao K, Zhou X, Xu N, Li C, Zhu R,
Sun R and Wang Y: The involvement of follistatin-like protein 1 in
osteoarthritis by elevating NF-κB-mediated inflammatory cytokines
and enhancing fibroblast like synoviocyte proliferation. Arthritis
Res Ther. 17(91)2015.PubMed/NCBI View Article : Google Scholar
|
|
47
|
Lim CP and Cao X: Structure, function, and
regulation of STAT proteins. Mol Biosyst. 2:536–550.
2006.PubMed/NCBI View Article : Google Scholar
|
|
48
|
Lu R, Zhang YG and Sun J: STAT3 activation
in infection and infection-associated cancer. Mol Cell Endocrinol.
451:80–87. 2017.PubMed/NCBI View Article : Google Scholar
|
|
49
|
Ghilardi N, Ziegler S, Wiestner A, Stoffel
R, Heim MH and Skoda RC: Defective STAT signaling by the leptin
receptor in diabetic mice. Proc Natl Acad Sci USA. 93:6231–6235.
1996.PubMed/NCBI View Article : Google Scholar
|
|
50
|
Devi SJ, Madhav MS, Kumar GR, Goel AK,
Umakanth B, Jahnavi B and Viraktamath BC: Identification of abiotic
stress miRNA transcription factor binding motifs (TFBMs) in rice.
Gene. 531:15–22. 2013.PubMed/NCBI View Article : Google Scholar
|
|
51
|
Zamanighomi M, Lin Z, Wang Y, Jiang R and
Wong WH: Predicting transcription factor binding motifs from
DNA-binding domains, chromatin accessibility and gene expression
data. Nucleic Acids Res. 45:5666–5677. 2017.PubMed/NCBI View Article : Google Scholar
|
|
52
|
Eckert D, Buhl S, Weber S, Jäger R and
Schorle H: The AP-2 family of transcription factors. Genome Biol.
6(246)2005.PubMed/NCBI View Article : Google Scholar
|
|
53
|
Xu X, Liu Z, Huang H, Zheng K, Hu X, Zhang
Z and Qiu M: AP-2α and AP-2β regulate dorsal interneuron
specification in the spinal cord. Neuroscience. 340:232–242.
2017.PubMed/NCBI View Article : Google Scholar
|
|
54
|
Suyama K, Kabuyama Y, Suzuki S, Kawasaki
Y, Suzuki J, Suzuki H and Homma Y: Induction of transcription
factor AP-2 by cytokines and prostaglandins in cultured mesangial
cells. Am J Nephrol. 21:307–314. 2001.PubMed/NCBI View Article : Google Scholar
|
|
55
|
Mi X, Tang W, Chen X, Liu F and Tang X:
Mitofusin 2 attenuates the histone acetylation at collagen IV
promoter in diabetic nephropathy. J Mol Endocrinol. 57:233–249.
2016.PubMed/NCBI View Article : Google Scholar
|
|
56
|
Hobert O: Gene regulation by transcription
factors and microRNAs. Science. 319:1785–1786. 2008.PubMed/NCBI View Article : Google Scholar
|
|
57
|
He L and Hannon GJ: MicroRNAs: Small RNAs
with a big role in gene regulation. Nat Rev Genet. 5:522–531.
2004.PubMed/NCBI View Article : Google Scholar
|
|
58
|
Dieter C, Assmann TS, Costa AR, Canani LH,
de Souza BM, Bauer AC and Crispim D: MiR-30e-5p and MiR-15a-5p
expressions in plasma and urine of type 1 diabetic patients with
diabetic kidney disease. Front Genet. 10(563)2019.PubMed/NCBI View Article : Google Scholar
|
|
59
|
Sun SQ, Zhang T, Ding D, Zhang WF, Wang
XL, Sun Z, Hu LH, Qin SY, Shen LH and He B: Circulating
MicroRNA-188, -30a, and -30e as early biomarkers for
contrast-induced acute kidney injury. J Am Heart Assoc.
5(e004138)2016.PubMed/NCBI View Article : Google Scholar
|
|
60
|
Galicia JC, Naqvi AR, Ko CC, Nares S and
Khan AA: MiRNA-181a regulates Toll-like receptor agonist-induced
inflammatory response in human fibroblasts. Genes Immun.
15:333–337. 2014.PubMed/NCBI View Article : Google Scholar
|
|
61
|
Yuan J, Ji H, Xiao F, Lin Z, Zhao X, Wang
Z, Zhao J and Lu J: MicroRNA-340 inhibits the proliferation and
invasion of hepatocellular carcinoma cells by targeting JAK1.
Biochem Biophys Res Commun. 483:578–584. 2017.PubMed/NCBI View Article : Google Scholar
|
|
62
|
Li Y, Fan X, He X, Sun H, Zou Z, Yuan H,
Xu H, Wang C and Shi X: MicroRNA-466l inhibits antiviral innate
immune response by targeting interferon-alpha. Cell Mol Immunol.
9:497–502. 2012.PubMed/NCBI View Article : Google Scholar
|
|
63
|
Ma F, Liu X, Li D, Wang P, Li N, Lu L and
Cao X: MicroRNA-466l upregulates IL-10 expression in TLR-triggered
macrophages by antagonizing RNA-binding protein
tristetraprolin-mediated IL-10 mRNA degradation. J Immunol.
184:6053–6059. 2010.PubMed/NCBI View Article : Google Scholar
|
|
64
|
Rout AK, Udgata SR, Dehury B, Pradhan SP,
Swain HS, Behera BK and Das BK: Structural bioinformatics insights
into the CARD-CARD interaction mediated by the mitochondrial
antiviral-signaling protein of black carp. J Cell Biochem.
120:12534–12543. 2019.PubMed/NCBI View Article : Google Scholar
|
|
65
|
Creagh EM and O'Neill LA: TLRs, NLRs and
RLRs: A trinity of pathogen sensors that co-operate in innate
immunity. Trends Immunol. 27:352–357. 2006.PubMed/NCBI View Article : Google Scholar
|