Introduction
Type 2 diabetes mellitus (T2DM) is a type of
metabolic syndrome that accounts for 90-95% of cases of diabetes.
Metabolic disorders of proteins, lipids and carbohydrates may lead
to obesity, hyperglycaemia, hypertension and dyslipidaemia, as well
as to a series of pathological conditions and damage in multiple
tissues (1). Due to genetic
inheritance and multiple exogenous causes, including lifestyle
changes, accelerated pace of life and poor eating habits, current
data suggest an ongoing increase in the prevalence of T2DM
(2-4).
A notable causative factor for T2DM is overnutrition
through poor diet, leading to the onset of an overweight status
(4). A high-fat diet may impair the
function of Paneth cells, a type of intestinal epithelial cell
capable of secreting antimicrobial peptides to resist microbial
invasion (5). Loss of intestinal
epithelial integrity and reduced expression of certain
antimicrobial peptides leads to a significant increase in the
levels of lipopolysaccharides, which may result in metabolic
inflammation in the liver and serum, promoting the development of
metabolic syndrome. A low-fat diet involves reducing the intake of
foods with a high lipid content (triglycerides and cholesterol) and
increasing the intake of nondigestible but fermentable
carbohydrates (dietary fibres), which is an effective strategy for
alleviating the disease phenotypes of T2DM (6). A previous study explored the effects
of a low-fat diet on inflammation, insulin resistance and hepatic
steatosis, and suggested a reduction in monocyte chemoattractant
protein-1, F4/80 antibody and tumour necrosis factor-α mRNA
following a 12-week low-fat diet in high-fat diet-induced obese
mice, highlighting the vital role of a low-fat diet in the
prophylaxis of obesity-associated metabolic disorders (7).
Microscopically, intestinal microbes have a critical
role in human metabolic activity have a mutual association with
human health (8). Prevotella
copri and Bacteroides vulgatus are able to promote the
biosynthesis of branched-chain amino acids (BCAAs), but they lack
the transport system to transport the produced BCAAs into bacterial
cells, resulting in increased levels of serum BCAAs and insulin
resistance (9). Roseburia
spp. exhibits a negative association with blood glucose levels and
has a significantly lower abundance in patients with diabetes than
in healthy individuals (10,11).
After receiving treatment intervention, a characteristic
rearrangement of the composition and diversity of the intestinal
microbiota was detected. Wirth et al (12) previously analysed the distribution
of the microbiota in the duodenum, ileum and intestine and found a
rearrangement in the microbial composition in diabetic mice treated
with insulin, comparing with those in the streptozocin-induced
diabetic and healthy mice. In diabetic mice treated with insulin,
the relative abundance of Bifidobacteriales and
Clostridiales increased whereas that of
Lactobacillales and Proteobacteria were decreased. However,
to the best of our knowledge, only a few long-term studies on the
effect of low-fat diets on the intestinal flora of patients with
T2DM have been performed (13,14).
An in-depth understanding of how the changes in the
intestinal flora upon exposure to new environmental conditions
caused by the low-fat diet treatment arise is of high importance.
In the present study, a low-fat diet was provided to patients with
an initial diagnosis of T2DM, followed by regular and irregular
follow-up over 6 months combined with 16S ribosomal (r)RNA
sequencing technology, and the characteristic changes in the
intestinal flora during this period were analysed.
Materials and methods
Patient recruitment
The present study was approved by the Medical Ethics
Committee of Zhoushan Putuo District People's Hospital (Zhoushan,
China; no. KY2015006) and registered in the Chinese Clinical Trial
Registry (ChiCTR; registration no. ChiCTR1900028663). Patients with
T2DM were recruited as subjects from our hospital inpatient
departments and clinics at The Zhoushan Putuo District People's
Hospital from July 21, 2015 to December 24, 2017 in accordance with
the World Health Organization standards (1999) (15). The inclusion criteria were as
follows: i) Age of >18 years; ii) initial treatment for T2DM
without insulin treatment; iii) no major gastrointestinal surgery
within five years, such as gastric resection; iv) no inflammatory
bowel disease; v) no antibiotic use within the last three months;
vi) BMI ≥24.0; and v) current daily eating habits featuring the
preference of a high-fat diet, including fried food, fatty meat and
cream. All patients must demonstrate good compliance with adhering
to the low-fat diet, follow-up schedule and provided stool samples
at the specified timepoints, and provide written informed consent.
A total of 140 patients were initially diagnosed with T2DM. Of
these, 13 were lost to follow-up, 77 had insufficient compliance
with the dietary instructions during the study period and 17
patients unable to continue to participate in the study due to
aggravation or other illnesses, and were therefore excluded.
Finally, 16 patients with T2DM were included in the present study.
Furthermore, 16 healthy individuals were included in the study.
Basic information of the participants is provided in Tables I and SI.
 | Table IBaseline blood glucose levels and
basic information of the healthy individuals and patients with type
2 diabetes. |
Table I
Baseline blood glucose levels and
basic information of the healthy individuals and patients with type
2 diabetes.
|
Group/parameter | Males/females
(n) | Age (years) | FPG (mmol/l) | 2hPG (mmol/l) | HbA1c (%) | BMI
(kg/m2) |
|---|
| Healthy individuals
(n=16) | 8/8 | 51.55±6.23 | 4.86±0.33 | 6.5±0.5 | 5.6±0.4 | 22.5±1.3 |
| T2DM patients
(n=16) | 9/7 | 50.25±4.95 | 8.05±0.47 | 12.5±0.5 | 6.8±0.3 | 26.4±0.8 |
| t or χ2 | 0.723a | 0.602b | 22.321b | 35.200b | 13.804b | 10.130b |
| P-value | 0.478 | 0.553 | <0.001 | <0.001 | <0.001 | <0.001 |
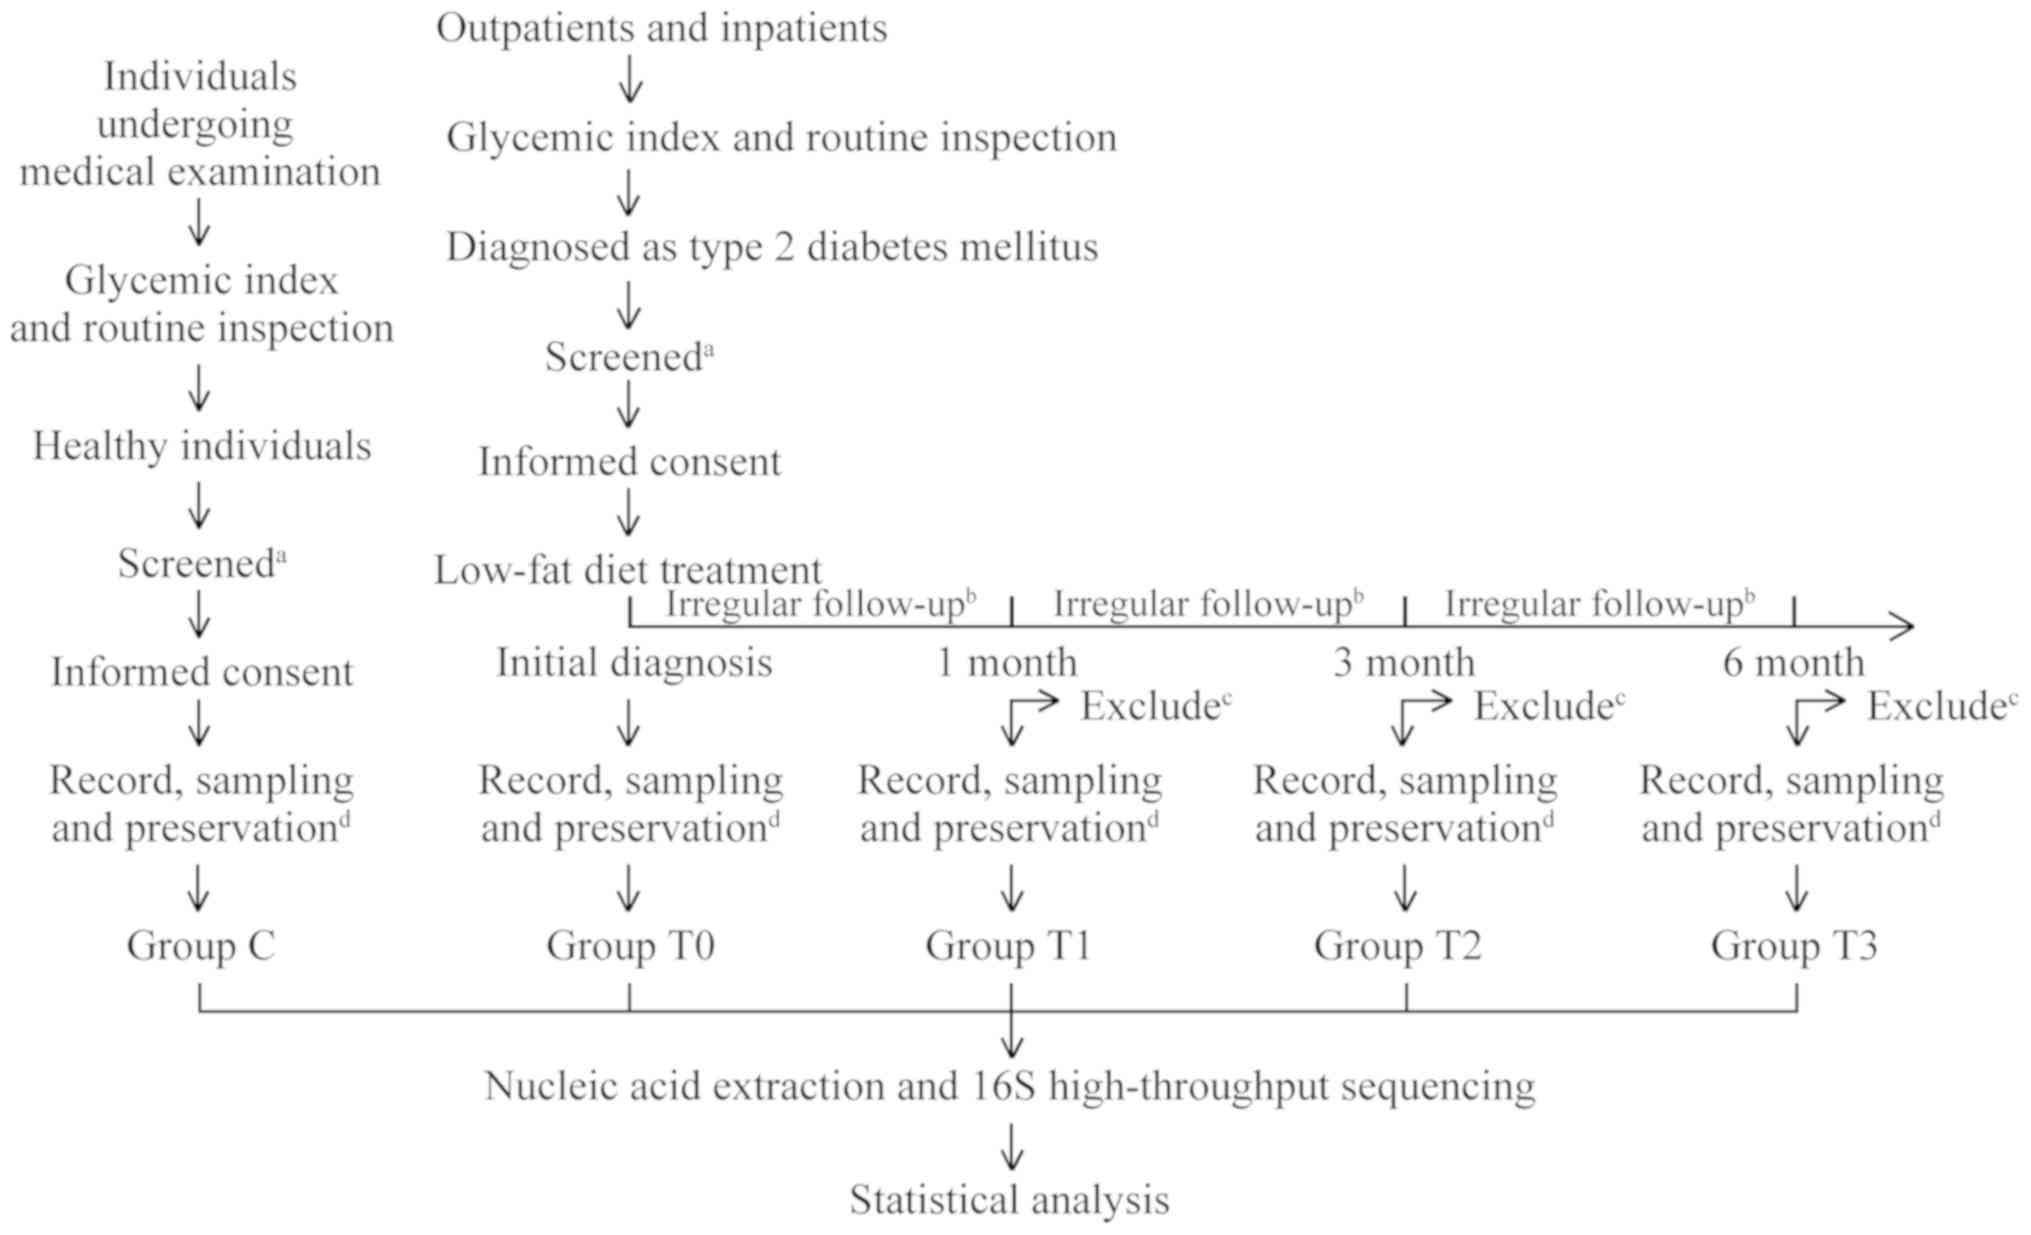
Study group and sample collection
All patients enrolled in the present study were
treated long-term with a low-fat diet. The patients were regularly
followed up at 1, 3 and 6 months after the initial diagnosis and
had weekly or biweekly irregular follow-ups during the treatment.
At the time of initial diagnosis and at each subsequent regular
follow-up, ~3 g of stool sample was collected and placed into
covered sterile plastic tubes. At the same time, the patients'
blood glucose data [fasting plasma glucose (FPG), plasma glucose 2
h after challenge (2hPG) and glycated haemoglobin (HbA1c)], as well
as body height and weight, were recorded. Samples were divided into
four groups according to sampling time: Group T0 (initial
diagnosis), group T1 (1 month of treatment), group T2 (3 months of
treatment) and group T3 (6 months of treatment). Stool samples of
healthy individuals were also collected by using the same method as
the control (group C). A flow chart displaying the movement of the
participants in the present study is provided in Fig. 1.
Low-fat diet treatment options
Based on the Mediterranean diet model, combined with
local dietary habits, low-fat diet treatment options were developed
by the nutritional specialist and varied from person to person
(16). Daily energy intake was
based on each patient's body weight and intensity of daily
activity. In general, the total number of calories required per day
for females was 1,800-2,100 kcal and that for males was 2,100-2,400
kcal (17). Patients were
encouraged to strictly follow a pre-set ratio of the three major
nutrients in their daily energy intake, i.e. 50-60% of
carbohydrates and 15-20% of protein per day, and it was important
to maintain the intake of fat at a level of <25% by increasing
the intake of cellulose and cereals and replacing the intake of
lipids with unsaturated fatty acids (18). Irregular follow-ups were performed
to ensure that the diet was in line with the requirements ≥6 days
per week.
Nucleic acid extraction and library
construction
Nucleic acid extraction was performed using a QIAamp
DNA Stool Mini kit (Qiagen GmbH). The DNA concentration was
measured using a Qubit 2.0 fluorometer (Thermo Fisher Scientific,
Inc.) and an Agilent 2100 Bioanalyzer (Agilent Technologies, Inc.)
was used to evaluate DNA integrity. By comparing the sequences of
16S rRNA V3-V4 regions of a number of bacterial species (accession
nos. NC_005296.1, NC_003888.3, NC_001318.1, NC_021046.1,
NC_021487.1 and NC_021030.1), the sequences of conserved regions
were found. Corresponding forward and reverse primers were designed
based on this conserved region using Primer Premier 5.0 (Premier
Biosoft International). The sequence of the upstream primer in the
V3 region-356 was
5'-TCGTCGGCAGCGTCAGATGTGTATAAGAGACAGCCTACGGGNGGCWGCAG-3' and the
sequence of the downstream primer in the V4 region-803 was
5'-GTCTCGTGGGCTCGGAGATGTGTATAAGAGACAGGACTACHVGGGTATCTAATCC-3'. The
first step of the PCR amplification was performed using
Phusion® High-Fidelity PCR Master Mix (New England
Biolabs, Inc.) and deionized water (Biomed, Inc.) using
thermocycling conditions previously described (19) and the PCR products were purified
using Agencourt AMPure XP beads (Beckman Coulter, Inc.). Barcodes
and sequencing adapters based on sequences in a Nextera XT Index
kit (Illumina, Inc.) were added to the primers aforementioned for
the second PCR step. The second PCR was performed using the
purified products from the first PCR as the template (19), with the same reaction system as that
for the first step aforementioned. The final PCR product was
purified using Agencourt AMPure XP beads (Beckman Coulter, Inc.).
Quality control for all libraries was performed using an Agilent
2100 Bioanalyzer (Thermo Fisher Scientific, Inc.) and a Qubit 2.0
fluorometer (Thermo Fisher Scientific, Inc.). The purified products
(~630 bp) were quantified to a final concentration of 24 nM and
sequenced from 5' to 3'using the Miseq Reagent Kit V3 (cat. no.
MS-102-3003; Illumina, Inc.) for 600 cycle runs. The effective
reads of the paired-end reading sequence could reach 2x300 bases.
The raw data generated by an Illumina MiSeq sequencer (Illumina,
Inc.) were used in the further analyses.
High-throughput sequencing and data
analysis
The FastQC (v0.10.1; http://www.bioinfor
matics.bbsrc.ac.uk/projects/fastqc) was employed to evaluate
the base quality of the test data. The raw test sequence was
subjected to an error rate check, joint processing and other steps
to obtain clean reads. QIIME software (v1.7; http://qiime.org/) was used to filter low-quality
original tags. The USEARCH tool (v10.0.240) (20) was applied to compare the filtered
sequences with the database and remove the embedded sequence
(chimaera sequence) to obtain the final valid tag. Operational
taxonomic unit clustering was performed at a 97% similarity level
using the UCLUST method in QIIME software.
Statistical analysis
The data were analysed using SPSS 19.0 (IBM Corp.).
χ2 tests were used to determine differences between
rates and percentages. Two-tailed Student's t-tests were used to
compare the two groups of continuous variables. Comparison of
intestinal flora composition was performed using one-way analysis
of variance (ANOVA). Repeated-measures ANOVA modified by
Greenhouse-Geisser parameters was used for analysis of repeated
measurement data and then the Bonferroni correction were used for
pairwise comparisons. The significance level was set at
P<0.05.
Results
Changes in blood glucose and body mass
index (BMI) in patients with T2DM during treatment
A total of 16 patients with T2DM and 16 healthy
individuals were included in the present study. There were no
significant differences in age and gender between patients with
T2DM and healthy individuals. FPG, 2hPG, HbA1c and BMI of patients
with T2DM were significantly higher compared with those in healthy
individuals (Tables I and SI).
The low-fat diet treatment generally improved blood
glucose and the BMI in patients with T2DM. Blood glucose
information at different stages of low-fat diet treatment is
provided in Fig. 2. One-way
repeated-measures ANOVA after Greenhouse-Geisser corrections
suggested that the differences in FPG, HbA1c and BMI at different
stages of treatment were statistically significant (P<0.001). At
each follow-up (1, 3 and 6 months of treatment), the average FPG,
HbA1c and BMI were all indicated to be significantly lower compared
with that at the previous timepoint (P<0.05).
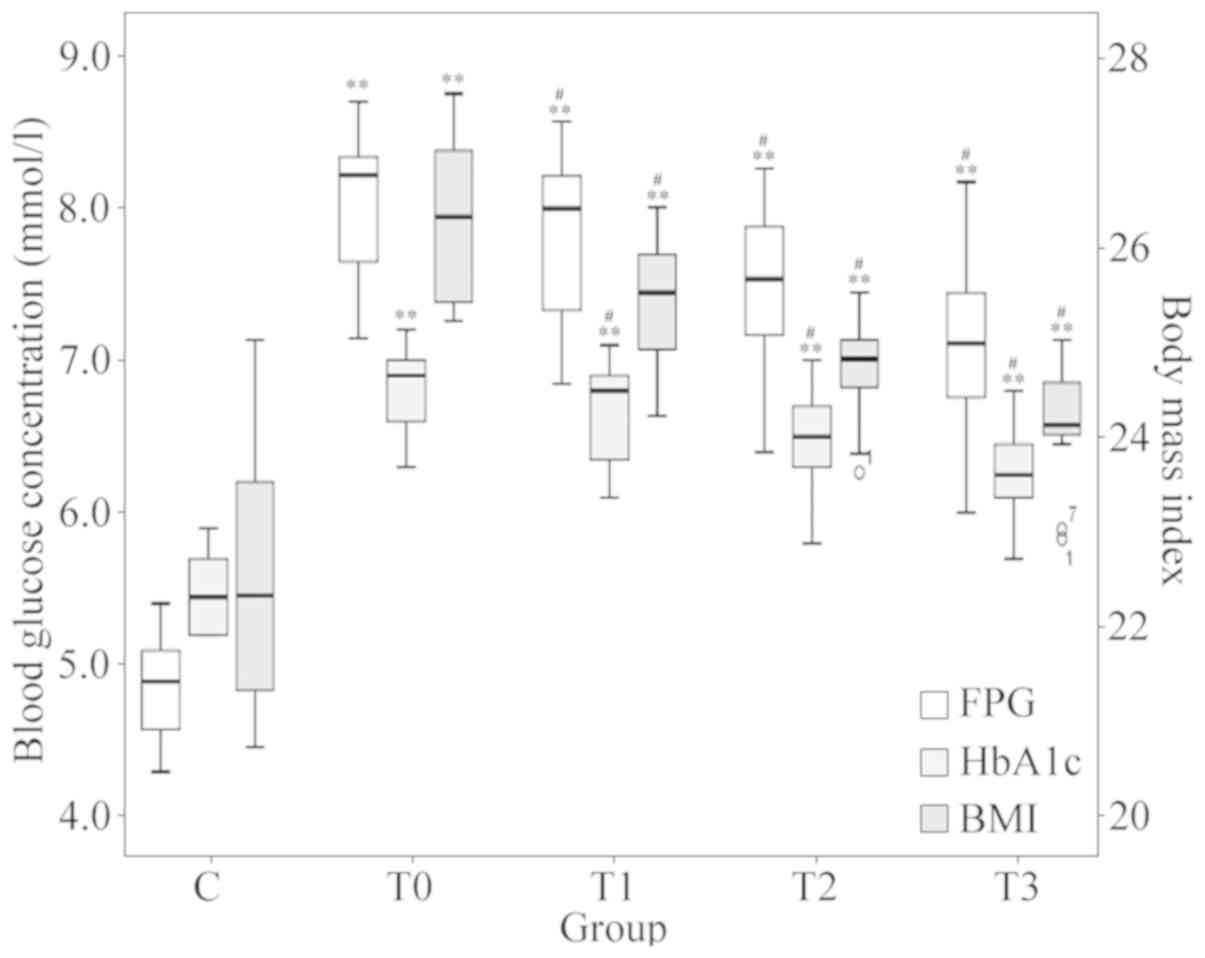 | Figure 2Changes in FPG, HbA1c and BMI. Boxes
of different colours represent the value of FPG, HbA1c and BMI,
respectively (n=16 in each group). The values for FPG and HbA1c
refer to the scale of the ordinate on the left-hand side and the
values for the BMI refer to the scale of the ordinate on the
right-hand side. #P<0.05 vs. the previous timepoint.
**P<0.001 vs. group C. Groups: C, healthy control;
T0, T1, T2 and T3, patients with type 2 diabetes mellitus at the
initial diagnosis and after 1, 3 and 6 months of treatment,
respectively. FPG, fasting plasma glucose; HbA1c, glycosylated
hemoglobin A1c; BMI, body mass index. |
Comparative analysis of the intestinal
flora composition between patients with T2DM and healthy
individuals
At the phylum level, the top 5 microorganisms of the
gut microbiota were Actinobacteria, Bacteroidetes, Firmicutes,
Fusobacteria and Proteobacteria. The composition of bacteria at the
phylum level exhibited no significant difference between healthy
individuals and patients with T2DM. Simultaneously, there was no
significant difference in the composition of the intestinal flora
at the phylum level at different stages of treatment (Fig. S1).
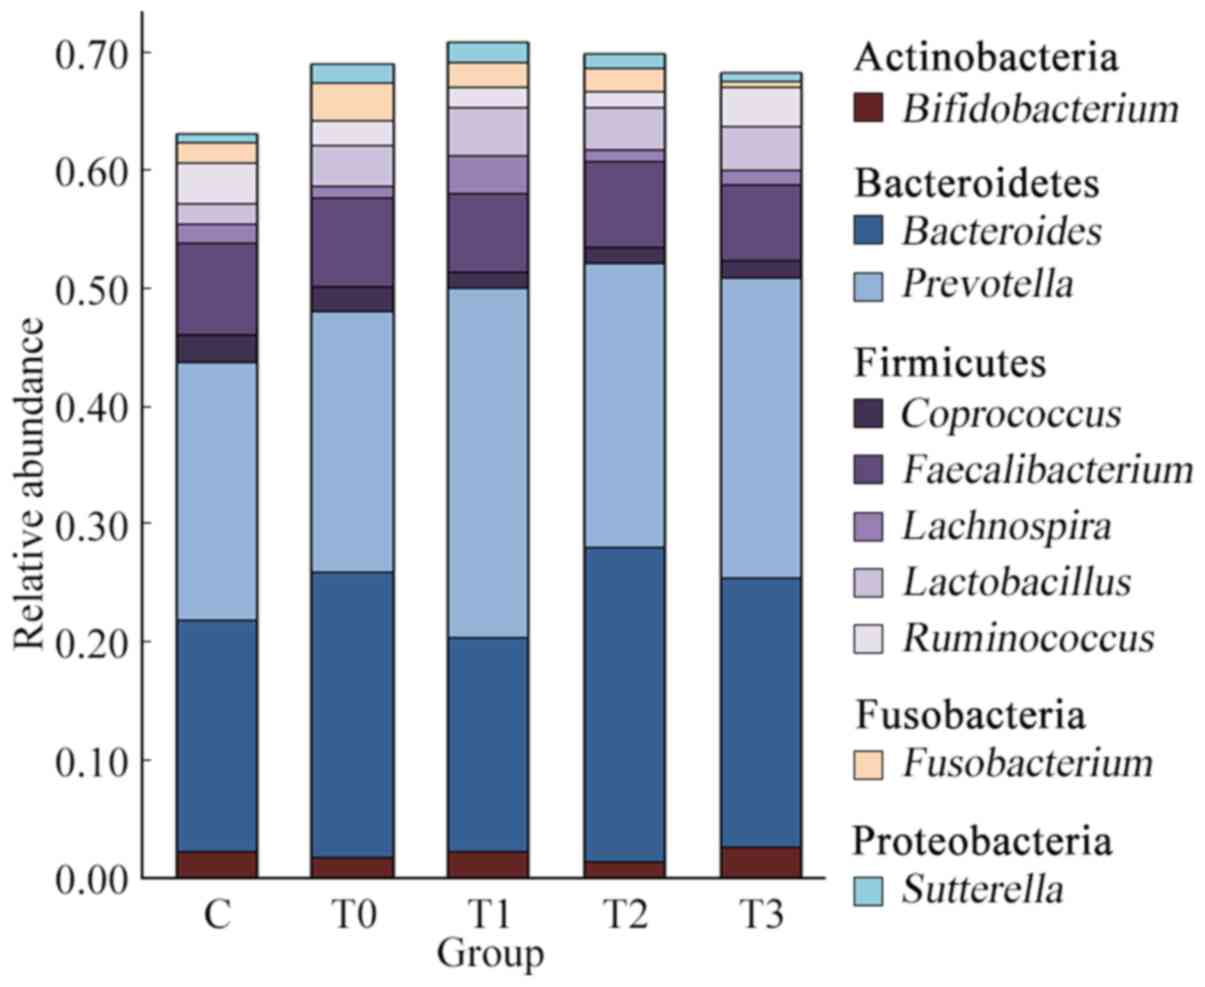
At the genus level, Prevotella, Bacteroides,
Faecalibacterium, Lactobacillus, Ruminococcus, Bifidobacterium,
Fusobacterium, Coprococcus, Lachnospira and Sutterella
were dominant (Fig. 3). These taxa
are common in the human intestinal flora (18). The top 3 predominant genera,
accounting for ~50% of the total microbial abundance, in both
healthy individuals and patients with T2DM were Prevotella,
Bacteroides and Faecalibacterium. The relative abundance
of the top 3 genera was 21.85, 19.54 and 7.84% in healthy
individuals and 22.05, 24.09 and 7.58% in patients with T2DM,
without any significant difference between group C and group T0
(P=0.853). Ruminococcus and Lactobacillus also
occupied a large proportion, with a relative abundance of 3.48 and
1.76% in the healthy individuals and 2.06 and 3.48% in patients
with T2DM, respectively.
Differences in intestinal genera in
patients with T2DM and healthy individuals
ANOVA was used to analyse differences in the
intestinal flora between healthy individuals (group C) and patients
with T2DM (group T0) and the results are presented in Fig. 4A. A total of 23 genera from four
phyla, i.e. Firmicutes, Proteobacteria, Bacteroidetes and
Actinobacteria, were identified to be different (P<0.05). Among
these 23 genera, the relative abundances of 6 genera, namely
Enterococcus, Gallibacterium, Epulopiscium and
Neisseria, as well as undefined genera of
Peptostreptococcaceae and Aeromonadaceae, were significantly higher
in patients with T2DM than in healthy individuals and the relative
abundances of the other 17 genera were significantly lower.
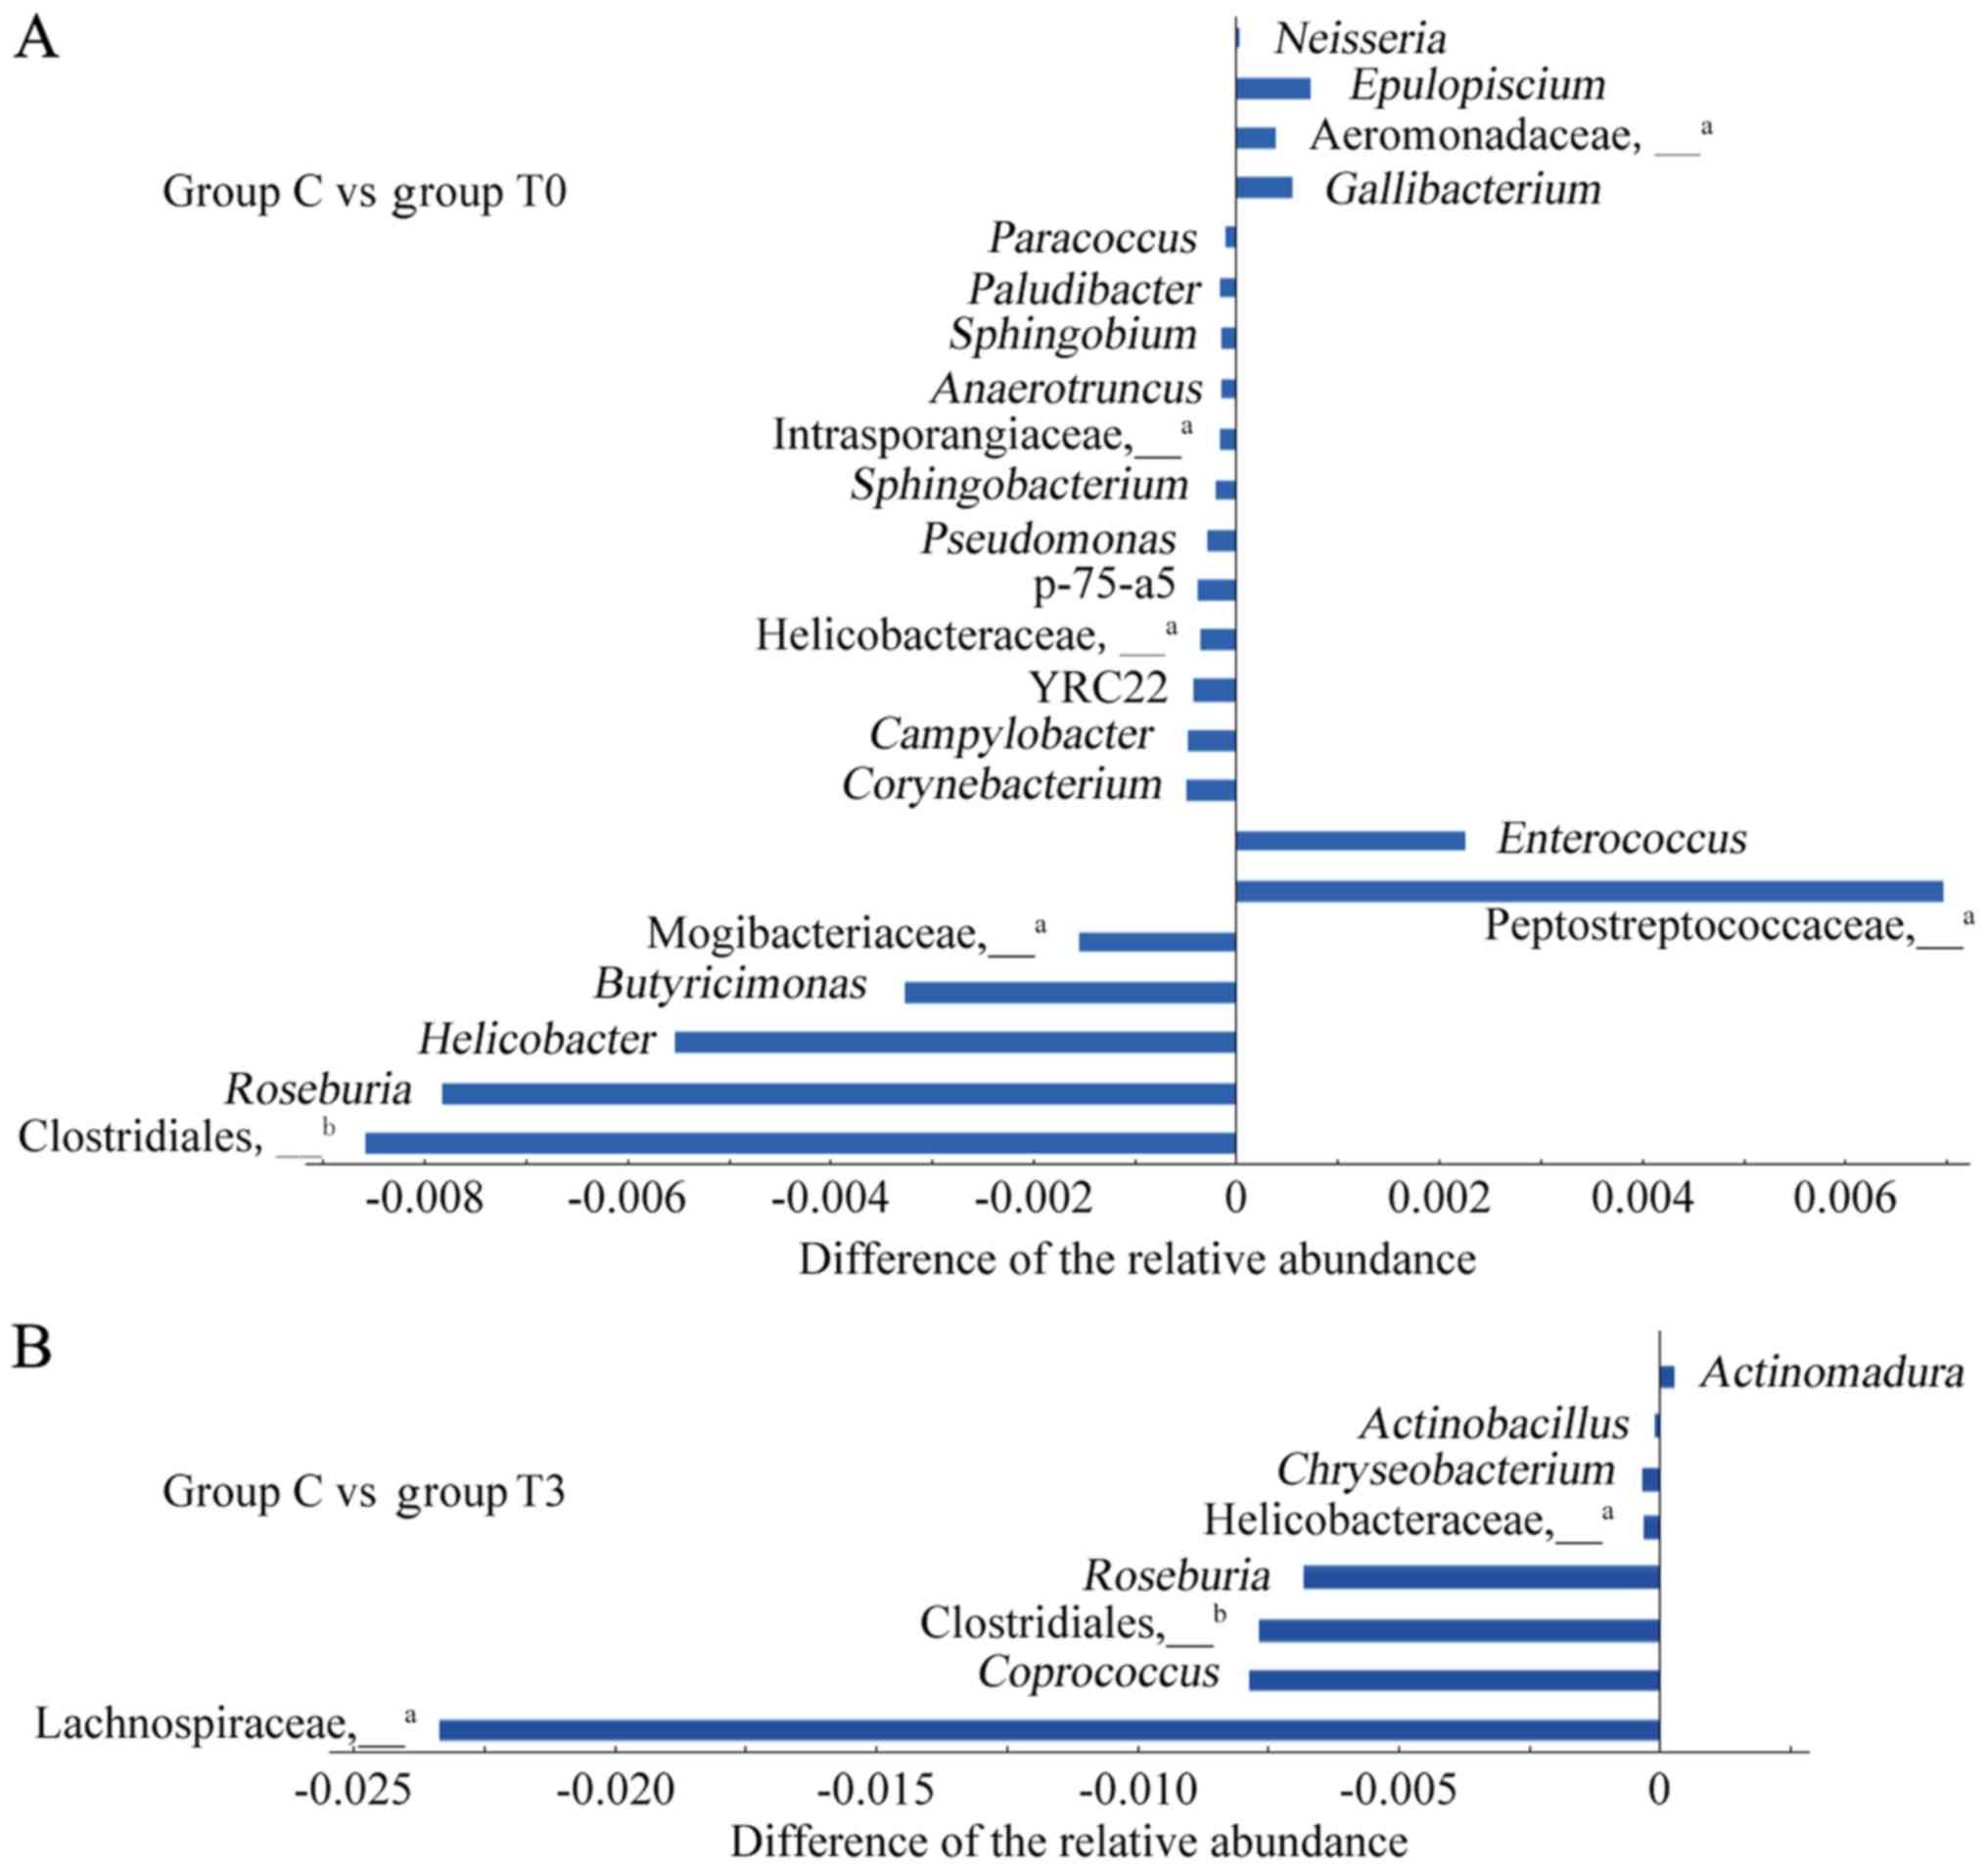 | Figure 4Differences in the intestinal flora
between healthy individuals and patients with T2DM. (A) A total of
23 different genera were compared between group C and group T0. (B)
A total of 8 different genera were compared between group C and
group T3. The abscissa represents the difference in the relative
abundance of the differential genera in group T and group C. The
abscissa on the right-hand side indicates a significant increase in
group T compared to group C, and the abscissa on the left-hand side
indicates a significant decrease. The ordinate represents the name
of the differential genus. aNot possible to be defined
at the genus level by OTU clustering, and therefore, it is
represented at the family level. Not possible to be defined at the
genus level by OTU clustering, and therefore, it is represented at
the order level. Groups: C, healthy control; T0 and T3, patients
with T2DM at the initial diagnosis and after 6 months of treatment,
respectively. T2DM, type 2 diabetes mellitus; OTU, operational
taxonomic unit. |
After 6 months of low-fat diet treatment (group T3),
the number of genera in the intestine of patients with T2DM with
different relative abundances from healthy individuals decreased
from 23 to 8 species (Fig. 4B).
Among these 8 genera, the relative abundances of 3 genera,
Roseburia and undefined genera of Clostridiales and
Helicobacteraceae, exhibited significant differences from those in
group C, not only at the baseline but also after 6 months of
treatment. The other 5 genera had newly emerged after treatment.
The relative abundances of the genera were significantly lower than
those of group C, except for the case of Actinomadura.
Changes in the abundance of genera
during treatment with a low-fat diet
Attempts to extract nucleic acids failed in two
samples from group T1. In the repeated ANOVA, this was represented
using null values and subsequent analysis was performed.
Repeated-measures ANOVA suggested that the relative abundance of
certain genera changed significantly at a certain stage of the
low-fat diet. The relative abundance of Lachnospira,
Dialister and an undefined genus of Clostridiaceae
significantly increased in the T0-T1 phase during treatment with a
low-fat diet (P<0.05; Fig. 5A).
Acinetobacter exhibited an upward trend in T0-T2 phase,
while Treponema and CF231 had an upward trend in the T2-T3
phase (P<0.05; Fig. 5B).
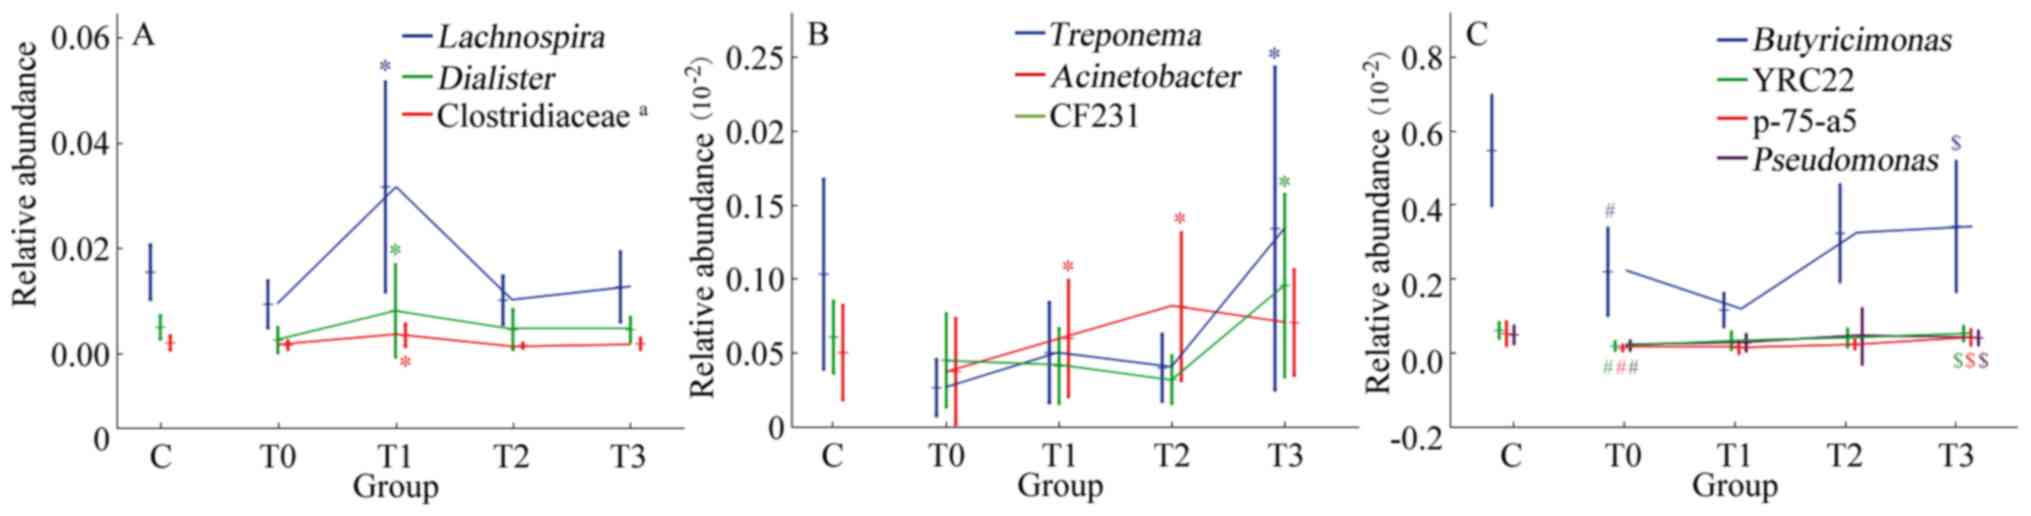 | Figure 5Significant trends in the relative
abundance of genera during low-fat diet treatment. (A) Significant
trends in the relative abundance of Lachnospira,
Dialister and an undefined genus of Clostridiaceae. (B)
Significant trends in the relative abundance of Treponema,
Acinetbacter and CF231. (C) Significant trends in the relative
abundance of Butyricimonas, YRC22, p-75-a5 and
Pseudomonas, which were presented in Fig. 4A (genera that differed between group
C and group T0). #P<0.05 vs. group C;
$P<0.05 vs. group T0. *P<0.05 vs. the
previous stage. aNot possible to be defined at the genus
level by operational taxonomic unit clustering. Groups: C, healthy
control; T0, T1, T2 and T3, patients with type 2 diabetes mellitus
at the initial diagnosis and after 1, 3 and 6 months of treatment,
respectively. |
At different stages of low-fat diet therapy, the
relative abundances of differential genera exhibited different
changes. Among the 23 genera with differences between the T0 and C
groups, repeated ANOVA indicated that the relative abundances of
Butyricimonas, YRC22, p-75-a5 and Pseudomonas
increased significantly during treatment with a low-fat diet
(P<0.05; Fig. 5C), while the
changes in the other 19 genera were not significant (P>0.05).
The relative abundance of these 19 genera changed continually and
gradually tended to become more similar to that in healthy
individuals (Fig. 6). Although
these changes were not significant, a certain pattern was observed.
After 1 month of treatment, the relative abundance of
Sphingobacterium, Paludibacter, Paracoccus and an undefined
genus of Aeromonadaceae increased and continued to increase during
the subsequent treatment (increase in T0-T3; Fig. 6A). The relative abundance of
Helicobacter, Corynebacterium and Sphingobium, as
well as undefined genera of Mogibacteriaceae and Helicobacteraceae,
increased from T0-T1 and T2-T3, and slightly decreased from T1-T2
(Fig. 6B). In general, the changes
in these genera tended towards similarity with healthy individuals
after 1 month of low-fat diet treatment. The change in
Roseburia was the opposite. The relative abundance of
Roseburia increased in T0-T1 and then gradually decreased in
T1-T3 (Fig. 6A). After 3 months of
treatment, certain genera changed their original trend and tended
towards relative abundances closer to those of healthy individuals.
The relative abundance of Campylobacter and an undefined
genus of Clostridiales increased and the relative abundance of
Epulopiscium decreased in T1-T3. The relative abundance of
Anaerotruncus and an undefined genus of Intrasporangiaceae
substantially increased in stage T1-T2 and exhibited a slight
decrease in T2-T3 (Fig. 6C). The
relative abundance of Enterococcus, Gallibacterium,
Neisseria and an undefined genus of Peptostreptococcaceae
gradually increased over the first 3 months and then decreased
between 3 and 6 months of treatment (T2-T3; Fig. 6D).
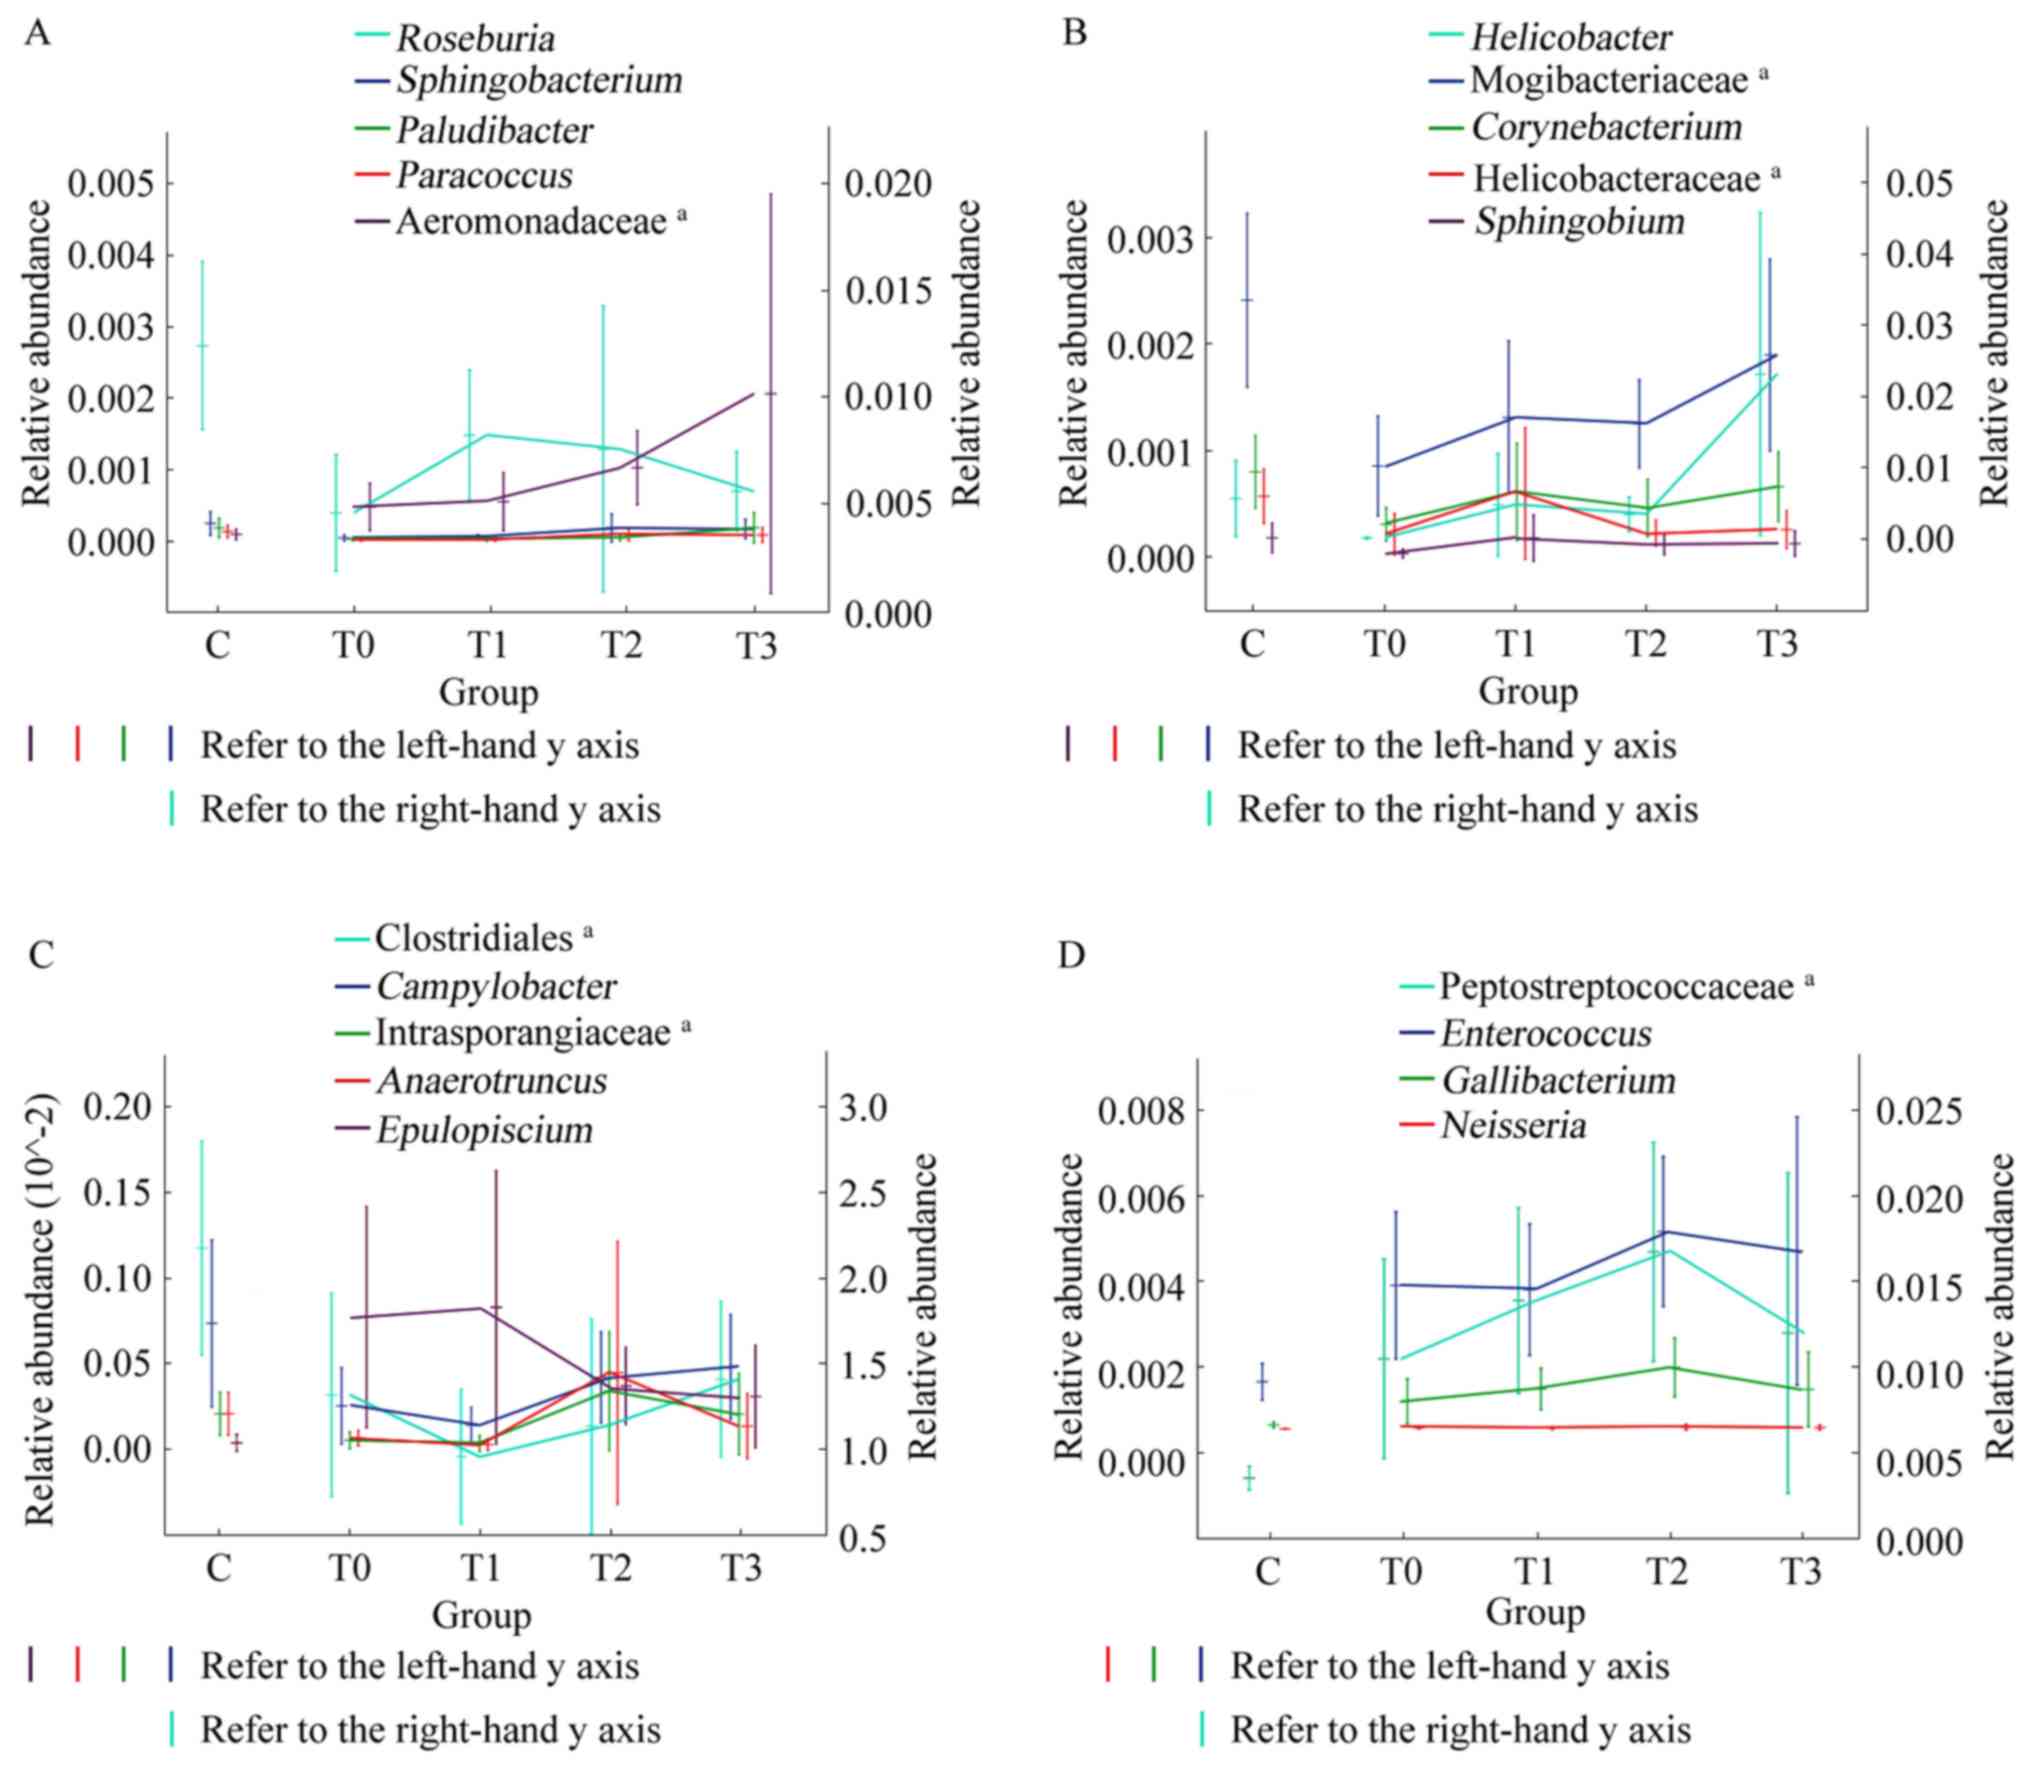 | Figure 6Trends in the relative abundance of
differentiated bacteria in patients with type 2 diabetes mellitus
and healthy individuals. The x-axis of each graph represents
grouping, including groups C, T0, T1, T2 and T3. The y-axis on the
left and right sides of each graph represent the relative abundance
ranges. The vertical lines in each graph represent the error bars,
the horizontal line in the middle of the vertical line is the
average value. (A) Changes in the relative abundance of
Roseburia, Sphingobacterium, Paludibacter, Paracoccus, and
an undefined genus of Aeromonadaceae during treatment with
low-fat diet. (B) Changes in the relative abundance of
Helicobacter, Corynebacterium, Sphingobium and an undefined
genera of Mogibacteriaceae and Helicobacteraceae
during treatment with low-fat diet. (C) Changes in the relative
abundance of Campylobacter, Anaerotruncus, Epulopiscium, and
undefined genera of Clostridiales and Instrasporangiaceae. (D)
Changes in the relative abundance of Enterococcus,
Gallibacterium, Neisseria and an undefined genus of
Peptostreptococcaceae. aNot possible to be
defined at the genus level by operational taxonomic unit
clustering. Groups: C, healthy control; T0, T1, T2 and T3, patients
with type 2 diabetes mellitus at the initial diagnosis and after 1,
3 and 6 months of treatment, respectively. |
Discussion
The microbial community of the intestine interacts
with the human body in various ways. Imbalances in metabolism cause
imbalances in the intestinal flora, resulting in shifts in the
abundance of certain pathogenic bacteria or an increase in
conditional bacteria (21).
Patients with T2DM frequently have abnormal glucose and lipid
metabolism, which leads to obesity, hypertension and insulin
resistance. Low-fat diets, which are able to control blood sugar
and body weight by increasing dietary fiber and reducing lipid
intake, are an effective dietary treatment for patients with T2DM.
In the present study, patients with T2DM consumed a low-fat diet
and participated in long-term follow-up. Stool samples were
collected at different stages of treatment and high-throughput
sequencing technology was utilized to analyse changes in the
distribution of microbial communities and the association between a
low-fat diet and the microbial flora in the intestine.
In the present study, the patients were newly
diagnosed with T2DM, the FPG was 8.05±0.47 mmol/l, the Hba1c was
6.8±0.3%, and the BMI was 26.4±0.8. The blood glucose index were
higher compared with that of the reference values, synonymous with
the early stages of the development of T2DM. After 6 months of
low-fat diet treatment, the patients' FPG and HbA1c levels had
decreased and the BMI was also decreased significantly. This
demonstrated that a low-fat diet is effective for patients with
T2DM in certain aspects.
It is common to estimate the distribution of
microbial communities in the gut through the evaluation of the
microbial community in stool samples. In the present study, the
intestinal microflora of healthy individuals and patients with T2DM
consisted almost exclusively of Actinobacteria, Bacteroidetes,
Firmicutes, Fusobacteria and Proteobacteria, with these phyla
accounting for >99% of the intestinal microflora. Regardless,
the abundance of Prevotella, Bacteroides and
Faecalibacterium in the intestinal flora was relatively
stable. Ruminococcus, which has an important role in the
degradation of cellulose and hemicellulose (22), was the most dominant bacterium in
the intestine of healthy individuals. To a certain extent,
Ruminococcus is able to promote cellular uptake of sugar and
reduce insulin resistance. However, long-term intake of large
amounts of sugar may lead to obesity due to the role of
Ruminococcus in promoting sugar absorption (23). In the present study, the relative
abundance of Ruminococcus in the intestinal tract of
patients with T2DM was relatively low, which may have been due to
the diet of these patients being hyperlipidic and high in protein.
The low-fat diets were energy-balanced and required patients to
increase their intake of carbohydrates and dietary fibre, including
vegetables, fruits and grains, and control fat intake to <25% of
the total daily energy intake. After 6 months of low-fat diet
treatment, the relative abundance of Ruminococcus in the
intestine increased slightly.
The predominant bacterial taxon in the gut of
patients with T2DM is Lactobacillus, which produces lactic acid and
is recognized as a probiotic bacterium (24). The higher relative abundance of
Lactobacillus in the intestine of patients with T2DM was
likely due to dysbacteriosis, involving decreased abundance of
Ruminococcus, Coprococcus, Bifidobacterium, Blautia and
others. The present results are consistent with those of Sedighi
et al (25). There are two
conversion pathways of lactate in vivo: Conversion to
propionate and acetate or conversion to butyrate, which promotes
mucin synthesis and maintains intestinal epithelial cell integrity
(26). According to the results of
Patterson et al (27),
compared with the control group, the abundance of lactic
acid-producing bacteria, as well as lactate and acetate
concentrations, increased in diabetic rats, whereas butyrate levels
decreased. Therefore, the role of lactic acid bacteria in the
intestine is determined not only by the relative abundance but also
by the content of butyrate-producing bacteria.
In the present study, the relative abundances of
Roseburia and Anaerotruncus in patients with T2DM,
both of which are members of Firmicutes and butyrate-producing
bacteria, were significantly lower than those in group C prior to
treatment. Anaerotruncus is an acetyl-CoA
acetyltransferase-based butyrate-producing bacterium that is able
to express 3-hydroxyacyl-CoA dehydrogenase and enoyl-CoA hydratase,
which are necessary for butyrate production. In the final step of
butyrate biosynthesis, a moderate amount of class IV alcohol
dehydrogenase may be provided by Anaerotruncus to facilitate
butyrate production (28). Ijaz
et al (29) reported on
depletion of Anaerotruncus species in the intestines of mice
fed a high-fat diet, where calories in high-fat foods accounted for
60% total calories, compared with mice fed a low-fat diet, where
calories in high-fat foods accounted for 12% total calories. In the
present study, the abundance of Anaerotruncus in the
intestinal tract of patients with T2DM was significantly lower than
that in healthy individuals and it increased slightly after 6
months of low-fat diet treatment.
Likewise, Roseburia is also a
butyrate-producing bacterium abundant in the intestinal mucosa.
Roseburia is able to break down indigestible carbohydrates
and produce short-chain fatty acids, including butyrate, propionate
formic acid and acetate, to enhance the response to
pro-inflammatory factors and maintain stable intestinal immune
mechanisms regulating intestinal physiology and immune homeostasis
through anti-inflammatory properties that increase proinflammatory
cytokine responses (30). It also
gradually saturates excess polyunsaturated fat enriched in the
intestine or converts it into a conjugated linoleic acid to promote
the growth of beneficial bacteria such as Lactobacillus and
Faecalibacterium and maintain the ecological health and
stability of the intestinal microflora precursor (31). A significantly decreased abundance
of Roseburia was detected in patients with T2DM. Haro et
al (32) pointed out that the
Mediterranean diet may be linked to an increased presence of
Roseburia due to its high carbohydrate intake. Cantu-Jungles
et al (33) purified and
fermented the polymer of insoluble dietary fibre from Cookeina
speciosa and observed a specificity increase in the relative
abundances of Butyrogenic, Anaerostipes and Roseburia
in an in vitro human stool fermentation model. In contrast
to these studies, although the relative abundance of
Roseburia increased slightly at T1, a decreasing trend in
the subsequent low-fat diet treatment process was observed in the
present study. Therefore, there may be various factors in patients
with T2DM that reduce the abundance of Roseburia.
After adherence to 6 months of low-fat diet
treatment and follow-up, a reconstitution of the intestinal flora
was observed. At various stages of low-fat diet therapy, the
relative abundance of different microorganisms changed. Although
these changes may not have been significant, they exhibited a trend
in the alteration of relative abundance of intestinal microbes
under the intervention of low-fat diet therapy. Further study is of
great significance to elucidate the metabolic pathways of these
microorganisms and analyse how these microorganisms affect human
health through these metabolic pathways. In the present study, none
of the enrolled patients received insulin therapy and finally only
16 patients improved their blood glucose through a low-fat diet
regimen, resulting in a smaller sample size and is a limitation of
the present study.
In summary, through treatment with a low-fat diet,
the blood glucose and BMI of patients with T2DM were effectively
controlled. The changes in intestinal flora were complex. However,
the difference in intestinal flora between patients with T2DM and
healthy individuals decreased and the structure of the intestinal
flora gradually tended to be more similar to that of healthy
individuals after 6 months of treatment. The relative abundances of
butyrate-producing bacteria, including Anaerotruncus and
Roseburia, were significantly lower in the intestinal tract
of patients with T2DM than in healthy individuals. During
treatment, the abundance of Anaerotruncus increased, while
Roseburia only significantly increased at the T1 stage and
then gradually decreased at the later stages, implying a complex
response to treatment.
Supplementary Material
Relative abundance at the phylum level
as revealed by 16S ribosomal RNA gene sequencing. Each column
represents a group and different colours indicate different phylum
among the microbiota. The 10 most abundant phylum are listed. C,
healthy control; T0, T1, T2 and T3, patients with type 2 diabetes
mellitus at the initial diagnosis and after 1, 3 and 6 months of
treatment, respectively.
Basic information of T2DM patients and
healthy individuals.
Acknowledgements
Not applicable.
Funding
The study was financially supported by the Public
Technology Application Research of Zhejiang Province Science and
Technology Hall (grant no. 2016C33242).
Availability of data and materials
The corresponding datasets were submitted to the
public database Sim TK and the URL link of the datasets was
https://simtk.org/docman/?group_id=1835.
Authors' contributions
CL and MG conceptualized the study. WS was
responsible for patient selection and follow-up during the research
process. JL and QG collected samples and analyzed the data. FM
performed 16S rDNA sequencing. JJ analyzed the data; CL and JJ
wrote the paper. All authors read, revised and approved the final
manuscript.
Ethics approval and consent to
participate
This study was approved by the Ethics Committee of
Zhoushan Putuo District People's Hospital (Zhoushan, China; no.
KY2015006). All patients had provided written informed consent.
This study was retrospectively registered in the ChiCTR
(registration no. ChiCTR1900028663).
Patient consent for publication
Not applicable.
Competing interests
The authors declare that they have no competing
interests.
References
|
1
|
American Diabetes Association. The
prevention or delay of type 2 diabetes. Diabetes Care. 25:742–749.
2002.
|
|
2
|
Wang L, Gao P, Zhang M, Huang Z, Zhang D,
Deng Q, Li Y, Zhao Z, Qin X, Jin D, et al: Prevalence and ethnic
pattern of diabetes and prediabetes in china in 2013. JAMA.
317:2515–2523. 2017.PubMed/NCBI View Article : Google Scholar
|
|
3
|
Li H, Gan W, Lu L, Dong X, Han X, Hu C,
Yang Z, Sun L, Bao W, Li P, et al: A genome-wide association study
identifies GRK5 and RASGRP1 as type 2 diabetes loci in Chinese
Hans. Diabetes. 62:291–298. 2013.PubMed/NCBI View Article : Google Scholar
|
|
4
|
Sami W, Ansari T, Butt NS and Hamid MRA:
Effect of diet on type 2 diabetes mellitus: A review. Int J Health
Sci (Qassim). 11:65–71. 2017.PubMed/NCBI View Article : Google Scholar
|
|
5
|
Lee MS: ED 05-2 Interaction of gut
dysbiosis and innate immune dysfunction in the development of
metabolic syndrome. J Hypertension. 34(e187)2016.
|
|
6
|
Soare A, Khazrai YM, Del Toro R, Roncella
E, Fontana L, Fallucca S, Angeletti S, Formisano V, Capata F, Ruiz
V, et al: The effect of the macrobiotic Ma-Pi 2 diet vs the
recommended diet in the management of type 2 diabetes: The
randomized controlled MADIAB trial. Nutr Metab (Lond).
25(39)2014.PubMed/NCBI View Article : Google Scholar
|
|
7
|
Victoria JV, Valentine RJ, Wilund KR,
Antao N, Baynard T and Woods JA: Effects of exercise and low-fat
diet on adipose tissue inflammation and metabolic complications in
obese mice. Am J Physiol Endocrinol Metab. 296:E1164–E1171.
2009.PubMed/NCBI View Article : Google Scholar
|
|
8
|
Zhao L: The gut microbiota and obesity:
From correlation to causality. Nat Rev Microbiol. 11:639–647.
2013.PubMed/NCBI View Article : Google Scholar
|
|
9
|
Pedersen HK, Gudmundsdottir V, Nielsen HB,
Hyotylainen T, Nielsen T, Jensen BA, Forslund K, Hildebrand F,
Prifti E, Falony G, et al: Human gut microbes impact host serum
metabolome and insulin sensitivity. Nature. 535(376)2016.PubMed/NCBI View Article : Google Scholar
|
|
10
|
Karlsson FH, Tremaroli V, Nookaew I,
Bergström G, Behre CJ, Fagerberg B, Nielsen J and Bäckhed F: Gut
metagenome in European women with normal, impaired and diabetic
glucose control. Nature. 498:99–103. 2013.PubMed/NCBI View Article : Google Scholar
|
|
11
|
Ley RE, Turnbaugh PJ, Klein S and Gordon
JI: Microbial ecology: Human gut microbes associated with obesity.
Nature. 444:1022–1023. 2006.PubMed/NCBI View
Article : Google Scholar
|
|
12
|
Wirth R, Bódi N, Maróti G, Bagyánszki M,
Talapka P, Fekete É, Bagi Z and Kovács KL: Regionally distinct
alterations in the composition of the gut microbiota in rats with
streptozotocin-induced diabete. PLoS One. 9(e110440)2014.PubMed/NCBI View Article : Google Scholar
|
|
13
|
Heinritz SN, Weiss E, Eklund M, Aumiller
T, Louis S, Rings A, Messner S, Camarinha-Silva A, Seifert J,
Bischoff SC and Mosenthin R: Intestinal Microbiota and microbial
metabolites are changed in a pig model fed a High-Fat/Low-Fiber or
a Low-Fat/High-Fiber diet. PLoS One. 11(e0154329)2016.PubMed/NCBI View Article : Google Scholar
|
|
14
|
Zhao LP, Zhang F, Ding XY, Wu GJ, Lam YY,
Wang XJ, Fu HQ, Xue XH, Lu CH, Ma JL, et al: Gut bacteria
selectively promoted by dietary fibers alleviate type 2 diabetes.
Sience. 359:1151–1156. 2018.PubMed/NCBI View Article : Google Scholar
|
|
15
|
World Health Organization: Definition and
diagnosis of diabetes mellitus and intermediate hyperglycemia:
Report of a WHO/IDF consultation, 2006.
|
|
16
|
Yan Z, Tao ZH and Xiang F: Diabetics diets
and their nutritional analyses. J Res Dietet Sci Culture. 32:51–53.
2015.
|
|
17
|
Cheng YY: Brief Introduction of the 2013
revision of ‘Reference Intake of Dietary Nutrients of Chinese
Residents’. Acta Nutrimenta Sinia. 36:313–317. 2014.
|
|
18
|
Ismaiel M, Yang H and Min C: Dietary fiber
role in type 2 diabetes prevention. Br Food J. 118:961–975.
2016.
|
|
19
|
Lin L, Wen ZB, Lin DJ, Dong JT, Jin J and
Meng F: Correlations between microbial communities in stool and
clinical indicators in patients with metabolic syndrome. World J
Clin Cases. 6:54–63. 2018.PubMed/NCBI View Article : Google Scholar
|
|
20
|
Edgar RC: Search and clustering orders of
magnitude faster than BLAST. Bioinformatics. 26:2460–2461.
2010.PubMed/NCBI View Article : Google Scholar
|
|
21
|
Qin JJ, Li YR, Cai ZM, Li SH, Zhu JF,
Zhang F, Liang SS, Zhang WW, Guan YL, Shen DQ, et al: A
metagenome-wide association study of gut microbiota in type 2
diabetes. Nature. 490:55–60. 2012.PubMed/NCBI View Article : Google Scholar
|
|
22
|
Cann I, Bernardi RC and Mackie RI:
Cellulose degradation in the human gut: Ruminococcus
champanellensis expands the cellulosome paradigm. Environ
Microbiol. 18:307–310. 2016.PubMed/NCBI View Article : Google Scholar
|
|
23
|
Jones N: Gut study divides people into
three types. Nature: 20 April, 2011 doi: 10.1038/news.2011.249.
|
|
24
|
Cherdyntseva TA, Kotova IB and Netrusov
AI: Gut study divides people into three types. Adv Exp Med Biol.
897:103–111. 2015.
|
|
25
|
Sedighi M, Razavi S, Navab-Moghadam F,
Khamseh ME, Alaei-Shahmiri F, Mehrtash A and Amirmozafari N:
Comparison of gut microbiota in adult patients with type 2 diabetes
and healthy individuals. Microb Pathog. 111:362–369.
2017.PubMed/NCBI View Article : Google Scholar
|
|
26
|
Morrison DJ, Mackay WG, Edwards CA,
Morrison DJ, Mackay WG, Edwards CA, Preston T and Weaver LT:
Butyrate production from oligofructose fermentation by the human
faecal flora: What is the contribution of extracellular acetate and
lactate? Br J Nutr. 96:570–577. 2006.PubMed/NCBI
|
|
27
|
Patterson E, Marques TM, O'Sullivan O,
Fitzgerald P, Fitzgerald GF, Cotter PD, Dinan TG, Cryan JF, Stanton
C and Ross RP: Streptozotocin-induced type-1-diabetes disease onset
in Sprague-Dawley rats is associated with an altered intestinal
microbiota composition and decreased diversity. Microbiology.
161:182–193. 2015.PubMed/NCBI View Article : Google Scholar
|
|
28
|
Polansky O, Sekelova Z, Faldynova M,
Sebkova A, Sisak F and Rychlik I: Important metabolic pathways and
biological processes expressed by chicken Cecal microbiota. Appl
Environ Microbiol. 82:1569–1576. 2016.PubMed/NCBI View Article : Google Scholar
|
|
29
|
Ijaz MU, Ahmed MI, Zou X, Hussain M, Zhang
M, Zhao F, Xu X, Zhou G and Li C: Beef, casein, and soy proteins
differentially affect lipid metabolism, triglycerides accumulation
and gut microbiota of high-fat Diet-Fed C57BL/6J Mice. Front
Microbiol. 9(2200)2018.PubMed/NCBI View Article : Google Scholar
|
|
30
|
Louis P and Flint HJ: Diversity,
metabolism and microbial ecology of butyrate-producing bacteria
from the human large intestine. FEMS Microbiol Lett. 294:1–8.
2009.PubMed/NCBI View Article : Google Scholar
|
|
31
|
Devillard E, McIntosh FM, Duncan SH and
Wallace RJ: Metabolism of linoleic acid by human gut bacteria:
Different routes for biosynthesis of conjugated linoleic acid. J
Bacteriol. 189:2566–2570. 2007.PubMed/NCBI View Article : Google Scholar
|
|
32
|
Haro C, Montes-Borrego M, Rangel-Zúñiga
OA, Alcalá-Díaz JF, Gómez-Delgado F, Pérez-Martínez P,
Delgado-Lista J, Quintana-Navarro GM, Tinahones FJ, Landa BB, et
al: Two healthy diets modulate gut microbial community improving
insulin sensitivity in a human obese population. J Clin Endocrinol
Metab. 101:233–242. 2016.PubMed/NCBI View Article : Google Scholar
|
|
33
|
Cantu-Jungles TM, Ruthes AC, El-Hindawy M,
Moreno RB, Zhang X, Cordeiro LMC, Hamaker BR and Iacomini M: In
vitro fermentation of Cookeina speciosa glucans stimulates the
growth of the butyrogenic Clostridium cluster XIVa in a targeted
way. Carbohydr Polym. 183:219–229. 2018.PubMed/NCBI View Article : Google Scholar
|