Introduction
Intrahepatic cholangiocarcinoma (ICC) is the second
most common type of primary liver malignancy after hepatocellular
carcinoma (1,2). ICC originates from the intrahepatic
bile duct and affected patients present with a focal liver mass
(3). The incidence of ICC is
increasing worldwide and mortality rates have not declined
(4-6).
The poor prognosis of ICC is of particular concern. Resection is
the only curative treatment for ICC, but even with resection,
patients with ICC have a poor prognosis (7,8). For
early ICC, the 5-year survival of patients with resection is around
30-35% (9).
Gene dysregulation contributes to the tumorigenesis
of ICC (10). Identification of the
dysregulated genes may be used to identify novel treatment targets
and predictors for response to chemotherapy and radiotherapy
(11). Numerous genes appear to be
promising diagnostic biomarkers for ICC, as well as predictors of
prognosis and targets for therapy (10,12,13).
Gene expression studies are being used to identify these genes.
Integrated data analysis has a key role in the
analysis of high-throughput data (14). The R package RobustRankAggreg may be
used for data integration with the robust rank aggregation (RRA)
method (15). The algorithm assigns
a P-value to each item that indicates how much better it is
positioned in the ranked list than expected by chance. This P-value
is used for re-ranking the items and to determine statistical
significance (16).
In the present study, an integrated Bioinformatics
analysis was used to identify genes associated with ICC. Clinical
samples were then analyzed to validate a gene that was identified
and its clinical significance.
Patients and methods
Data selection and datasets
A search for ICC expression profiling array data was
performed using Gene Expression Omnibus (GEO; www.ncbi.nlm.nih.gov/geo/) (17) for entries added until May 2017. The
search strategy was based on a combination of the following terms:
{(intrahepatic cholangiocarcinoma) OR [cholangio* AND (cancer* OR
tumor* OR tumor* OR carcinoma)]}. All data series were carefully
screened. Studies on more than one type of tumor, but that included
ICC, were also evaluated. Studies that profiled different
histologic subtypes but that did not include non-cancerous tissue,
and studies using only cell lines, were excluded. Gene expression
data and corresponding clinical information for the
cholangiocarcinoma dataset were downloaded from The Cancer Genome
Atlas (TCGA, https://www.cancer.gov/tcga) data portal in May
2017.
Dataset construction
The series of data from the GEO datasets (GSE89749,
GSE76297, GSE57555, GSE32879 and GSE26566) were analyzed separately
using the limma application (version 3.30.13) (18). The expression level of each gene was
log2-transformed for further analysis. Bonferroni correction was
used to adjust P-values; a correction that adjusted each P-value
(adjP) <0.01 for a gene with a |fold change (FC)|>2 was
applied to each data series. Identification of dysregulated genes
associated with cholangiocarcinoma was performed using the edgeR
application (version 3.16.5) (19).
log2-transformation and Bonferroni correction were also applied for
each gene. For a more stringent limit, the applied adjusted P-value
was <0.001 and the |log2-transformed FC| was >4.
RRA was used for the integration of the GEO data
series. The R package (version: 1.1) was used to detect genes that
were ranked consistently better than expected under the null
hypothesis of uncorrelated inputs and to assign a significance
score for each gene (16). All
genes identified were statistically significant (P<0.01) after
the Bonferroni correction was performed.
Validation of potential dysregulated
genes using reverse transcription-quantitative PCR (RT-qPCR)
A total of 61 pairs of ICC and adjacent
non-cancerous tissues were used to validate the potential
dysregulated genes. All tissues were ground separately in liquid
nitrogen. The total RNA was extracted using TRIzol reagent
(Invitrogen; Thermo Fisher Scientific, Inc.). Complementary DNA
synthesis was performed using a PrimeScript™ reverse
transcriptase reagent kit (Takara Bio, Inc.). Amplification and
quantification were performed using the ABI PRISM 7900 Sequence
Detection System (Applied Biosystems; Thermo Fisher Scientific,
Inc.) and SYBR® Premix Ex Taq™ (Tli RNaseH
Plus; Takara Bio, Inc.). GAPDH was used as an endogenous control.
The expression level of the analyte gene was normalized to that of
GAPDH and the 2-ΔΔCq method was applied (20). The primers used are presented in
Table SI.
Patients
The study protocol was approved by the Clinical
Research Ethics Committee of Zhongshan Hospital, Fudan University
(Shanghai, China). ICC was defined as adenocarcinoma arising from
the second-order or greater distal branches of the intrahepatic
bile ducts. The inclusion criteria were as follows: i) The patient
received a curative resection between January 2009 and December
2012 at Zhongshan Hospital, Fudan University (Shanghai, China); ii)
the patient's ICC was diagnosed by two experienced pathologists;
iii) each patient received the operation from the same surgical
group; iv) no concurrent malignant tumors of other types were
present; v) no anti-tumor treatments were given prior to the
surgery; vi) the complete follow-up information was available. All
tissues were frozen immediately after the hepatectomies.
The tumor-nodes-metastasis staging was performed
according to the guidelines of the eighth edition of the American
Joint Committee on Cancer/International Union against Cancer
(21).
Follow-up
After resection, each patient had an appointment for
a follow-up exam every 3-4 months during the first 2 years, and
then every 4-6 months during the next year. Liver function
indicators, serum α-fetoprotein and hematological parameters were
examined at each follow-up visit. Liver ultrasonography was
performed at each visit by physicians who were not involved in the
patient's treatment and had no access to treatment information.
Contrast computed tomography (CT) scans of the chest, abdomen and
pelvis were performed once every 6 months. A bone scan or a
magnetic resonance imaging (MRI) scan was performed if it was
considered necessary due to any clinical indication. If tumor
recurrence in the liver was suspected, a CT scan or MRI with
intravenous contrast was performed. Biopsies of lesions were
performed when a definite diagnosis could not be elucidated made by
other methods.
Statistical analysis
All R packages used were based on R software
(version 3.3.2). Comparison of expression levels between tumors and
paired adjacent non-cancerous tissues was performed using paired
t-tests.
Overall survival (OS) time was measured from the
date of surgery to the date of death. The recurrence-free survival
(RFS) time was calculated from the date of surgery to the date of
the first clinically-documented tumor recurrence or metastasis, or
the date of death. Inter-group comparisons were performed using the
chi-squared or Fisher's exact test. The OS and RFS times were
calculated using the Kaplan-Meier method; log-rank tests were used
to assess differences between survival curves. The Cox linear
hazards model was used logistic regression analysis for the
univariate and multivariate analysis. The accuracy of predicting
prognosis was evaluated using receiver operating characteristic
(ROC) curves, and the predictive performance was determined by
calculating the area under the ROC curve (AUC). All statistical
analyses were performed using the SPSS 22.0 software package (IBM
Corp.). P<0.05 was considered to indicate statistical
significance.
Results
Characteristics of the data series and
associated dysregulated genes
A total of five data series from GEO datasets
deposited between 2012 and 2017 were included for further analysis
(22-26).
The characteristics of these studies/data series are presented in
Table I.
 | Table IFeatures of the Gene Expression
Omnibus datasets included in the present analysis. |
Table I
Features of the Gene Expression
Omnibus datasets included in the present analysis.
| Series
accession | First author
(year) | Region | Array type | Tumor samples
(n) | Type (number) of
control samples | Upregulated genes
(n) | Downregulated genes
(n) | (Refs.) |
|---|
| GSE89749 | Jusakul (2017) | Asia | Illumina HumanHT-12
V4.0 expression beadchip | 118 | Non-tumor bile duct
from the same patients as the tumor tissue (n=2) | 18 | 767 | (22) |
| GSE76297 | Chaisaingmongkol
(2017) | North America | [HTA-2_0]
Affymetrix Human Transcriptome Array 2.0 [transcript (gene)
version] | 91 | Matched peritumoral
liver tissue (n=91) | 46 | 242 | (23) |
| GSE57555 | Murakami
(2015) | Asia | Agilent-039494
SurePrint G3 Human GE v2 8x60K Microarray 039381 | 16 | Matched peritumoral
liver tissue (n=16) | 14 | 17 | (24) |
| GSE32879 | Oishi (2012) | North America | [HuGene-1_0-st]
Affymetrix Human Gene 1.0 ST Array [transcript (gene) version] | 16 | Paired non-tumor
tissue from the same patients as the tumor tissue (n=7) | 159 | 534 | (25) |
| GSE26566 | Andersen
(2012) | Europe | Illumina human
Ref-8 v2.0 expression beadchip | 104 | Matched peritumoral
liver tissue (59) | 4,889 | 3,801 | (26) |
A total of 345 tumor samples and 175 control
counterparts were included in the integrated dataset. The control
samples varied across the studies (Table I). Different microarray platforms
were used in the studies; the number of mRNA probes ranged from
22,185 to 70,753. Use of the limma R package (logFC>2,
adjP<0.01) revealed that at least 31 dysregulated genes were
contained in one data series. In total, the median number of
significantly upregulated genes was 46 (range, 14-4,889), and the
median number of downregulated genes was 534 (range, 17-3,801)
(Table I).
The RRA analysis identified 19 upregulated genes and
130 downregulated genes (Table
SII). The P-values for all dysregulated genes were
statistically significant (adjP<0.01) after Bonferroni
correction. The corrected P-values for the dysregulated genes
ranged from 1.38x10⁻⁷ to 9.86x10⁻³. To
identify specific biomarkers, the 19 upregulated genes were
selected for further analysis (Fig.
1A and Table II).
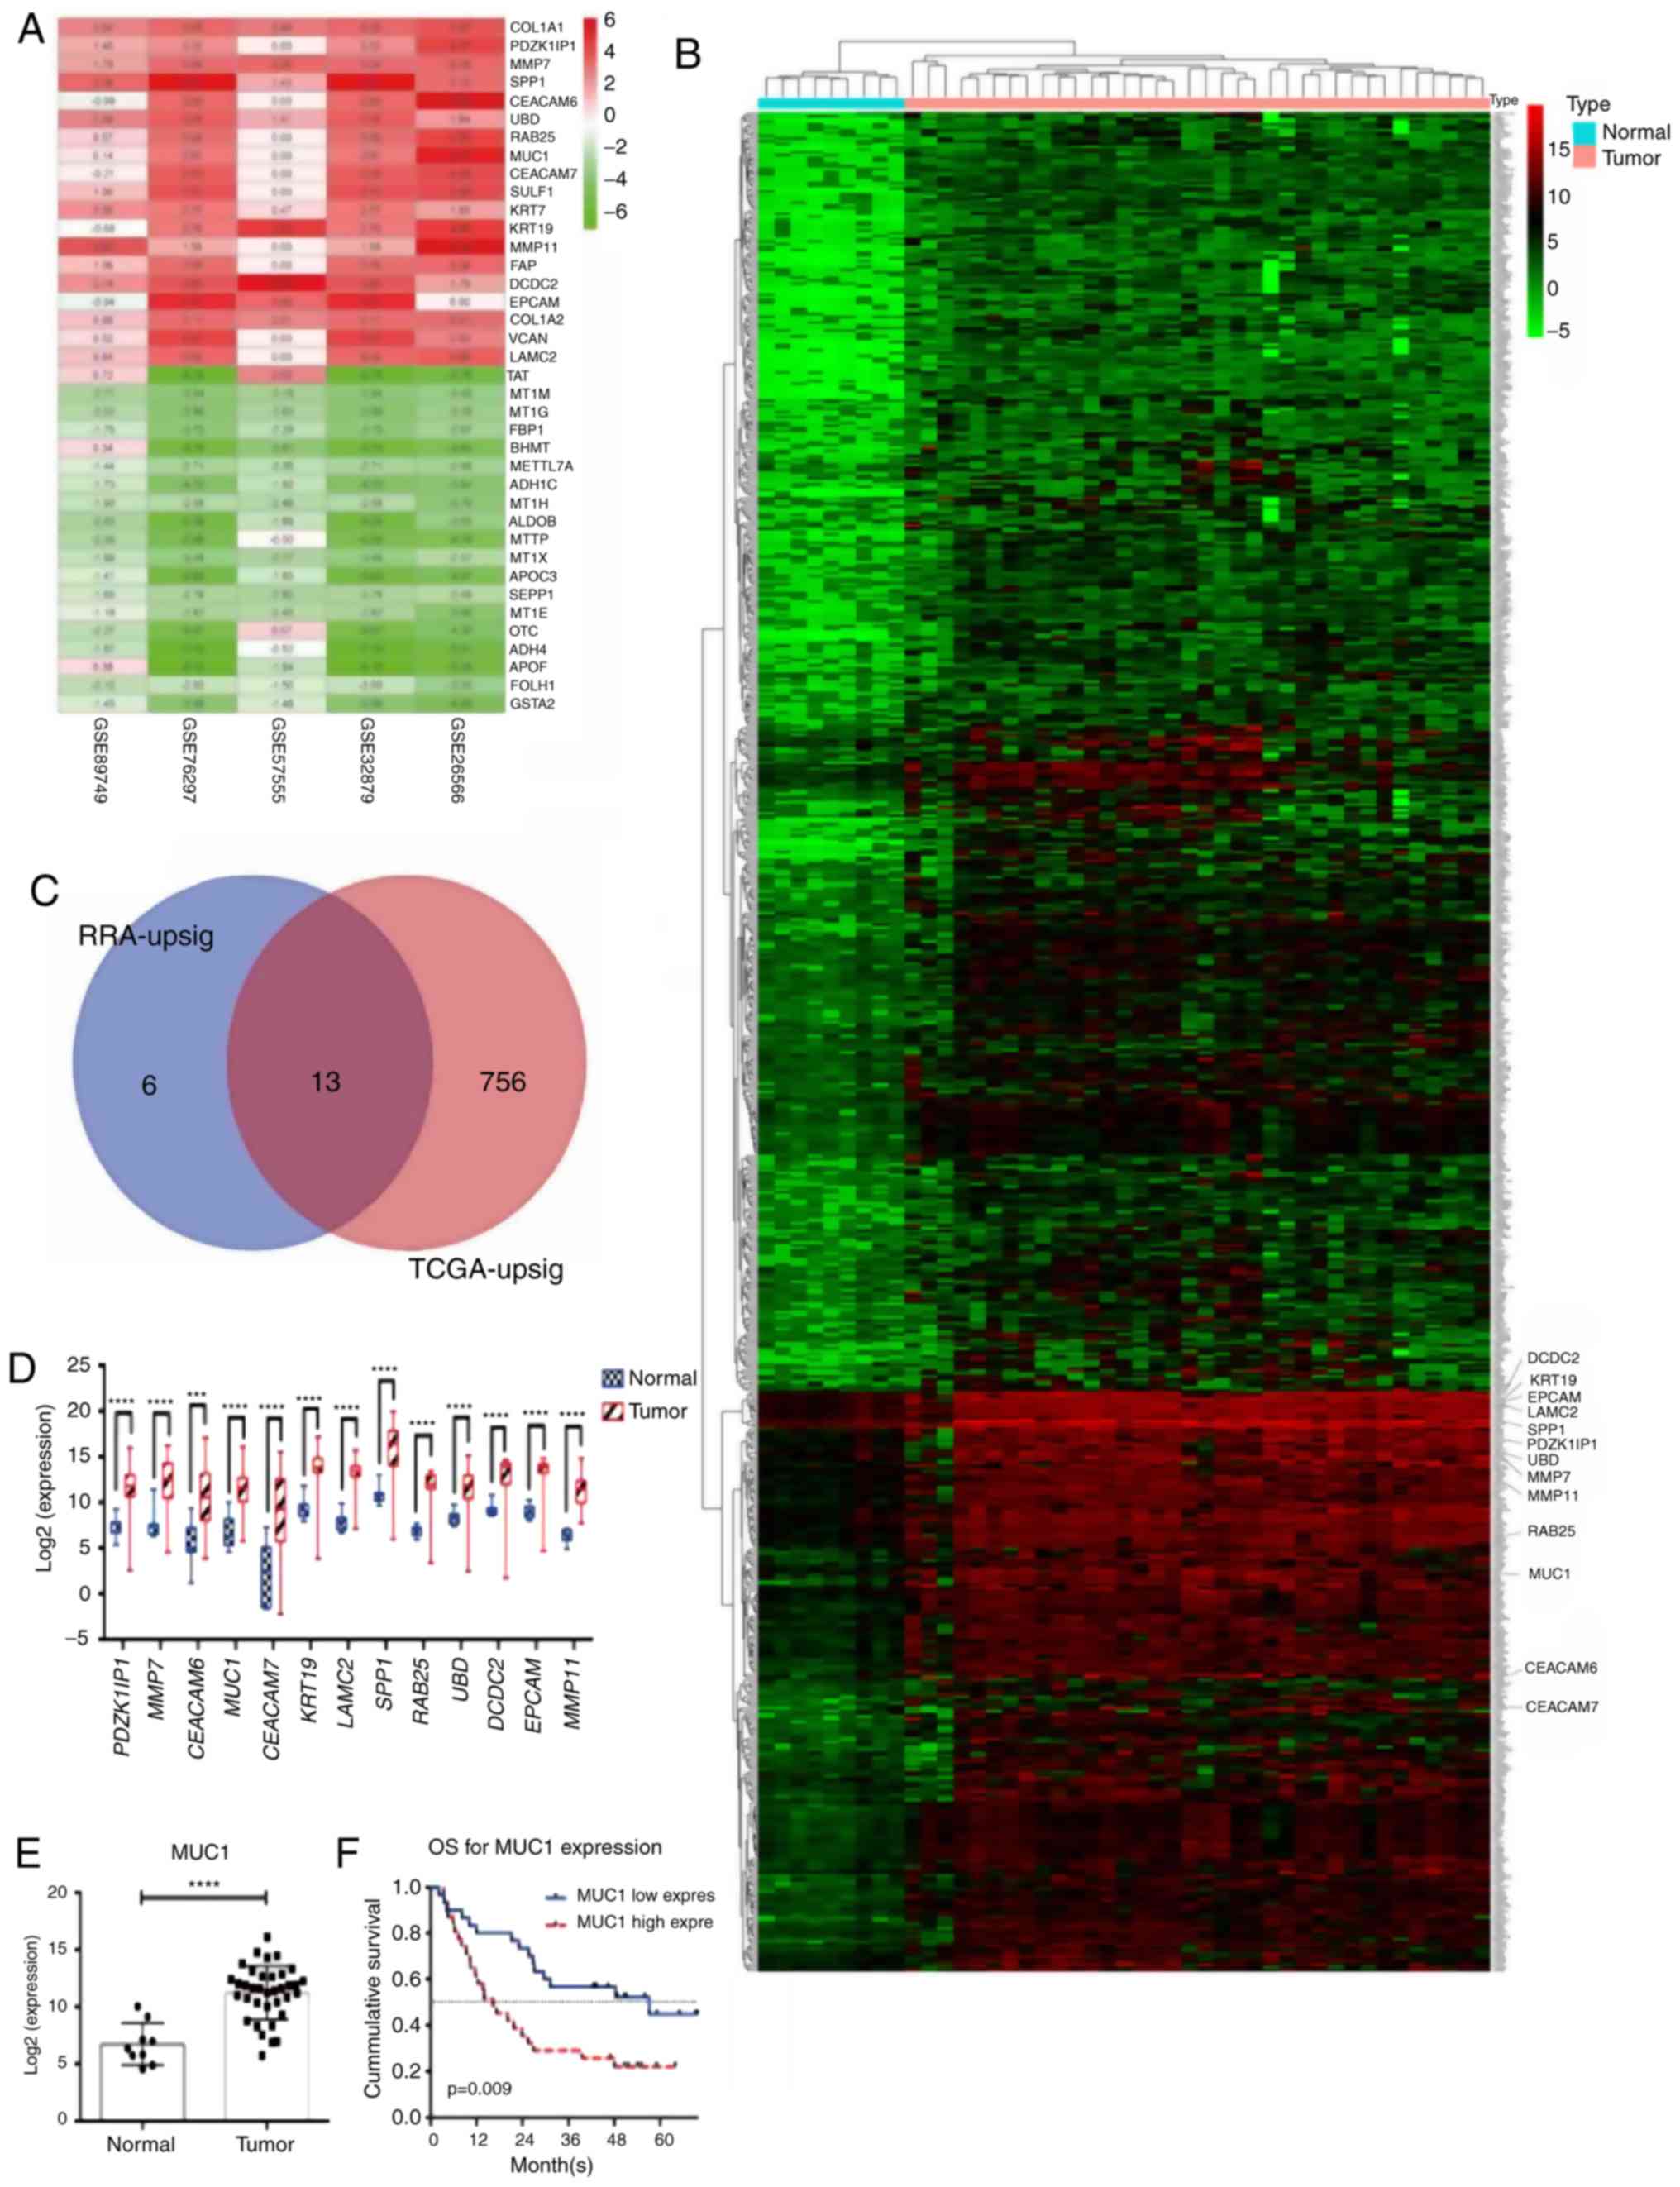 | Figure 1MUC1 is upregulated in ICC tissue, as
validated using databases. (A) The 19 upregulated genes and the 19
most significant downregulated genes linked to cholangiocarcinoma
identified using robust rank aggregation. Numbers in the colored
fields indicate the log2-transformed fold change. 0.00 or white
boxes indicates that the gene was absent from the respective
dataset. (B) Upregulated genes linked to cholangiocarcinoma
identified using the edgeR package (TCGA dataset). The enlarged
gene symbols adjacent to the heatmap are the 13 intersected genes.
(C) 13 genes were identified to be upregulated in the RRA
integrated datasets and the TCGA data. (D and E) The expression
levels of (D) the 13 genes and (E) MUC1 were significantly higher
in ICC tissue, validated using TCGA data. (F) Among the 13 genes,
only MUC1 predicted OS. RRA-upsig refers to the significantly
upregulated genes identified using RRA; TCGA-upsig refers to
significantly upregulated genes among the TCGA data.
***P<0.001; ****P<0.0001. MUC1, mucin
1; TCGA, The Cancer Genome Atlas; ICC, intrahepatic
cholangiocarcinoma; OS, overall survival; RRA, robust rank
aggregation; PDZK1IP1, PDZK1 Interacting Protein 1; MMP7, matrix
metalloproteinase 7; CEACAM6, carcinoembryonic antigen related
adhesion molecules 6; MUC1, mucin 1; CEACAM7, carcinoembryonic
antigen related adhesion molecules 7; KRT19, keratin 19; LAMC2,
laminin subunit gamma-2; SPP1, secreted phosphoprotein 1; RAB25,
Ras Genes from Brain Protein 25; UBD, ubiquitin D; DCDC2,
doublecortin domain containing 2; EPCAM, epithelial cell adhesion
molecule; MMP11, matrix metalloproteinase 11. |
| Table IIThe 19 upregulated genes and the 19
most significant downregulated genes associated with
cholangiocarcinoma, identified using robust rank aggregation. |
Table II
The 19 upregulated genes and the 19
most significant downregulated genes associated with
cholangiocarcinoma, identified using robust rank aggregation.
| A, Upregulated | | | |
|---|
| Gene symbol | P-value | Adjusted
P-value | logFC |
|---|
| COL1A1 |
4.14x10⁻¹¹ |
2.22x10⁻⁶ | 3.147 |
| PDZK1IP1 |
1.08x10⁻⁹ |
5.82x10⁻⁵ | 2.093 |
| MMP7 |
2.16x10⁻⁹ |
1.16x10⁻⁴ | 2.864 |
| SPP1 |
2.99x10⁻⁹ |
1.61x10⁻⁴ | 3.904 |
| CEACAM6 |
5.02x10⁻⁹ |
2.70x10⁻⁴ | 2.195 |
| UBD |
1.26x10⁻⁸ |
6.79x10⁻⁴ | 2.610 |
| RAB25 |
1.50x10⁻⁸ |
8.06x10⁻⁴ | 2.208 |
| MUC1 |
2.06x10⁻⁸ |
1.11x10⁻³ | 2.284 |
| CEACAM7 |
2.74x10⁻⁸ |
1.47x10⁻³ | 2.174 |
| SULF1 |
3.78x10⁻⁸ |
2.03x10⁻³ | 2.511 |
| KRT7 |
4.01x10⁻⁸ |
2.16x10⁻³ | 2.040 |
| KRT19 |
4.26x10⁻⁸ |
2.29x10⁻³ | 2.819 |
| MMP11 |
4.89x10⁻⁸ |
2.63x10⁻³ | 2.526 |
| FAP |
5.34x10⁻⁸ |
2.87x10⁻³ | 2.099 |
| DCDC2 |
5.95x10⁻⁸ |
3.20x10⁻³ | 3.545 |
| EPCAM |
6.92x10⁻⁸ |
3.72x10⁻³ | 2.401 |
| COL1A2 |
1.36x10⁻⁷ |
7.34x10⁻³ | 2.544 |
| VCAN |
1.56x10⁻⁷ |
8.37x10⁻³ | 2.353 |
| LAMC2 |
1.83x10⁻⁷ |
9.86x10⁻³ | 2.228 |
| B,
Downregulated | | | |
| Gene symbol | P-value | Adjusted
P-value | logFC |
| TAT |
2.57x10⁻¹² |
1.38x10⁻⁷ | -3.201 |
| MT1M |
1.18x10⁻¹¹ |
6.32x10⁻⁷ | -3.387 |
| MT1G |
2.20x10⁻¹¹ |
1.18x10⁻⁶ | -3.279 |
| FBP1 |
7.71x10⁻¹¹ |
4.15x10⁻⁶ | -2.892 |
| BHMT |
8.03x10⁻¹¹ |
4.32x10⁻⁶ | -3.980 |
| METTL7A |
8.36x10⁻¹¹ |
4.49x10⁻⁶ | -2.438 |
| ADH1C |
8.58x10⁻¹¹ |
4.62x10⁻⁶ | -3.404 |
| MT1H |
8.81x10⁻¹¹ |
4.74x10⁻⁶ | -2.657 |
| ALDOB |
1.03x10⁻¹⁰ |
5.54x10⁻⁶ | -3.811 |
| MTTP |
1.42x10⁻¹⁰ |
7.62x10⁻⁶ | -3.601 |
| MT1X |
2.89x10⁻¹⁰ |
1.56x10⁻⁵ | -2.816 |
| APOC3 |
3.31x10⁻¹⁰ |
1.78x10⁻⁵ | -3.859 |
| SEPP1 |
4.31x10⁻¹⁰ |
2.32x10⁻⁵ | -2.490 |
| MT1E |
6.40x10⁻¹⁰ |
3.44x10⁻⁵ | -2.646 |
| OTC |
7.06x10⁻¹⁰ |
3.79x10⁻⁵ | -3.225 |
| ADH4 |
7.06x10⁻¹⁰ |
3.80x10⁻⁵ | -4.379 |
| APOF |
7.06x10⁻¹⁰ |
3.80x10⁻⁵ | -3.828 |
| FOLH1 |
7.43x10⁻¹⁰ |
3.99x10⁻⁵ | -2.194 |
| GSTA2 |
7.95x10⁻¹⁰ |
4.28x10⁻⁵ |
-3.152 |
Mucin 1 (MUC1) is upregulated in ICC
and has clinical significance in TCGA data
Data from the TCGA were used to study the
upregulated genes identified. There were 36 ICC tumor tissues and
nine normal tissues in the TCGA dataset. The edgeR package was used
to reveal the dysregulated genes. A total of 769 upregulated genes
and 713 downregulated genes were identified (logFC>4,
adjP<0.001). The results for the upregulated genes are presented
in Fig. 1B and Table SIII. Intersection of the two
datasets revealed that 13 upregulated genes were identified in the
GEO as well as TCGA datasets (Fig.
1C). All 13 genes were upregulated in ICC tissue compared with
normal liver tissue (Fig. 1D and
E), but only MUC1 had a
statistically significant impact in the survival analysis (Figs. 1F and S1). The expression of MUC1 in ICC
patients was selected for further study.
Validation of MUC1 expression in
patients with ICC
A total of 61 patients with ICC met the inclusion
criteria and were enrolled in the present study. All of them had
ICC that was diagnosed and pathologically confirmed at the Liver
Surgery Department of Zhongshan Hospital, Fudan University
(Shanghai, China) between January 2009 and December 2012. The
clinicopathological characteristics of these patients are presented
in Table III.
| Table IIIClinical characteristics of enrolled
patients. |
Table III
Clinical characteristics of enrolled
patients.
| Parameter | All patients
(n=61) | MUC1low
(n=30) | MUC1high
(n=31) |
P-valuea |
|---|
| Age (years) | 59 (39-77) | 57 (39-72) | 59 (40-77) | 0.86 |
| Gender | | | | 0.21 |
|
Male | 40 (65.57) | 22 (73.33) | 18 (58.06) | |
|
Female | 21 (34.43) | 8 (26.67) | 13 (41.94) | |
| Number of
tumors | | | | 0.85 |
|
Single | 42 (68.85) | 24 (80.00) | 18 (58.06) | |
|
Multiple | 19 (31.15) | 6 (20.00) | 13 (41.94) | |
| Tumor size
(cm) | 6 (2-14) | 6 (2-11.5) | 6 (2.5-14) | 0.79 |
| Vascular
invasion | | | | 0.28 |
|
Yes | 16 (26.23) | 6 (20.00) | 10 (32.26) | |
|
No | 45 (73.77) | 24 (80.00) | 21 (67.74) | |
| Bile duct
invasion | | | | 0.08 |
|
Yes | 6 (9.84) | 5 (16.67) | 1 (3.23) | |
|
No | 55 (90.16) | 25 (83.33) | 30 (96.77) | |
| Nerve invasion | | | | 0.53 |
|
Yes | 3 (4.92) | 2 (6.67) | 1 (3.23) | |
|
No | 58 (95.08) | 28 (93.33) | 30 (96.77) | |
| T stage | | | | 0.16 |
|
T1a | 14 (22.95) | 9 (30.00) | 5 (16.13) | |
|
T1b | 17 (27.87) | 8 (26.67) | 9 (29.03) | |
|
T2 | 26 (42.62) | 13 (43.33) | 13 (41.94) | |
|
T3 | 0 (0.00) | 0 (0.00) | 0 (0.00) | |
|
T4 | 4 (6.56) | 0 (0.00) | 4 (12.90) | |
| LN metastasis | | | | 0.53 |
|
Yes | 3 (4.92) | 2 (6.67) | 1 (3.23) | |
|
No | 58 (95.08) | 28 (93.33) | 30 (96.77) | |
| Surrounding tissue
invasion | | | | 0.04 |
|
Yes | 4 (6.56) | 0 (0.00) | 4 (12.90) | |
|
No | 57 (93.44) | 30 (100.00) | 27 (87.10) | |
|
Differentiation | | | | 0.11 |
|
Well | 50 (81.97) | 27 (90.00) | 23 (74.19) | |
|
Poor | 11 (18.03) | 3 (10.00) | 8 (25.81) | |
| Type of
resection | | | | 0.29 |
|
Less than
hemihepatectomy | 46 (75.41) | 21 (70.00) | 25 (80.65) | |
|
Hemihepatectomy | 13 (21.31) | 7 (23.33) | 6 (19.35) | |
| Extended
hemihepatectomy | 2 (3.28) | 2 (6.67) | 0 (0.00) | |
| Post-operative
treatment | | | | 0.311 |
|
Yes | 9 (14.75) | 3 (10.00) | 6 (19.35) | |
|
No | 42 (68.85) | 27 (90.00) | 25 (80.65) | |
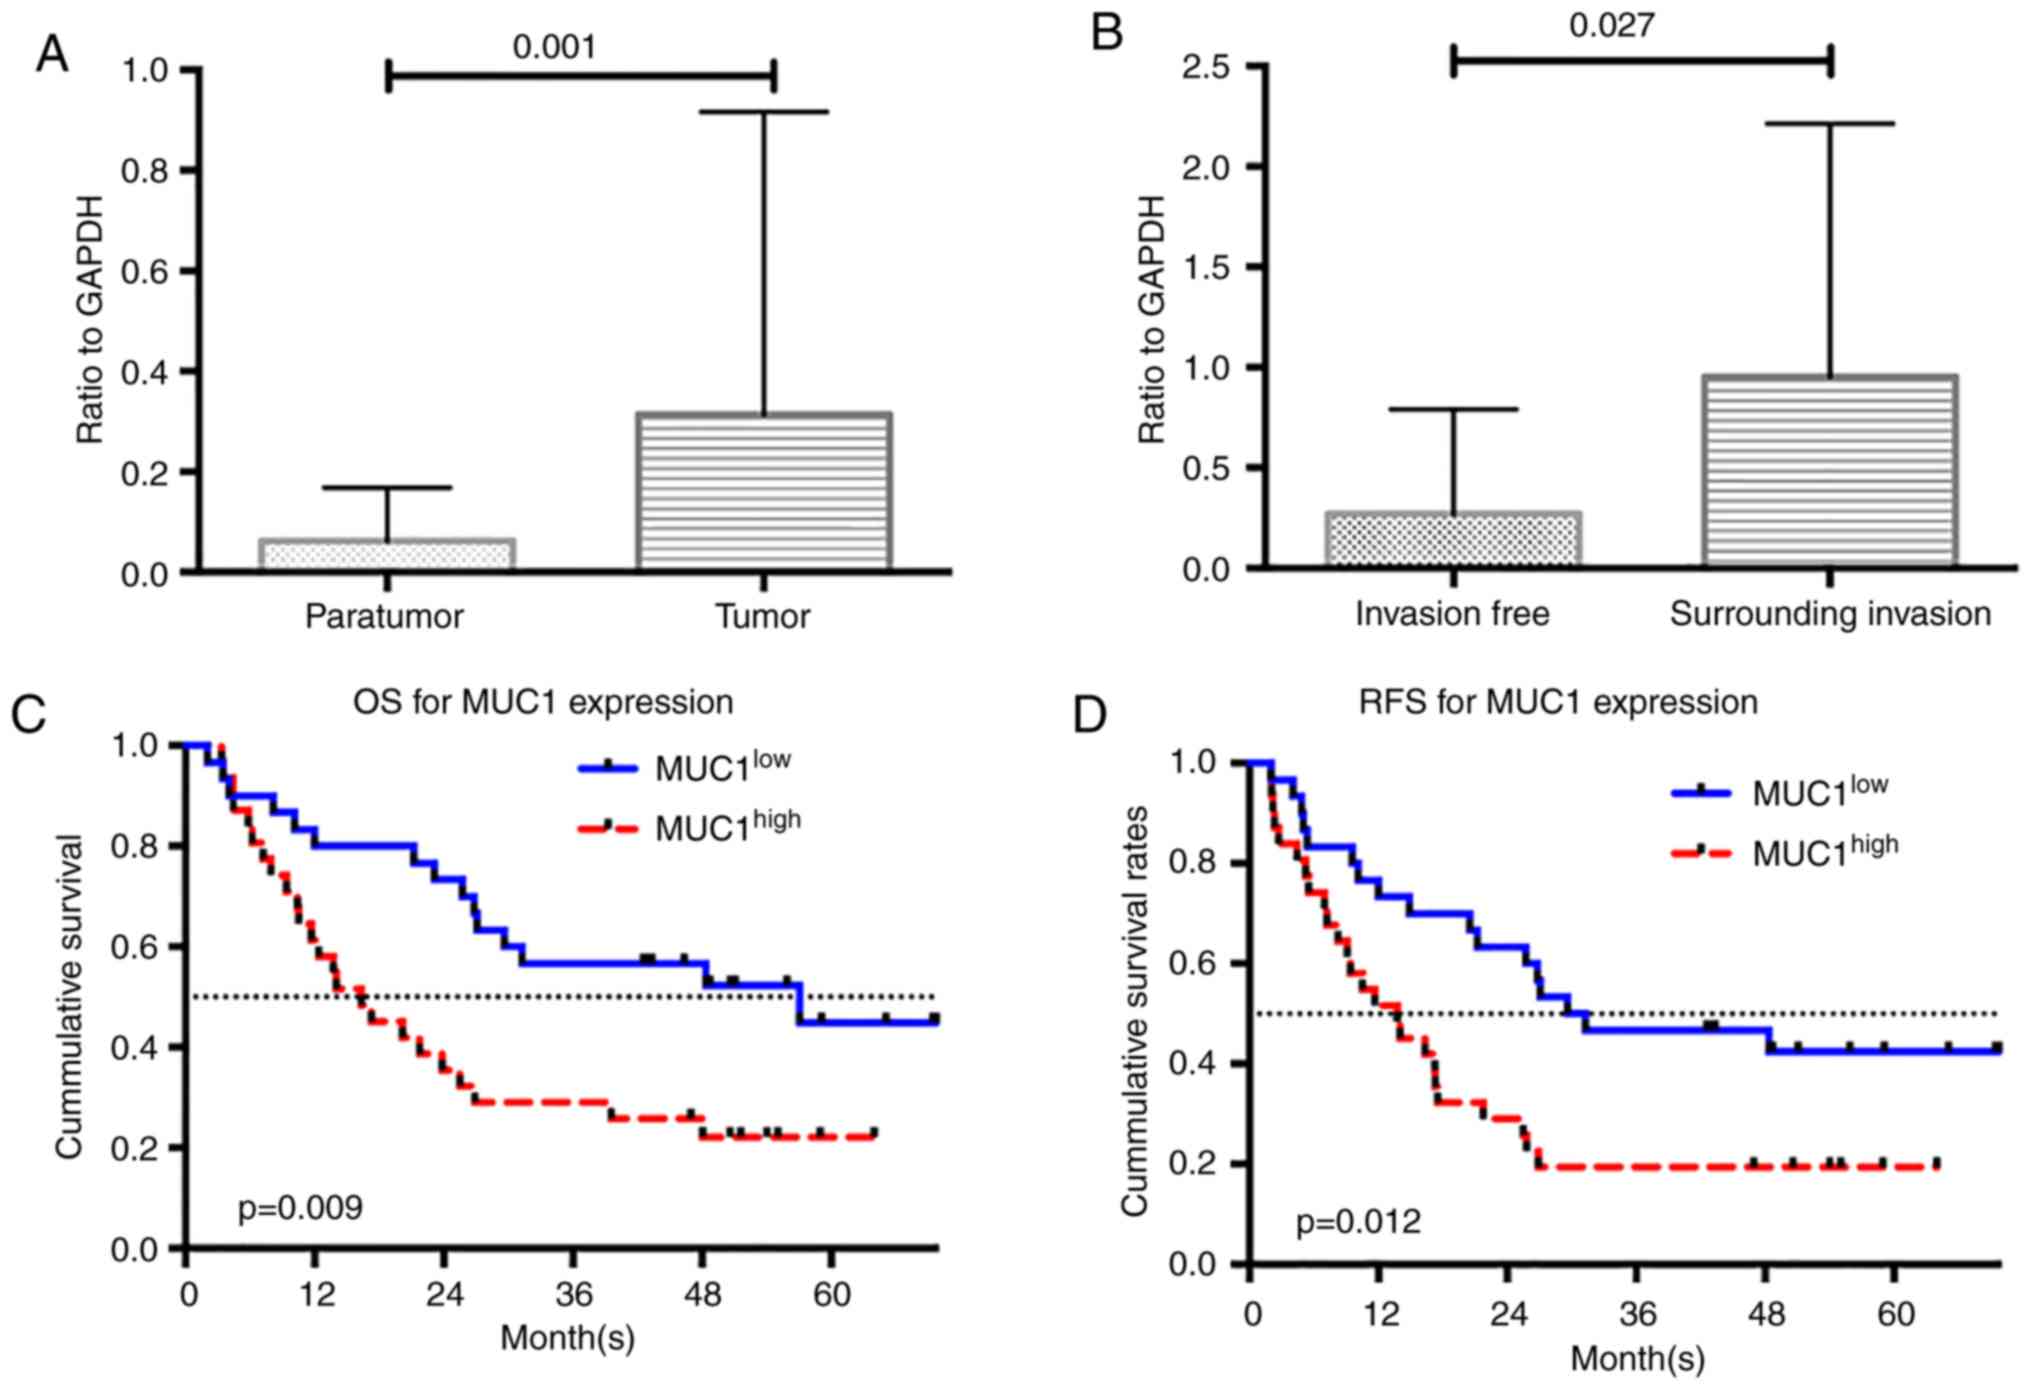
MUC1 expression was examined using RT-qPCR analysis.
Consistent with the results of the dataset analysis, the expression
of MUC1 was significantly higher in ICC tumor tissue than in
adjacent non-tumor tissue (P=0.001; Fig. 2A). The enrolled patients were
divided into two groups based on the median MUC1 expression value
(i.e., low MUC1 expressed in ICC tissue, MUC1low, n=30;
high MUC1 expressed in ICC tissue, MUC1high, n=31).
Inter-group comparisons of the clinicopathological characteristics
are presented in Table III. The
MUC1high group included more patients with tumors that
invaded the surrounding tissue (P=0.040). Inter-group differences
for the other clinicopathological characteristics were not
statistically significant. The levels of MUC1 expression in tumors
that invaded the surrounding tissue were higher than in those
without surrounding tissue invasion (P=0.027; Fig. 2B).
Clinical validation of the prognostic
significance of MUC1 expression
Survival analysis was performed to identify whether
MUC1 levels may be used to predict prognosis in ICC patients. The
median survival times of the MUC1low and
MUC1high groups were 55.06 and 17.25 months,
respectively (P=0.009). The 1-, 3- and 5-year OS rates for the
MUC1low group were 73, 57 and 45%, respectively, as
opposed to 35, 26 and 20%, respectively, for the
MUC1high group. The differences in OS rates according to
the log-rank test was statistically significant between the two
groups (P=0.009; Fig. 2C). A total
of 9 patients (30.0%) in the MUC1low group and 17
(54.8%) in the MUC1high group experienced tumor
recurrence. The inter-group difference in the RFS rates was
statistically significant (P=0.012; Fig. 2D).
The results of the univariate analysis indicated
that MUC1 expression levels were a significant prognostic factor
for OS [hazard ratio (HR)=2.233, 95%CI: 1.214-4.485, P=0.011;
Table IV]. The serum levels of
carcinoembryonic antigen (CEA) and cancer antigen 19-9 (CA19-9),
the degree of tumor differentiation, tumor diameter, tumor T stage
and presence of lymph node metastasis were also significant
influencing factors of OS (Table
IV). The multivariate analysis revealed that a high MUC1
expression level (HR=2.364, 95%CI: 1.127-4.960, P=0.023), high
levels of CEA (HR=2.315, 95%CI: 1.081-4.958, P=0.031) and CA19-9
(HR=2.303, 95%CI: 1.109-4.780, P=0.025), and the presence of lymph
node metastasis (HR=2.846, 95%CI: 1.259-6.436, P=0.012) were
independent prognostic factors for OS (Table IV). A high level of MUC1 was also a
prognostic factor for RFS (univariate analysis HR=2.187, 95%CI:
1.171-4.083, P=0.014; multivariate analysis HR=2.552, 95%CI:
1.294-5.032, P=0.007). Other independent risk factors for RFS time
were the presence of lymph node metastasis (HR=2.053 95%CI:
1.042-4.046, 95%CI, P=0.038) and bile duct invasion (HR=3.979
95%CI: 1.449-10.928, P=0.007; Table
V).
| Table IVUnivariate and multivariate analysis
of prognostic factors for overall survival. |
Table IV
Univariate and multivariate analysis
of prognostic factors for overall survival.
| | Univariate | Multivariate |
|---|
| Prognostic
factor | HR (95%CI) | P-value | HR (95%CI) | P-value |
|---|
| MUC1 (≥0.056 vs.
<0.056, ratio to GAPDH) | 2.233
(1.214-4.485) | 0.011 | 2.364
(1.127-4.960) | 0.023 |
| CEA (≥20 ng/ml vs.
<20 ng/ml) | 2.197
(1.106-4.365) | 0.025 | 2.315
(1.081-4.958) | 0.031 |
| CA-19-9 (≥37 ng/ml
vs. <37 ng/ml) | 2.675
(1.368-5.231) | 0.004 | 2.303
(1.109-4.780) | 0.025 |
| Differentiation
(poor vs. well) | 2.284
(1.102-4.736) | 0.026 | 1.102
(0.485-2.502) | 0.816 |
| Tumor diameter
(>5 cm vs. ≤5 cm) | 2.236
(1.110-4.503) | 0.024 | 1.461
(1.127-4.960) | 0.320 |
| LN metastasis (yes
vs. no) | 4.440
(1.916-10.288) | 0.001 | 2.846
(1.259-6.436) | 0.012 |
| T stage (T2-4 vs.
T1) | 1.435
(0.995-2.070) | 0.053 | | |
| Surrounding tissue
invasion (yes vs. no) | 2.612
(0.797-8.557) | 0.113 | | |
| Tumor number
(solitary vs. multiple) | 1.603
(0.838-3.064) | 0.154 | | |
| Nerve invasion (yes
vs. no) | 1.117
(0.268-4.645) | 0.879 | | |
| Vascular invasion
(yes vs. no) | 0.798
(0.378-1.681) | 0.552 | | |
| Bile duct invasion
(presence vs. absence) | 1.995
(0.762-5.018) | 0.163 | | |
| Table VUnivariate and multivariate analysis
of prognostic factors for recurrence-free survival. |
Table V
Univariate and multivariate analysis
of prognostic factors for recurrence-free survival.
| | Univariate | Multivariate |
|---|
| Prognostic
factor | HR (95%CI) | P-value | HR (95%CI) | P-value |
|---|
| MUC1 (≥0.056 vs.
<0.056, ratio to GAPDH) | 2.187
(1.171-4.083) | 0.014 | 2.552
(1.294-5.032) | 0.007 |
| Bile duct invasion
(yes vs. No) | 2.445
(1.022-5.851) | 0.045 | 3.979
(1.449-10.928) | 0.007 |
| Tumor diameter
(>5 cm vs. ≤5 cm) | 1.977
(1.026-3.810) | 0.042 | 1.130
(0.509-2.510) | 0.764 |
| T stage (T2-4 vs.
T1) | 1.468
(1.039-2.073) | 0.029 | 1.403
(0.931-2.115) | 0.106 |
| LN metastasis (yes
vs. no) | 2.449
(1.256-4.776) | 0.009 | 2.053
(1.042-4.046) | 0.038 |
| Surrounding tissue
invasion (yes vs. no) | 2.045
(0.628-6.656) | 0.235 | | |
| CEA (≥20 ng/ml vs.
<20 ng/ml) | 1.108
(10.567-2.167) | 0.764 | | |
| CA-19-9 (≥37 ng/ml
vs. <37 ng/ml) | 0.828
(0.452-1.516) | 0.540 | | |
| Differentiation
(poor vs. well) | 1.930
(0.940-3.960 | 0.073 | | |
| Tumor number
(solitary vs. multiple) | 1.504
(0.798-2.836) | 0.207 | | |
| Nerve invasion (yes
vs. no) | 2.217
(0.679-7.239) | 0.187 | | |
| Vascular invasion
(yes vs. no) | 0.971
(0.488-1.933) | 0.933 | | |
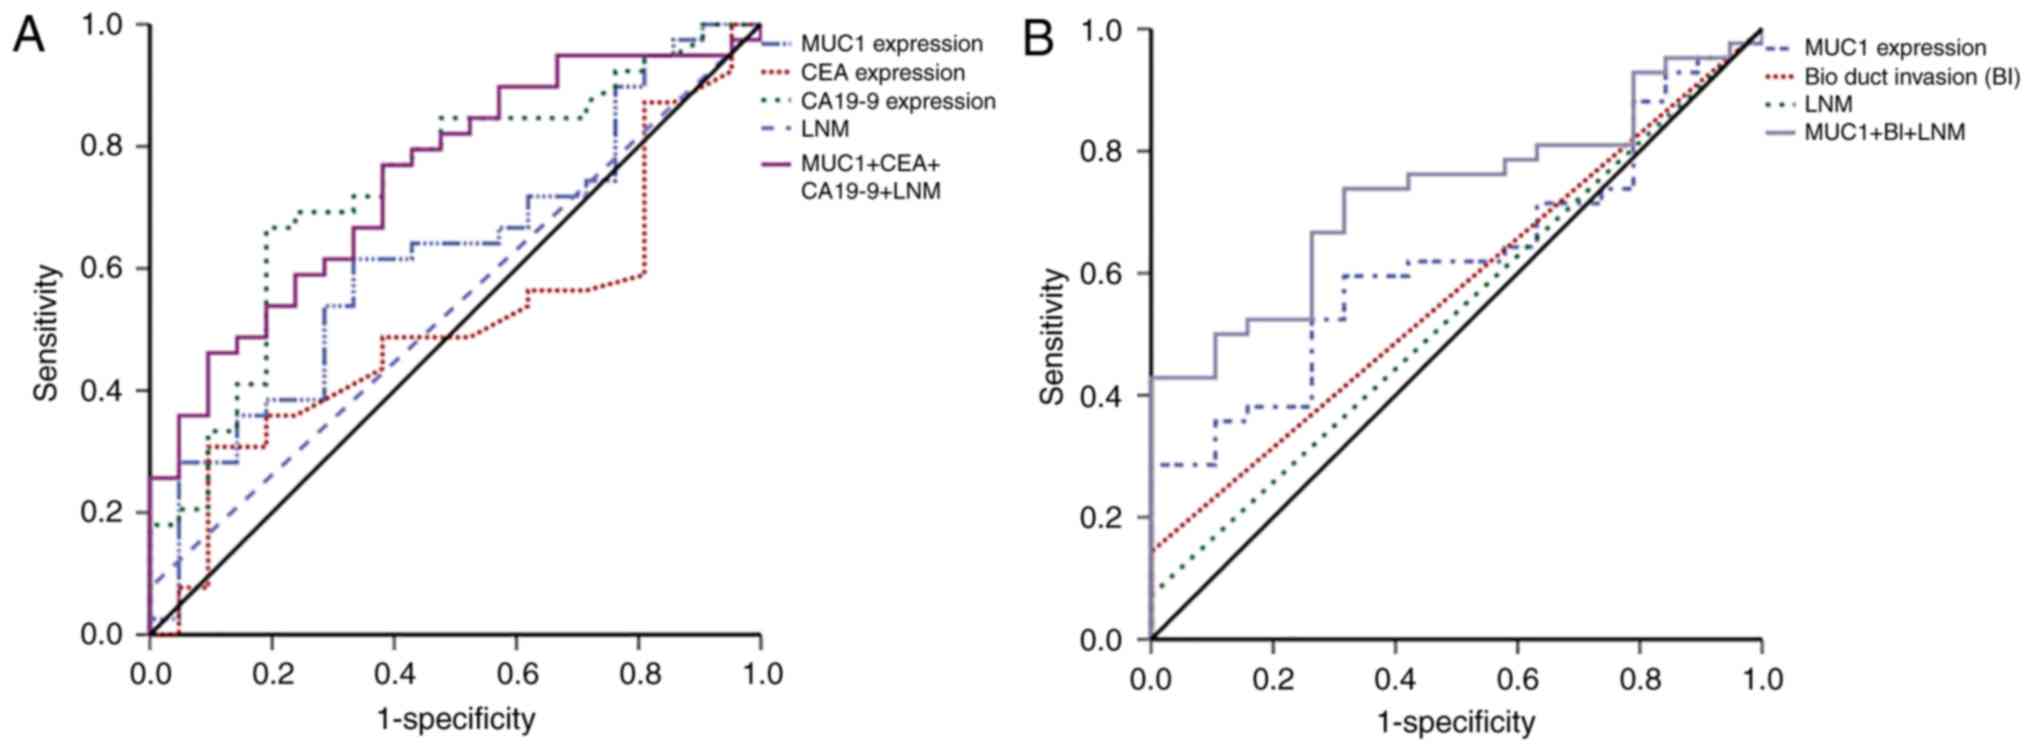
ROC curve analysis of OS and RFS was then used to
examine the predictive precision of these independent prognostic
factors. MUC1 expression levels alone was not a strong predictor of
OS (AUC=0.623), but the combination of the serum levels of MUC1,
CEA and CA19-9, and lymph node metastasis, was a better predictor
of OS (AUC=0.746; Fig. 3A and
Table VI). The ROC curve for RFS
indicated that MUC1 combined with bile duct invasion and lymph node
metastasis was the best predictor of RFS (AUC=0.729; Fig. 3B and Table VI).
| Table VIReceiver operating characteristic
analysis for OS and RFS. |
Table VI
Receiver operating characteristic
analysis for OS and RFS.
| A, OS | |
|---|
| Parameter | AUC (95%CI) |
|---|
| MUC1 | 0.623
(0.476-0.769) |
| CEA | 0.509
(0.357-0.660) |
| CA19-9 | 0.734
(0.600-0.867) |
| LNM | 0.538
(0.388-0.689) |
| Combined Co-index
1 | 0.746
(0.620-0.872) |
| B, RFS | |
| Parameter | AUC (95%CI) |
| MUC1 | 0.622
(0.480-0.763) |
| BI | 0.571
(0.423-0.720) |
| LNM | 0.536
(0.382-0.689) |
| Combined Co-index
2 | 0.729
(0.605-0.854) |
Discussion
ICC has a low incidence but is associated with high
mortality. Due to the lack of effective treatments, the incidence
of ICC-associated mortality is increasing worldwide (10,27,28).
Gene dysregulation contributes to the genesis of ICC (10). Most of the gene expression studies
that have examined how dysregulated genes contribute to the
pathogenesis of ICC did not include sufficient samples to identify
relevant genes or had no clinical data for validation (23-26).
Therefore, a combined approach that included the use of integrated
Bioinformatics analysis and clinical validation was used in the
present study to identify genes involved in ICC. Lack of
availability of raw expression datasets and difficulty in achieving
rigorous normalization and integration over platforms are obstacles
for the meta-analysis of gene expression data. In the present
study, the RRA method was used to overcome these disadvantages
(16).
MUC1 is a heterodimeric type I transmembrane
glycoprotein expressed on the surface of the epithelium of most
organs (e.g., mammary, gastric, respiratory, urinary, and
reproductive tract) (29,30). MUC1 interacts with p53, which
results in the inhibition of p53-mediated apoptosis (31). It also interacts with β-catenin to
initiate the epithelial-mesenchymal transition that promotes the
onset of metastasis (32).
Overexpression of MUC1 is associated with the malignancy of ICC and
indicates a poor outcome (33,34).
However, most of the above-mentioned studies were single-center and
single-ethnicity investigations. In the present study, an
integrated Bioinformatics analysis of data from multiple centers
(241 samples) and multiple ethnicities was performed. The results
suggested that MUC1 regulates ICC tumor invasion. Certain studies
have indicated that MUC1 expression is a predictor for OS in ICC
patients (34,35), but few have detected a correlation
between MUC1 expression and RFS. All patients included in the
combined cohort of the present study had comprehensive clinical
information and the longest follow-up was >5 years. Although the
cohort of patients was heterogenous with T1 or T2 tumors accounting
for ~50%, there was no significant difference in T stage between
the MUC1high group and the MUC1low group
(P=0.18). Most patients with T3 or T4 tumors decided not to receive
any surgery and accordingly, no samples were collected.
Furthermore, patients with T3 and T4 tumors usually received
pre-operative treatment and were ruled out based on the inclusion
criteria. These circumstances led to heterogeneity. The present
results revealed that the expression level of MUC1 was an
independent prognostic factor for OS and RFS. The ROC analysis
revealed that a model combining MUC1 expression, bile duct invasion
and lymph node metastasis may be used to predict RFS (AUC=0.729).
Using MUC1 as a predictor for RFS and OS may help identify patients
with a high risk of recurrence, which may aid in the selection and
development of post-operative treatment and monitoring
protocols.
In the present study, a novel approach that may be
used to study ICC and improve clinical practice was developed. To
the best of our knowledge, the present study was the first to
combine integrated Bioinformatics analysis with clinical validation
to identify biomarkers for ICC. Use of the GEO and TCGA datasets
provided sufficient evidence to prove the association of MUC1 with
ICC. The large number of clinical samples included increases the
validity of the present results. ICC is a cancer type with high
malignancy, which lacks effective treatments (10,27,28).
MUC1 has been previously reported to be a potential target for
anti-cancer therapies (12,36,37). A
glycosylated tripartite vaccine that targets MUC1 is under
development (38). Another MUC1
vaccine (ONT-10) has been tested in a phase I clinical trial
(39). The results of the present
study provided further insight that will be useful for the
development of comprehensive treatments for ICC. However, studies
that use larger sample sizes should be performed to validate the
present results. In vitro and in vivo experiments are
also required to determine the potential mechanisms by which MUC1
drives tumorigenesis.
In the present study, it was identified that MUC1
was upregulated in ICC tissues and that it was associated with
prognosis. Clinical validation revealed that a co-index including
MUC1 and other clinical parameters predicts recurrence of ICC with
high accuracy, which may support the selection and development of
post-operative treatment and monitoring protocols.
Supplementary Material
The figure shows 12 of the 13
intersected genes that didn't reach the statistical significance
for survival analysis. Patients were divided into two groups based
on the median expression value of each gene respectively. Overall
survival analysis for patients with different expression levels of
(A) PDZK1IP1, (B) MMP7, (C) CEACAM6, (D) CEACAM7, (E) KRT19, (F)
LAMC2, (G) SPP1, (H) RAB25, (I) UBD, (J) DCDC2, (K) EPCAM and (L)
MMP11. OS, overall survival; PDZK1IP1, PDZK1 Interacting Protein 1;
MMP7, matrix metalloproteinase 7; CEACAM6, carcinoembryonic antigen
related adhesion molecules 6; MUC1, mucin 1; CEACAM7,
carcinoembryonic antigen related adhesion molecules 7; KRT19,
keratin 19; LAMC2, laminin subunit gamma-2; SPP1, secreted
phosphoprotein 1; RAB25, Ras Genes from Brain Protein 25; UBD,
ubiquitin D; DCDC2, doublecortin domain containing 2; EPCAM,
epithelial cell adhesion molecule; MMP11, matrix metalloproteinase
11.
PCR primers used in the present
study.
List of dysregulated genes associated
with cholangiocarcinoma identified by robust rank aggregation.
Dysregulated genes associated with
cholangiocarcinoma identified by edgeR.package from The Cancer
Genome Atlas.
Acknowledgements
The results shown here are in whole or part based
upon data generated by the TCGA Research Network: https://www.cancer.gov/tcga.
Funding
The present study was supported by the National
Natural Science Foundation of China (grant nos. 81401929, 81572823
and 2017ZX10203204), the Shanghai Rising-Star Program (grant no.
16QA1401000), the Shanghai Hospital Development Center (grant no.
SHDC12015104) and the National Key Research and Development Program
(grant no. 2016YFC0902400).
Availability of data and materials
The datasets generated and/or analysed during the
current study are available in the GEO: GSE89749 (https://www.ncbi.nlm.nih.gov/geo/query/acc.cgi?acc=GSE89749),
GSE76297 (https://www.ncbi.nlm.nih.gov/geo/query/acc.cgi?acc=GSE76297),
GSE57555 (https://www.ncbi.nlm.nih.gov/geo/query/acc.cgi?acc=GSE57555),
GSE32879 (https://www.ncbi.nlm.nih.gov/geo/query/acc.cgi?acc=GSE32879);
and GSE26566 (https://www.ncbi.nlm.nih.gov/geo/query/acc.cgi?acc=GSE26566)
and TCGA (https://cancergenome.nih.gov/). All other data are
included in this published article and its supplementary data.
Authors' contributions
FYC designed the study, analysed the data and
drafted the manuscript. CZ, XYZ and KQZ collected and verified the
data. YFP and LY analyzed and interpreted the data. JF, JZ, JH and
ZW designed the study, interpreted the data, revised the manuscript
and made the decision to submit it for publication. All authors
read and approved the final manuscript.
Ethics approval and consent to
participate
The present study was approved by the Ethics
Committee of Zhongshan Hospital, Fudan University (Shanghai,
China). Written informed consent was obtained from each
patient.
Patient consent for publication
Not applicable.
Competing interests
The authors declare that they have no competing
interests.
References
|
1
|
Aljiffry M, Abdulelah A, Walsh M,
Peltekian K, Alwayn I and Molinari M: Evidence-based approach to
cholangiocarcinoma: A systematic review of the current literature.
J Am Coll Surg. 208:134–147. 2009.PubMed/NCBI View Article : Google Scholar
|
|
2
|
Buettner S, van Vugt JL, IJzermans JN and
Groot Koerkamp B: Intrahepatic cholangiocarcinoma: Current
perspectives. Onco Targets Ther. 10:1131–1142. 2017.PubMed/NCBI View Article : Google Scholar
|
|
3
|
Schlinkert RT, Nagorney DM, Van Heerden JA
and Adson MA: Intrahepatic cholangiocarcinoma: Clinical aspects,
pathology and treatment. HPB Surg. 5:95–102. 1992.PubMed/NCBI View Article : Google Scholar
|
|
4
|
Endo I, Gonen M, Yopp AC, Dalal KM, Zhou
Q, Klimstra D, D'Angelica M, DeMatteo RP, Fong Y, Schwartz L, et
al: Intrahepatic cholangiocarcinoma: Rising frequency, improved
survival, and determinants of outcome after resection. Ann Surg.
248:84–96. 2008.PubMed/NCBI View Article : Google Scholar
|
|
5
|
Dodson RM, Weiss MJ, Cosgrove D, Herman
JM, Kamel I, Anders R, Geschwind JF and Pawlik TM: Intrahepatic
cholangiocarcinoma: Management options and emerging therapies. J Am
Coll Surg. 217:736–750.e4. 2013.PubMed/NCBI View Article : Google Scholar
|
|
6
|
Shaib YH, Davila JA, McGlynn K and
El-Serag HB: Rising incidence of intrahepatic cholangiocarcinoma in
the United States: A true increase? J Hepatol. 40:472–477.
2004.PubMed/NCBI View Article : Google Scholar
|
|
7
|
Yamashita Y, Taketomi A, Morita K,
Fukuhara T, Ueda S, Sanefuji K, Iguchi T, Kayashima H, Sugimachi K
and Maehara Y: The impact of surgical treatment and poor prognostic
factors for patients with intrahepatic cholangiocarcinoma:
Retrospective analysis of 60 patients. Anticancer Res.
28:2353–2359. 2008.PubMed/NCBI
|
|
8
|
Weber SM, Ribero D, O'Reilly EM, Kokudo N,
Miyazaki M and Pawlik TM: Intrahepatic cholangiocarcinoma: Expert
consensus statement. HPB (Oxford). 17:669–680. 2015.PubMed/NCBI View Article : Google Scholar
|
|
9
|
Popat K, McQueen K and Feeley TW: The
global burden of cancer. Best Pract Res Clin Anaesthesiol.
27:399–408. 2013.PubMed/NCBI View Article : Google Scholar
|
|
10
|
Bridgewater J, Galle PR, Khan SA, Llovet
JM, Park JW, Patel T, Pawlik TM and Gores GJ: Guidelines for the
diagnosis and management of intrahepatic cholangiocarcinoma. J
Hepatol. 60:1268–1289. 2014.PubMed/NCBI View Article : Google Scholar
|
|
11
|
Rao CV, Asch AS and Yamada HY: Frequently
mutated genes/pathways and genomic instability as prevention
targets in liver cancer. Carcinogenesis. 38:2–11. 2017.PubMed/NCBI View Article : Google Scholar
|
|
12
|
Rizvi S and Gores GJ: Emerging molecular
therapeutic targets for cholangiocarcinoma. J Hepatol. 67:632–644.
2017.PubMed/NCBI View Article : Google Scholar
|
|
13
|
Rahnemai-Azar AA, Weisbrod A, Dillhoff M,
Schmidt C and Pawlik TM: Intrahepatic cholangiocarcinoma: Molecular
markers for diagnosis and prognosis. Surg Oncol. 26:125–137.
2017.PubMed/NCBI View Article : Google Scholar
|
|
14
|
Wirapati P, Sotiriou C, Kunkel S, Farmer
P, Pradervand S, Haibe-Kains B, Desmedt C, Ignatiadis M, Sengstag
T, Schütz F, et al: Meta-analysis of gene expression profiles in
breast cancer: Toward a unified understanding of breast cancer
subtyping and prognosis signatures. Breast Cancer Res.
10(R65)2008.PubMed/NCBI View
Article : Google Scholar
|
|
15
|
Võsa U, Kolde R, Vilo J, Metspalu A and
Annilo T: Comprehensive meta-analysis of microRNA expression using
a robust rank aggregation approach. Methods Mol Biol. 1182:361–373.
2014.PubMed/NCBI View Article : Google Scholar
|
|
16
|
Kolde R, Laur S, Adler P and Vilo J:
Robust rank aggregation for gene list integration and
meta-analysis. Bioinformatics. 28:573–580. 2012.PubMed/NCBI View Article : Google Scholar
|
|
17
|
Edgar R, Domrachev M and Lash AE: Gene
expression omnibus: NCBI gene expression and hybridization array
data repository. Nucleic Acids Res. 30:207–210. 2002.PubMed/NCBI View Article : Google Scholar
|
|
18
|
Smyth GK: In Bioinformatics and
Computational Biology Solutions Using R and Bioconductor
(Springer-Verlag, New York), Statistics for Biology and Health,
pp397-420, 2005.
|
|
19
|
McCarthy DJ, Chen Y and Smyth GK:
Differential expression analysis of multifactor RNA-Seq experiments
with respect to biological variation. Nucleic Acids Res.
40:4288–4297. 2012.PubMed/NCBI View Article : Google Scholar
|
|
20
|
Livak KJ and Schmittgen TD: Analysis of
relative gene expression data using real-time quantitative PCR and
the 2(-Delta Delta C(T)) method. Methods. 25:402–408.
2001.PubMed/NCBI View Article : Google Scholar
|
|
21
|
Amin MB: AJCC Cancer Staging Manual, 8th
edition.
|
|
22
|
Jusakul A, Cutcutache I, Yong CH, Lim JQ,
Huang MN, Padmanabhan N, Nellore V, Kongpetch S, Ng AWT, Ng LM, et
al: Whole-Genome and epigenomic landscapes of etiologically
distinct subtypes of cholangiocarcinoma. Cancer Discov.
7:1116–1135. 2017.PubMed/NCBI View Article : Google Scholar
|
|
23
|
Chaisaingmongkol J, Budhu A, Dang H,
Rabibhadana S, Pupacdi B, Kwon SM, Forgues M, Pomyen Y,
Bhudhisawasdi V, Lertprasertsuke N, et al: Common molecular
subtypes among Asian hepatocellular carcinoma and
cholangiocarcinoma. Cancer Cell. 32:57–70.e3. 2017.PubMed/NCBI View Article : Google Scholar
|
|
24
|
Murakami Y, Kubo S, Tamori A, Itami S,
Kawamura E, Iwaisako K, Ikeda K, Kawada N, Ochiya T and Taguchi YH:
Comprehensive analysis of transcriptome and metabolome analysis in
Intrahepatic Cholangiocarcinoma and Hepatocellular Carcinoma. Sci
Rep. 5(16294)2015.PubMed/NCBI View Article : Google Scholar
|
|
25
|
Oishi N, Kumar MR, Roessler S, Ji J,
Forgues M, Budhu A, Zhao X, Andersen JB, Ye QH, Jia HL, et al:
Transcriptomic profiling reveals hepatic stem-like gene signatures
and interplay of miR-200c and epithelial-mesenchymal transition in
intrahepatic cholangiocarcinoma. Hepatology. 56:1792–1803.
2012.PubMed/NCBI View Article : Google Scholar
|
|
26
|
Andersen JB, Spee B, Blechacz BR, Avital
I, Komuta M, Barbour A, Conner EA, Gillen MC, Roskams T, Roberts
LR, et al: Genomic and genetic characterization of
cholangiocarcinoma identifies therapeutic targets for tyrosine
kinase inhibitors. Gastroenterology. 142:1021–1031.e15.
2012.PubMed/NCBI View Article : Google Scholar
|
|
27
|
Guro H, Kim JW, Choi Y, Cho JY, Yoon YS
and Han HS: Multidisciplinary management of intrahepatic
cholangiocarcinoma: Current approaches. Surg Oncol. 26:146–152.
2017.PubMed/NCBI View Article : Google Scholar
|
|
28
|
Kaczynski J, Hansson G and Wallerstedt S:
Incidence, etiologic aspects and clinicopathologic features in
intrahepatic cholangiocellular carcinoma-a study of 51 cases from a
low-endemicity area. Acta Oncol. 37:77–83. 1998.PubMed/NCBI View Article : Google Scholar
|
|
29
|
Brayman M, Thathiah A and Carson DD: MUC1:
A multifunctional cell surface component of reproductive tissue
epithelia. Reprod Biol Endocrinol. 2(4)2004.PubMed/NCBI View Article : Google Scholar
|
|
30
|
Aplin JD, Hey NA and Li TC: MUC1 as a cell
surface and secretory component of endometrial epithelium: Reduced
levels in recurrent miscarriage. Am J Reprod Immunol. 35:261–266.
1996.PubMed/NCBI View Article : Google Scholar
|
|
31
|
Wei X, Xu H and Kufe D: Human MUC1
oncoprotein regulates p53-responsive gene transcription in the
genotoxic stress response. Cancer Cell. 7:167–178. 2005.PubMed/NCBI View Article : Google Scholar
|
|
32
|
Roy LD, Sahraei M, Subramani DB, Besmer D,
Nath S, Tinder TL, Bajaj E, Shanmugam K, Lee YY, Hwang SI, et al:
MUC1 enhances invasiveness of pancreatic cancer cells by inducing
epithelial to mesenchymal transition. Oncogene. 30:1449–1459.
2011.PubMed/NCBI View Article : Google Scholar
|
|
33
|
Higashi M, Yonezawa S, Ho JJ, Tanaka S,
Irimura T, Kim YS and Sato E: Expression of MUC1 and MUC2 mucin
antigens in intrahepatic bile duct tumors: Its relationship with a
new morphological classification of cholangiocarcinoma. Hepatology.
30:1347–1355. 1999.PubMed/NCBI View Article : Google Scholar
|
|
34
|
Park SY, Roh SJ, Kim YN, Kim SZ, Park HS,
Jang KY, Chung MJ, Kang MJ, Lee DG and Moon WS: Expression of MUC1,
MUC2, MUC5AC and MUC6 in cholangiocarcinoma: Prognostic impact.
Oncol Rep. 22:649–657. 2009.PubMed/NCBI View Article : Google Scholar
|
|
35
|
Ruys AT, Groot Koerkamp B, Wiggers JK,
Klümpen HJ, ten Kate FJ and van Gulik TM: Prognostic biomarkers in
patients with resected cholangiocarcinoma: A systematic review and
meta-analysis. Ann Surg Oncol. 21:487–500. 2014.PubMed/NCBI View Article : Google Scholar
|
|
36
|
Pillai K, Pourgholami MH, Chua TC and
Morris DL: MUC1 as a potential target in anticancer therapies. Am J
Clin Oncol. 38:108–118. 2015.PubMed/NCBI View Article : Google Scholar
|
|
37
|
Sasaki M, Nakanuma Y and Kim YS:
Characterization of apomucin expression in intrahepatic
cholangiocarcinomas and their precursor lesions: An
immunohistochemical study. Hepatology. 24:1074–1078.
1996.PubMed/NCBI View Article : Google Scholar
|
|
38
|
Lakshminarayanan V, Thompson P, Wolfert
MA, Buskas T, Bradley JM, Pathangey LB, Madsen CS, Cohen PA,
Gendler SJ and Boons GJ: Immune recognition of tumor-associated
mucin MUC1 is achieved by a fully synthetic aberrantly glycosylated
MUC1 tripartite vaccine. Proc Natl Acad Sci USA. 109:261–266.
2012.PubMed/NCBI View Article : Google Scholar
|
|
39
|
Nemunaitis J, Bedell C, Klucher K, Vo A
and Whiting S: Phase 1 dose escalation of ONT-10, a therapeutic
MUC1 vaccine, in patients with advanced cancer. J Immunother
Cancer. 1 (Suppl 1)(P240)2013.
|