Introduction
Osteoarthritis (OA), a degenerative joint disease,
has various characteristic symptoms, including as joint pain,
swelling, stiffness and a limited range of motion (1,2). As
the most common form of arthritis, OA affects the normal daily
activity of patients and their quality of life (3). An estimated 3.3% of the global
population suffer from OA (4) and
~30% of individuals affected are aged >60 years (3). Although OA is closely associated with
age, the underlying mechanisms of the disease remain to be fully
elucidated.
In the past, OA was regarded as a disease that only
comprises cartilage degradation (5). However, it is a complex process caused
by diverse factors, including inflammatory proteins (6), matrix-degrading enzymes (7), synovitis (8) and genetic factors (9). For instance, chondrocytes may be
activated by mechanical pressure, leading to an increase in the
secretion of proteases, cytokines and inflammatory mediators, as
well as the degradation of collagen protein in obese patients
(10). In addition, the levels of
collagen, matrix metalloproteinases (MMPs) and cytokines, including
interleukin 6 (IL-6) and tumor necrosis factor, were reported to
increase after chondrocyte activation (11-13).
By contrast, tissue inhibitor of MMPs and suppressive cytokines,
including IL-4, IL-10 and IL-13, were significantly decreased after
chondrocyte activation in OA (14,15).
Thus, the progression of OA is associated with an increase of
inflammatory cytokines and reduced suppressive cytokines. In
addition, studies have focused on genetic factors in OA in recent
years. A reduction in the expression levels of growth
differentiation factor 5 due to the single nucleotide polymorphism
rs143383 was reported to be associated with OA (16). Furthermore, urinary collagen type II
C-telopeptide was identified as a prognostic marker in knee and hip
OA (17). Overexpression of
tuftelin 1 in ATDC5 cells inhibited chondrogenic differentiation, a
step in the pathogenesis of OA, by increasing calcification
(18). Therefore, it is important
to study the mechanisms underlying the OA-associated processes.
The present study aimed to identify key genes in OA
through analyzing five public gene expression profiling datasets by
using a genomic meta-analysis. In the present study, the
differentially expressed genes (DEGs) in OA vs. controls were
identified using bioinformatics. Subsequently, a protein-protein
interaction (PPI) network for these DEGs was generated and
analyzed. In addition, the key genes were identified using
principal component analysis (PCA) of the DEGs in the PPI network.
The functions and pathways of these key genes were also elucidated
by using gene ontology (GO) and Kyoto Encyclopedia of Genes and
Genomes (KEGG) enrichment analyses. Finally, the differential
expression of two key genes identified was verified using a
meta-analysis of the expression data from the different data-sets
and by gene expression analysis in a rat model of OA.
Materials and methods
Data acquisition and
pre-processing
The key words ‘osteoarthritis’ and ‘Homo sapiens’
were used to search for all relevant public expression profiling
data in the Gene Expression Omnibus database (GEO; http://www.ncbi.nlm.nih.gov/geo/) deposited until
June 10, 2017. A total of five datasets generated with the
Affymetrix platforms were downloaded (Table I). The data in CEL files were
pre-processed with the oligo package in R (19), including data format transformation,
supplementation of missing values using the median method,
background correction using the MicroArray Suite 5.0 (MAS5,
Affymetrix; Thermo Fisher Scientific, Inc., Waltham, MA, USA) and
quantiles normalization (20,21).
 | Table ICharacteristics of five datasets from
the Affymetrix platforms of Gene Expression Omnibus. |
Table I
Characteristics of five datasets from
the Affymetrix platforms of Gene Expression Omnibus.
| Accession no. | Number of OA
samples | Number of normal
samples | Platform |
|---|
| GSE55235 | 10 | 10 | Affymetrix Human
Genome GPL96 Array |
| GSE55457 | 10 | 10 | Affymetrix Human
Genome GPL96 Array |
| GSE1919 | 5 | 5 | Affymetrix Human
Genome GPL96 Array |
| GSE12021 | 10 | 9 | Affymetrix Human
Genome GPL96 Array |
| GSE82107 | 10 | 7 | Affymetrix Human
Genome GPL570 Array |
Identification of DEGs using genomic
meta-analysis
The major purpose of the present meta-analysis was
to integrate the results of multiple datasets and screen out
significant DEGs. First of all, the MetaQC package in R (http://cran.r-project.org/) was used to perform a
quality control (QC) of the datasets, comprising internal QC,
external QC, accuracy QC and consistency QC (22). In addition, PCA biplots and
standardized mean rank (SMR) were used for assistance in decision
making regarding the QC results and for screening the appropriate
dataset (23). Subsequently, the
MetaDE package was used to identify the DEGs using meta-analysis
based on the reliable datasets according to QC (24). Statistical parameters of
heterogeneity (e.g., I2 and Qpval) were obtained by a
heterogeneity test for each gene assessed using different platforms
with the MetaDE.ES method. When I2=0 and Qpval >0.05,
the gene expression was considered homogeneous without bias. The
differential expression of genes in the integrated dataset was
detected. Only those with a false discovery rate (FDR) of <0.05
were considered significantly different. Finally, genes with
I2=0, Qpval >0.05, |log2 fold change
>0.58 and FDR<0.05 were identified as DEGs. Furthermore, the
hierarchical clustering heatmap for DEGs in the five datasets was
obtained using the heatmap.sig.genes function in MetaDE package
(https://cran.r-project.org/web/packages/MetaDE/).
Construction of the PPI network
The Search Tool for the Retrieval of Interacting
Genes/Proteins (STRING) database (version 10.5, http://string-db.org/) was used to determine the
interactive association among DEGs, and a PPI network including the
DEGs and their interactions was then constructed (25). A combined score (including
Neighborhood in the Genome score, Gene Fusions score, Cooccurence
Across Genomes score, Co-Expression score, Experimental/Biochemical
Data score, Association in Curated Databases score, and
Co-Mentioned in PubMed Abstracts score) >0.4 under default
parameters was set as a threshold value. Subsequently, the PPI
network was visualized using Cytoscape software (version 3.2.0,
http://www.cytoscape.org/).
Topological analysis of the PPI
network
Deletion of the number of links per node (node
degree) in the PPI network of Saccharomyces cerevisiae and
Escherichia coli indicated that the degree of connectedness
of a protein has an important role (26). Hub nodes were identified when the
degree of interactions was >15 and the average shortest path
length was <3.5.
Identification of the key genes using
PCA
PCA is a feature dimension reduction procedure that
is able to identify new variables or PCs (27). A set of possibly correlated
variables was converted into a set of values of linearly
uncorrelated variables called PCs using orthogonal transformation
through PCA. If the new variable has the largest possible variance,
it is regarded as the first PC. After extraction of the first PC,
each succeeding component in turn has the highest variance. Thus,
the variance and information content of each PC are diminishing
consecutively (PC1 > PC2…> PCn). The PCA of DEGs in the PPI
network was performed with the psych package in R software. The key
genes in each dataset were thereby identified.
GO term and KEGG pathway enrichment
analysis for the key genes
The Database for Annotation, Visualization
and Integrated Discovery (DAVID; version 6.7; https://david.ncifcrf.gov/), a bioinformatics web tool
for the functional annotation analysis of high-throughput gene
lists, was used to analyze GO terms and KEGG pathways enriched by
the key genes (28,29). The significance of the
terms/pathways (P<0.05) was identified according to their
hypergeometric distribution.
Signature analysis of the key
genes
The Meta package in R software was used to analyze
the expression features of the key genes. Forest plots for the
expression of the key genes between OA samples and control samples
were obtained via the fixed-effect model with I2=0.
Animal model of OA
Male Sprague Dawley (SD) rats (weight, 220±25 g;
age, 8 weeks) were used to establish an animal model of OA and were
randomly divided into the normal control and model groups (30 rats
per group). The SD rats were purchased from SLAC Laboratory Animal
Co., Ltd. (Shanghai, China) and kept at 20±2˚C and relative
humidity of 55±5% with a 12-h light/dark cycle under specific
pathogen-free conditions. After acclimatization for 3 days and on
the fourth day, rats in the control group were fed ad
libitum water and food without any other treatment. The left
and right knee joints of the rats in the model group were subjected
to anterior cruciate ligament transection and immobilized
thereafter (30). At 8 weeks
post-surgery, those rats in which the OA model was successfully
established and rats in normal group were anesthetized by
intraperitoneal injection of 3% chloral hydrate (300 mg/kg) prior
to decapitation, and their joints and synovial tissues were
harvested.
Verification of DEGs in OA by reverse
transcription-quantitative polymerase chain reaction (RT-qPCR)
To confirm the results of the meta-analysis, the
expression levels of β-1,4-galactosyltransferase-1 (B4GALT1) and
eukaryotic translation initiation factor 4 γ 1 (EIF4G1) were
detected in the synovial tissues of the rat model of OA using
RT-qPCR. Total RNA was extracted from synovial tissues of the rats
using the RNAiso Plus reagent (cat. no. 9109; Takara Bio, Inc.,
Otsu, Japan) according to the manufacturer's protocol under low
temperature. Subsequently, the first-strand complementary DNA was
prepared from synovial tissue RNA using the PrimeScript™ RT Master
Mix (cat. no. RR036A; Takara Bio, Inc.) according to the
manufacturer's protocol. GAPDH was detected as an endogenous
control. The primers used for B4GALT1, EIF4G1 and GAPDH were based
on the rat sequences (Table II).
The thermocycling protocol for PCR was as follows: 50˚C for 3 min,
95˚C for 3 min, followed by 40 cycles of 95˚C for 10 sec and 60˚C
for 30 sec. The relative amounts of the mRNAs were obtained by
using the Relative Expression Software Tool (REST, Version 2.0.7,
Corbett Life Science; Qiagen, Inc., Valencia, CA, USA), and
relative gene expression was calculated using the 2-ΔΔCq
method (31).
| Table IISequences of primers used for
polymerase chain reaction. |
Table II
Sequences of primers used for
polymerase chain reaction.
| Primer | Sequence
(5'-3') |
|---|
| GAPDH-F |
AGACAGCCGCATCTTCTTGT |
| GAPDH-R |
CTTGCCGTGGGTAGAGTCAT |
| B4GALT1-F |
TCGGGTTTAGCCTGCCTTAC |
| B4GALT1-R |
GATCATGCGACACCTGCCTA |
| EIF4G1-F |
GACACAAATGAACACGCCTTCT |
| EIF4G1-R |
CCAGCAGGGTAGACATGGGG |
Statistical analysis
All experiments were performed three times, and the
results are expressed as the mean ± standard error of the mean.
Differences in gene expression between the OA and normal control
groups were compared using an unpaired two-sided Student's t-test
with SPSS 22.0 (IBM Corp., Armonk, NY, USA). P<0.05 was
considered to indicate a statistically significant difference.
Results
Quality assessment of the five
datasets
The different QC measures and SMR scores are
presented in Table III. The SMR
scores in the five datasets were similar, indicating a high
homogeneity and low bias among the five datasets. Together with the
PCA biplots, the first two PCs covered up to 88.41% of variance
(Fig. 1). In addition, the five
datasets met the criteria regarding the selected parameters and
exhibited no marked differences. After comprehensively considering
multiple parameters, the five datasets were identified as being apt
for simultaneous inclusion in the present meta-analysis.
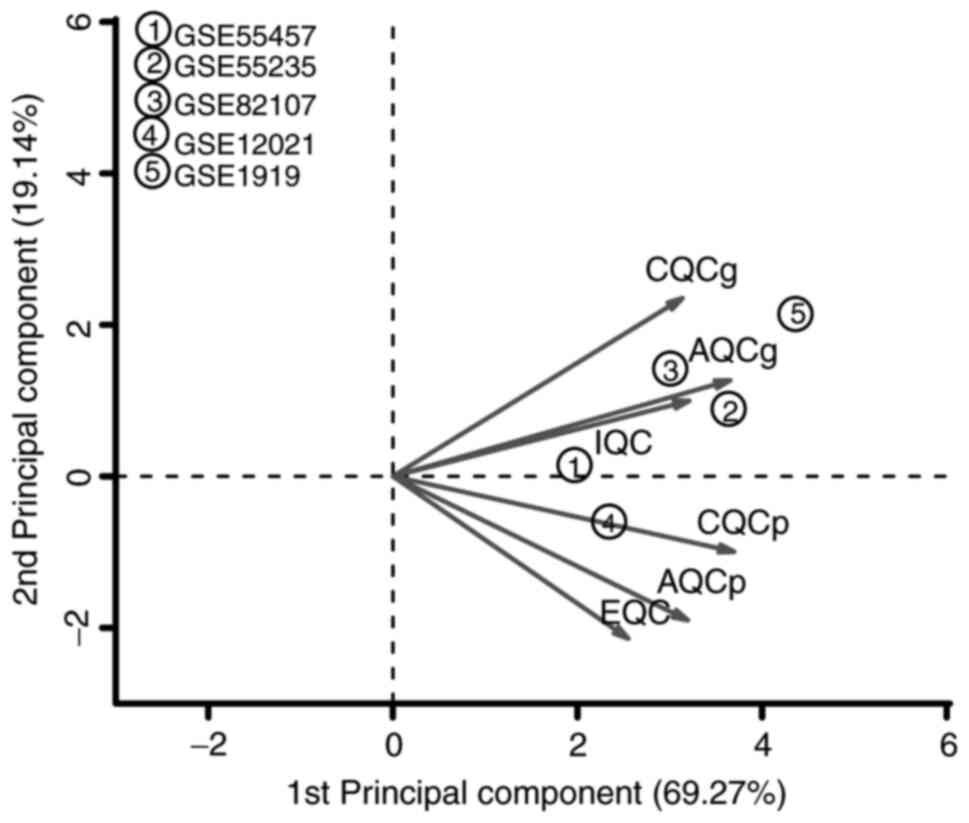 | Figure 1PCA biplots of QC measures for the
five datasets included in the present meta-analysis. The abscissa
indicates the first PC and the ordinate indicates the second PC in
the PCA. QC, quality control; IQC, internal QC; EQC, external QC;
CQCg, consistency QC of differentially expressed gene ranking;
CQCp, consistency QC of enriched pathway ranking, AQCg, accuracy QC
of gene detection; AQCp, accuracy QC of enriched pathway detection,
PCA, principal component analysis. |
| Table IIIDifferent QC measures and SMR
scores. |
Table III
Different QC measures and SMR
scores.
| Dataset | IQC | EQC | CQCg | CQCp | AQCg | AQCp | SMR |
|---|
| GSE55457 | 4.91 | 4.78 | 93.87 | 148.67 | 153.83 | 56.44 | 2.42 |
| GSE55235 | 4.56 | 4.22 | 68.15 | 146.58 | 106.19 | 29.43 | 2.83 |
| GSE82107 | 4.38 | 3.16 | 64.14 | 146.51 | 26.46 | 96.74 | 2.42 |
| GSE12021 | 4.81 | 3.23 | 59.25 | 171.49 | 25.5 | 84.37 | 2.86 |
| GSE1919 | 5.12 | 5 | 52.41 | 101.36 | 184.06 | 39.3 | 1.57 |
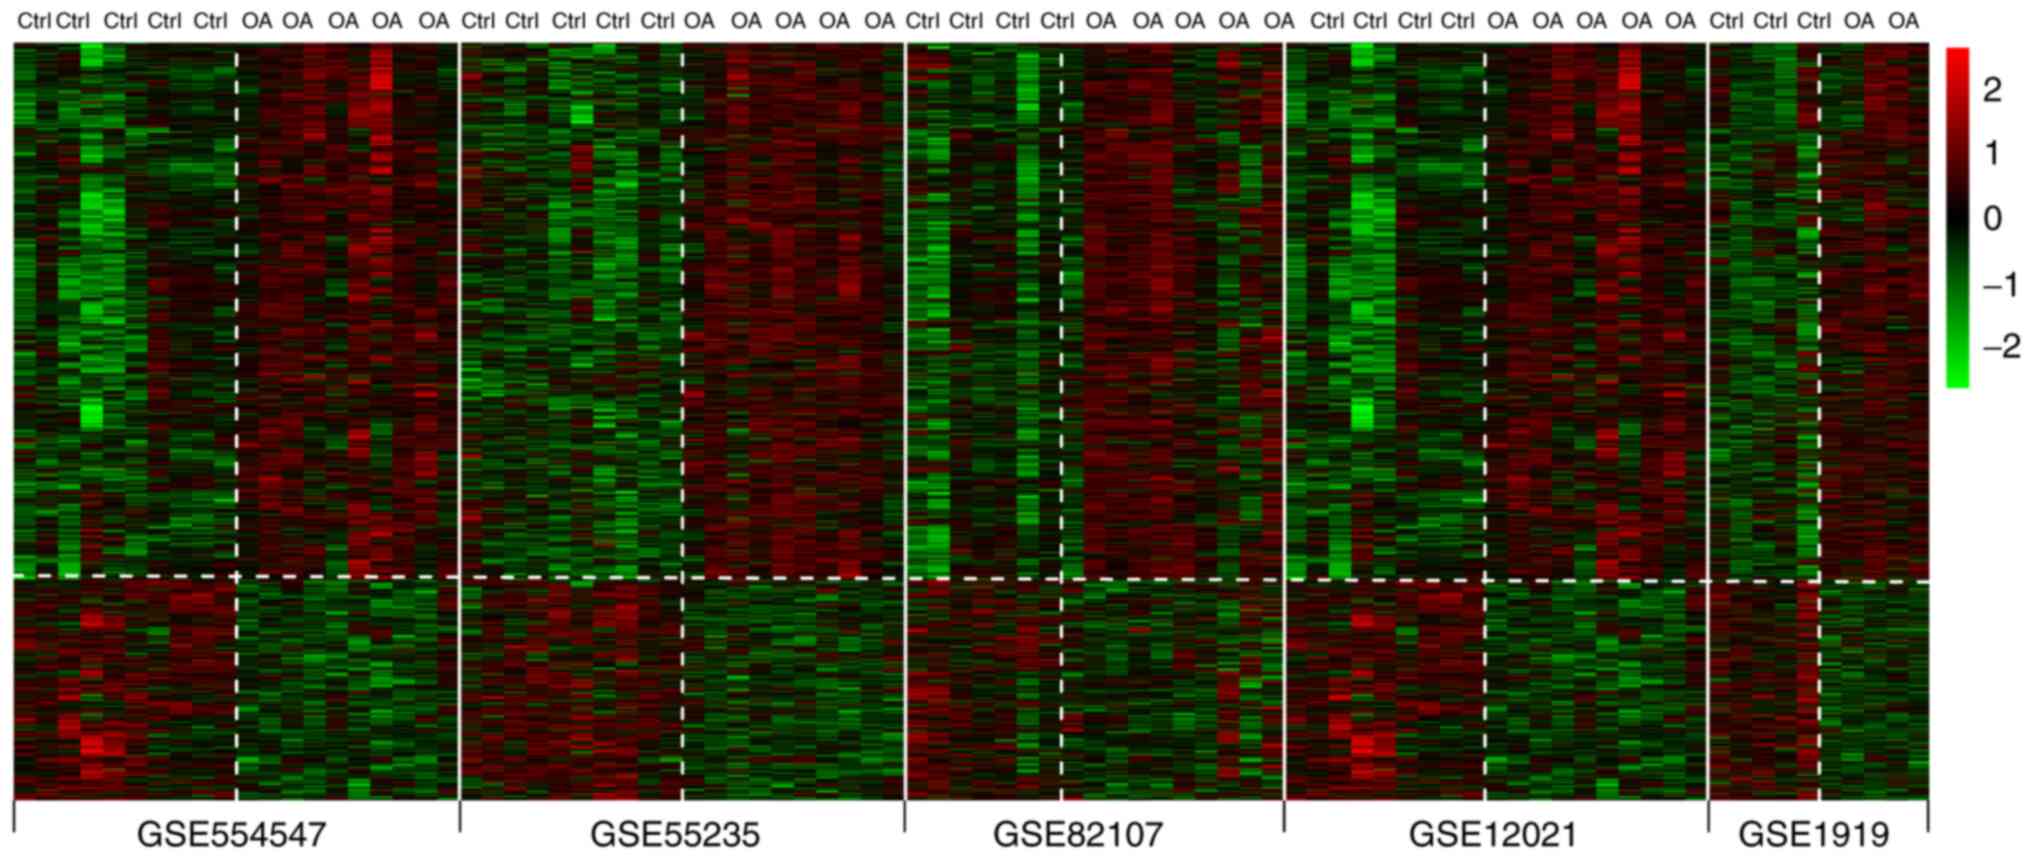
DEGs in OA from the five datasets
In total, 1,007 DEGs between OA and control samples
were identified in the five datasets. In addition, the heatmap
indicated that it these DEGs were distinguishable between OA and
control samples (Fig. 2).
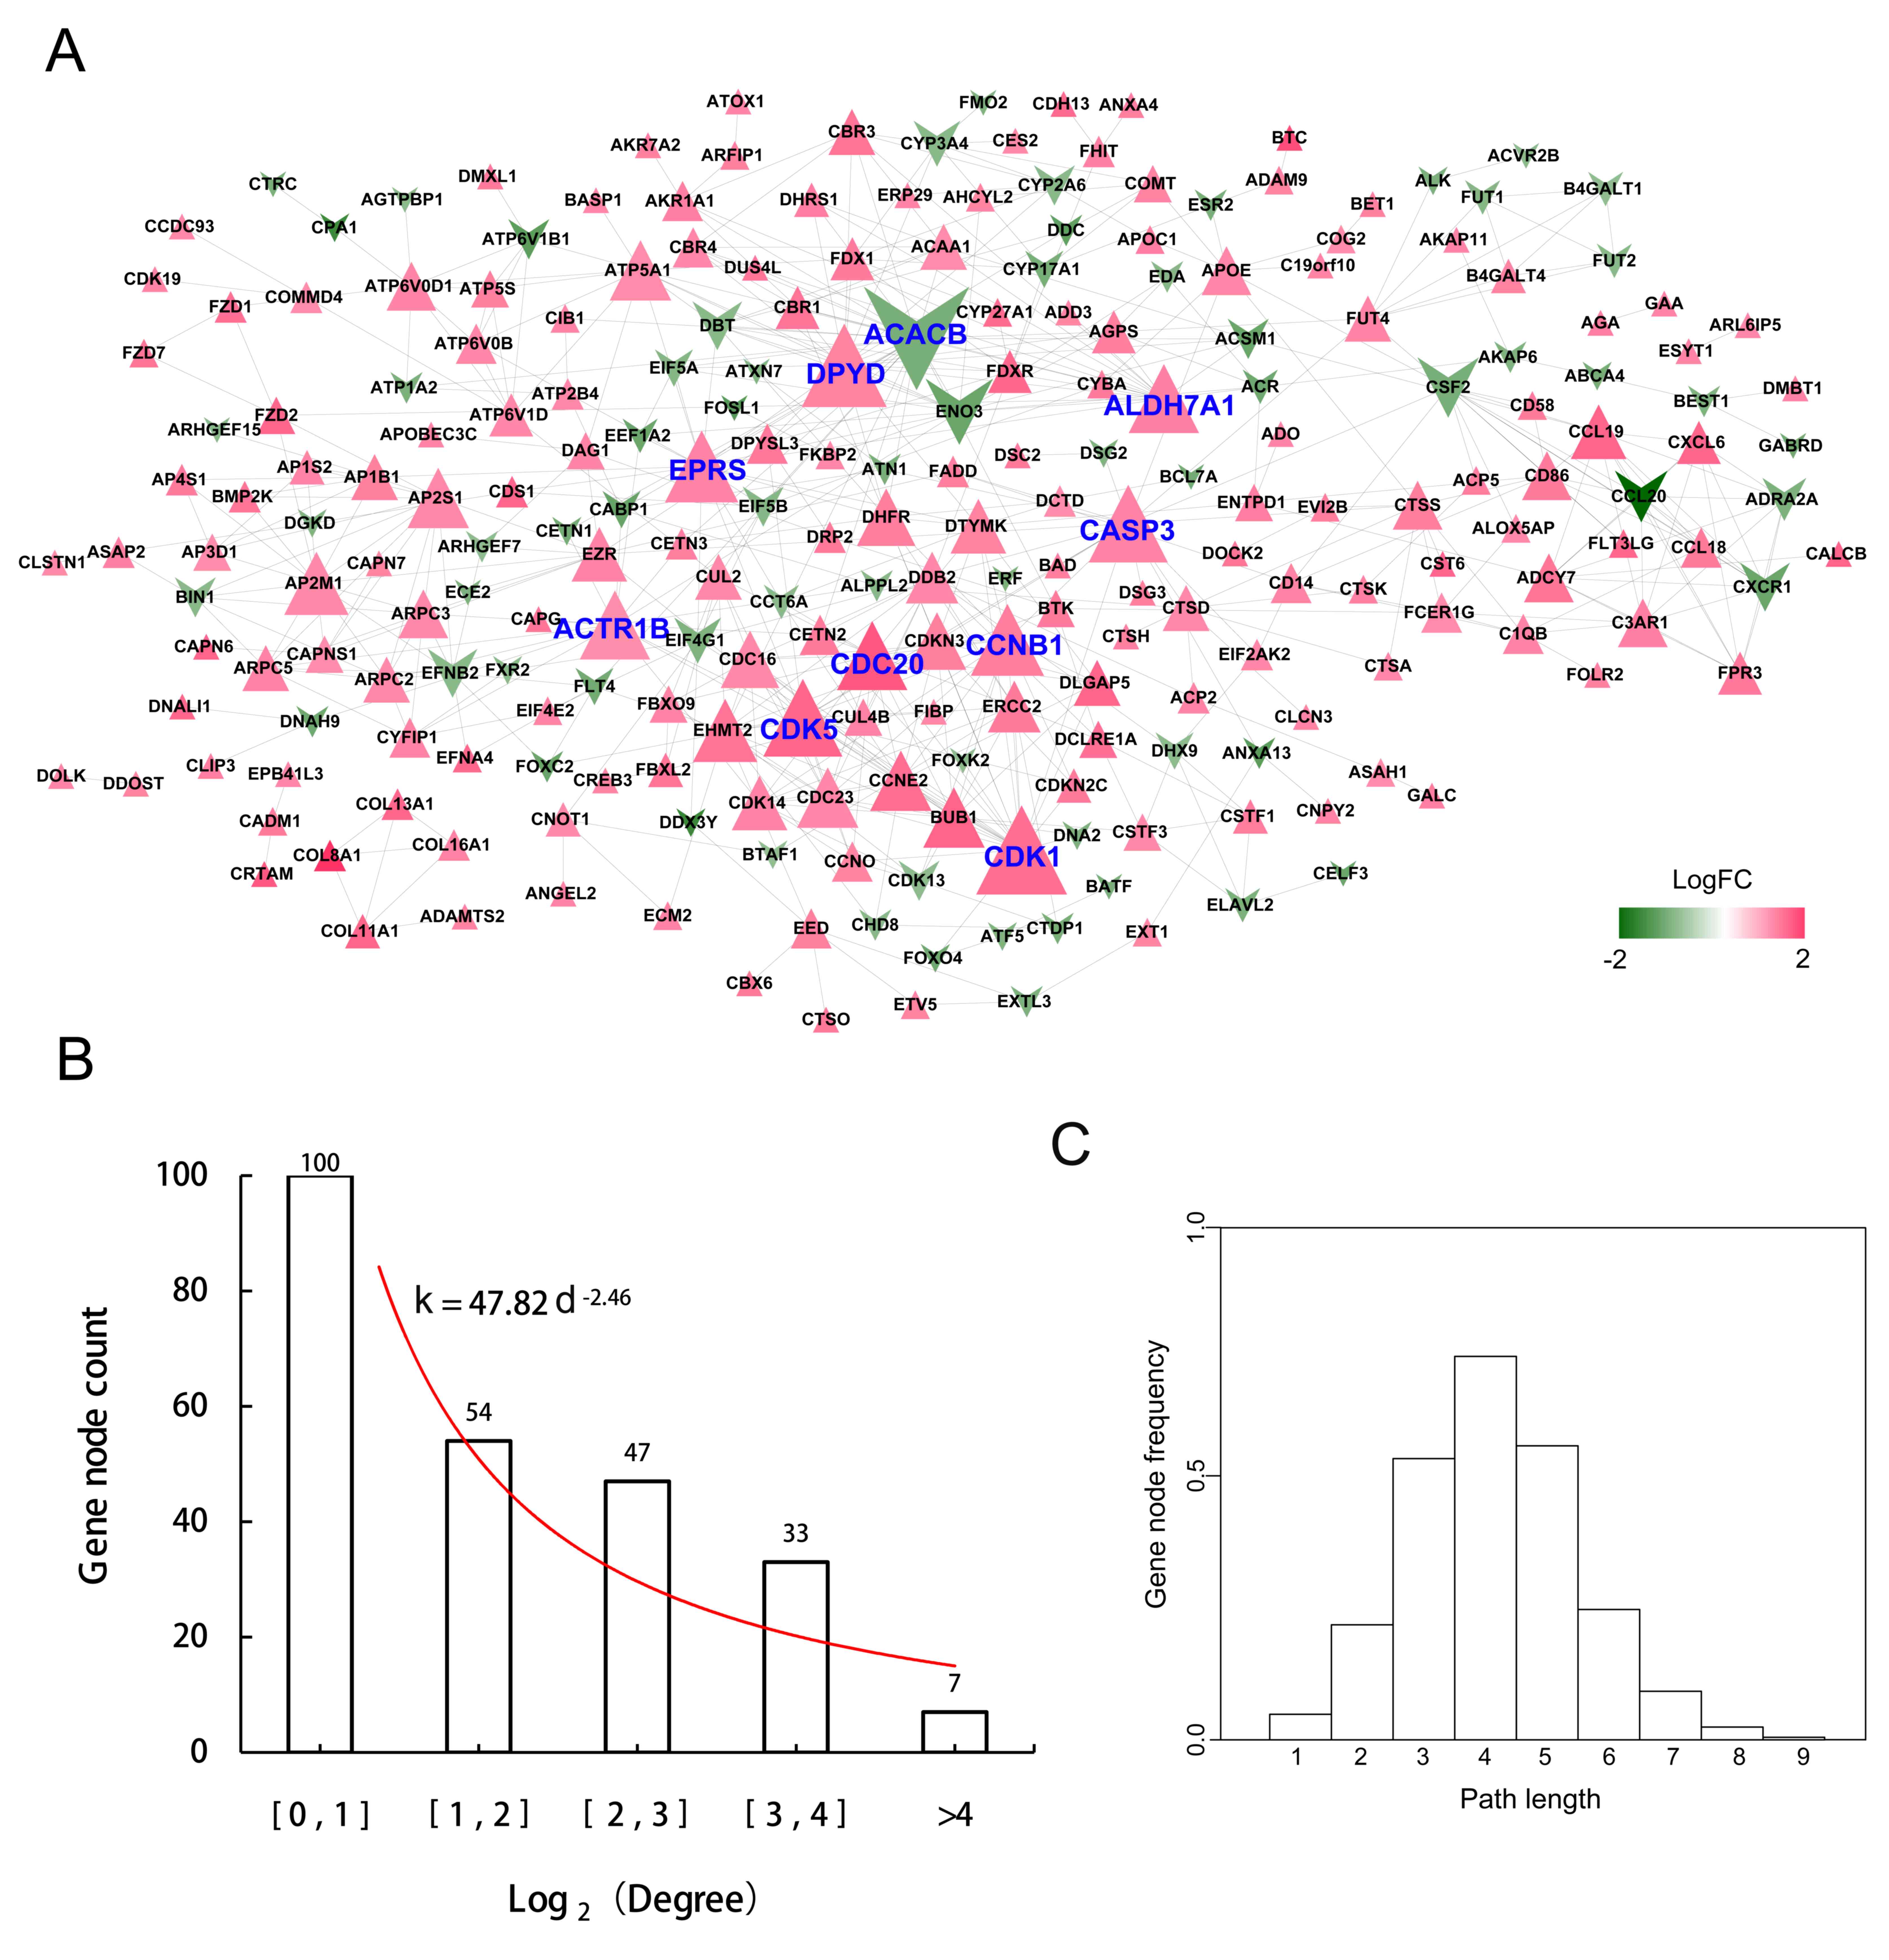
Topological structure of the PPI
network
The PPI network contained 241 nodes, including 171
upregulated DEGs [e.g., cyclin-dependent kinase 1 (CDK1),
aspartylglucosaminidase (AGA), CD58 and CD86] and 70 downregulated
DEGs [e.g., acetyl-CoA carboxylase β (ACACB) and dihydropyrimidine
dehydrogenase (DPYD)] and 576 interactive associations (Fig. 3A). The PPI network complied with an
attribute of scale-free small-world network (Fig. 3B). The node degree function followed
the power-law distribution with an algorithm of y=47.82
d-2.46, where d indicates the degree of connectivity
(the number of links in the PPI). In addition, the most frequent
path length of the nodes was 4, which was also in accordance with
scale-free networks with a small-world effect (32,33)
(Fig. 3C).
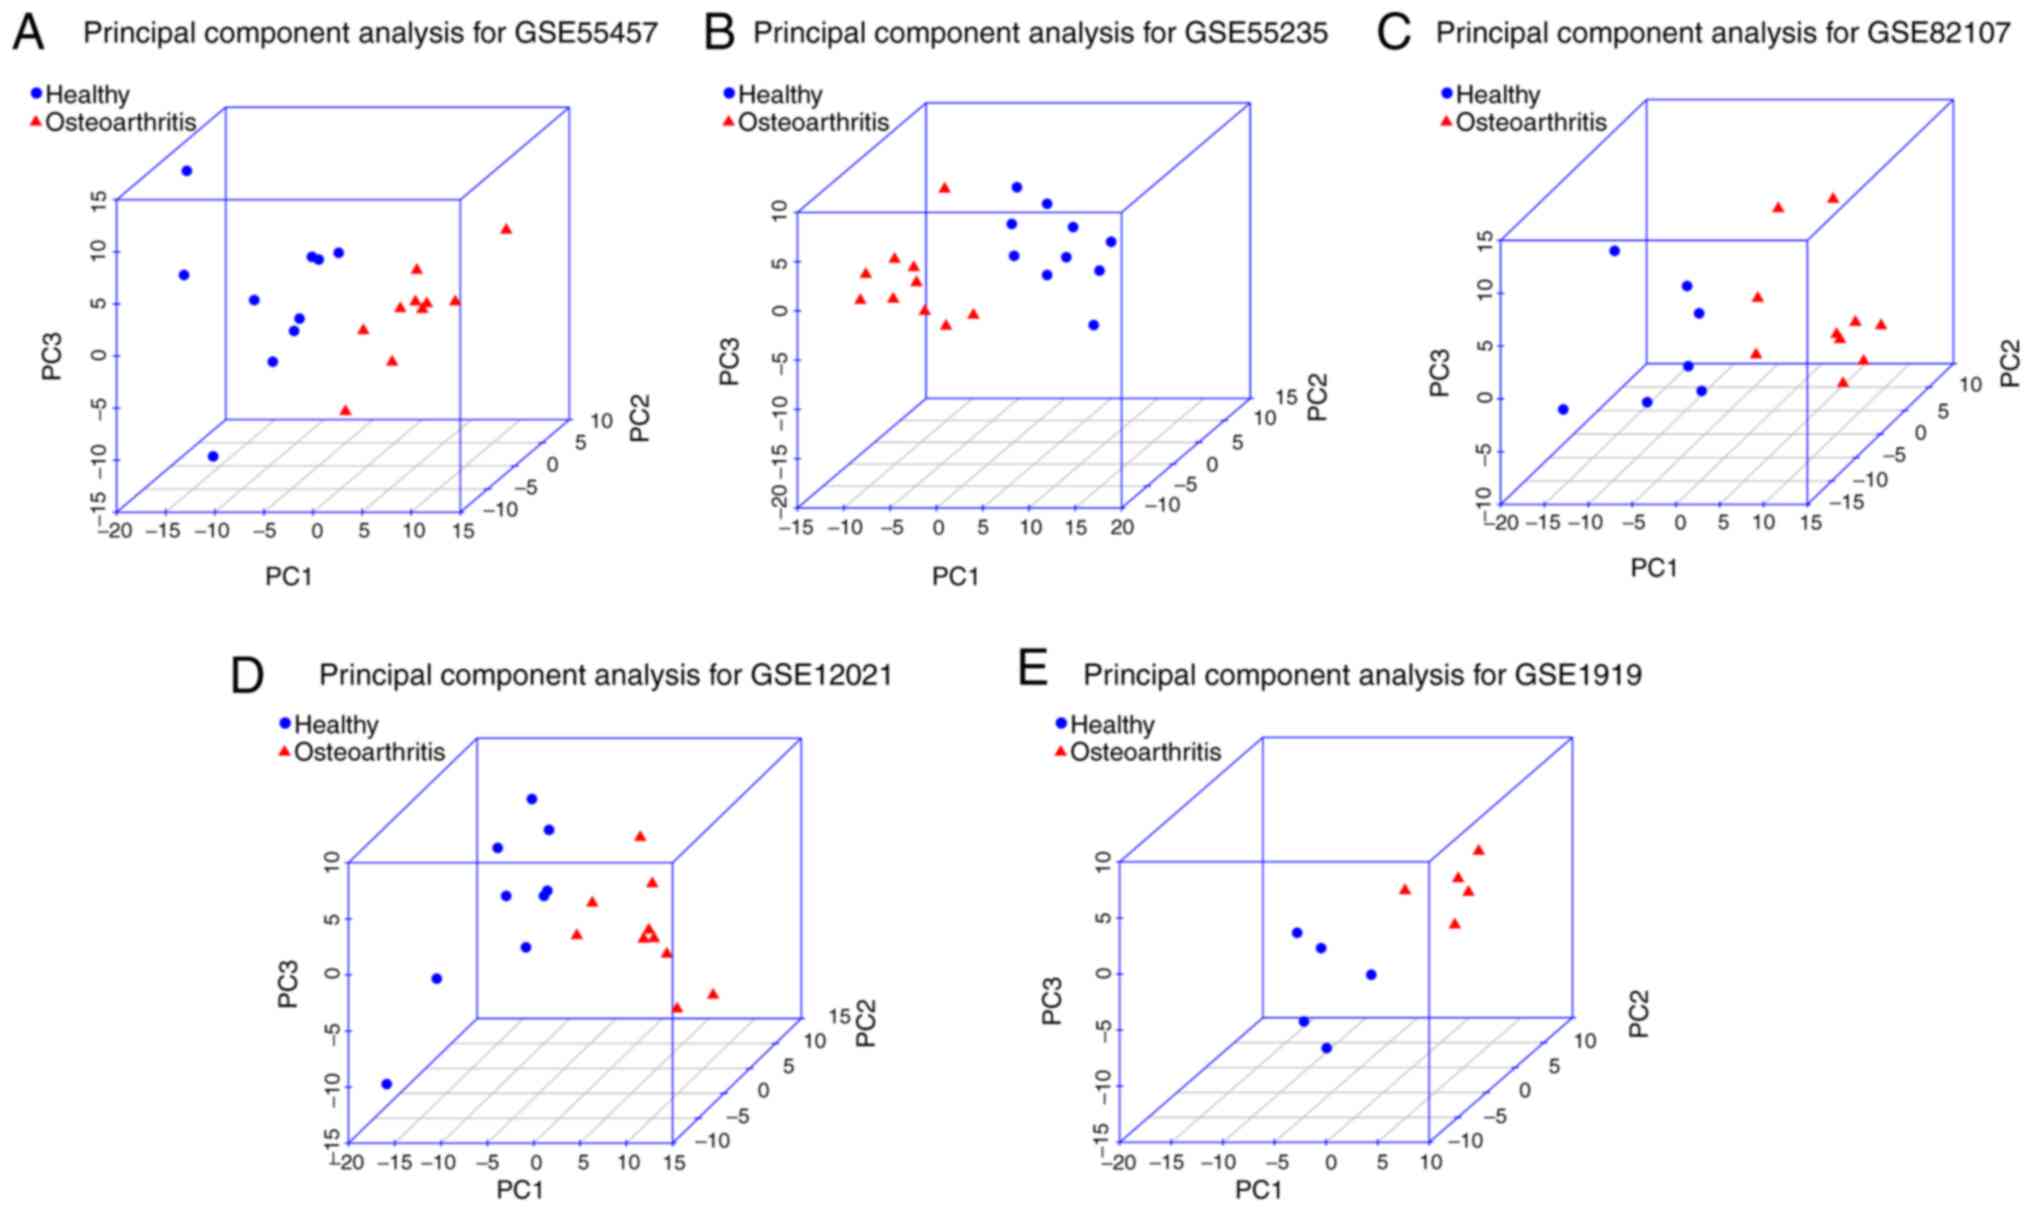
Key genes identified by PCA
By performing a PCA, 20, 20, 17, 19 and 10 PCs were
obtained in the datasets GSE55457, GSE55235, GSE82107, GSE12021 and
GSE1919, respectively. As presented in Table IV, the first three PCs covered
>80% of variance. Thus, the three PCs contained more important
information of the original variable (gene expression values). This
was further verified in three-dimensional graphs (Fig. 4). PC1, PC2 and PC3 were able to
distinguish the OA samples and control samples in each dataset. If
the absolute value of a variable coefficient in a PC was large, the
variable had an important role in the PC. Therefore, the genes with
an absolute value of the coefficient of >0.1 were defined as the
key genes. In the present study, 47 key genes were identified,
including B4GALT1, AGA, CD58, CD86, ezrin, adaptor-related protein
complex 3 subunit δ 1 and EIF4G1. Subsequently, the 47 key genes
were identified to be enriched in 13 GO terms in the category
biological process and 2 KEGG pathways (Table V). For instance, B4GALT1 was mainly
involved in the positive regulation of developmental processes,
protein amino acid terminal glycosylation and protein amino acid
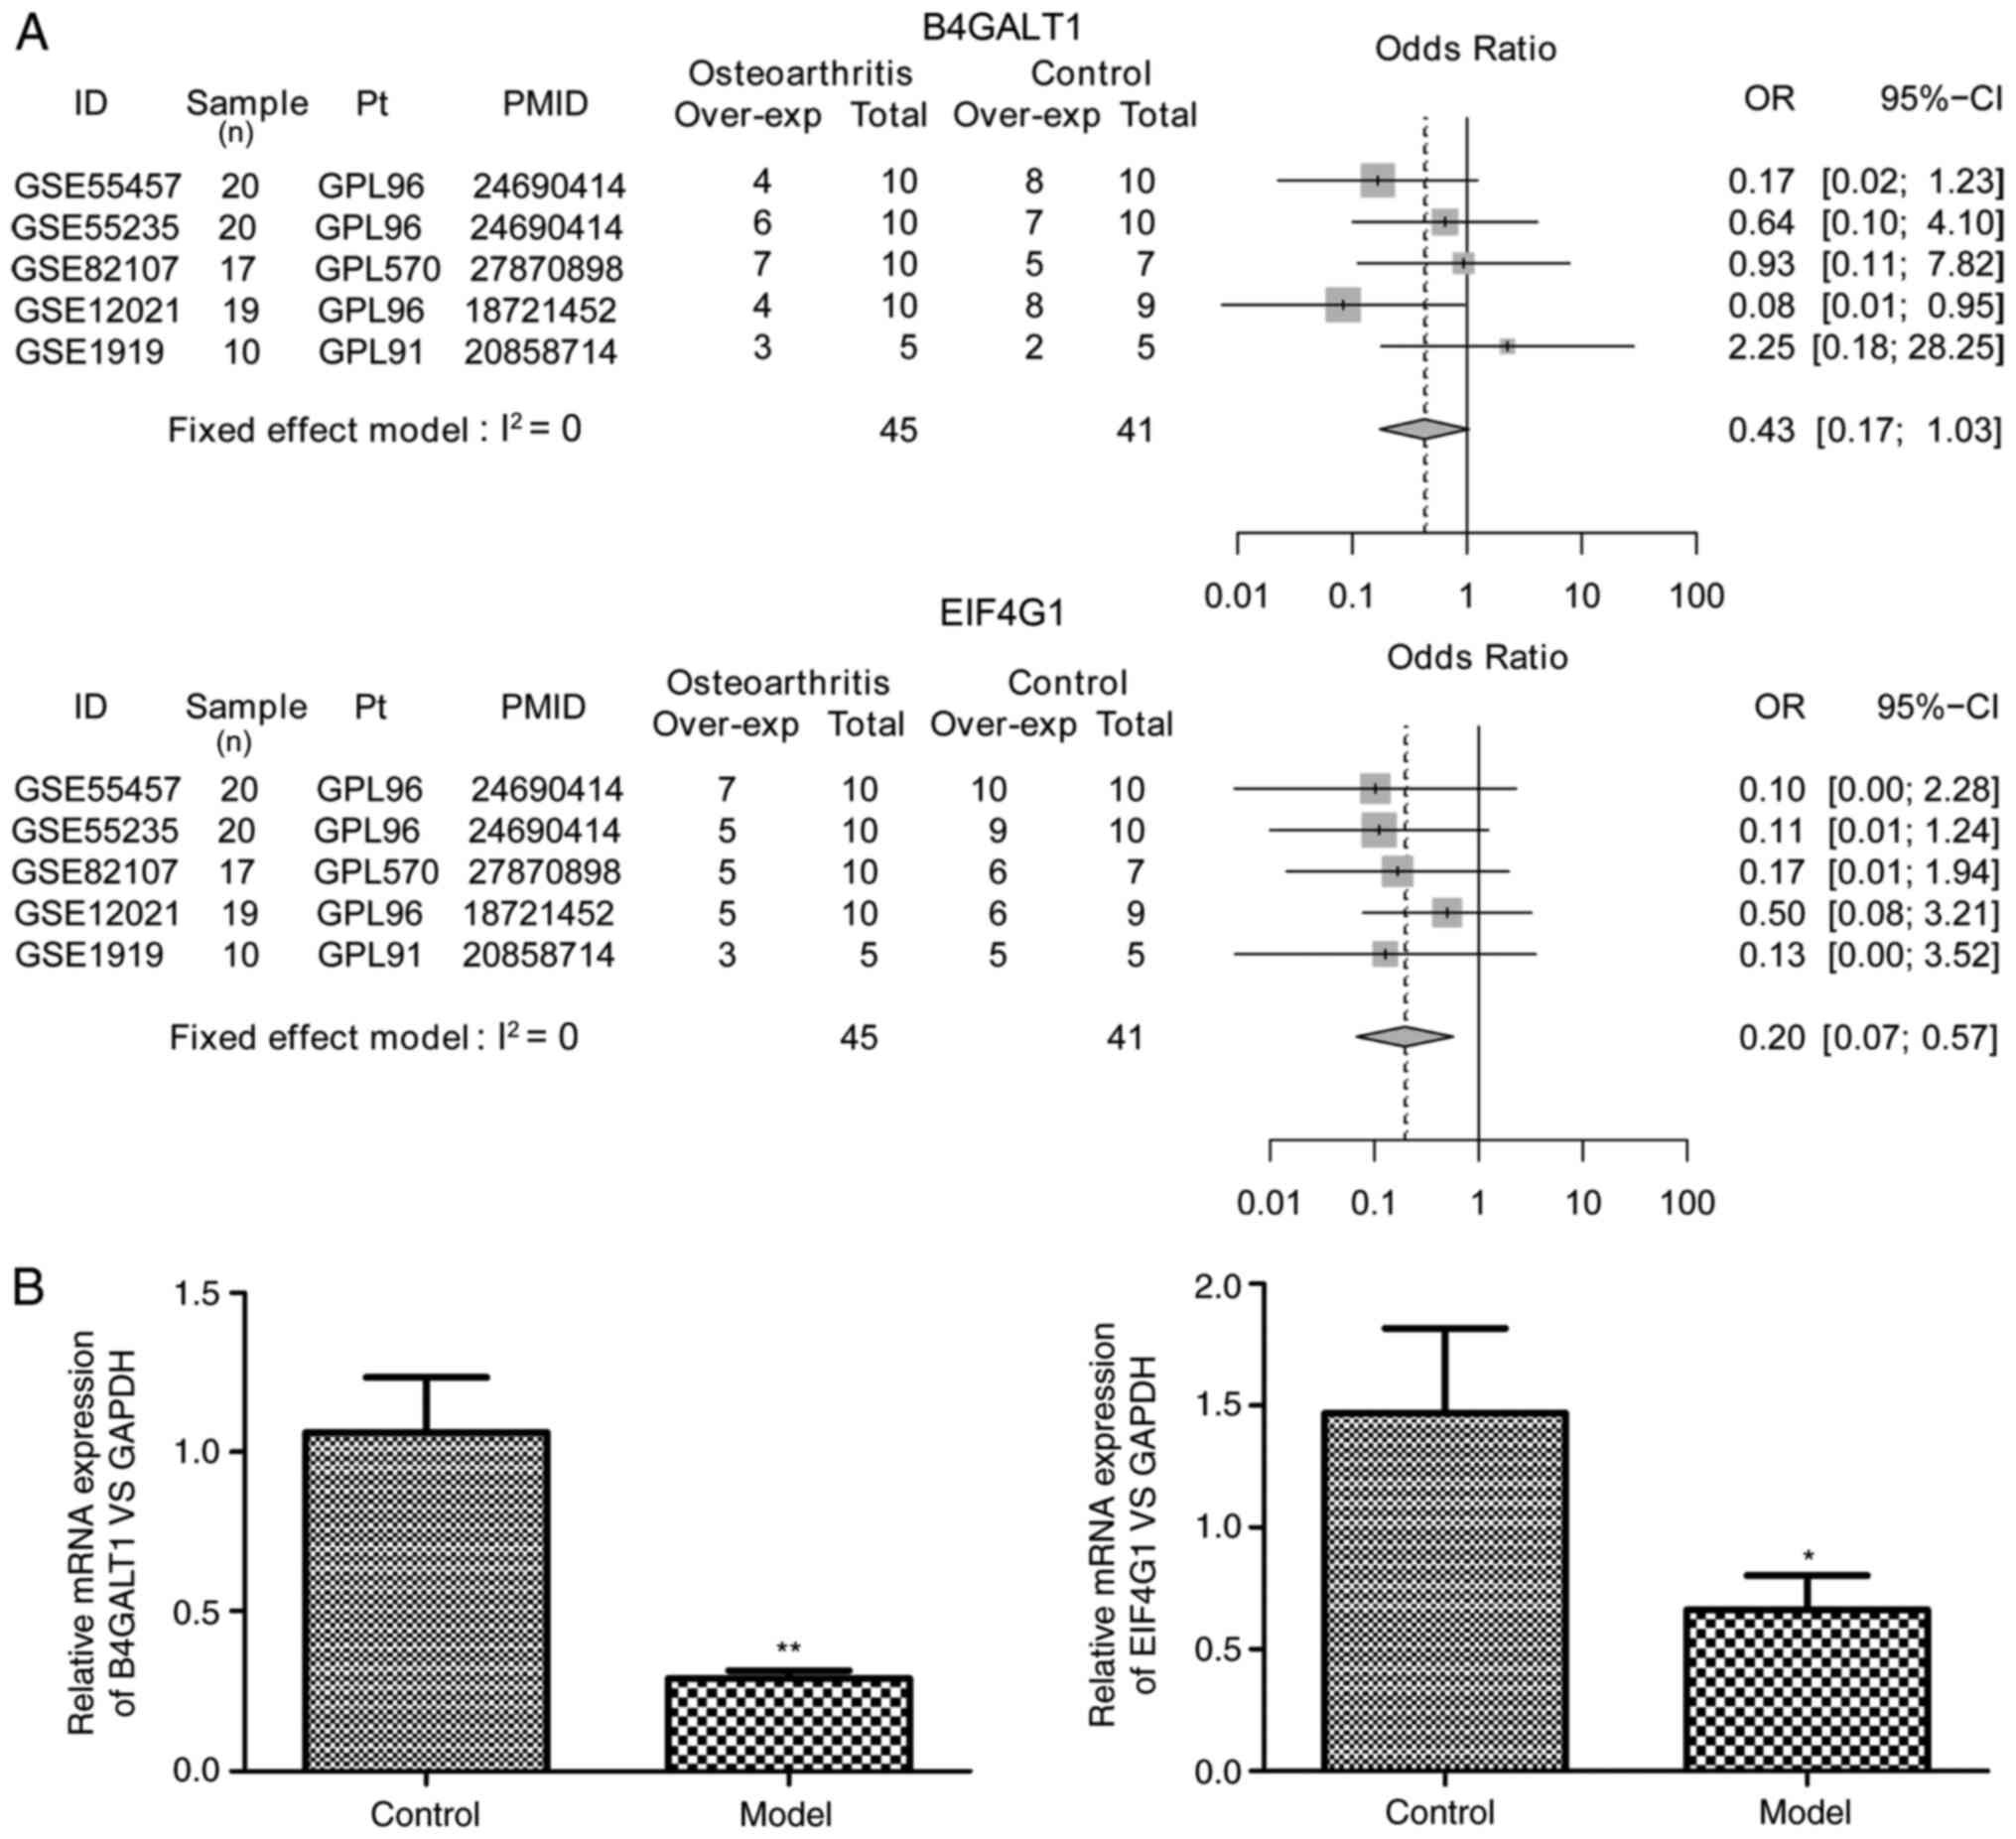
terminal N-glycosylation. In addition, the forest plots of the
expression levels of the key genes in OA and control samples
indicated that EIF4G1 was significantly downregulated in OA samples
[odds ratio (OR)=0.20; 95% confidence interval (CI): 0.07-0.57;
Fig. 5A]. However, B4GALT1
expression was not significantly different between OA and control
samples (OR=0.43; 95% CI, 0.17-1.03; Fig. 5A). Furthermore, rat tissues from the
model group exhibited a success rate of 76.7% (23/30). RT-qPCR
analysis of the synovial tissues of rat model of OA confirmed that
the expression levels of B4GALT1 (P=0.0002) and EIF4G1 (P=0.0495)
were significantly decreased in OA vs. control tissues (Fig. 5B).
| Table IVTop 3 PCs (%) in the five datasets
according to PCA. |
Table IV
Top 3 PCs (%) in the five datasets
according to PCA.
| Dataset | PC1 | PC2 | PC3 |
|---|
| GSE55457 | 39.93 | 21.72 | 21.43 |
| GSE55235 | 37.99 | 30.49 | 18.36 |
| GSE82107 | 31.17 | 28.48 | 26.14 |
| GSE12021 | 30.76 | 28.14 | 21.54 |
| GSE1919 | 37.33 | 22.08 | 20.67 |
| Table VGO terms in the category biological
process and KEGG pathways enriched by the 47 key genes in
osteoarthritis. |
Table V
GO terms in the category biological
process and KEGG pathways enriched by the 47 key genes in
osteoarthritis.
| A, GO terms |
|---|
| Term | Count | P-value | Genes |
|---|
| GO:0051094-positive
regulation of developmental process | 6 | 0.00179 | B4GALT1, ACVR2B,
CD86, BTC, AP3D1, ADAM9 |
| GO:0006494-protein
amino acid terminal glycosylation | 2 | 0.00635 | B4GALT1, DDOST |
| GO:0006496-protein
amino acid terminal N-glycosylation | 2 | 0.00635 | B4GALT1, DDOST |
|
GO:0030855-epithelial cell
differentiation | 4 | 0.00933 | B4GALT1, EZR, FZD1,
ADAM9 |
|
GO:0016337-cell-cell adhesion | 5 | 0.01121 | EZR, COL13A1, CD58,
DSC2, ADAM9 |
| GO:0007155-cell
adhesion | 7 | 0.02238 | B4GALT1, EZR,
COL13A1, CD58, DSC2, ECM2, ADAM9 |
|
GO:0022610-biological adhesion | 7 | 0.02252 | B4GALT1, EZR,
COL13A1, CD58, DSC2, ECM2, ADAM9 |
|
GO:0009100-glycoprotein metabolic
process | 4 | 0.02614 | B4GALT1, AGA, EXT1,
DDOST |
|
GO:0007160-cell-matrix adhesion | 3 | 0.03246 | COL13A1, ECM2,
ADAM9 |
|
GO:0060429-epithelium development | 4 | 0.03519 | B4GALT1, EZR, FZD1,
ADAM9 |
| GO:0045597-positive
regulation of cell differentiation | 4 | 0.03597 | ACVR2B, CD86, BTC,
AP3D1 |
|
GO:0031589-cell-substrate adhesion | 3 | 0.03870 | COL13A1, ECM2,
ADAM9 |
|
GO:0045321-leukocyte activation | 4 | 0.04130 | CD86, DOCK2, DDOST,
ADAM9 |
| B, KEGG
pathways |
| Pathway ID | Count | P-value | Genes |
| hsa04142:
Lysosome | 6 | 0.00038 | AGA, CTSK, AP1S2,
CTSO, GALC, AP3D1 |
| hsa05323:
Rheumatoid arthritis | 2 | 0.04196 | CD86, CTSK |
Discussion
In the present study, a total of 1,007 DEGs were
identified between OA and control samples in five gene expression
datasets using a bioinformatics analysis. Subsequently, a PPI
network with a scale-free small world topology was constructed from
these DEGs, including 241 nodes and 576 interactive associations.
Of the nodes in the PPI, 171 were upregulated DEGs (e.g., CDK1,
AGA, CD58 and CD86) and 70 were downregulated DEGs (e.g., ACACB and
DPYD). After a PCA analysis, 47 key genes were identified,
including B4GALT1 and EIF4G1, which were confirmed to be
significantly downregulated via RT-qPCR analysis of synovial
tissues of OA model rats. However, only EIF4G1 expression was
determined to be significantly downregulated in OA samples by a
meta-analysis of the 5 datasets. In addition, B4GALT1 was mainly
enriched in GO terms including positive regulation of developmental
processes, protein amino acid terminal glycosylation and protein
amino acid terminal N-glycosylation.
B4GALT1 is a member of the family of B4GALT genes
and is unique among them, as it encodes an enzyme that participates
in glycoconjugate and lactose biosynthesis by transferring uridine
diphosphate-bound galactose to terminal N-acetylglucosamines in
carbohydrate chains (34,35). Numerous studies have confirmed that
B4GALT1 has a key role in inflammatory processes associated with
numerous diseases, including OA and rheumatic arthritis (RA). A
previous study indicated that the expression of B4GALT1 was induced
in the cartilage and synovial tissue of OA patients when compared
with healthy controls and may be an important a key inflammatory
mediator in OA (36). By contrast,
the expression of B4GALT1 was identified to be downregulated in OA
samples in the present study. However, another recent study
identified that phosphocitrate inhibited OA in Hartley guinea pigs
through upregulating certain genes of the transforming growth
factor-β receptor signaling pathway, including B4GALT1, and
downregulating other genes associated with proliferation and
apoptosis (37). This indicates
that the expression of B4GALT1 may be reduced in OA, and that its
direct or indirect upregulation may represent a therapeutic
strategy for OA. In addition, B4GALT1 was mainly enriched in
biological processes including positive regulation of developmental
processes, protein amino acid terminal glycosylation and protein
amino acid terminal N-glycosylation. This is due to B4GALT1, a type
II membrane protein, having a hydrophobic N-terminal region, which
is able to direct the protein to the Golgi apparatus. Overall,
B4GALT1 may be considered a key candidate gene associated with the
development of OA.
EIF4G1 is a component of the multi-subunit protein
complex EIF4F and limits the initiation phase of protein synthesis
by stimulating cap-dependent translation (38). In a previous study, citrullinated
EIF4G1 was identified as a novel auto-antigen in the pathogenesis
of RA (39). As a paralog of
EIF4G1, EIF4G2 is a key mediator of translation initiation and
closely linked to mitosis and apoptosis (40). EIF4G2 was reported to be
downregulated in OA cartilage and negatively correlated with
microRNA-139, which inhibits chondrocyte proliferation and
migration (41). It is therefore
indicated that EIF4G1 may have an important role in OA. Of note, a
recent study further confirmed that EIF4G1 was markedly changed in
synovial membrane tissue affected by OA (42). Similarly, in the present study,
EIF4G1 was identified as a key feature gene of OA and to be
downregulated in OA samples compared with healthy controls.
Although B4GALT1 and EIF4G1 were verified to be
downregulated by RT-qPCR in OA samples compared with healthy
controls, the present study had certain limitations. However, the
expression of B4GALT1 did not differ significantly between the OA
and control samples as determined via the meta-analysis of five
datasets. Of these, only dataset GSE1919 exhibited a different
trend from the others, which was inconsistent with the result of
RT-qPCR. This may be attributed to the small sample size of this
dataset, resulting in significant data errors and large data
fluctuations. Furthermore, RT-qPCR verification was only conducted
using model rat samples, without OA patient samples. In the future,
the synovial membrane samples from OA patients should be analyzed
to verify the expression of these key genes. In addition, only the
expression of two genes was verified using RT-qPCR, and thus, more
key genes should be verified using RT-qPCR and western blot
analyses. Furthermore, the interaction of these genes and their
relevant biological functions and pathways will be explored in
further studies.
In conclusion, the present study indicated that
B4GALT1 and EIF4G1 were downregulated in synovial tissues affected
by OA compared with those in healthy controls. B4GALT1 may be
involved in the biological processes of OA, including positive
regulation of developmental process, protein amino acid terminal
glycosylation and protein amino acid terminal N-glycosylation.
These results may enhance the current understanding of the
mechanisms underlying OA and provide novel targets for its
treatment.
Acknowledgements
Not applicable.
Funding
No funding was received.
Availability of data and materials
The datasets used and/or analyzed during the current
study are available from the corresponding author on reasonable
request.
Authors' contributions
XS, HD and JM designed the study. LX and SY acquired
the data. XS and HD performed the animal experiments. QH, XC and WZ
analyzed the data. XS drafted the manuscript. JM revised the
manuscript for important intellectual content. All authors read and
approved the final manuscript.
Ethics approval and consent to
participate
The present study was performed with the ethical
approval of Honghui Hospital Affiliated to College of Medicine
Xi'an Jiaotong University (Xi'an, China).
Patient consent for publication
Not applicable.
Competing interests
The authors declare that they have no competing
interests.
References
|
1
|
Loeser RF, Goldring SR, Scanzello CR and
Goldring MB: Osteoarthritis: A disease of the joint as an organ.
Arthritis Rheum. 64:1697–1707. 2012.PubMed/NCBI View Article : Google Scholar
|
|
2
|
Sagar DR, Ashraf S, Xu L, Burston JJ,
Menhinick MR, Poulter CL, Bennett AJ, Walsh DA and Chapman V:
Osteoprotegerin reduces the development of pain behaviour and joint
pathology in a model of osteoarthritis. Ann Rheum Dis.
73:1558–1565. 2014.PubMed/NCBI View Article : Google Scholar
|
|
3
|
Glynjones S, Palmer AJ, Agricola R, Price
AJ, Vincent TL, Weinans H and Carr AJ: Osteoarthritis. Lancet.
386:376–387. 2015.PubMed/NCBI View Article : Google Scholar
|
|
4
|
Vos T, Allen C, Arora M, Barber RM, Bhutta
ZA, Brown A, Carter A, Casey DC, Charlson FJ, Chen AZ and
Coggeshall M: Global, regional, and national incidence, prevalence,
and years lived with disability for 310 diseases and injuries,
1990-2015: A systematic analysis for the global burden of disease
study 2015. Lancet. 388:1545–1602. 2016.PubMed/NCBI View Article : Google Scholar
|
|
5
|
Hashimoto S, Ochs RL, Komiya S and Lotz M:
Linkage of chondrocyte apoptosis and cartilage degradation in human
osteoarthritis. Arthritis Rheum. 41:1632–1638. 1998.PubMed/NCBI View Article : Google Scholar
|
|
6
|
Kaneko S, Satoh T, Chiba J, Ju C, Inoue K
and Kagawa J: Interleukin-6 and interleukin-8 levels in serum and
synovial fluid of patients with osteoarthritis. Cytokines Cell Mol
Ther. 6:71–79. 2000.PubMed/NCBI View Article : Google Scholar
|
|
7
|
Roach HI, Yamada N, Cheung KS, Tilley S,
Clarke NM, Oreffo RO, Kokubun S and Bronner F: Association between
the abnormal expression of matrix-degrading enzymes by human
osteoarthritic chondrocytes and demethylation of specific CpG sites
in the promoter regions. Arthritis Rheum. 52:3110–3124.
2005.PubMed/NCBI View Article : Google Scholar
|
|
8
|
O'neill TW, Parkes MJ, Maricar N,
Marjanovic EJ, Hodgson R, Gait AD, Cootes TF, Hutchinson CE and
Felson DT: Synovial tissue volume: A treatment target in knee
osteoarthritis (OA). Ann Rheum Dis. 75:84–90. 2016.PubMed/NCBI View Article : Google Scholar
|
|
9
|
Hackinger S, Trajanoska K, Styrkarsdottir
U, Zengini E, Steinberg J, Ritchie GRS, Hatzikotoulas K, Gilly A,
Evangelou E, Kemp JP, et al: Evaluation of shared genetic aetiology
between osteoarthritis and bone mineral density identifies SMAD3 as
a novel osteoarthritis risk locus. Hum Mol Genet. 26:3850–3858.
2017.PubMed/NCBI View Article : Google Scholar
|
|
10
|
Koike M, Nojiri H, Ozawa Y, Watanabe K,
Muramatsu Y, Kaneko H, Morikawa D, Kobayashi K, Saita Y, Sasho T,
et al: Mechanical overloading causes mitochondrial superoxide and
SOD2 imbalance in chondrocytes resulting in cartilage degeneration.
Sci Rep. 5(11722)2015.PubMed/NCBI View Article : Google Scholar
|
|
11
|
Muñoz-Valle JF, Oregón-Romero E,
Rangel-Villalobos H, Martínez-Bonilla GE, Castañeda-Saucedo E,
Salgado-Goytia L, Leyva-Vázquez MA, Illades-Aguiar B,
Alarcón-Romero Ldel C, Espinoza-Rojo M and Parra-Rojas I: High
expression of TNF alpha is associated with- 308 and- 238 TNF alpha
polymorphisms in knee osteoarthritis. Clin Exp Med. 14:61–67.
2014.PubMed/NCBI View Article : Google Scholar
|
|
12
|
Jiang Y, Hu C, Yu S, Yan J, Peng H, Ouyang
HW and Tuan RS: Cartilage stem/progenitor cells are activated in
osteoarthritis via interleukin-1β/nerve growth factor signaling.
Arthritis Res Ther. 17(327)2015.PubMed/NCBI View Article : Google Scholar
|
|
13
|
Vuolteenaho K, Koskinen-Kolasa A, Laavola
M, Nieminen R, Moilanen T and Moilanen E: High synovial fluid
interleukin-6 levels are associated with increased matrix
metalloproteinase levels and severe radiographic changes in
osteoarthritis patients. Osteoarthritis Cartilage. 25 (Suppl
1):S92–S93. 2017.
|
|
14
|
Guns LA, Kvasnytsia M, Kerckhofs G,
Vandooren J, Martens E, Opdenakker G, Lories RJ and Cailotto F:
Suramin protects against osteoarthritis by increasing tissue
inhibitor of matrix metalloproteinase-3 and glycosaminoglycans in
the articular cartilage. Osteoarthritis Cartilage. 25:S145–S146.
2017.
|
|
15
|
van Helvoort EM, Popov-Celeketic J,
Coeleveld K, Tryfonidou MA, Lafeber FP and Mastbergen SC: Effects
of the human IL4-10 fusion protein in the canine groove model of
osteoarthritis. Osteoarthritis Cartilage. 25(S434)2017.
|
|
16
|
Ratnayake M, Plöger F, Santibanez-Koref M
and Loughlin J: Human chondrocytes respond discordantly to the
protein encoded by the osteoarthritis susceptibility gene GDF5.
PLoS One. 9(e86590)2014.PubMed/NCBI View Article : Google Scholar
|
|
17
|
Nepple JJ, Thomason KM, An TW,
Harris-Hayes M and Clohisy JC: What is the utility of biomarkers
for assessing the pathophysiology of hip osteoarthritis? A
systematic review. Clin Orthop Relat Res. 473:1683–1701.
2015.PubMed/NCBI View Article : Google Scholar
|
|
18
|
Sliz E, Taipale M, Welling M, Skarp S,
Alaraudanjoki V, Ignatius J, Ruddock L, Nissi R and Männikkö M:
TUFT1, a novel candidate gene for metatarsophalangeal
osteoarthritis, plays a role in chondrogenesis on a calcium-related
pathway. PLoS One. 12(e0175474)2017.PubMed/NCBI View Article : Google Scholar
|
|
19
|
Carvalho BS and Irizarry RA: A framework
for oligonucleotide microarray preprocessing. Bioinformatics.
26:2363–2367. 2010.PubMed/NCBI View Article : Google Scholar
|
|
20
|
Troyanskaya O, Cantor M, Sherlock G, Brown
P, Hastie T, Tibshirani R, Botstein D and Altman RB: Missing value
estimation methods for DNA microarrays. Bioinformatics. 17:520–525.
2001.PubMed/NCBI View Article : Google Scholar
|
|
21
|
Rao Y, Lee Y, Jarjoura D, Ruppert AS, Liu
CG, Hsu JC and Hagan JP: A comparison of normalization techniques
for microRNA microarray data. Stat Appl Genet Mol Biol.
7(Article22)2008.PubMed/NCBI View Article : Google Scholar
|
|
22
|
Kang DD, Sibille E, Kaminski N and Tseng
GC: MetaQC: Objective quality control and inclusion/exclusion
criteria for genomic meta-analysis. Nucleic Acids Res.
40(e15)2011.PubMed/NCBI View Article : Google Scholar
|
|
23
|
Demšar U, Harris P, Brunsdon C,
Fotheringham AS and McLoone S: Principal component analysis on
spatial data: An overview. Ann Assoc Am Geogr. 103:106–128.
2013.
|
|
24
|
Wang X, Kang DD, Shen K, Song C, Lu S,
Chang LC, Liao SG, Huo Z, Tang S, Ding Y, et al: An R package suite
for microarray meta-analysis in quality control, differentially
expressed gene analysis and pathway enrichment detection.
Bioinformatics. 28:2534–2536. 2012.PubMed/NCBI View Article : Google Scholar
|
|
25
|
Szklarczyk D, Franceschini A, Wyder S,
Forslund K, Heller D, Huerta-Cepas J, Simonovic M, Roth A, Santos
A, Tsafou KP, et al: STRING v10: Protein-protein interaction
networks, integrated over the tree of life. Nucleic Acids Res. 43
(Database Issue):D447–D452. 2015.PubMed/NCBI View Article : Google Scholar
|
|
26
|
Jeong H, Mason SP, Barabási AL and Oltvai
ZN: Lethality and centrality in protein networks. Nature.
411:41–42. 2001.PubMed/NCBI View
Article : Google Scholar
|
|
27
|
Alizadeh E, Lyons S, Castle J and Prasad
A: Measuring systematic changes in invasive cancer cell shape using
Zernike moments. Integr Biol (Camb). 8:1183–1193. 2016.PubMed/NCBI View Article : Google Scholar
|
|
28
|
Huang da W, Sherman BT and Lempicki RA:
Systematic and integrative analysis of large gene lists using DAVID
bioinformatics resources. Nat Protoc. 4:44–57. 2009.PubMed/NCBI View Article : Google Scholar
|
|
29
|
Huang da W, Sherman BT and Lempicki RA:
Bioinformatics enrichment tools: Paths toward the comprehensive
functional analysis of large gene lists. Nucleic Acids Res.
37:1–13. 2009.PubMed/NCBI View Article : Google Scholar
|
|
30
|
Hayami T, Pickarski M, Zhuo Y, Wesolowski
GA, Rodan GA and Duong LT: Characterization of articular cartilage
and subchondral bone changes in the rat anterior cruciate ligament
transection and meniscectomized models of osteoarthritis. Bone.
38:234–243. 2006.PubMed/NCBI View Article : Google Scholar
|
|
31
|
Livak KJ and Schmittgen TD: Analysis of
relative gene expression data using real-time quantitative PCR and
the 2(-Delta Delta C(T)) method. Methods. 25:402–408.
2001.PubMed/NCBI View Article : Google Scholar
|
|
32
|
Réka A: Scale-free networks in cell
biology. J Cell Sci. 118:4947–4957. 2005.PubMed/NCBI View Article : Google Scholar
|
|
33
|
Lei X, Wu FX, Tian J and Zhao J: ABC and
IFC: Modules detection method for PPI network. Biomed Res Int.
2014(968173)2014.PubMed/NCBI View Article : Google Scholar
|
|
34
|
Qasba PK, Ramakrishnan B and Boeggeman E:
Structure and function of beta-1,4-galactosyltransferase. Curr Drug
Targets. 9:292–309. 2008.PubMed/NCBI View Article : Google Scholar
|
|
35
|
Al-Obaide MA, Alobydi H, Abdelsalam AG,
Zhang R and Srivenugopal KS: Multifaceted roles of 5'-regulatory
region of the cancer associated gene B4GALT1 and its comparison
with the gene family. Int J Oncoly. 47:1393–1404. 2015.PubMed/NCBI View Article : Google Scholar
|
|
36
|
Liu W, Cui Z, Wang Y, Zhu X, Fan J, Bao G,
Qiu J and Xu D: Elevated expression of β1,4-galactosyltransferase-I
in cartilage and synovial tissue of patients with osteoarthritis.
Inflammation. 35:647–655. 2012.
|
|
37
|
Sun Y, Franklin AM, Mauerhan DR and Hanley
EN: biological effects of phosphocitrate on osteoarthritic
articular chondrocytes. Open Rheumatol J. 11:62–74. 2017.PubMed/NCBI View Article : Google Scholar
|
|
38
|
Park EH, Walker SE, Lee JM, Rothenburg S,
Lorsch JR and Hinnebusch AG: Multiple elements in the eIF4G1
N-terminus promote assembly of eIF4G1•PABP mRNPs in vivo. EMBO J.
30:302–316. 2011.PubMed/NCBI View Article : Google Scholar
|
|
39
|
Okazaki Y, Suzuki A, Sawada T,
Ohtake-Yamanaka M, Inoue T, Hasebe T, Yamada R and Yamamoto K:
Identification of citrullinated eukaryotic translation initiation
factor 4G1 as novel autoantigen in rheumatoid arthritis. Biochem
Biophys Res Commun. 341:94–100. 2006.PubMed/NCBI View Article : Google Scholar
|
|
40
|
Coldwell MJ, Cowan JL, Vlasak M, Mead A,
Willett M, Perry LS and Morley SJ: Phosphorylation of eIF4GII and
4E-BP1 in response to nocodazole treatment: A reappraisal of
translation initiation during mitosis. Cell Cycle. 12:3615–3628.
2013.PubMed/NCBI View
Article : Google Scholar
|
|
41
|
Hu W, Zhang W, Li F, Guo F and Chen A:
miR-139 is up-regulated in osteoarthritis and inhibits chondrocyte
proliferation and migration possibly via suppressing EIF4G2 and
IGF1R. Biochem Biophys Res Commun. 474:296–302. 2016.PubMed/NCBI View Article : Google Scholar
|
|
42
|
Zhang X, Yuan Z and Cui S: Identifying
candidate genes involved in osteoarthritis through bioinformatics
analysis. Clin Exp Rheumatol. 34:282–290. 2016.PubMed/NCBI
|