Introduction
Benign airway stenosis may be congenital or
acquired, and the causes of acquired airway stenosis include
trauma, surgery, tracheobronchial TB, tracheal intubation,
tracheotomy, stent insertion and inhalation injury. Airway injury
results in edema and erythema of the mucosal layer, which persists
as long as the pathogenic factors are present. As a consequence,
the ring cartilage is exposed and inflamed, collagen and scar
tissue are produced and the ring contracts, resulting in the
formation of a hard stenosis covered with epithelial cells
(1). Tracheobronchial TB refers to
Mycobacterium tuberculosis infection of the mucosa,
submucosa, smooth muscle, cartilage and the outer membrane of
trachea and bronchus (2). With an
increasingly mobile population and the continuing human
immunodeficiency virus acquired immunodeficiency syndrome pandemic,
the numbers of patients with TB are gradually increasing and the
incidence of tracheobronchial TB in patients with active TB ranged
from 6.4 to 40% in Iran, 2014(3).
Of all patients with tracheobronchial TB in India (2014), >90%
suffered from airway stenosis to varying degrees (4). A previous study demonstrated that an
age of >45 years, fibrostenotic subtype and anti-TB chemotherapy
are independent clinical predictors of persistent airway stenosis
(5). However, only a small number
of clinical biomarkers have been identified for the diagnosis of
tracheobronchial stenosis (TBS) after tracheobronchial TB.
Currently, TBS is confirmed by clinical manifestations, chest CT
(6) and bronchoscopy (7); however, there is a lack of rapid and
effective laboratory indicators. As it is difficult to
differentiate TBS after TB from other lung diseases, including TBS
after tracheal intubation or tracheotomy (TIT), the condition is
frequently diagnosed at a late stage and numerous patients have
missed the optimal time window for treatment (8). With early diagnosis, clinicians are
able to provide appropriate and timely therapy, preventing the
development of airway stenosis and improving the patients'
prognosis (9).
Proteomics generally refers to large-scale studies
of all of the proteins in cells, tissues or organisms, or in
specialized samples, including body fluids (10). Proteomics consists of overall
protein profiling, including expression levels, structure,
interactions and modifications after translation; therefore, it
represents a noninvasive method to diagnose various diseases
(11). In the last few decades,
proteomics has provided extensive data and insight into the
pathophysiological mechanisms of numerous human diseases, including
carcinoma, infection and coronary heart disease, as well as the
identification of novel biomarkers and therapeutic targets for
clinical diagnostics and treatments (12). Proteomics primarily involves
two-dimensional gel electrophoresis, western blotting,
immunoprecipitation and mass spectrometry (MS) (13).
MS is used to identify chemical compounds by
ionizing them into charged molecules and separating the ions by
their mass-to-charge ratio (m/z) (14). Since the introduction of the
application of matrix-assisted laser desorption/ionization (MALDI)
in the 1990s, MS has been widely used to profile large biological
molecules (15). Large biological
molecules, including DNA, proteins and sugars, are ionized by
gaining or losing a proton without affecting the characteristics of
the sample. The sample to be detected is dispersed into matrix
material located on a metal plate and the sample and the matrix are
irradiated by a pulsed laser and vaporized. The target molecules
are then ionized and ready for acceleration by MS. Time-of-flight
(TOF) MS examines the time it takes for ions to cover fixed
distances with velocities determined by their m/z (16). In theory, ions with small m/z values
or with more charges will reach the detector earlier; thus, an m/z
value is determined by the time of flight and the molecule is
identified accordingly. Considering MALDI-TOF MS has
high-throughput capability and can be completely automated, it is
ideal for proteomics research (17,18).
Proteomic changes in airway stenosis evoked by
tracheobronchial TB have remained largely undefined. The aim of the
present study was to compare protein expression profiles in the
sera and bronchoalveolar lavage fluids (BALFs) to clarify the
pathogenesis of TBS after tracheobronchial TB.
Patients and methods
Patients
A total of 91 patients with TBS after TB, TBS after
TIT and early-stage lung cancer (ESLC) were enrolled at the
Department of Respiratory Diseases, Beijing Tian Tan Hospital,
Capital Medical University (Beijing, China) from January 2014 to
October 2018. Patients enrolled between January 2014 to October
2015 were subjected to MS analysis and patients enrolled between
November 2015 to October 2018 to ELISA. Patients with TBS after TB,
TBS after TIT and ESLC had been confirmed by chest CT scan and
clinical testing, including reverse-transcription PCR assay for TB
and tumor markers of CEA, CA15-3, CA19-9, CA125, neuron-specific
enolase and cytokeratin fraction 21-1. All of the patients provided
written informed consent to participate in the present study and
for use of their medical data according to the provisions of the
Declaration of Helsinki. The protocol of the present study was
approved by the Institutional Ethics Committee of Beijing Tian Tan
Hospital. The serum and BALF samples from 31 patients were
subjected to MALDI-TOF MS and their characteristics are presented
in Table SI. The serum samples
from the other 60 patients (20 with TB, 20 with TIT and 20 with
ESLC) were used for validation with ELISAs (Table SII). There were no significant
differences in age and sex between groups.
Sample collection
Serum samples were collected, processed and stored
in according to a technique similar to a standard protocol
(19). Blood samples were obtained
from fasted patients in the morning (collected in vacuum tubes
without preservatives or anticoagulant) and allowed to clot or to
sediment at room temperature (~25˚C) for 2 h to isolate the serum.
Serum samples were then separated by centrifugation at 3,000 x g at
23˚C for 15 min. Samples were immediately divided into aliquots of
50 µl and stored at -80˚C until further analysis. The
cryopreservation period for serum samples was <24 months.
BALF samples were collected and processed according
to a standard protocol (19).
Samples were separated by centrifugation at 4,000 x g for 15 min at
4˚C. Supernatants were aliquoted into four 1 ml tubes and the
precipitate was added into one 1ml tube. The samples were stored at
-80˚C until use. The cryopreservation period for BALF samples was
<24 months.
Weak cation exchange magnetic bead
(MB-WCX) fractionation and MALDI-TOF MS analysis
All of the samples were fractionated using MB-WCX
(Bruker Corporation), according to the manufacturer's protocol. The
suspension was prepared with a magnetic bead-weak cation exchange
MB-WCX kit (Bruker Corporation) and mixed by shaking. Following
eluting and shocking, the magnetic beads were separated from the
protein and the eluted peptide samples were transferred to a clean
0.5 ml tube for further MS analysis. A total of 5 µl of
hydroxy-cyanocinnamic acid substrate solution (0.4 g/l;
MilliporeSigma; dissolved in acetone and ethanol) and 0.8-1.2 µl of
eluate were mixed. Subsequently, 0.8-1.2 µl of the mixture was
applied to a metal target plate and dried at room temperature.
Finally, air-dried target plates were measured immediately using a
calibrated Autoflex III MALDI-TOF MS (Bruker Corporation) with
Flex-Control software (version 3.0; Bruker Corporation), according
to optimized measuring protocols (20). Peptides with molecular weights
ranging from 1,000 to 10,000 kDa were collected with a laser
intensity of 5,000 W/nm2. Peptide mass fingerprints were
obtained by combining 50 individual MS signal scans. ClinProTools
software (version 2.2; Bruker Corporation) was used to subtract the
baseline, normalize spectra (using the total ion current) and
determine peak m/z values and intensities in the mass range of
1,000-10,000 kDa. A signal-to-noise (S/N) ratio of >5 was
selected to guarantee for clear acquisitions. An S/N of >3 was
used for limit of detection and an S/N of >5 was used for
quantification. Spectra were aligned with a mass shift of ≤0.1%.
The peak area was measured for quantification. Based on the
macroscopic results of the multivariate statistical analysis, the
tendency of the relative integrals of each metabolite to change in
the three groups was further analyzed by box-and-whisker plots.
ELISA
ELISA was performed to confirm the changes in the
levels of myeloid-associated differentiation marker (MYADM),
keratin, type I cytoskeletal 18 (KRT18), fibrinogen α-chain (FGA),
angiotensinogen (AGT), apolipoprotein A-I (APOAI) and clusterin
(CLU) in serum from another cohort of patients who were not
subjected to MS analysis. This cohort included 20 patients with TB,
20 with TIT and 20 with ESLC. KRT18 (cat. no. MA1-19041; 1:5,000),
FGA (cat. no. MA1-20038; 1:5,000), AGT (cat. no. MA5-29009;
1:10,000) and APOAI (cat. no. MIA1402; 1:5,000) antibodies were
purchased from Thermo Fisher Scientific, Inc. MYADM (cat. no.
ABIN6059266; 1:5,000) and CLU (cat. no. ABIN6574258; the microtiter
plate provided in this kit was pre-coated with antibodies specific
to CLU, 1:50) antibodies were purchased from Antibodies-Online.
Polystyrene ELISA plates (Nunc Maxisorp; Bioon) were coated with
capture antibodies (1:50) in bicarbonate buffer at 4˚C overnight.
After the coating solution was removed, the plates were washed
three times with 200 µl PBS containing 0.05% Tween-20 (PBST). The
coated wells were then blocked for 1 h with 5% non-fat dry milk in
PBST at room temperature. Equal amounts of samples were added to
each well and the plates were incubated for 1 h at 37˚C. The
samples were then removed and the plates were washed three times
with PBST. Horseradish peroxidase-conjugated antibodies (Thermo
Fisher Scientific, Inc.; cat. nos. 32230 and 65-6120;
dilutions,1:5,000 and 1:3,000, respectively) in bicarbonate buffer
were added and the plates were incubated at 37˚C for 45 min. After
washing with PBST, 3,3',5,5'-Tetramethylbenzidine substrate was
added to each well, followed by incubation at 37˚C for 15 min. The
reaction was stopped by adding 50 µl 1 mol/l
H2SO4. The absorbance was read by an ELISA
reader at 450 nm (with a reference wavelength of 620 nm). All
samples were tested in duplicate.
Statistical analysis
Values are expressed as the mean ± standard
deviation. Multiple comparisons were performed using one-way ANOVA
with Fisher's least-significant differences (LSD) test as the
post-hoc test. P<0.05 was considered to indicate a statistically
significant difference. Genetic algorithm (GA), supervised neural
networks (SNN) and quick classifier (QC) algorithms were applied to
identify differentially expressed peptides distinguishing TBS after
TB or TIT and ESLC.
Results
General information
Serum and BALF proteomic profiles of TBS after TB,
TBS after TIT and ESLC groups were compared. There were no
significant differences in age, BALF return rate, protein abundance
(estimated by the rate of albumin in BALF/serum) between the three
groups (Table SI). There were more
female than male patients in the TB group (Table SI). Fr Fractionation of serum and
BALF samples by MB-WCX and analysis by MALDI-TOF MS was performed
to obtain the proteomic profiles of patients with TB (red),
patients with TIT (green) and patints with ESLC (blue) with
proteins ranging from 1,000 to 10,000 kDa (Fig. 1).
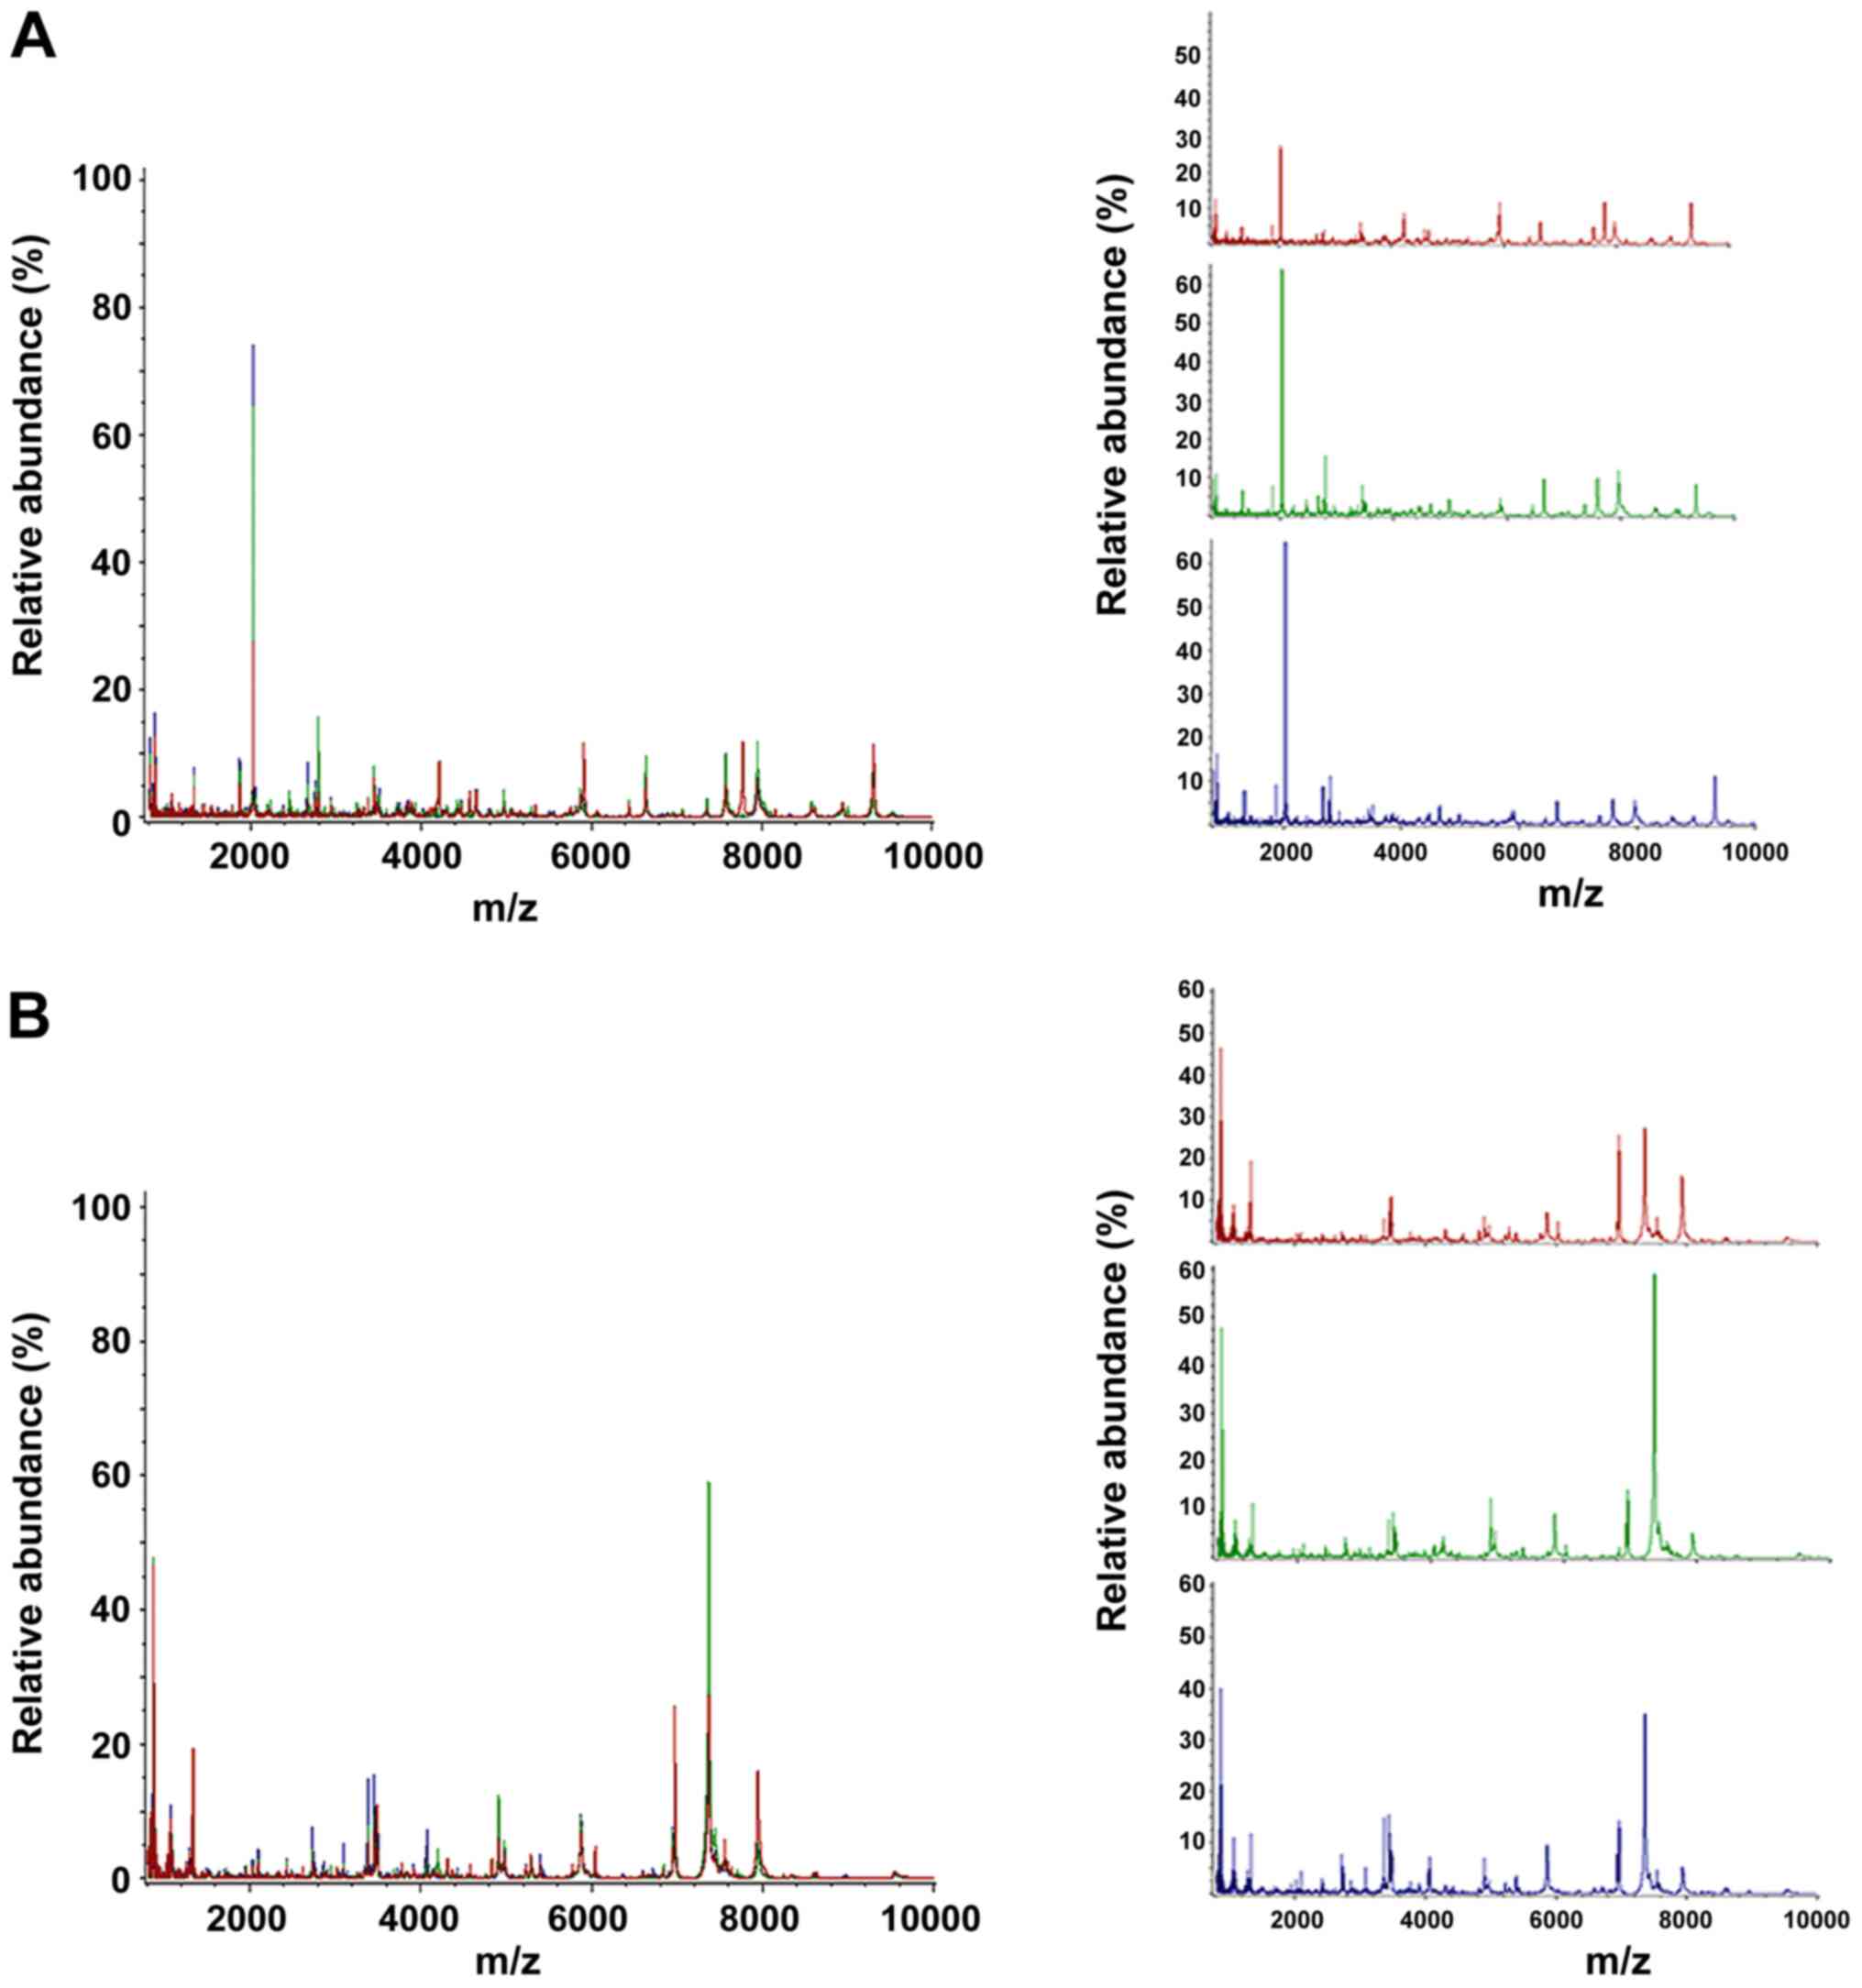 | Figure 1Comparisons of peptide profiles in
serum and BALF. (A) Serum spectra in the mass range of 1,000-10,000
kDa obtained from TB patients (red), TIT patients (green) and ESLC
patients (blue). (B) BALF spectra in the mass range of 1,000-10,000
kDa obtained from TB patients (red), TIT patients (green) and ESLC
patients (blue). BALF, bronchial alveolar lavage fluid; m/z,
mass-to-charge ratio; TBS, tracheobronchial stenosis; TB,
tuberculosis; ESLC, early-stage lung cancer; TIT, tracheal
intubation and tracheotomy. |
Differences in serum and BALF
peptides
Using ClinProTools software to analyze serum
samples, 155 peptide peaks were identified at an S/N threshold of 3
within the mass range analyzed (1,000-10,000 kDa). A fold change of
>1.5 and P<0.05 as determined by one-way ANOVA were set as
the threshold for differentially expressed proteins and Fisher's
LSD test was used to determine differences between pairs of groups.
A total of 5 proteins, including CLU, AGT, FGA and two undefined
peptides (Fisher's LSD 1-2 or 2-1) differed significantly between
the TB and TIT groups and 5 of the peaks differed significantly
between the TB and ESLC groups. Furthermore, one of the peaks
differed significantly between the TIT and ESLC groups (Table IA). In BALF samples, using the same
thresholds as above, 9 peptide peaks were identified. A total of 5
peptides were differentially expressed between the TB and TIT
groups, 7 peptides differed between the TB and ESLC groups and 4
peaks differed significantly between the TIT and ESLC samples
(Table IB).
 | Table IMean levels of differentially
expressed peptides in serum and BALF among the three groups. |
Table I
Mean levels of differentially
expressed peptides in serum and BALF among the three groups.
| A, Serum |
|---|
| Mass (m/z) | P-value | Fisher's
LSDa | TB | TIT | ESLC (mean) |
|---|
| 1,532.24 | 0.011543 | 1-2; 1-3 | 15.63±8.97 | 6.68±2.90 | 8.14±2.98 |
| 6,816.51 | 0.019953 | 2-1 | 5.26±1.95 | 7.75±3.81 | 9.96±3.73 |
| 1,180.93 | 0.022359 | 1-3 | 14.01±8.00 | 6.80±2.90 | 9.47±2.80 |
| 4,185.05 | 0.030628 | 1-2 | 47.16±36.46 | 24.49±3.06 | 7.37±36.78 |
| 2,660.56 | 0.039298 | 2-1 | 30.28±27.30 | 47.49±41.55 | 72.25±26.88 |
| 6,844.58 | 0.040057 | 2-1; 2-3 | 9.85±5.58 | 10.26±9.35 | 15.18±5.65 |
| 4,419.72 | 0.042567 | 3-1 | 35.41±9.43 | 74.00±19.60 | 49.82±53.13 |
| 4,300.83 | 0.048204 | 3-1 | 35.85±15.15 | 58.70±10.47 | 53.15±21.94 |
| B, BALF |
| Mass (m/z) | P-value | Fisher's
LSDa | TB | TIT | ESLC (mean) |
| 6,029.68 | 0.015465 | 1-2; 1-3 | 81.86±51.11 | 47.49±19.69 | 29.78±52.77 |
| 4,200.65 | 0.015667 | 3-1; 3-2 | 11.41±10.66 | 32.95±3.89 | 6.15±31.95 |
| 4,186.06 | 0.019457 | 3-1; 3-2 | 20.21±20.95 | 56.60±7.86 | 10.66±55.13 |
| 6,701.81 | 0.026834 | 2-1; 2-3 | 17.96±11.32 | 11.61±28.48 | 31.22±5.37 |
| 7,929.01 | 0.030448 | 1-2; 1-3 | 607.65±529.57 | 205.62±454.00 | 226.75±214.01 |
| 5,763.15 | 0.032319 | 1-2 | 53.34±35.00 | 37.48±13.74 | 26.71±21.31 |
| 5,278.1 | 0.032377 | 1-2; 1-3 | 101.01±65.43 | 53.93±57.94 | 48.80±37.76 |
| 4,169.49 | 0.040676 | 3-1; 3-2 | 13.57±13.26 | 56.60±5.56 | 10.66±28.43 |
| 4,533.75 | 0.042205 | 1-3 | 11.78±6.37 | 5.76±4.34 | 7.03±3.05 |
Based on the macroscopic results of the multivariate
statistical analysis, the tendency of the relative integrals of
each metabolite to change in the three groups was further analyzed
by box-and-whisker plots. These plots illustrated the progressive
changes in metabolite levels in the TB group or TIT group relative
to the ESLC group (Fig. 2).
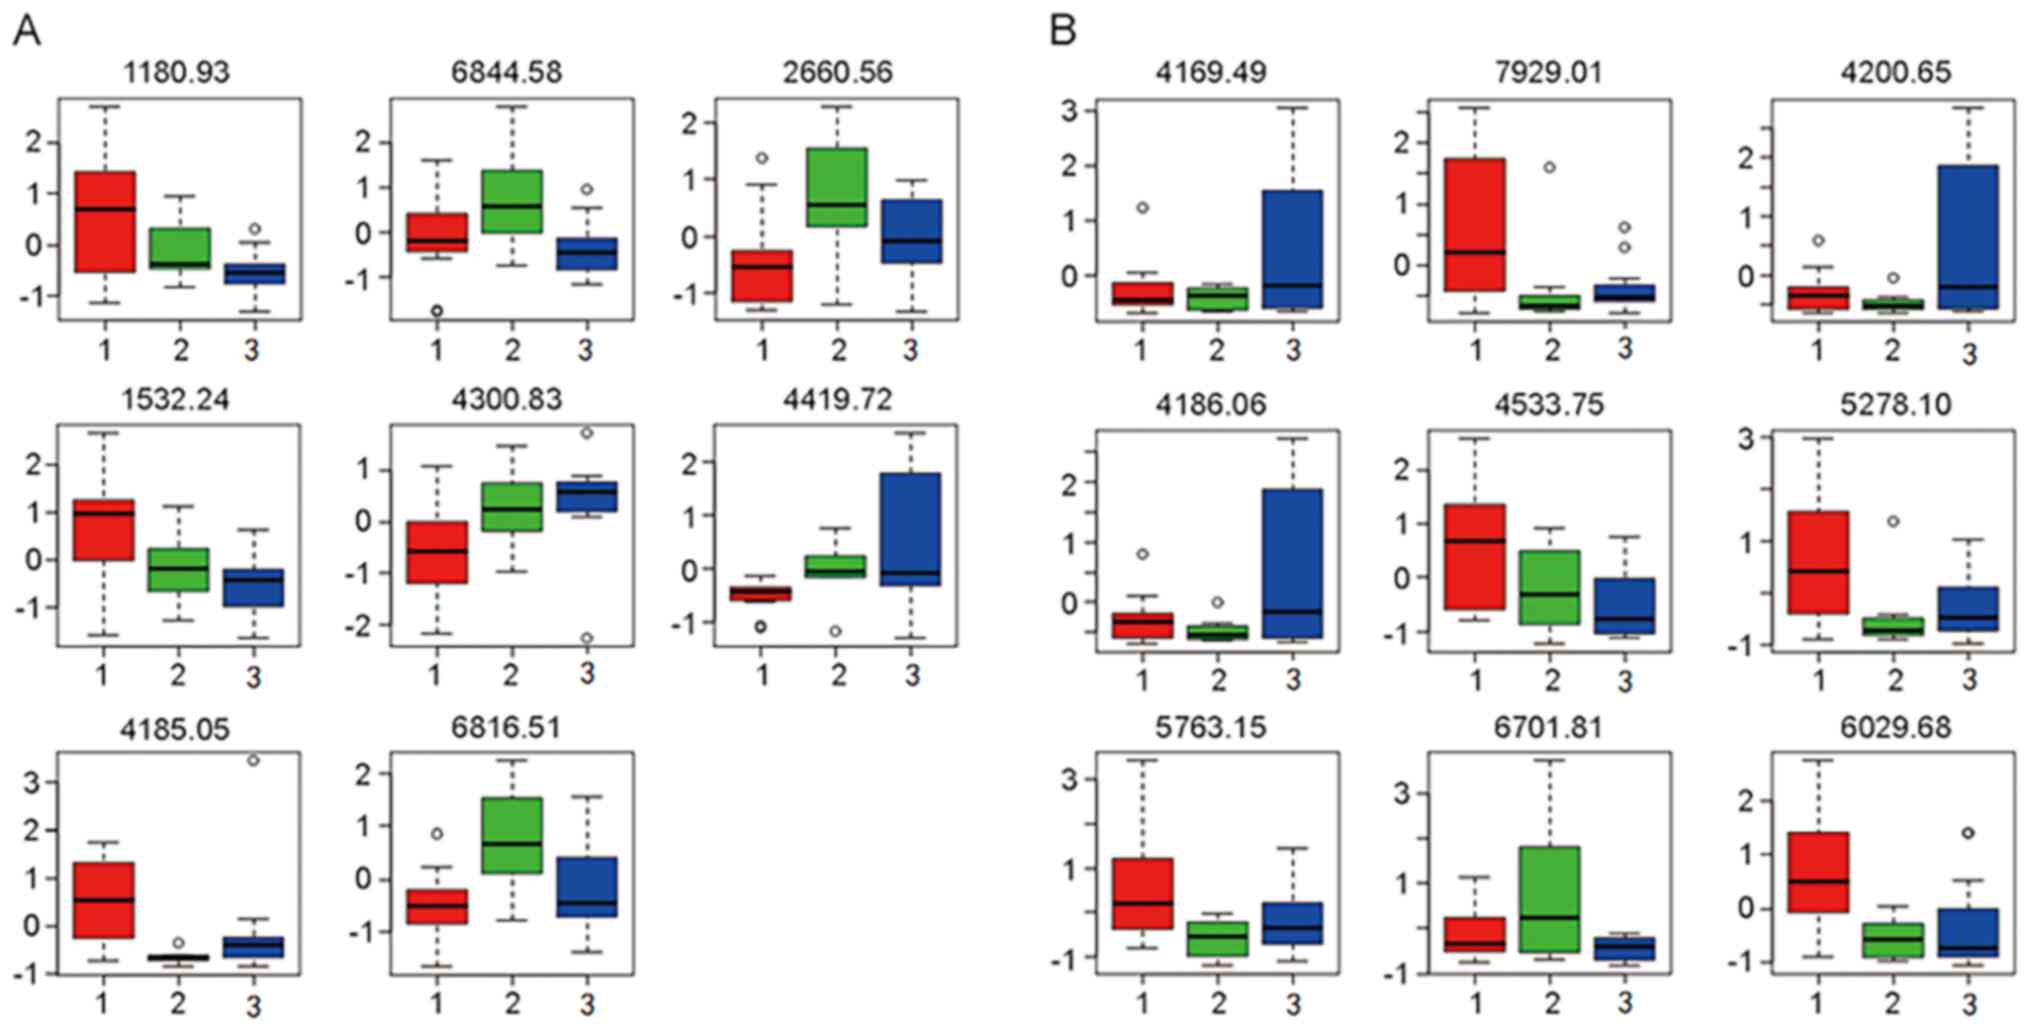 | Figure 2Box plots indicating the differences
in peptide levels in (A) serum and (B) BALF among the different
groups. A total of 8 peptides were identified to be differentially
expressed in serum, including those with an m/z of 1,180.93
(myeloid-associated differentiation marker), 6,844.58 (undefined
peptide), 2,660.56 (fibrinogen α-chain), 1,532.24 (clusterin),
4,300.83 (keratin, type I cytoskeletal 18), 4,419.72 (APOAI),
4,185.05 (AGT) and 6,816.51 (undefined peptide). Furthermore, 9
peptides were identified to be differentially expressed in BALF,
including those with an m/z of 4,169.49 (APOAI), 7,929.01
(undefined peptide), 4,200.65 (argininosuccinatelyase), 4,186.06
(AGT), 4,533.75 (APOAI), 5,278.1 (undefined peptide), 5,763.15
(undefined peptide), 6,701.81 (undefined peptide), 6,029.68
(undefined peptide). Relative levels (fold change) of the proteins
were presented in the box plots. Groups: 1 (red), tuberculosis; 2
(green), tracheal intubation and tracheotomy; and 3(blue),
early-stage lung cancer. BALF, bronchial alveolar lavage fluid;
m/z, mass-to-charge ratio; APOAI, apolipoprotein A-I; ATG,
angiotensinogen. |
Model building
The GA, SNN and QC model-building functions embedded
in ClinPro Tools 2.2 software were used to establish a
cross-validated classification model to distinguish TB, TIT and
ESCL groups in terms of serum and BALF proteins. The peaks that
were selected by these three algorithms are presented in Table II.
| Table IIPeak selection of the algorithm
models. |
Table II
Peak selection of the algorithm
models.
| | Serum peak
selection (m/z) | BALF peak selection
(m/z) |
|---|
| Algorithm | TB vs. TIT | TIT vs. ESLC | TB vs. ESLC | TB vs. TIT | TIT vs. ESLC | TB vs. ESLC |
|---|
| SNN | 1531, 4420, 3859,
9010, 4435, 5544, 4153, 4185, 5506, 4644, 4467, 7481, 1312, 5716,
8618, 7356, 7029, 3588, 9539, 5753 | 1539 | 5266, 4300, 839,
4169 | 7769, 4170, 4534,
4136, 2022, 8621, 3276, 3086, 6960, 2423, 1722, 5279, 6831, 3475,
2711, 4941, 3905, 8323, 3012, 3463, 5218, 2316, 2090, 1427 | 5383 | 6030, 3463, 3905,
1942, 5384, 1743, 6811, 3012, 2316, 922, 5699, 7621, 5279,
7542 |
| QC | 855, 1050, 1066,
1150, 1180 | 839, 855, 861, 975,
1011, 1050, 1066, 1072, 1251, 1450, 1523, 1539, 2379, 2448, 2462,
2473 | 839, 2022, 2037,
2044, 2052, 2065, 2660, 2674, 3508, 3736, 4128, 4152, 4169, 4186,
4300, 7067, 9539 | 833, 1312, 1330,
1449, 2316, 3475, 4186, 4200, 4216, 4534, 5279, 7929, 8584,
8621 | 817, 833, 839,
845 | 6030 |
| GA | 1180, 3904, 3764,
2022, 4644 | 3314, 1251, 6888,
3486, 3401 | 3508, 1180, 7067,
4152, 4467 | 4186, 2723, 6029,
4941, 6960 | 6644, 4136, 839,
5383, 2032 | 5763, 2066, 2754,
3841, 5421 |
Identification of peptides by
MALDI-TOF MS
To determine which peptides in the MS profiles are
possible biomarkers, the current study attempted to identify those
peptides with higher concentrations. The peptides in the Fisher
model were purified and analyzed by MALDI-TOF MS and 6 serum
peptides and 4 BALF peptides were successfully identified. A total
of 8 peptides in serum, including MYADM (m/z 1,180.93), KRT18
(4,300.83), FGA (2,660.56), AGT (4,185.05), APOAI (4,419.72), CLU
(1,532.24) and two undefined peptides (6,816.51 and 6,844.58) were
successfully sequenced (Table
III). In BALF samples, 9 peptides, including argininosuccinate
lyase (ASL; 4,200.65), APOAI (two sequences: 4,169.49 and
4,533.75), AGT (4,186.06) and five undefined peptides (6,029.68,
5,763.15, 7,929.01, 6,701.81 and 5,278.1) were sequenced (Table III). AGT and APOAI simultaneously
appeared in both serum and BALF samples. APOAI was identified in
both serum and BALF samples by its sequence KAKPALEDLRQGLLPVLE
SFKVSFLSALEEYTKKLNTQ, while AGT was confirmed as the sequence
KPEVLEVTLNRPFLFAVY DQSATALHFLGRVANPLSTA. Compared with the TIT
group, AGT and CLU were significantly upregulated and FGA was
downregulated in serum from patients with TB, implying their
potential roles in the pathogenesis of the disease.
| Table IIIList of detected sequences. |
Table III
List of detected sequences.
| A, Serum |
|---|
| Mass (M+H;
kDa) | Protein symbol | Protein name | Sequence |
|---|
| 1,180.93 | MYADM | Myeloid-associated
differentiation marker |
M.PVTVTRTTITT.T |
| 4,300.83 | KRT18 | Keratin, type I
cytoskeletal 18 |
K.NREELDKYWSQQIEESTTVVTTQSAEVGAAETTLTELR.R |
| 2,660.56 | FGA | Isoform 1 of
fibrinogen α-chain |
A.DEAGSEADHEGTHSTKRGHAKSRPV.R |
| 6,816.51 | - | N/A | N/A |
| 6,844.58 | - | N/A | N/A |
| 4,185.05 | AGT | Angiotensinogen
precursor |
N.KPEVLEVTLNRPFLFAVYDQSATALHFLGRVANPLSTA.- |
| 4,419.72 | APOAI | Apolipoprotein A-I
precursor |
S.EKAKPALEDLRQGLLPVLESFKVSFLSALEEYTKKLNTQ.- |
| 1,532.24 | CLU | Clusterin
precursor |
R.RPHFFFPKSRIV.R |
| B, BALF |
| Mass (M+H;
kDa) | Protein symbol | Protein name | Sequence |
| 6,029.68 | - | N/A | N/A |
| 5,763.15 | - | N/A | N/A |
| 4,200.65 | ASL |
Argininosuccinatelyase |
D.FVAEFLFWASLCM*THLSRM*AEDLILYCTKEFSFVQ.L |
| 7,929.01 | - | N/A | N/A |
| 6,701.81 | - | N/A | N/A |
| 4,169.49 | APOAI | Apolipoprotein A-I
precursor |
K.AKPALEDLRQGLLPVLESFKVSFLSALEEYTKKLNTQ.- |
| 4,186.06 | AGT | Angiotensinogen
precursor |
N.KPEVLEVTLNRPFLFAVYDQSATALHFLGRVANPLSTA.- |
| 5,278.10 | - | N/A | N/A |
| 4,533.75 | APOAI | Apolipoprotein A-I
precursor |
L.SEKAKPALEDLRQGLLPVLESFKVSFLSALEEYTKKLNTQ.- |
Validation of differentially expressed
peptides in serum by ELISA
To validate the results of MALDI-TOF MS, ELISA was
applied for the quantification of the differentially expressed
peptides in sera from 20 patients with TB, 20 patients with TIT and
20 patients with ESCL. Fold changes in the protein levels are
presented in Fig. 3. The results
indicated that MYADM, AGT and CLU were upregulated in the TB group
as compared with those in the TIT and ESLC groups, while KRT18, FGA
and APOAI were downregulated in the TB group compared with those in
the TIT and ESLC groups. Notably, patients with ESLC had relatively
high serum FGA levels and low APOAI levels compared with those in
the TIT group (Fig. 3). There was
an indication that these proteins may serve as potential markers to
distinguish patients with TBS after TB from patients with TBS due
to other causes.
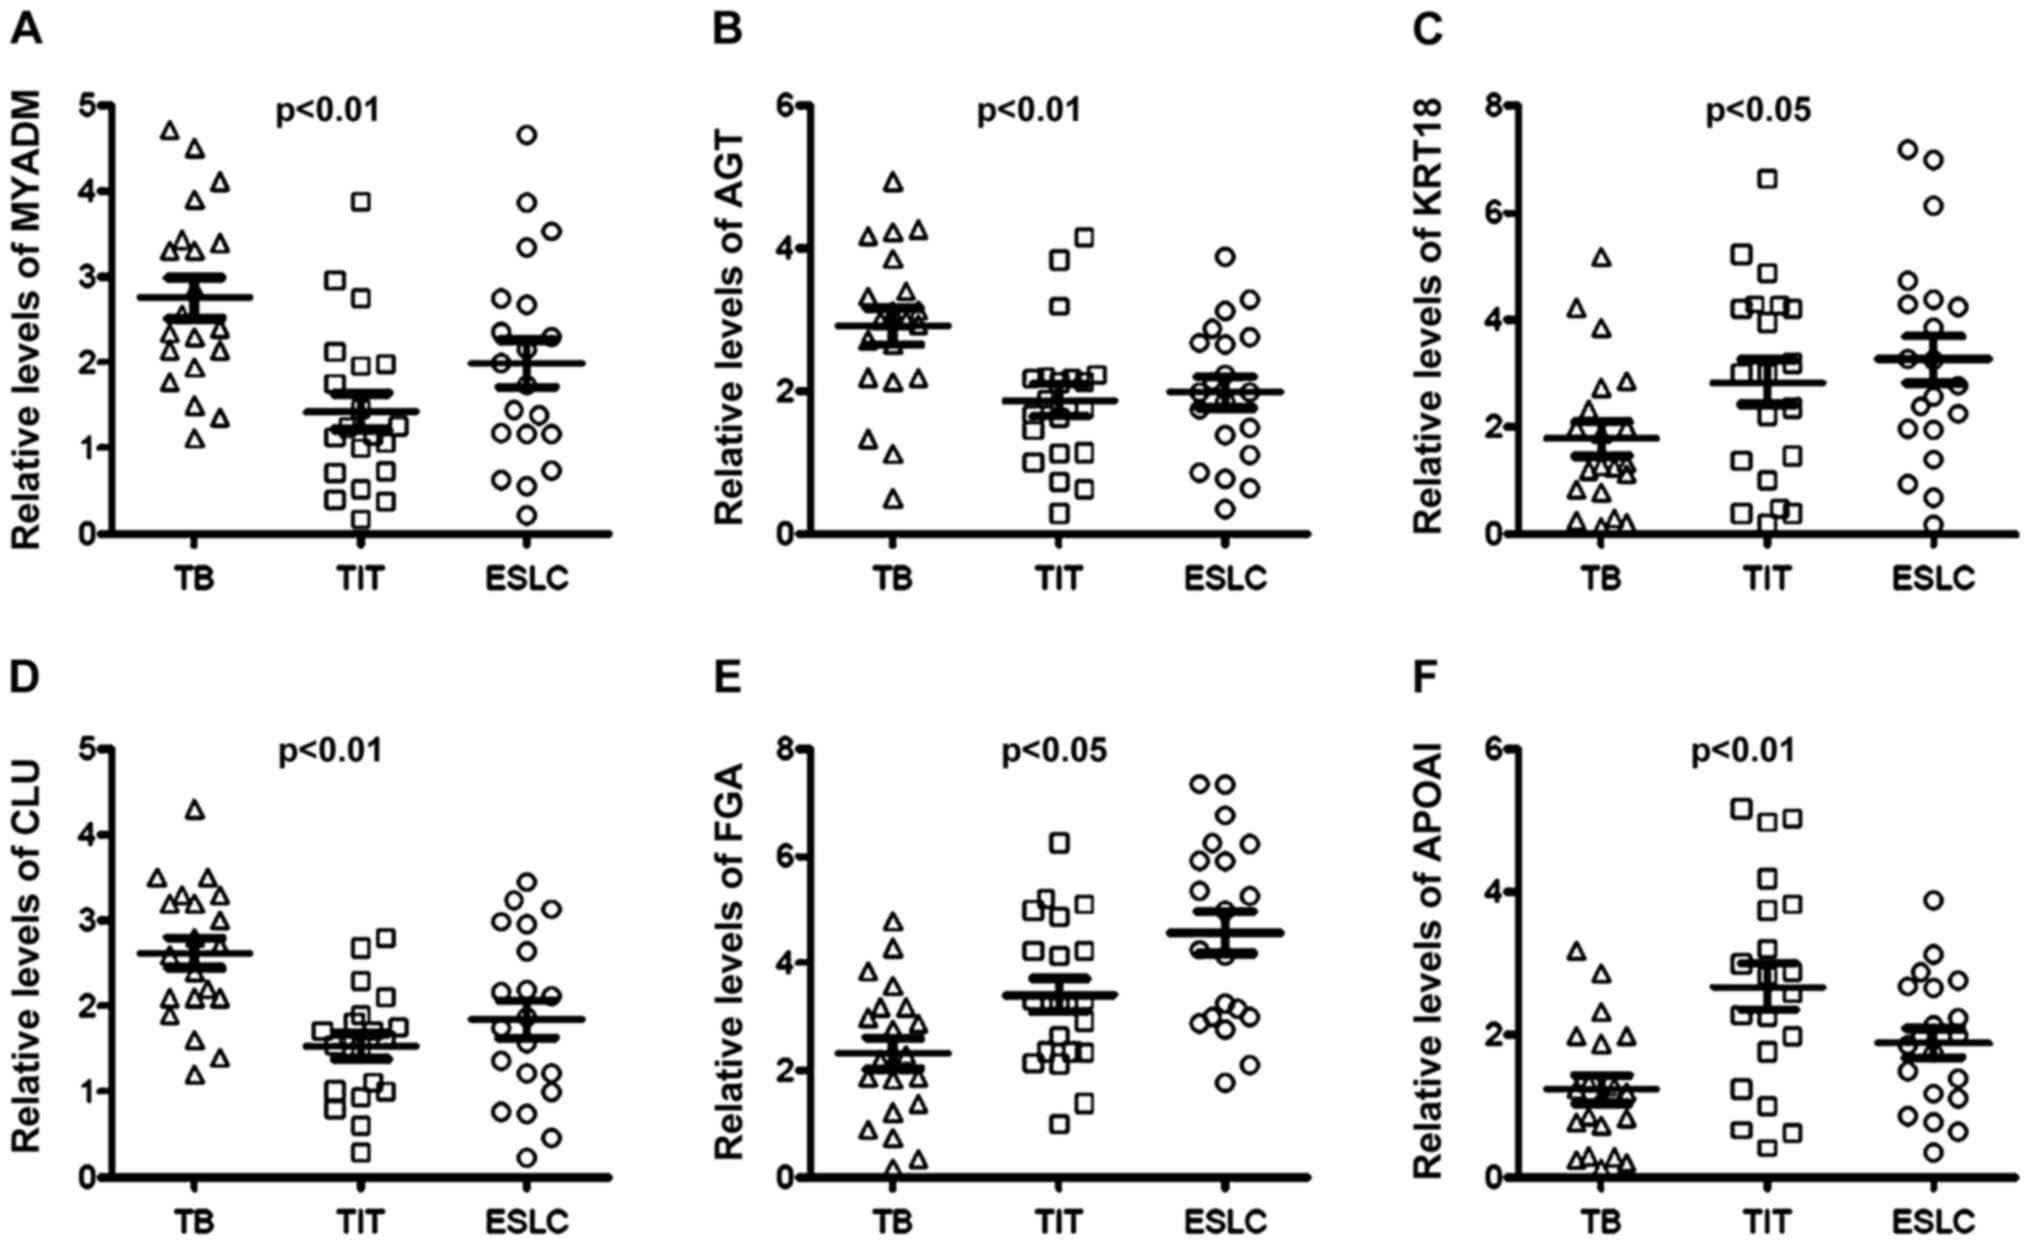 | Figure 3Fold changes of the protein levels in
serum determined by ELISA. Serum (A) MYADM, (B) AGT, (C) KRT18, (D)
CLU, (E) FGA and (F) APOAI were quantified using ELISA. MYADM, AGT
and CLU levels were increased in TB patients compared with those in
TIT and ESLC patients. On the contrary, KRT18, FGA and APOAI were
distinctly decreased in TB patients compared with TIT and ESLC
patients. TBS, tracheobronchial stenosis; TB, tuberculosis; ESLC,
TIT, tracheal intubation and tracheotomy; early-stage lung cancer;
MYADM, myeloid-associated differentiation marker; KRT18, keratin,
type I cytoskeletal 18; FGA, fibrinogen α-chain; APOAI,
apolipoprotein A-I; AGT, angiotensinogen; CLU, clusterin. |
Discussion
Patients with tracheobronchial TB frequently
encounter TBS, which may lead to pulmonary complications and death.
In the clinic, prevention of TBS is critical to reduce the risk of
death. Bronchoscopic or surgical interventions are used to restore
airway patency once significant stenosis occurs (2). Although certain studies focused on the
biomarkers for pulmonary TB, the diagnosis of TBS after TB with
non-invasive clinical tests appears to be particularly important
(21,22). The present study aimed to identify
putative biomarkers of TBS after tracheobronchial TB and the
results revealed that MYADM, AGT, CLU and FGA in serum may serve as
biomarkers for the diagnosis of TBS after tracheobronchial TB.
In the present study, MYADM was significantly
upregulated in the serum of patients with TB compared with that in
the ESLC group and downregulated in the serum of patients with TIT
compared with that in the ESLC and TB groups. Full-length MYADM
complementary (c)DNA was identified in a human bone marrow cDNA
library in 2001 and was mapped to chromosome 19q 13.33-q
13.4(23). MYADM is expressed in
specialized domains on the membrane surface of human endothelial
and epithelial cells and binds with actin (24). Additionally, MYADM colocalizes with
Rac family small GTPase1 protein in membrane rafts during cell
migration (25). Knockdown of MYADM
with small interfering (si)RNA led to enhanced cell permeability,
intercellular adhesion molecule-1 expression and leukocyte
adhesion, which are characteristics of the inflammatory phenotype
in endothelial cells (24).
Notably, upregulation of MYADM specifically correlates with carotid
neointimal formation, which promoted aortic artery smooth muscle
cell (SMC) differentiation in a rat carotid artery balloon-injury
model (26). Airway SMCs are
recognized as a primary pathological determinant in lung diseases,
including asthma and emphysema (27). Their dynamic and multifunctional
behavior contributes to inflammation, fibroproliferation, abnormal
wound healing, airway remodeling and hypertrophic scar formation
and, therefore, narrowing of the airway lumen, leading to
irreversible airway stenosis (28).
In the present study, FGA was downregulated in the
serum of patients with TB compared with that in patients in the TIT
and ESLC groups. Patients with aspirin-exacerbated respiratory
disease, which is associated with asthma severity, have also been
reported to exhibit reduced serum FGA levels (29).
The present results demonstrated that AGT levels
were higher in sera in patients with TB compare to sera from
patients in the TIT and ESLC groups; however, AGT levels in BALFs
from patients with TB were lower compared with the BALFs from
patients in the TIT group. AGT levels in BALFs were lower in
patients with ESLC than in those with TB and TIT. AGT is thought to
be involved in tumor angiogenesis and metastasis, as lung tumor
growth and metastasis were attenuated in AGT (+/-) mice (30). The mechanisms of AGT-modulated
airway stenosis require further elucidation.
The present results indicated that CLU was
upregulated in the sera of patients with TB and it has been
previously reported to be differentially expressed in plasma from
patients with active TB complicated with diabetes (31). Furthermore, CLU levels were
decreased in BALF from patients with pulmonary fibrosis and
facilitated epithelial cell regeneration during lung repair
(32,33). CLU is a critical glycoprotein with
key roles in homeostasis, inhibition of cell death and promotion of
pro-survival signaling pathways (34). It is involved in several
physiological and pathological states. Genetic variation of CLU is
associated with Alzheimer's disease (AD) (35). Notably, CLU serves as a chaperon of
amyloid β and has attracted considerable attention in the field of
AD research (36). CLU was
indicated to be elevated in several tumor types. CLU confers
chemoresistance to numerous cancer types, including primary breast
cancer (37), pancreatic cancer
(38), lung cancer (39), osteosarcoma (40) and prostate cancer (41). Accordingly, custirsen, a
second-generation antisense oligonucleotide, was designed to
inhibit the expression of CLU.
In the present study, serum APOAI was indicated to
be downregulated in patients with TB. This result is in concordance
with those of previous studies. APOAI is the major protein
component of high-density lipoprotein that has a key role in lipid
metabolism and serves as a biomarker for cardiovascular diseases
(42). Serum APOAI levels were
negatively correlated with the onset of cerebral infarction in
patients with carotid artery stenosis (43). Of note, a recent study demonstrated
that APOAI, -AⅡ and -AⅣ were decreased in patients with active TB
(44). Furthermore, rifampicin
treatment led to an increase in the level of APOAI in patients with
TB; however, there was no statistical significance (45). Serum APOAI protein, quantified by
isobaric tags for relative and absolute quantitation labeling
coupled with two-dimensional liquid chromatography tandem MS, was
markedly upregulated in patients cured of TB compared with that in
untreated TB patients (46). APOAI
is expressed in the lung. Of note, APOAI-/- mice presented with
increased active lung inflammation and airway hyperresponsiveness
(47). APOAI mimetics reduced the
responses in the mouse model of asthma (48). Further studies are required to
explore the putative implications of APOAI in the pathology and
treatment of the disease.
The epithelial-mesenchymal transition is recognized
as a key process in the initiation of cancer and it is accompanied
by downregulation of KRT8/KRT18, which was indicated to be barely
expressed in two intestinal cell lines, murine CT26 and rat IEC-6
cells (49). In IEC-6 cells, the
KRT18 promoter was determined to be hypermethylated and in CT26
cells, a 9-amino acid in-frame insertion in the gene was
identified. Matrigel assays indicated that restoration of KRT18
reduced CT26 cell invasion (49).
The results demonstrated that the restoration of KRT18 reduced
E-cadherin expression in IEC-6 cells; however, reduced expression
was not observed in CT26 cells. Furthermore, KRT18 expression was
modulated by early growth response 1 (EGR1) in non-small-cell lung
carcinoma. Robust EGR1 expression and regulation of KRT18 led to
reduced cell mobility and migration, and activated tumor cell
apoptosis (50). Additionally,
KRT18 was indicated to be associated with cancer cell metastasis.
siRNA-mediated knockdown of KRT18 increased the migration and
invasion of HepG2 and Eca109 cells (51). However, the roles and mechanisms of
KRT18 in TB and tracheobronchial TB-induced TBS remain to be
elucidated.
In conclusion, in the present study, MALDI-TOF MS
was used to analyze proteins in the serum and BALF from patients
with TB, ESLC and TIT to identify potential biomarkers for TBS
secondary to tracheobronchial TB. Several candidate proteins,
including MYADM, APOAI and KRT18, should be further examined for
their roles in the pathophysiology of TBS. These proteins are
involved in cell migration, permeability, adhesion, invasion,
differentiation, neointima formation and tumor metastasis, which
indicates a combination of pathological changes during TBS. These
candidate proteins may be promising diagnostic tools and
therapeutic targets and provide additional insight into the
mechanisms underlying TBS after tracheobronchial TB.
Supplementary Material
General characteristics of the
patients whose serum and BALF samples were examined by mass
spectrometry.
General characteristics of the
patients whose serum samples were examined by ELISAs.
Acknowledgements
Not applicable.
Funding
The current work was supported by the Capital Health
Development Research Project (grant no. 2016-2-2048).
Availability of data and materials
The datasets used and/or analyzed during the current
study are available from the corresponding author on reasonable
request.
Authors' contributions
BP, XQ and JZ conceptualized and designed the
current study and acquired, analyzed and interpreted data. ZD
analyzed and interpreted data. BP and JZ drafted the manuscript. JZ
critically revised the manuscript for important intellectual
content. YP and TW acquired data. All authors read and approved the
final manuscript.
Ethics approval and consent to
participate
All of the patients provided written informed
consent to participate in the current study and for use of their
medical data according to the provisions of the Declaration of
Helsinki. The protocol of the current study was approved by the
Institutional Ethics Committee of Beijing Tian Tan Hospital,
Capital Medical University (Beijing, China).
Patient consent for publication
Not applicable.
Competing interests
The authors declare that they have no competing
interests.
References
|
1
|
Hirshoren N and Eliashar R: Wound-healing
modulation in upper airway stenosis-Myths and facts. Head Neck.
31:111–126. 2009.PubMed/NCBI View Article : Google Scholar
|
|
2
|
Siow WT and Lee P: Tracheobronchial
tuberculosis: A clinical review. J Thorac Dis. 9:E71–E77.
2017.PubMed/NCBI View Article : Google Scholar
|
|
3
|
Nemati A, Safavi E, GhasemiEsfe M, Anaraki
MZ, Firoozbakhsh S, Khalilzadeh O and Anvari M: Fistula formation
between the right and left main bronchus caused by endobronchial
tuberculosis. Am J Med Sci. 343:330–331. 2012.PubMed/NCBI View Article : Google Scholar
|
|
4
|
Kashyap S, Mohapatra PR and Saini V:
Endobronchial tuberculosis. Indian J Chest Dis Allied Sci.
45:247–256. 2003.PubMed/NCBI
|
|
5
|
Um SW, Yoon YS, Lee SM, Yim JJ, Yoo CG,
Chung HS, Kim YW, Han SK, Shim YS and Kim DK: Predictors of
persistent airway stenosis in patients with endobronchial
tuberculosis. Int J Tuberc Lung Dis. 12:57–62. 2008.PubMed/NCBI
|
|
6
|
Shahzad T and Irfan M: Endobronchial
tuberculosis-a review. J Thorac Dis. 8:3797–3802. 2016.PubMed/NCBI View Article : Google Scholar
|
|
7
|
Mondoni M, Repossi A, Carlucci P, Centanni
S and Sotgiu G: Bronchoscopic techniques in the management of
patients with tuberculosis. Int J Infect Dis. 64:27–37.
2017.PubMed/NCBI View Article : Google Scholar
|
|
8
|
Pathak V, Shepherd RW and Shojaee S:
Tracheobronchial tuberculosis. J Thorac Dis. 8:3818–3825.
2016.PubMed/NCBI View Article : Google Scholar
|
|
9
|
England K, Masini T and Fajardo E:
Detecting tuberculosis: Rapid tools but slow progress. Public
Health Action. 9:80–83. 2019.PubMed/NCBI View Article : Google Scholar
|
|
10
|
Fan NJ, Gao CF and Wang XL: Tubulin beta
chain, filamin A alpha isoform 1, and cytochrome b-c1 complex
subunit 1 as serological diagnostic biomarkers of esophageal
squamous cell carcinoma: A proteomics study. OMICS. 17:215–223.
2013.PubMed/NCBI View Article : Google Scholar
|
|
11
|
Sobsey CA, Ibrahim S, Richard VR, Gaspar
V, Mitsa G, Lacasse V, Zahedi RP, Batist G and Borchers CH:
Targeted and untargeted proteomics approaches in biomarker
development. Proteomics. 20(e1900029)2020.PubMed/NCBI View Article : Google Scholar
|
|
12
|
Venkatesh A, Gil C, Fuentes M, LaBaer J
and Srivastava S: A Perspective on Proteomics of Infectious
Diseases. Proteomics Clin Appl. 12(e1700139)2018.PubMed/NCBI View Article : Google Scholar
|
|
13
|
Dong W, Qiu C, Gong D, Jiang X, Liu W, Liu
W, Zhang L and Zhang W: Proteomics and bioinformatics approaches
for the identification of plasma biomarkers to detect Parkinson's
disease. Exp Ther Med. 18:2833–2842. 2019.PubMed/NCBI View Article : Google Scholar
|
|
14
|
Beavis RC and Chait BT: Rapid, sensitive
analysis of protein mixtures by mass spectrometry. Proc Natl Acad
Sci USA. 87:6873–6877. 1990.PubMed/NCBI View Article : Google Scholar
|
|
15
|
Stoeckli M, Farmer TB and Caprioli RM:
Automated mass spectrometry imaging with a matrix-assisted laser
desorption ionization time-of-flight instrument. J Am Soc Mass
Spectrom. 10:67–71. 1999.PubMed/NCBI View Article : Google Scholar
|
|
16
|
Peng Y, Zhang Q, Xu C and Shi W: MALDI-TOF
MS for the rapid identification and drug susceptibility testing of
filamentous fungi. Exp Ther Med. 18:4865–4873. 2019.PubMed/NCBI View Article : Google Scholar
|
|
17
|
Cho YT, Su H, Wu WJ, Wu DC, Hou MF, Kuo CH
and Shiea J: Biomarker Characterization by MALDI-TOF/MS. Adv Clin
Chem. 69:209–254. 2015.PubMed/NCBI View Article : Google Scholar
|
|
18
|
Davies HA: The ProteinChip System from
Ciphergen: A new technique for rapid, micro-scale protein biology.
J Mol Med (Berl). 78(B29)2000.PubMed/NCBI
|
|
19
|
Deng BG, Yao JH, Liu QY, Feng XJ, Liu D,
Zhao L, Tu B and Yang F: Comparative serum proteomic analysis of
serum diagnosis proteins of colorectal cancer based on magnetic
bead separation and maldi-tof mass spectrometry. Asian Pac J Cancer
Prev. 14:6069–6075. 2013.PubMed/NCBI View Article : Google Scholar
|
|
20
|
Malys BJ, Piotrowski ML and Owens KG:
Diagnosing and correcting mass accuracy and signal intensity error
due to initial ion position variations in a MALDI TOFMS. J Am Soc
Mass Spectrom. 29:422–434. 2018.PubMed/NCBI View Article : Google Scholar
|
|
21
|
Cho Y, Park Y, Sim B, Kim J, Lee H, Cho
SN, Kang YA and Lee SG: Identification of serum biomarkers for
active pulmonary tuberculosis using a targeted metabolomics
approach. Sci Rep. 10(3825)2020.PubMed/NCBI View Article : Google Scholar
|
|
22
|
Isa F, Collins S, Lee MH, Decome D, Dorvil
N, Joseph P, Smith L, Salerno S, Wells MT, Fischer S, et al: Mass
spectrometric identification of urinary biomarkers of pulmonary
tuberculosis. EBioMedicine. 31:157–165. 2018.PubMed/NCBI View Article : Google Scholar
|
|
23
|
Cui W, Yu L, He H, Chu Y, Gao J, Wan B,
Tang L and Zhao S: Cloning of human myeloid-associated
differentiation marker (MYADM) gene whose expression was
up-regulated in NB4 cells induced by all-trans retinoic acid. Mol
Biol Rep. 28:123–138. 2001.PubMed/NCBI View Article : Google Scholar
|
|
24
|
Aranda JF, Reglero-Real N, Marcos-Ramiro
B, Ruiz-Sáenz A, Fernández-Martín L, Bernabé-Rubio M, Kremer L,
Ridley AJ, Correas I, Alonso MA, et al: MYADM controls endothelial
barrier function through ERM-dependent regulation of ICAM-1
expression. Mol Biol Cell. 24:483–494. 2013.PubMed/NCBI View Article : Google Scholar
|
|
25
|
Aranda JF, Reglero-Real N, Kremer L,
Marcos-Ramiro B, Ruiz-Sáenz A, Calvo M, Enrich C, Correas I, Millán
J and Alonso MA: MYADM regulates Rac1 targeting to ordered
membranes required for cell spreading and migration. Mol Biol Cell.
22:1252–1262. 2011.PubMed/NCBI View Article : Google Scholar
|
|
26
|
Sun L, Bai Y, Zhao R, Sun T, Cao R, Wang
F, He G, Zhang W, Chen Y, Ye P, et al: Oncological miR-182-3p, a
novel smooth muscle cell phenotype modulator, evidences from model
rats and patients. Arterioscler Thromb Vasc Biol. 36:1386–1397.
2016.PubMed/NCBI View Article : Google Scholar
|
|
27
|
Panettieri RA Jr: Airway smooth muscle: An
immunomodulatory cell. J Allergy Clin Immunol. 110
(Suppl):S269–S274. 2002.PubMed/NCBI View Article : Google Scholar
|
|
28
|
Ozier A, Allard B, Bara I, Girodet PO,
Trian T, Marthan R and Berger P: The pivotal role of airway smooth
muscle in asthma pathophysiology. J Allergy (Cairo).
2011(742710)2011.PubMed/NCBI View Article : Google Scholar
|
|
29
|
Kim HJ, Park JS, Heo JS, Moon KY and Park
CS: Plasma apolipoprotein H levels are different between aspirin
induced respiratory diseases and aspirin tolerant asthma. Pulm
Pharmacol Ther. 27:184–189. 2014.PubMed/NCBI View Article : Google Scholar
|
|
30
|
Choi JH, Nguyen MP, Lee D, Oh GT and Lee
YM: Hypoxia-induced endothelial progenitor cell function is blunted
in angiotensinogen knockout mice. Mol Cells. 37:487–496.
2014.PubMed/NCBI View Article : Google Scholar
|
|
31
|
Zhang X, Ma A, Sun S and Sun Y: Proteomic
analysis of plasma in adult active pulmonary tuberculosis patients
with diabetes mellitus. Clin Lab. 61:1481–1490. 2015.PubMed/NCBI View Article : Google Scholar
|
|
32
|
Peix L, Evans IC, Pearce DR, Simpson JK,
Maher TM and McAnulty RJ: Diverse functions of clusterin promote
and protect against the development of pulmonary fibrosis. Sci Rep.
8(1906)2018.PubMed/NCBI View Article : Google Scholar
|
|
33
|
Habiel DM, Camelo A, Espindola M, Burwell
T, Hanna R, Miranda E, Carruthers A, Bell M, Coelho AL, Liu H, et
al: Divergent roles for clusterin in lung injury and repair. Sci
Rep. 7(15444)2017.PubMed/NCBI View Article : Google Scholar
|
|
34
|
Wilson MR and Zoubeidi A: Clusterin as a
therapeutic target. Expert Opin Ther Targets. 21:201–213.
2017.PubMed/NCBI View Article : Google Scholar
|
|
35
|
Nordestgaard LT, Tybjærg-Hansen A,
Rasmussen KL, Nordestgaard BG and Frikke-Schmidt R: Genetic
variation in clusterin and risk of dementia and ischemic vascular
disease in the general population: Cohort studies and meta-analyses
of 362,338 individuals. BMC Med. 16(39)2018.PubMed/NCBI View Article : Google Scholar
|
|
36
|
Foster EM, Dangla-Valls A, Lovestone S,
Ribe EM and Buckley NJ: Clusterin in Alzheimer's Disease:
Mechanisms, genetics, and lessons from other pathologies. Front
Neurosci. 13(164)2019.PubMed/NCBI View Article : Google Scholar
|
|
37
|
Wang Y, Wang X, Zhao H, Liang B and Du Q:
Clusterin confers resistance to TNF-alpha-induced apoptosis in
breast cancer cells through NF-kappaB activation and Bcl-2
overexpression. J Chemother. 24:348–357. 2012.PubMed/NCBI View Article : Google Scholar
|
|
38
|
Tang Y, Liu F, Zheng C, Sun S and Jiang Y:
Knockdown of clusterin sensitizes pancreatic cancer cells to
gemcitabine chemotherapy by ERK1/2 inactivation. J Exp Clin Cancer
Res. 31(73)2012.PubMed/NCBI View Article : Google Scholar
|
|
39
|
Panico F, Rizzi F, Fabbri LM, Bettuzzi S
and Luppi F: Clusterin (CLU) and lung cancer. Adv Cancer Res.
105:63–76. 2009.PubMed/NCBI View Article : Google Scholar
|
|
40
|
Ma J, Gao W and Gao J: sCLU as prognostic
biomarker and therapeutic target in osteosarcoma. Bioengineered.
10:229–239. 2019.PubMed/NCBI View Article : Google Scholar
|
|
41
|
Bertacchini J, Mediani L, Beretti F, Guida
M, Ghalali A, Brugnoli F, Bertagnolo V, Petricoin E, Poti F, Arioli
J, et al: Clusterin enhances AKT2-mediated motility of normal and
cancer prostate cells through a PTEN and PHLPP1 circuit. J Cell
Physiol. 234:11188–11199. 2019.PubMed/NCBI View Article : Google Scholar
|
|
42
|
Charlton-Menys V and Durrington P:
Apolipoproteins AI and B as therapeutic targets. J Intern Med.
259:462–472. 2006.PubMed/NCBI View Article : Google Scholar
|
|
43
|
Dong Z, Guo Q, Sun L, Li F, Zhao A, Liu J,
Qu P, Zhu Q, Xiao C, Niu F, et al: Serum lipoprotein and RBC
rigidity index to predict cerebral infarction in patients with
carotid artery stenosis. J Clin Lab Anal. 32(e22356)2018.PubMed/NCBI View Article : Google Scholar
|
|
44
|
Mateos J, Estévez O, González-Fernández Á,
Anibarro L, Pallarés Á, Reljic R, Mussá T, Gomes-Maueia C,
Nguilichane A, Gallardo JM, et al: Serum proteomics of active
tuberculosis patients and contacts reveals unique processes
activated during Mycobacterium tuberculosis infection. Sci
Rep. 10(3844)2020.PubMed/NCBI View Article : Google Scholar
|
|
45
|
Albanna AS, Bachmann K, White D,
Valiquette C and Menzies D: Serum lipids as biomarkers for
therapeutic monitoring of latent tuberculosis infection. Eur Respir
J. 42:547–550. 2013.PubMed/NCBI View Article : Google Scholar
|
|
46
|
Wang C, Wei LL, Shi LY, Pan ZF, Yu XM, Li
TY, Liu CM, Ping ZP, Jiang TT, Chen ZL, et al: Screening and
identification of five serum proteins as novel potential biomarkers
for cured pulmonary tuberculosis. Sci Rep. 5(15615)2015.PubMed/NCBI View Article : Google Scholar
|
|
47
|
Wang W, Xu H, Shi Y, Nandedkar S, Zhang H,
Gao H, Feroah T, Weihrauch D, Schulte ML, Jones DW, et al: Genetic
deletion of apolipoprotein A-I increases airway
hyperresponsiveness, inflammation, and collagen deposition in the
lung. J Lipid Res. 51:2560–2570. 2010.PubMed/NCBI View Article : Google Scholar
|
|
48
|
Yao X, Dai C, Fredriksson K, Dagur PK,
McCoy JP, Qu X, Yu ZX, Keeran KJ, Zywicke GJ, Amar MJ, et al: 5A,
an apolipoprotein A-I mimetic peptide, attenuates the induction of
house dust mite-induced asthma. J Immunol. 186:576–583.
2011.PubMed/NCBI View Article : Google Scholar
|
|
49
|
Kwan R, Looi KS and Omary MB: Absence of
keratins 8 and 18 in rodent epithelial cell lines associates with
keratin gene mutation and DNA methylation: Cell line selective
effects on cell invasion. Exp Cell Res. 335:12–22. 2015.PubMed/NCBI View Article : Google Scholar
|
|
50
|
Zhang H, Chen X, Wang J, Guang W, Han W,
Zhang H, Tan X and Gu Y: EGR1 decreases the malignancy of human
non-small cell lung carcinoma by regulating KRT18 expression. Sci
Rep. 4(5416)2014.PubMed/NCBI View Article : Google Scholar
|
|
51
|
Wang X, Lao Y, Xu N, Xi Z, Wu M, Wang H,
Li X, Tan H, Sun M and Xu H: Oblongifolin C inhibits metastasis by
up-regulating keratin 18 and tubulins. SciRep.
5(10293)2015.PubMed/NCBI View Article : Google Scholar
|


