Introduction
Undiagnosed pneumonia was first reported in Wuhan
(Hubei province) in December 2019, followed by outbreaks in several
parts of China in the following month, and also in South Korea,
Japan, Thailand, America, Australia and other countries. A novel
coronavirus has been isolated from the respiratory tract of
patients, which has been named severe acute respiratory syndrome
(SARS) coronavirus (CoV) 2 (SARS-CoV-2) by the International Virus
Classification Committee (1). The
disease, which is caused by SARS-CoV-2, was named coronavirus
disease 2019 (COVID-19) by the World Health Organization (1,2).
Coronaviruses are single-stranded positive strand
RNA viruses, which are divided into four genera: α, β, λ and δ
(1,2). Coronaviruses have been indicated to
infect numerous animals, including bats, pigs, cattle, mice and
monkeys (3,4). A total of six types of coronavirus in
infected individuals exist, which belong to the genera α (229E and
NL63) and β (OC43, HKU1, Middle East respiratory syndrome-related
CoV and SARS-CoV) (2). SARS-CoV-2
is a newly discovered β-coronavirus (4), and it has been speculated that it was
transmitted to humans by bats.
At present, Wuhan is the most serious epidemic area
in China. COVID-19 is a public health emergency with the fastest
speed and the widest scope in Chinese history. Although COVID-19
has been listed in China as a class B infectious disease, a
prevention and control scheme for class A infectious diseases has
been adopted (4). The clinical and
imaging features of COVID-19 have been rarely reported, to the best
of our knowledge. In the current study, the clinical and imaging
characteristics of COVID-19 were summarized via comparing and
analyzing the clinical, laboratory and imaging data of patients
with COVID-19 and non-COVID-19, which may aid in the improvement of
the understanding and diagnosis of the disease, and in limiting the
spread of COVID-19.
Materials and methods
Patients
The study protocol was approved by the Regional
Ethics Committee for Clinical Research of the Second Affiliated
Hospital of Qiqihar Medical College (Qiqihar, China). Written
informed consent was obtained from all patients. For patients that
were minors, informed consent was obtained from their parents or
guardians.
A retrospective study was conducted in 152 patients
with pneumonia diagnosed in the Second Affiliated Hospital of
Qiqihar Medical College and the First Hospital of Jilin University
from December 30, 2019 to February 29, 2020. Inclusion criteria:
Clinical symptoms such as cough, sputum, fever and chest tightness;
physical examination with or without lung rales, or tubular
breathing; and a CT diagnosis showing pneumonia. Pharyngeal swabs
for nucleic acid detection of respiratory secretions were used for
all patients. All patients have complete clinical records.
Malignant tumor, secondary infection of bronchiectasis and
pulmonary fibrosis pneumonia were excluded. The clinical
characteristics of the patients are presented in Table I.
 | Table IComparison of clinical information
between patients with COVID-19 and non-COVID-19. |
Table I
Comparison of clinical information
between patients with COVID-19 and non-COVID-19.
| Clinical
information | Patients with
COVID-19 (n=65) | Patients with
non-COVID-19 (n=87) | t/χ2
value | P-value |
|---|
| Sex |
|
Male | 46 (70.77) | 47 (54.02) | 4.393a | 0.036 |
|
Female | 19 (29.23) | 40 (45.98) | | |
| Age, years | 43.646±14.387 | 46.046±16.840 | 0.924b | 0.357 |
| Symptoms |
|
None | 3 (4.62) | 2 (2.30) | 0.111a | 0.739 |
|
Cough | 28 (43.08) | 43 (49.43) | 0.602a | 0.438 |
|
Fever | 61 (93.85) | 80 (91.95) | 0.017a | 0.897 |
|
Sore
throat | 1 (1.54) | 6 (6.90) | 1.365a | 0.243 |
| Contact history | 64 (98.46) | 9 (10.34) | 115.729a | <0.001 |
| Underlying
disease | 3 (4.62) | 7 (8.05) | 0.624a | 0.608 |
Nucleic acid detection
Throat swabs were collected from all of the
patients. The swab head was broken and immersed in an Eppendorf
(EP) tube containing 2 ml of isotonic salt solution. The cap of the
tube was closed and sent to the hospital laboratory within 15 min
to 2 h. Total RNA was extracted using nucleic acid extraction or
purification kits (Zhongshan Daan gene company; cat. no. DA0623).
The procedures were as follows: 200 µl liquid from the EP tube was
taken and put into the nucleic acid extraction plate hole, which
was pre-loaded with 20 µl protease K. According to the magnetic
bead extraction method (5), total
RNA was extracted using the Tianlong nucleic acid automatic
extraction instrument (Shaanxi Xi'an Tianlong Technology Co., Ltd.;
nucleic acid extractor NP968). A total of 5 µl of extracted RNA was
added into the PCR reaction tubules which were pre-loaded with 19
µl fluorescent PCR probe (designed for the conservative ORF1a/b:
Forward primer: CCCTGTGGGTTTTACACTTAA, reverse primer:
ACGATTGTGCATCAGCTGA, fluorescent probe:
5'-FAM-CCGTCTGCGGTATGTGGAAAGGTTATGG-BHQ1-3' and N genes: Forward
primer: GGGGAACTTCTCCTGCTAGAAT, reverse primer:
CAGACATTTTGCTCTCAAGCTG, fluorescent probe:
5'-FAM-TTGCTGCTGCTTGACAGATT-TAMRA-3') and 1 µl RT-PCR enzyme mixed
amplification reagent (Sun Yat-sen University Daan Gene Co., Ltd.).
An ABI 7500 real time PCR system (Applied Biosystems; Thermo Fisher
Scientific, Inc.) was used to carry out the amplification
procedure, the details were as follows: 50˚C for 15 min, 95˚C for
15 min, followed by 45 cycles of 94˚C for 15 sec and 55˚C for 45
sec.
Chest computed tomography (CT)
The patients underwent a 64-slice CT scan. The
patients were placed on the supine position on a CT scan bed, and
ceased breathing temporarily for the chest scan to take place. The
CT parameters were as follows: The tube voltage was 120 kV, the
tube current was 100-150 mA, the thickness of the layer was 1 mm
and the distance of the layer was 1 mm. Two experienced
radiologists retrospectively evaluated the CT images of the
patients, according to the following factors: Ground-glass opacity
(GGO), resolution, angiographic thickening, paving stone sign, air
bronchi sign, halo sign and CT distribution. GGO was defined as
mildly increased opacification that did not obscure the underlying
vasculature. Angiographic thickening refers to the thickened blood
vessels visible in GGO. Paving stone sign refers to the widening of
the leaflet interval visible in GGO.
Clinical examination and data
collection
Within 24 h of admission, blood samples were
collected at the Second Affiliated Hospital of Qiqihar Medical
College and sent to the affiliated laboratory. The blood samples
were tested for white blood cell count (normal range,
3.50-9.5x10⁹/l), neutrophil ratio (normal range,
0.3-0.7), lymphocyte ratio (normal range, 0.2-0.5), monocyte ratio
(normal range, 0.03-0.1), eosinophil ratio (normal range,
0.004-0.08), C-reactive protein (normal range, 0-5 mg/l) and
procalcitonin (normal range, 0-0.5 µg/l). The patients' clinical
manifestations and laboratory results were analyzed
retrospectively.
Statistical analysis
Statistical analyses were performed using SPSS v18.0
software (SPSS, Inc.). The data are presented as the mean ±
standard deviation for continuous variables. Data on categorical
variables (laboratory inspection and CT findings) are presented as
n-values and percentages. According to the nucleic acid detection
results, the patients were divided into COVID-19 and non-COVID-19
groups. Data were compared using Student's unpaired t-tests for
continuous variables and χ2 or Fisher's exact test for
categorical variables. The relevant receiver operating
characteristic (ROC) curves were plotted, and the AUC was
calculated. P<0.05 was considered to indicate statistically
significant difference.
Results
Clinical manifestations
The current study included 152 patients, of which 65
cases with a positive reverse transcription-quantitative PCR
(RT-qPCR) test were diagnosed as COVID-19, and 87 cases with a
negative RT-qPCR test were non-COVID-19 (Table I). Except for gender (P=0.036) and
contact history (P<0.001), there was no significant difference
in the clinical characteristics of asymptomatic (P=0.739), cough
(P=0.438), fever (P=0.897) and sore throat (P=0.243) between the
two groups. The difference between age (P=0.357) and underlying
disease (P=0.608) in patients with diabetes was not statistically
significant. In the COVID-19 group, 70.77% (46/65) patients were
male, and 98.46% (64/65) patients had lived, traveled or contacted
infected people in the affected area, which were higher than those
in the non-COVID-19 group (Table
I).
Results of laboratory examination
The normal/low white blood cell count (P<0.001),
low lymphocyte ratio (P=0.002) and high CRP (P=0.036) exhibited a
statistically significant difference between the two groups. 87.69%
(57/65) patients in the COVID-19 group presented normal/low white
blood cell count, 67.69% (44/65) patients exhibited low lymphocyte
ratio, and 53.85% (35/65) patients displayed high CRP. In the
non-COVID-19 group, 35.63% (31/87) patients had normal/low white
blood cell counts, 42.53% (37/87) patients had low lymphocyte ratio
and 36.78% (32/87) patients had high CRP. In the COVID-19 group,
33.85% (22/65) patients had high neutrophilic ratios, 41.54%
(27/65) patients had high monocyte ratios, 58.46% (38/65) patients
had low eosinophilic ratios and 50.77% (33/65) patients had high
procalcitonin levels. In the non-COVID-19 group, 42.53% (37/87)
patients had high neutrophilic ratios, 47.13% (41/87) patients had
high monocyte ratios, 50.57% (44/87) patients had low eosinophilic
ratios and 54.02% (47/87) patients had high procalcitonin levels.
There was no statistically significant difference between the two
groups of patients in the high neutrophil ratios (P=0.277), high
monocyte ratios (P=0.493), low eosinophil ratio (P=0.334) and high
procalcitonin (P=0.691) (Table
II).
| Table IIComparison of laboratory inspection
between patients with COVID-19 and non-COVID-19. |
Table II
Comparison of laboratory inspection
between patients with COVID-19 and non-COVID-19.
| Laboratory
inspection | Patients with
COVID-19 (n=65) | Patients with
non-COVID-19 (n=87) |
χ2-value | P-value |
|---|
| Normal/low white
blood cell count | 57 (87.69) | 31 (35.63) | 41.364 | <0.001 |
| High neutrophil
ratio | 22 (33.85) | 37 (42.53) | 1.181 | 0.277 |
| Low lymphocyte
ratio | 44 (67.69) | 37 (42.53) | 9.464 | 0.002 |
| High monocyte
ratio | 27 (41.54) | 41 (47.13) | 0.470 | 0.493 |
| Low eosinophil
ratio | 38 (58.46) | 44 (50.57) | 0.931 | 0.334 |
| High C-reactive
protein | 35 (53.85) | 32 (36.78) | 4.395 | 0.036 |
| High
procalcitonin | 33 (50.77) | 47 (54.02) | 0.158 | 0.691 |
Results of chest CT
The comparisons of the CT findings between patients
with COVID-19 and non-COVID-19 are presented in Table III. In the COVID-19 group, 95.38%
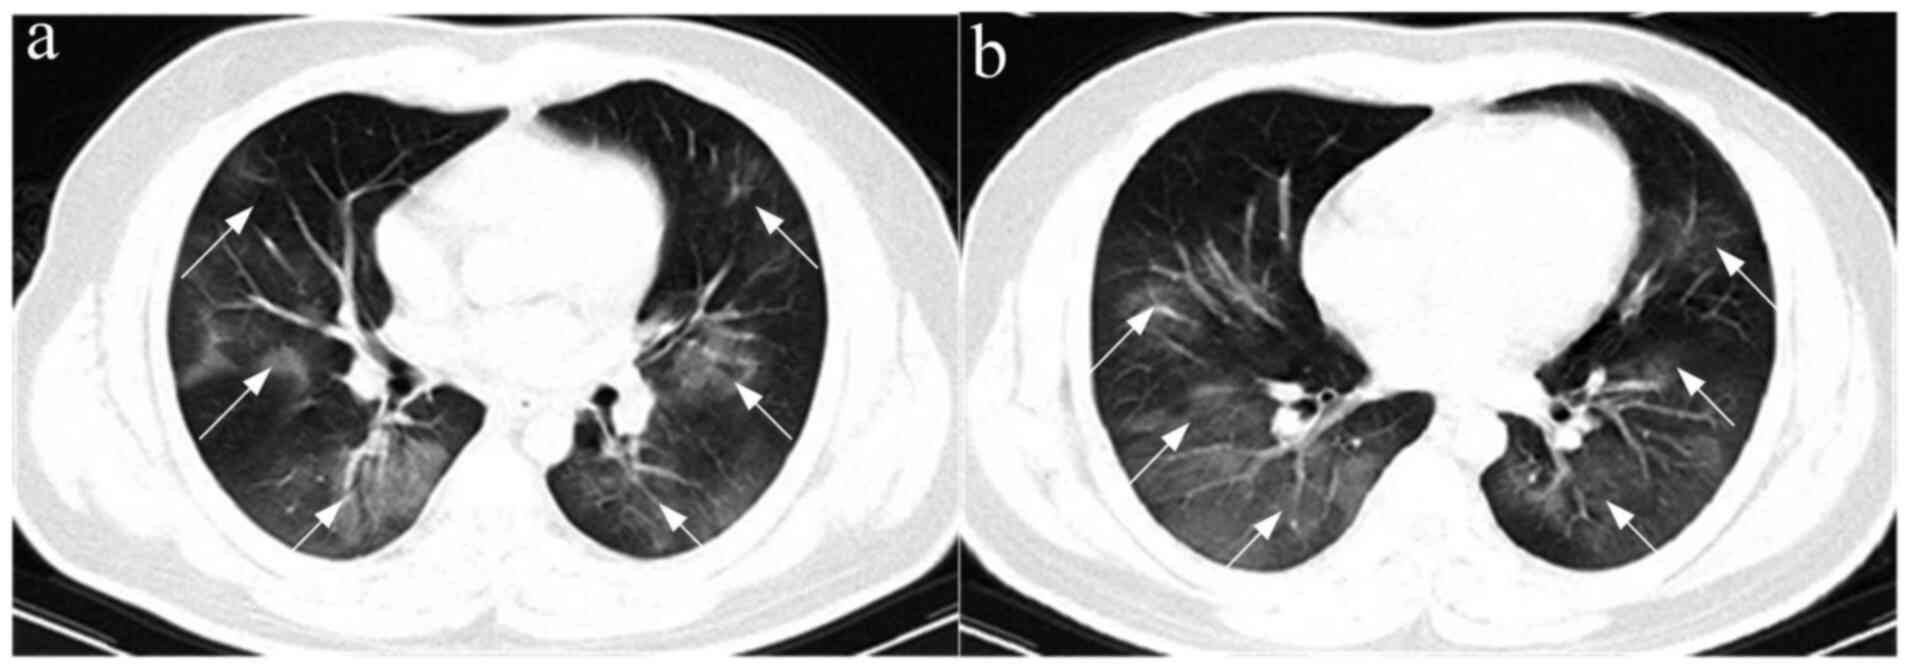
(62/65) patients showed GGO (Fig.
1) or GGO and consolidation, and 4.62% (3/65) patients showed
consolidation. In the non-COVID-19 group, GGO or consolidation was
found in 19.54% (17/87) patients and 80.46% (70/87) patients. GGO
was the most common imaging feature in the COVID-19 group compared
with non-COVID-19 group (P<0.001). In the COVID-19 group, 50.77%
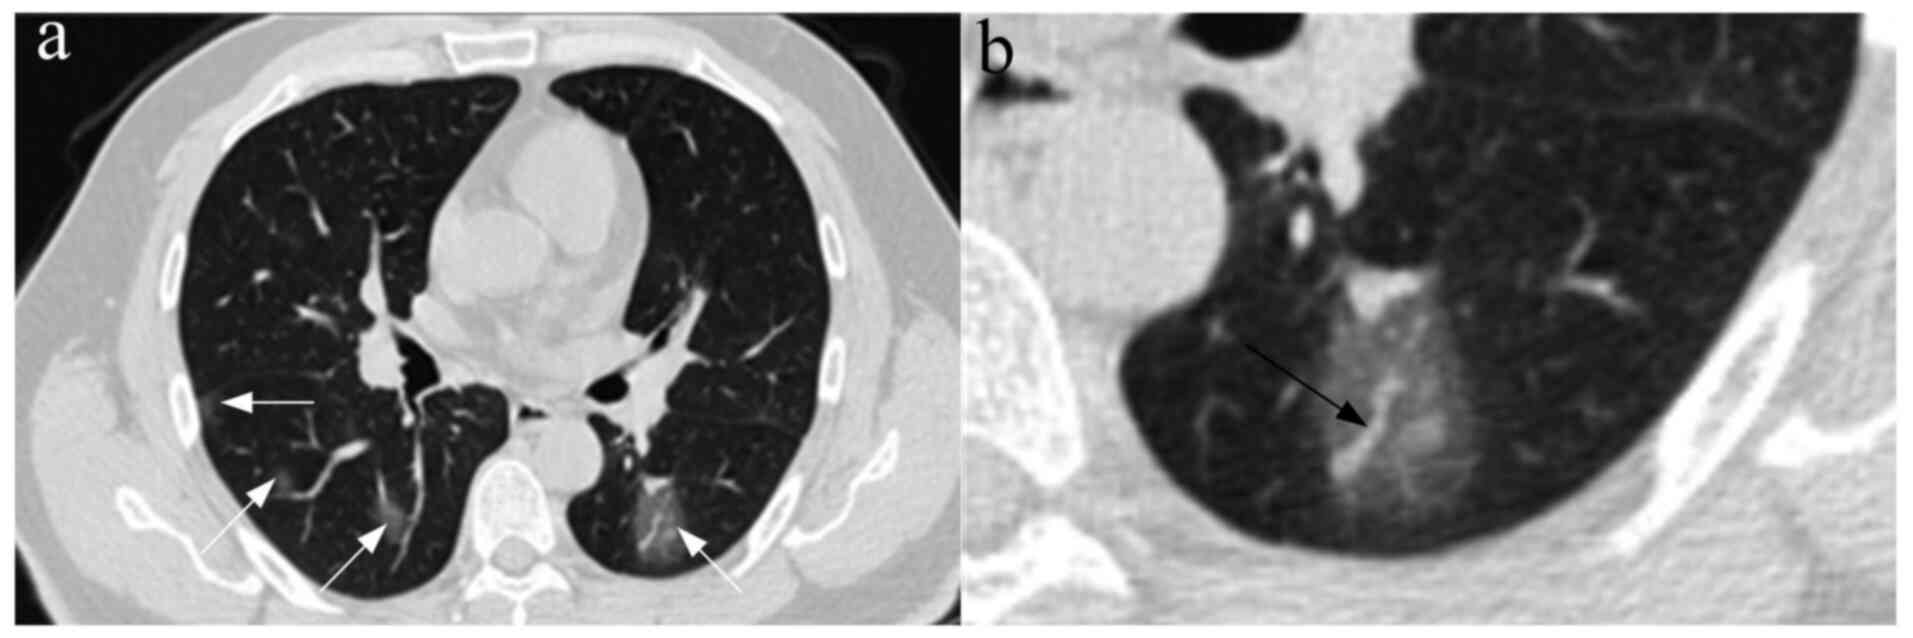
(33/65) patients had angiographic thickening in GGO (Fig. 2), 41.54% (27/65) patients had paving
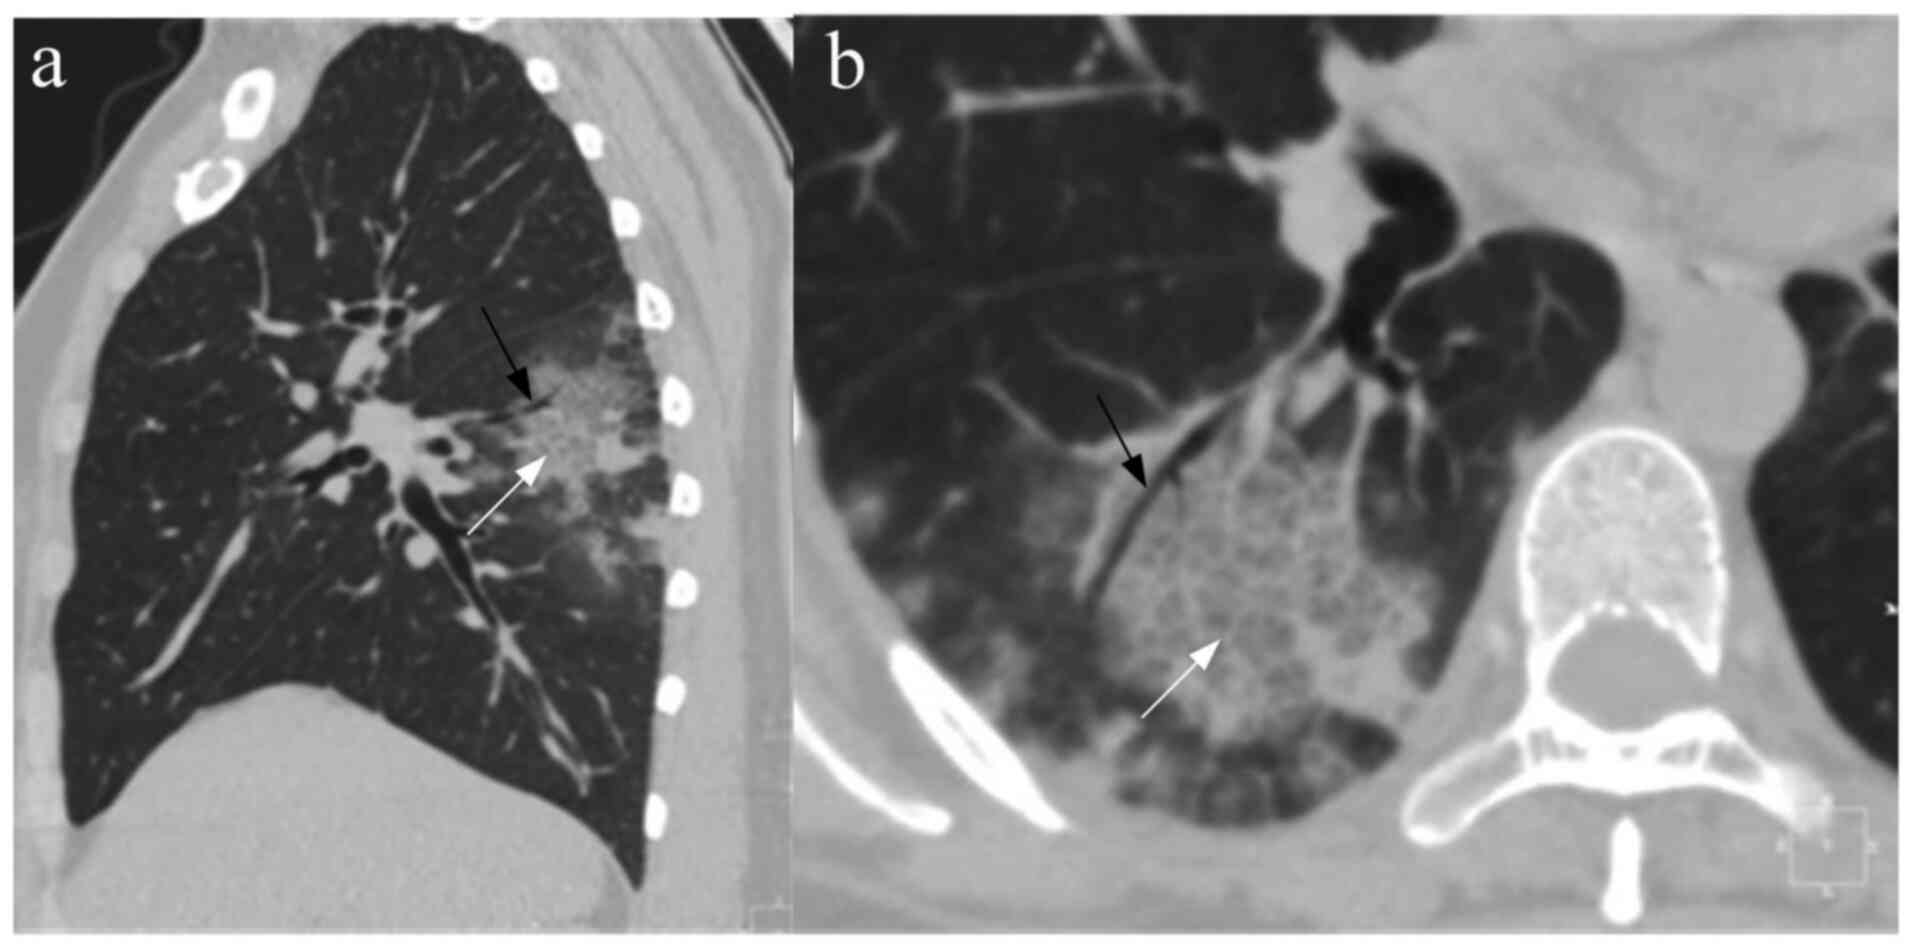
stone sign (Fig. 3), 35.38% (23/65)
patients had air bronchi sign, 21.54% (14/65) patients had fibrotic
session formation, 16.92% (11/65) patients had halo sign and 3.08%
(2/65) patients had plural fusion. In the non-COVID-19 group,
12.64% (11/87) patients had angiographic thickening in GGO, 10.34%
(9/87) patients had paving stone sign, 48.28% (42/87) patients had
air bronchi sign, 32.18% (28/87) patients had fibrotic session
formation, 26.44% (23/87) patients had halo sign and 8.05% (7/87)
patients had plural fusion. The frequency of angiographic
thickening in GGO (<0.001) and paving stone sign (<0.001) in
the COVID-19 group was significantly higher than that in the
non-COVID-19 group. There was no significant difference in the
frequency of air bronchi sign (P=0.112), fibrotic reduction
formation (P=0.146), halo sign (P=0.164) and plural fusion
(P=0.349) between the two groups. In the COVID-19 group, 83.08%
(54/65) patients presented with bilateral lung distribution, 80.00%
(52/65) patients had multifocal distribution and 84.62% (55/65)
patients had subpleural distribution. In the non-COVID-19 group,
56.32% (49/87) patients had bilateral lung distribution, 64.37%
(56/87) patients had multifocal distribution, and 62.07% (54/87)
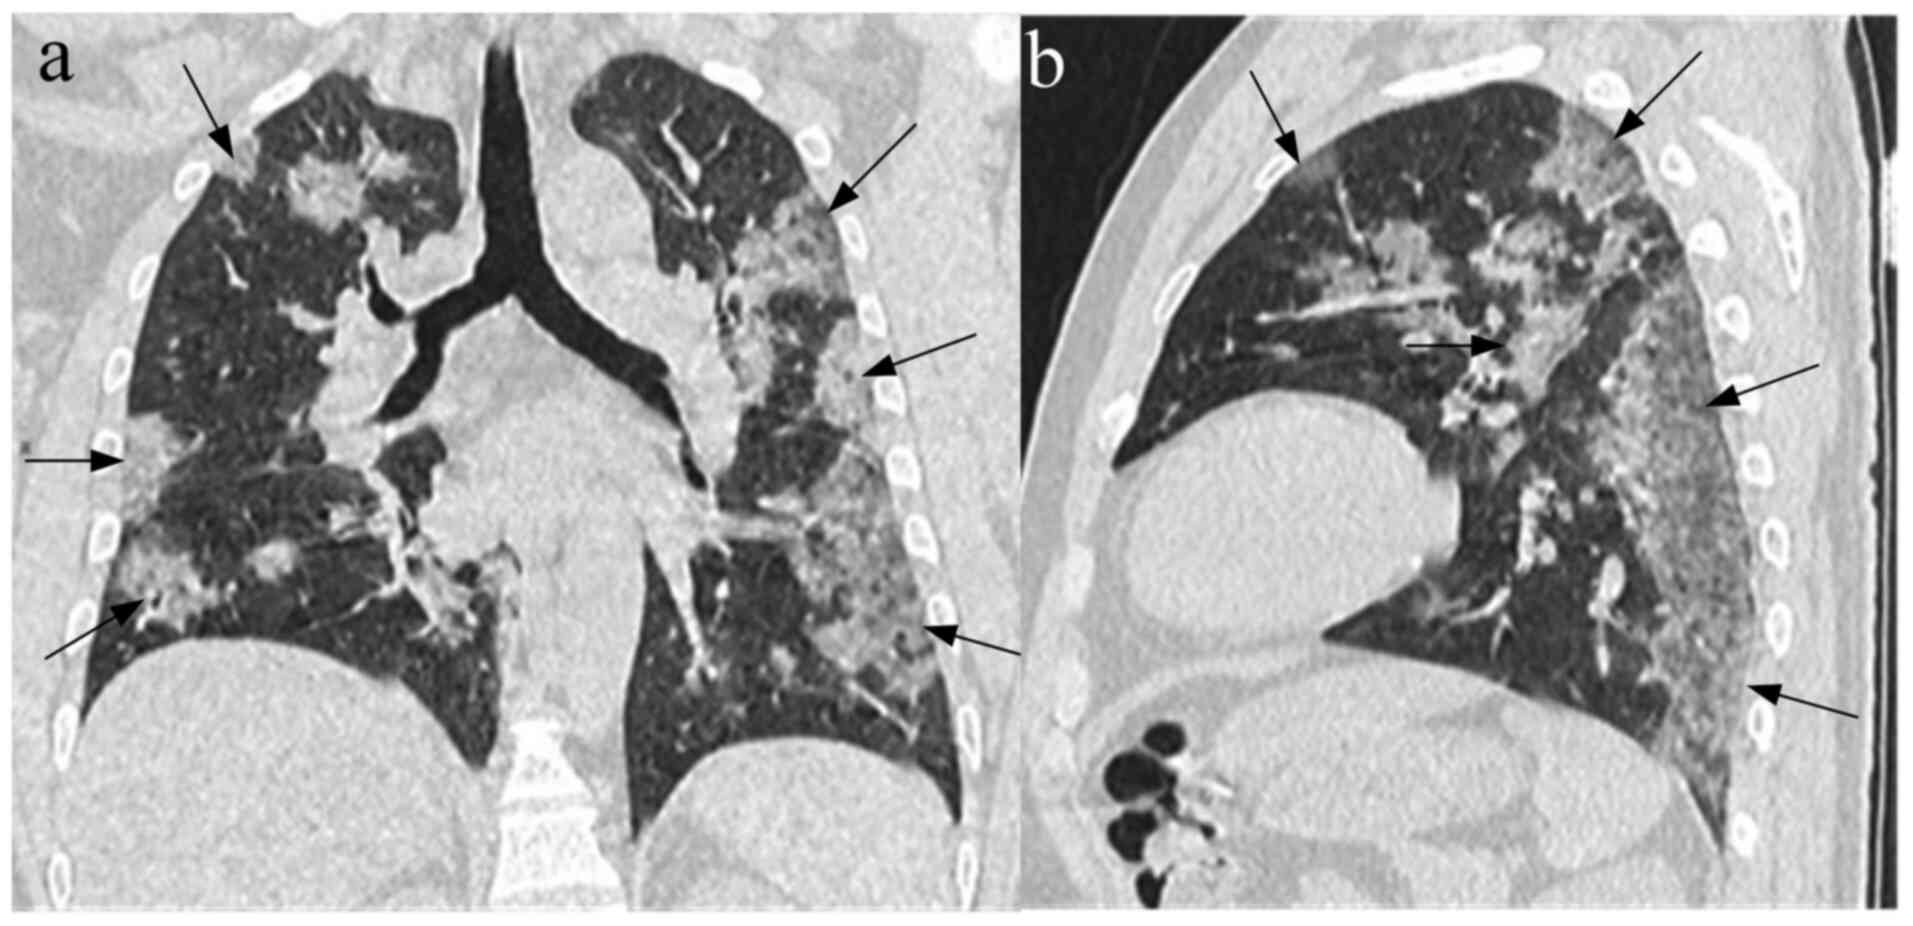
patients had subpleural distribution (Fig. 4). Compared with the non-COVID-19
group, the lesions in the COVID-19 group were primarily
characterized by bilateral lungs (P<0.001), multifocal (P=0.036)
and subpleural distribution (P=0.002).
| Table IIIComparison of CT findings between
patients with COVID-19 and non-COVID-19. |
Table III
Comparison of CT findings between
patients with COVID-19 and non-COVID-19.
| CT findings | Patients with
COVID-19 (n=65) | Patients with
non-COVID-19 (n=87) |
χ2-value | P-value |
|---|
| GGO or GGO and
consolidation | 62 (95.38) | 17 (19.54) | 85.738 | <0.001 |
| Consolidation | 3 (4.62) | 70 (80.46) | | |
| Angiographic
thickening in GGO | 33 (50.77) | 11 (12.64) | 26.293 | <0.001 |
| Paving stone
sign | 27 (41.54) | 9 (10.34) | 20.028 | <0.001 |
| Air bronchi
sign | 23 (35.38) | 42 (48.28) | 2.526 | 0.112 |
| Fibrotic lesion
formation | 14 (21.54) | 28 (32.18) | 2.108 | 0.146 |
| Halo sign | 11 (16.92) | 23 (26.44) | 1.939 | 0.164 |
| Pleural
effusion | 2 (3.08) | 7 (8.05) | 0.878 | 0.349 |
| CT
distribution | | | | |
|
Unilateral | 11 (16.92) | 38 (43.68) | 12.191 | <0.001 |
|
Bilateral | 54 (83.08) | 49 (56.32) | | |
|
Multifocal | 52 (80.00) | 56 (64.37) | 4.420 | 0.036 |
|
Subpleural | 55 (84.62) | 54 (62.07) | 9.323 | 0.002 |
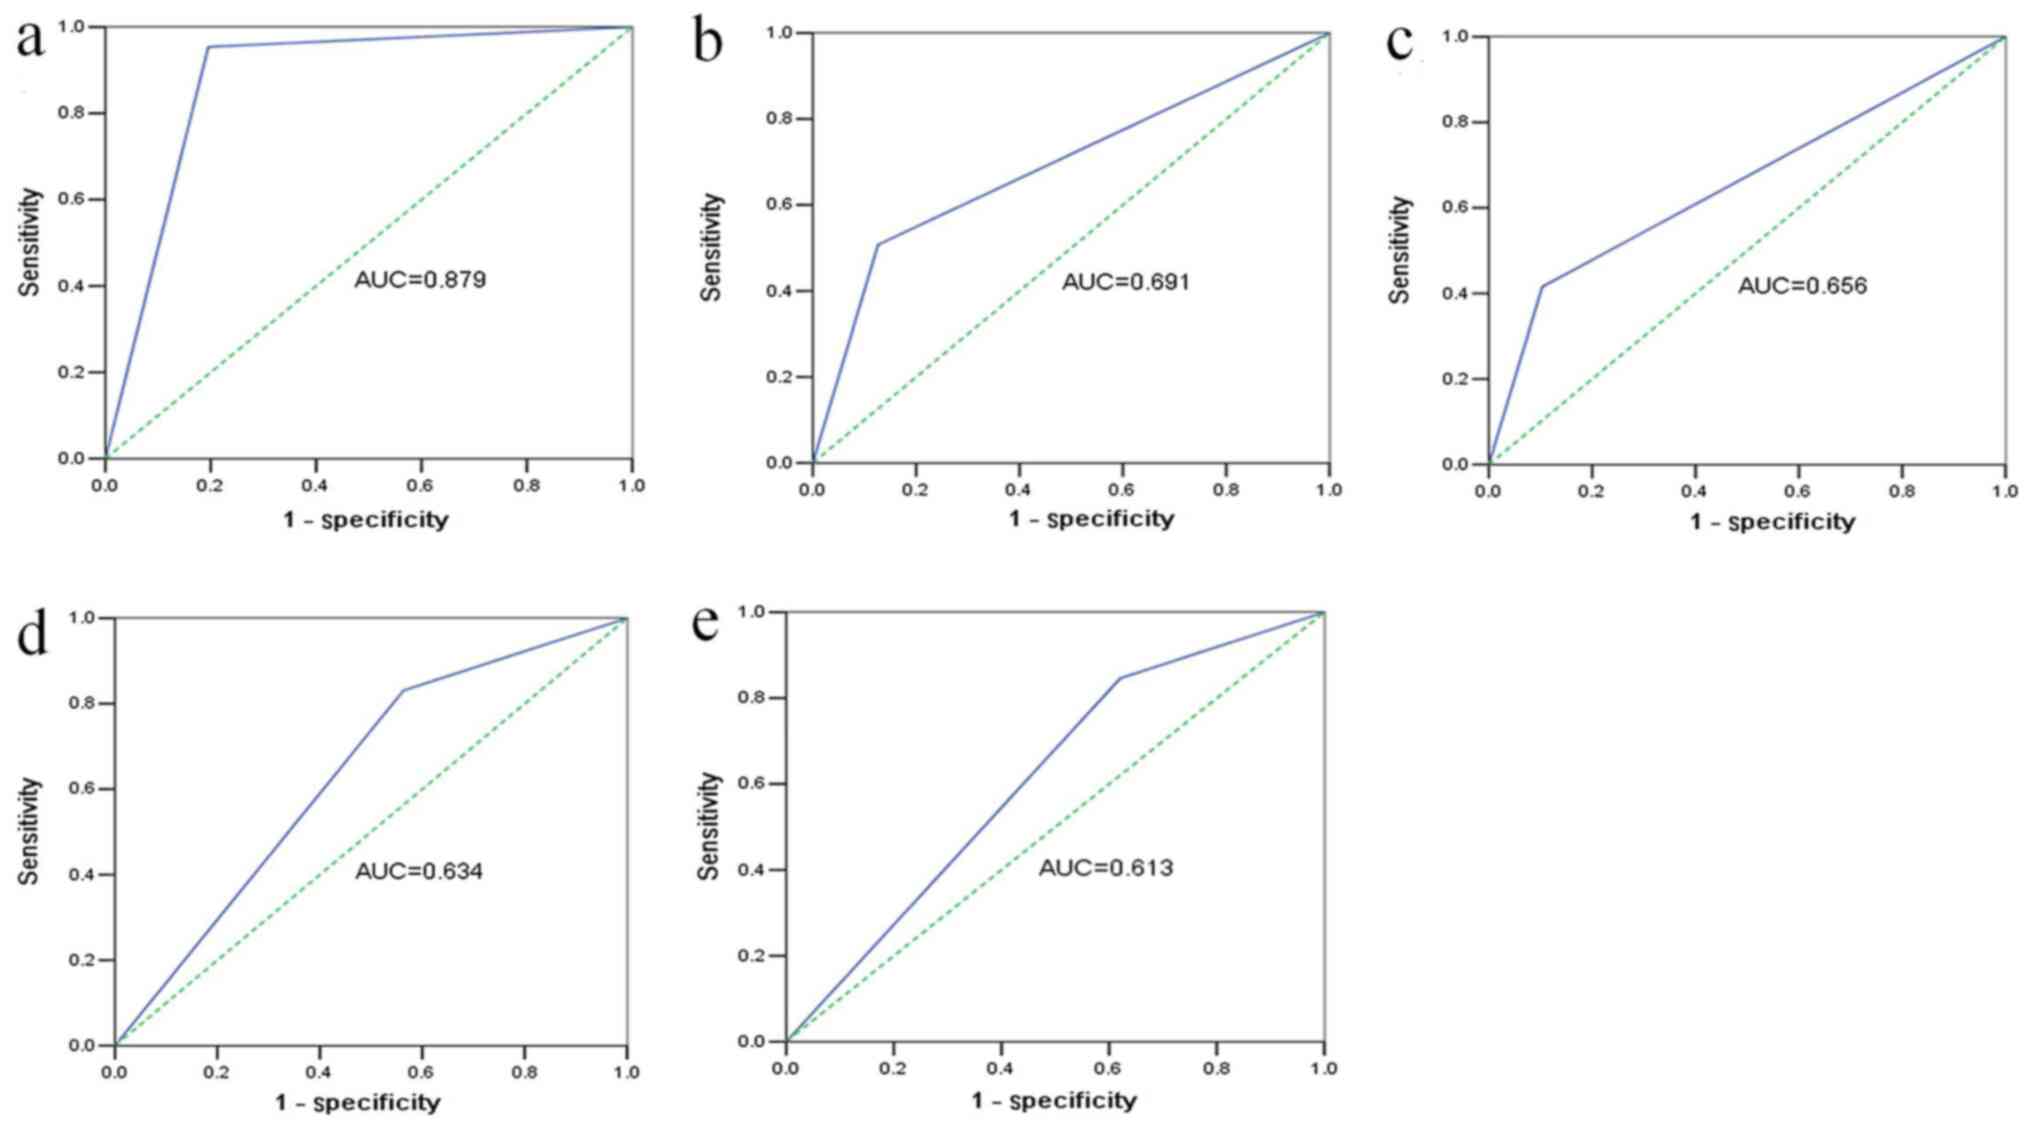
ROC curves of the CT
characteristics
The ROCs of certain characteristics for the
diagnosis of COVID-19 were plotted and the AUC was determined. GGO
or GGO and consolidation presented an AUC of 0.879 and P<0.001
(Fig. 5A). Angiographic thickening
in GGO for the diagnosis of COVID-19 exhibited an AUC of 0.691 and
P<0.001 (Fig. 5B). Paving stone
sign for COVID-19 diagnosis was plotted, with an AUC of 0.656 and
P=0.001 (Fig. 5C). Bilateral lungs
presented an AUC of 0.634 and P=0.005 (Fig. 5D). Finally, the ROC of subpleural
distribution was plotted, with an AUC of 0.613 and P=0.018
(Fig. 5E).
Discussion
Currently, COVID-19 is expanding in China, which
poses a threat to human health. The genetic similarity between
SARS-CoV-2 and SARS-CoV reaches ~83% (5). The quick and accurate diagnosis of
COVID-19 represents a key method of saving lives and controlling
the epidemic. It has been indicated that the diagnosis of COVID-19
via nucleic acid detection exhibited strong specificity but poor
sensitivity (6). It has been
hypothesized that clinical symptoms, laboratory tests and CT images
may serve an important role in preclinical screening.
Epidemiological investigations have indicated that
the incubation period of COVID-19 was 1-14 days (7). A total of 98.46% of the patients in
the current study presented with a history of exposure to the
virus, which was the principal element to the diagnosis of
COVID-19. Droplet transmission is the main means of disease
transmission (8), however,
SARS-CoV-2 may also spread in the form of aerosols, resulting in a
strong propagation speed (9), which
may cause an outbreak of COVID-19. In the present study, no
difference in the underlying disease between the two groups
existed, which indicated that immunity was not associated with
COVID-19. In the COVID-19 group, 70.77% of patients were male. Yan
and Xia (10) revealed that 38/51
(74.51%) patients with COVID-19 were male, SARS-CoV-2 has been
indicated to infect more males than females. SARS-CoV-2 has been
indicated to infect type II alveolar epithelial cells, which may
express angiotensin-converting enzyme 2 (ACE2) (6,7). A
recent study revealed that male type II alveolar epithelial cells
exhibited a 2.5x higher percentage of endocrine ACE2 expression
compared with the same cells in females (11). It was hypothesized that this may
account for the increased cases of virus infection in males
compared with females. SARS-CoV-2 exhibits a viral envelope on its
surface, with a round or oval shape and a diameter of 60-140 nm
(4). As the virus infects type II
alveolar epithelial cells and induces respiratory problems, the
most frequently observed clinical symptoms were fever and cough,
which was consistent with the patients' CT manifestations.
In the current study, the total number of peripheral
blood leukocytes in patients with COVID-19 was indicated to be at a
normal/low level, the lymphocyte ratio was decreased, and CRP was
increased in certain patients, which was consistent with the
results of previous studies (12).
This has also been observed in cases of SARS-CoV infection
(6). A recent study reported that
SARS-CoV-2 primarily infects lymphocytes (5). A decreased number of lymphocytes may
result in decreased immunity in patients with COVID-19. Certain
patients exhibit multiple organ failure (13). In the current study, steroids were
used to prevent possible infection during treatment. SARS-CoV-2
nucleic acid can be detected in nasopharyngeal swabs, sputum, low
respiratory secretions and blood, among other samples; however,
certain patients require repeated tests before diagnosis, which may
delay the diagnosis of COVID-19(14).
COVID-19 has a variety of manifestations in CT
scans. Cheng et al (15)
revealed that 81.81% (9/11) patients with COVID-19 exhibited a
double lung infection. Chung et al (16) reported that 80.95% (17/21) patients
exhibited a GGO that was distributed in the subpleural region. At
present, a small number of studies has performed comparative
analysis on imaging features, especially ROC curve plots, to the
best of our knowledge (17).
Comparative studies may more accurately summarize the image
characteristics of COVID-19. Patrick et al (18) reported that 81.31% of patients with
SARS-CoV pneumonia exhibited multiple inflammatory foci in the
subpleural region of the lungs. Following the evaluation of recent
and previous studies, it can be suggested that the distribution of
COVID-19-induced inflammation is consistent with that in other
viral pneumonias (14). The imaging
findings of different viral pneumonias are similar (19). In patients with herpesvirus
pneumonia, 31% of CT images revealed a paving stone sign (17). In the current study, angiographic
thickening and paving stone sign were the principal CT features of
COVID-19. However, the pathological basis of COVID-19 has not been
reported, to the best of our knowledge. A recent study demonstrated
that viral pneumonia, which was induced by SARS-CoV-2 infection of
type II alveolar epithelial cells, induced hemorrhagic alveolar
inflammation and necrosis, which resulted in diffuse alveolar
injury (6). Alveolar injury may
result in alveolar edema, bleeding and collapse of the alveolar
cavity, which were indicated in the CT images as GGO. The
pathological basis of angiographic thickening in GGO is unclear. In
a previous study, it was also suggested that paving stone markers
are common features of viral pneumonia (20). It has been hypothesized that
SARS-CoV-2 infection may cause inflammation of the intralobular
interstitial lymph network, resulting in thickening of the
intralobular interstitial space as a fine grid-like shadow, which
resembles a ‘paving stone sign’ (21). In the present study, the occurrence
probability of air bronchi signs was similar in both groups, which
was consistent with the findings of previous studies (22). At present, air bronchi signs cannot
be used to identify bacterial pneumonia or viral pneumonia
(17). A recent study reported that
halo sign appeared in viral infection (23). In the present study, halo sign was
also observed in patients with COVID-19; however, this was not
observed in all patients. Moreover, in the current study, the CT
images of some lesions with COVID-19 showed a clear strip shadow on
the edge of the lesion, forming a fibrotic lesion. Whether the
fibrotic lesion remains following patient recovery, requires
additional investigation. Based on the ROC curve analysis of GGO or
GGO and consolidation, angiographic thickening in GGO, paving stone
sign, bilateral and subpleural distribution of the patients that
were diagnosed with COVID-19, it was suggested that these CT
features may be useful for the diagnosis of COVID-19. Among them,
GGO or GGO and consolidation exhibited the highest clinical
diagnostic value.
In conclusion, CT was indicated to represent not
only a diagnostic tool for COVID-19, but also an evaluation tool
for the treatment process. Although not all patients with COVID-19
exhibited typical CT features, the majority of CT scans presented
similar features. CT is a quicker method than viral nucleic acid
detection, which may generate false negative results and often
requires repetition. The results of the present study indicated
that the patients with COVID-19 exhibited specific clinical
symptoms, laboratory examination results and CT characteristics.
The male patients with contact history in the epidemic area were
indicated to exhibit fever and cough symptoms. The results of the
current study suggested that when the laboratory tests of the
aforementioned patients present normal/low white blood cell counts,
low lymphocyte ratios and increased CRP, a CT scan should be
recommended. Moreover, when the CT scan indicates a multifocal GGO
with subpleural and bilateral distribution in the lungs, which is
accompanied by angiographic thickening in GGO and paving stone
sign, whether the virus nucleic acid test is positive or negative,
COVID-19 should be considered and medical isolation and observation
should be performed.
Acknowledgements
Not applicable.
Funding
The current study was funded by Clinical Research
Fund of Qiqihar Medical Academy (grant no. QMSI2019L-16).
Availability of data and materials
The datasets used and analyzed during the present
study are available from the corresponding author on reasonable
request.
Authors' contributions
DW participated in the project design and research,
performed the statistical analysis, and was responsible for
drafting and revision of the manuscript. YW and GD participated in
the project design and coordination, assisted in writing the
manuscript and helped with the statistical analysis. JH was
responsible for sample collection. QW and FD performed the
virological analysis and helped with the drafting of the
manuscript. BJ, QZ, TZ and BL performed the CT analysis and sample
collection and participated in performing the statistical analysis.
All authors read and approved the final manuscript.
Ethics approval and consent to
participate
The study protocol was approved by the Regional
Ethics Committee for Clinical Research of the Second Affiliated
Hospital of Qiqihar Medical College (approval no. QMC-2020013). All
patients provided written informed consent.
Patient consent for publication
Written informed consent was obtained from all
patients or their legal guardians for the use of their CT images
and personal data in the current study.
Competing interests
The authors declare that they have no competing
interests.
References
|
1
|
Carlos WG, Dela Cruz CS, Cao B, Pasnick S
and Jamil S: Novel Wuhan (2019-nCoV) coronavirus. Am J Respir Crit
Care Med. 201:P7–P8. 2020.PubMed/NCBI View Article : Google Scholar
|
|
2
|
World Health Organization: Middle East
Respiratory Syndrome Coronavirus (MERS-CoV). November, 2019.
urihttp://www.who.int/emergencies/mers-cov/en/simplehttp://www.who.int/emergencies/mers-cov/en/.
Accessed January 19, 2020.
|
|
3
|
World Health Organization: Novel
Coronavirus-China. urihttp://www.who.int/csr/don/12-january-2020-novel-coronavirus-china/en/simplehttp://www.who.int/csr/don/12-january-2020-novel-coronavirus-china/en/.
Accessed January 19, 2020.
|
|
4
|
Chai X, Hu L, Zhang Y, Han W, Lu Z, Ke A,
Zhou J, Shi G, Fang N, Fan J, et al: Specific ACE2 expression in
cholangiocytes May cause liver damage after 2019-nCoV infection.
BioRxiv: Feb 4, 2020. doi: org/10.1101/2020.02.03.931766.
|
|
5
|
Yu F, Du L, Ojcius DM, Pan C and Jiang S:
Measures for diagnosing and treating infections by a novel
coronavirus responsible for a pneumonia outbreak originating in
Wuhan, China. Microbes Infect. 22:74–79. 2020.PubMed/NCBI View Article : Google Scholar
|
|
6
|
Huang C, Wang Y, Li X, Ren L, Zhao J, Hu
Y, Zhang L, Fan G, Xu J, Gu X, et al: Clinical features of patients
infected with 2019 novel coronavirus in Wuhan, China. Lancet.
395:497–506. 2020.PubMed/NCBI View Article : Google Scholar
|
|
7
|
People's Daily Online. Wuhan is expected
to send 15 million passengers during Spring Festival in 2020 (In
Chinese). December 28, 2019. urihttp://hb.people.com.cn/n2/2019/1228/c194063-33671662.htmlsimplehttp://hb.people.com.cn/n2/2019/1228/c194063-33671662.html.
Accessed January 2, 2020.
|
|
8
|
The 2019-nCoV Outbreak Joint Field
Epidemiology Investigation Team. Li Q: An outbreak of NCIP
(2019-nCoV) infection in China-Wuhan, Hubei Province, 2019-2020.
China CDC Weekly. 2:79–80. 2020.
|
|
9
|
Li Q, Guan X, Wu P, Wang X, Zhou L, Tong
Y, Ren R, Leung KS, Lau EH, Wong JY, et al: Early transmission
dynamics in Wuhan, China, of novel coronavirus-infected pneumonia.
N Engl J Med. 382:1199–1207. 2020.PubMed/NCBI View Article : Google Scholar
|
|
10
|
Yan L and Xia L: Coronavirus disease 2019
(COVID-19): Role of chest CT in diagnosis and management. AJR Am J
Roentgenol. 214:1280–1286. 2020.PubMed/NCBI View Article : Google Scholar
|
|
11
|
Lei J, Li J, Li X and Qi X: CT imaging of
the 2019 novel coronavirus (2019-nCoV) pneumonia. Radiology.
295(18)2020.PubMed/NCBI View Article : Google Scholar
|
|
12
|
Read JM, Bridgen JR, Cummings DA, Ho A and
Jewell CP: Novel coronavirus 2019-nCoV: Early estimation of
epidemiological parameters and epidemic predictions. medRxiv: Jan
28, 2020 (Epub ahead of print). doi:
10.1101/2020.01.23.20018549.
|
|
13
|
Liu T, Hu J, Kang M, Lin L, Zhong H, Xiao
J, He G, Song T, Huang Q, Rong Z, et al: Transmission dynamics of
2019 novel coronavirus (2019-nCoV). bioRxiv: Jan 26, 2020 doi:
urihttps://doi.org/10.1101/2020.01.25.919787simplehttps://doi.org/10.1101/2020.01.25.919787.
|
|
14
|
Kanne JP: Chest CT findings in 2019 novel
coronavirus (2019-nCoV) infections from Wuhan, China: Key Points
for the Radiologist. Radiology. 295:16–17. 2020.PubMed/NCBI View Article : Google Scholar
|
|
15
|
Cheng Z, Lu Y, Cao Q, Qin L, Pan Z, Yan F
and Yang W: Clinical features and Chest CT manifestations of
coronavirus disease 2019 (COVID-19) in a single-center study in
Shanghai, China. AJR Am J Roentgenol. 215:121–126. 2020.PubMed/NCBI View Article : Google Scholar
|
|
16
|
Chung M, Bernheim A, Mei X, Zhang N, Huang
M, Zeng X, Cui J, Xu W, Yang Y, Fayad ZA, et al: CT imaging
features of 2019 novel coronavirus (2019-nCoV). Radiology.
295:202–207. 2020.PubMed/NCBI View Article : Google Scholar
|
|
17
|
Shi H, Han X, Jiang N, Cao Y, Alwalid O,
Gu J, Fan Y and Zheng C: Radiological findings from 81 patients
with COVID-19 pneumonia in Wuhan, China: A descriptive study.
Lancet Infect Dis. 20:425–434. 2020.PubMed/NCBI View Article : Google Scholar
|
|
18
|
Patrick DM, Petric M, Skowronski DM,
Guasparini R, Booth TF, Krajden M, McGeer P, Bastien N, Gustafson
L, Dubord J, et al: An outbreak of human coronavirus OC43 infection
and serological cross-reactivity with SARS coronavirus. Can J
Infect Dis Med Microbiol. 17:330–336. 2006.PubMed/NCBI View Article : Google Scholar
|
|
19
|
Zhao S, Ran J, Musa SS, Yang G, Wang W,
Lou Y, Gao D, Yang L, He D and Wang MH: Preliminary estimation of
the basic reproduction number of novel coronavirus (2019-nCoV) in
China, from 2019 to 2020: A data-driven analysis in the early phase
of the outbreak. Int J Infect Dis. 92:214–217. 2020.PubMed/NCBI View Article : Google Scholar
|
|
20
|
Wang D, Hu B, Hu C, Zhu F, Liu X, Zhang J,
Wang B, Xiang H, Cheng Z, Xiong Y, et al: Clinical characteristics
of 138 hospitalized patients with 2019 novel coronavirus-infected
pneumonia in Wuhan, China. JAMA. 323:1061–1069. 2020.PubMed/NCBI View Article : Google Scholar
|
|
21
|
Pan Y, Guan H, Zhou S, Wang Y, Li Q, Zhu
T, Hu Q and Xia L: Initial CT findings and temporal changes in
patients with the novel coronavirus pneumonia (2019-nCoV): A study
of 63 patients in Wuhan, China. Eur Radiol. 30:3306–3309.
2020.PubMed/NCBI View Article : Google Scholar
|
|
22
|
Xu H, Zhong L, Deng J, Peng J, Dan H, Zeng
X, Li T and Chen Q: High expression of ACE2 receptor of 2019-nCoV
on the epithelial cells of oral mucosa. Int J Oral Sci.
12(8)2020.PubMed/NCBI View Article : Google Scholar
|
|
23
|
Wang D, Wu C, Gao J, Zhao S, Ma X, Wei B,
Feng L, Wang Y and Xue X: Comparative study of primary pulmonary
cryptococcosis with multiple nodules or masses by CT and pathology.
Exp Ther Med. 16:4437–4444. 2018.PubMed/NCBI View Article : Google Scholar
|