Introduction
Traditional Chinese Medicine (TCM) has become
increasingly popular worldwide, due to its reported therapeutic
effects and low toxicity. As a result, it is vital to develop novel
types of TCMs and to understand the active compounds used during
their clinical application (1-3).
Fever is a pathological phenomenon that causes the set point of the
thermoregulatory center to increase, resulting in the body
producing more heat than it dissipates, thus raising the body
temperature (4). Heat sources can
be divided into endogenous and exogenous. Endogenous heat sources
are also known as leukocyte heat sources (such as interleukins and
interferons), which can act on the thermoregulatory center through
the blood-brain barrier, causing the thermoregulatory point to
increase. Exogenous heat sources are primarily biological
macromolecules (such as proteins) that can stimulate neutrophils,
eosinophils and mononuclear phagocytes to produce and release
endogenous heat sources, causing the body temperature to increase
(5,6). The animal body is extremely sensitive
to lipopolysaccharide (LPS). Even small amounts of endotoxin (~5
ng/kg) can cause the body temperature to rise and fever to be
maintained for >4 h (7,8). LPS is a component of the outer
membrane of the cell wall of Gram-negative bacteria. It is released
after the death of bacteria and has a wide range of biological
activities. It can act on monocytes and macrophages to produce
interleukins, tumor necrosis factor and other cytokines. These
cytokines act on the thermoregulatory center in the host
hypothalamus, thereby increasing body temperature and causing
inflammation, as well as other pathological changes (9-11).
The diversity of TCM arises from its multi-component
and multi-target pharmacodynamic activity and treatment
characteristics. Early research has focused on the potential
antipyretic effect of compounds used in TCM and their underlying
mechanism of action (12-18).
Clarifying the efficacy and function of TCM is crucial to ensuring
drug safety and quality control. The spectrum-effect correlation is
studied to discern the correlation between fingerprint (chemical,
biological and metabolic) with pharmacodynamic efficacy. This
allows the identification of active components in TCM, and the
formulation of standards to assess their internal quality (19). The spectrum-effect relationship has
also been applied in multi-field research, such as single herb
treatment, classic couplet medicines, compound compatibility,
processing mechanism and technology optimization (20-24).
In addition, it can be used to identify key substances, optimize
the ratio of ingredients, improve preparation technology and track
various characteristics, providing insight into novel approaches
for the development of novel TCM drugs (19,25-31).
Lonicera japonica Flos is prepared from a
dried flower bud or flower collected from the first harvest of
Lonicera japonica blooms. Its chemical components include
organic acids, flavonoids, triterpenoid saponins, iridoid terpenes,
volatile oils and trace elements (32). The principal active ingredients are
chlorogenic acid and luteolin, which may be quantified to ensure
quality control of the preparation (33). Previous studies have reported that
Lonicerae japonica Flos has numerous pharmacological
effects, such as broad-spectrum antibacterial, antiviral,
immunityenhancing, antioxidant, antipyretic and anti-inflammatory
effects, as well as liver protection, hypoglycemia and anti-tumor
activity (32,34-36).
Lonicera japonica Thunb. (LJT), Lonicera
fulvotomentosa Hsu et S. C. Cheng (LFH) and Lonicera
macranthoides Hand.-Mazz. (LMH) represent different species of
Lonicerae japonica Flos. Although their efficacy is the
same, their chemical compositions differ (37).
The quality of TCM drugs has a direct impact on
their efficacy (31). In the
present study, LPS endotoxin was injected intraperitoneally to
successfully establish a rat model of pyrotoxemia. Physiological
and biochemical indexes, such as cAMP and arginine vasopressin
(AVP) levels in the hypothalamus and serum endotoxin (ET) levels
were measured, as previously described (38-40).
The antipyretic effect and the anti-endotoxin activity of different
species of Lonicera japonica were also examined. The present
study provided a theoretical basis for the molecular mechanism
underlying the antipyretic effects and anti-endotoxin activityof
different species of Lonicera japonica and the development
of safer and more effective antipyretic TCM drugs.
Materials and methods
Instruments, reagents and animals
An Agilent 1260 HPLC system (Agilent Technologies,
Inc.) with a diode array detector (DAD) was used for analytical
chemistry experiments and data processing. Milli-Q ultrapure water
(Merck KGaA) was used for the preparation of test samples of
standards. Additional instruments included the LGJ-12 Freeze dryer
(Beijing Songyuan Huaxing Technology Development Co., Ltd.), the
011 Electronic thermometer (Henan Muxiang Veterinary Pharmaceutical
Co. Ltd.), the 1510 microplate reader (Thermo Fisher Scientific,
Inc.) and the 5415D tabletop high-speed centrifuge (Eppendorf).
LJT, LFH and LMH were collected from different
villages in Guizhou (China) and identified by Professor Wei
Shenghua (Guizhou University of Traditional Chinese Medicine).
These samples were: i) LJT (sample no. 20170610; Suiyang, China);
ii) LFH (sample no. 20170612; Qingzhen, China); and iii) LMH
(sample no. 20170611; Daozhen, China). The 12 different villages of
LJT were as follows: 1a-Xingtai, 1b-Xingtai, 2-Xinxiang, 3-Huaihua,
4a-Suiyang, 4b-Suiyang, 4c-Suiyang, 4d-Suiyang, 5a-Linyi, 5b-Linyi,
5c-Linyiand 6-Xiushan. The 30 different villages of LFH were as
follows: 1-Caiguan, 2-Baling, 3-Maoying, 4-Yingpan, 5-Changshun,
6-Qianxi, 7-Yumo, 8-Pingba, 9a-Fengxiang, 9b-Fengxiang,
9c-Fengxiang, 10a-Yingtaowan, 10b-Yingtaowan, 11-Gantian,
12-Zhengchang, 13-Huangyangtai, 14-Yongle, 15-Yuxi, 16-Dagan,
17-Hekou, 18-Daba, 19-Zhuoshui, 20-Shichao, 21-Dejiang, 22-Sinan,
23-Dushan, 24-Tianzhu, 25a-Songtao, 25b-Songtao and 26-Xiaoguan.
The 12 different villages of LMH were as follows: 1a-Xingren,
1b-Xingren, 2-Huilong, 3-Mamaya, 4-Xingyi, 5-Pengzuo, 6-Dewo,
7-Waina, 8-Hongni, 9-Zhenfeng, 10-Qingzhen and 11-Anlong.
The standards used were as follows: i)
Neochlorogenic acid (NCA; cat. no. PS0601-0025); ii) chlorogenic
acid (CA; cat. no. PS0131-0025); iii) cryptochlorogenic acid (CCA;
cat. no. PS0775-0025); iv) secologanic acid (SLA; cat. no.
PS2210-0025); v) secoxyloganin (SL; cat. no. PS2215-0020); vi)
isochlorogenic acid B (ICAB; cat. no. PS0067-0025); vii)
isochlorogenic acid A (ICAA; cat. no. PS0066-0025); and viii)
isochlorogenic acid C (ICAC; cat. no. PS0068-0025). All standards
were obtained from Chengdu Push Bio-technology Co., Ltd.). The
purity of each standard was ≥0.98. Acetonitrile, methanol and
formic acid were of chromatographic grade, whereas the water used
was ultrapure. LPS was purchased from Hefei Domei Biology Co., Ltd.
(cat. no. L2880; Sigma-Aldrich; Merck KGaA). The cAMP (cat. no.
LE-H3962), AVP (cat. no. LE-H1112) and ET (cat. no. LE-H8973) ELISA
kits (rat) were obtained from Heifei Laier Biological Technology
Co., Ltd.
Specific pathogen free Sprague-Dawley rats (age, 2
months, n=96), weighing an average of 245±15 g (48 males and 48
females), were purchased from Chengdu Animal Health Supervision
Institute. The rats were housed in a temperature-controlled room
(22±2˚C) with 60±10% humidity on a 12-h light/dark cycle and
unrestricted access to food and water.
Preparation of the sample
solution
LJT, LFH and LMH extracts were prepared using
distilled water as the solvent in a 1:20 mass to volume ratio. The
extracts were incubated three times at 100˚C for 90 min each time,
filtered twice, then dried at 60˚C after concentration.
With a volume of 20 ml/kg, LJT, LFH and LMH solution
samples were prepared in distilled water for oral administration.
The high dose was 20 g/kg body weight (equivalent to 4 times the
clinical dose), the medium dose was 10 g/kg body weight (twice the
clinical dose) and the low dose was 5 g/kg body weight (clinical
dose). With a volume of 20 ml/kg and the crude drug dosage of 6.75
g/kg, banlangen granules (Radix isatidis extract; Guangzhou
Baiyunshan Pharmaceutical Holdings Co., Ltd.) was prepared for oral
administration as a positive control. The blank and model groups
were given equal volumes of distilled water.
LJT, LFH and LMH solutions (1.0 g/ml) were prepared
in 50% methanol. NCA, CA, CCA, SLA, SL, ICAB, ICAA and ICAC were
also dissolved in 50% methanol. The prepared solutions were NCA
(0.75 mg/ml), CA (1.08 mg/ml), CCA (0.72 mg/ml), SLA (0.76 mg/ml),
SL (0.52 mg/ml), ICAB (1.07 mg/ml), ICAA (0.84 mg/ml) and ICAC
(1.21 mg/ml). Both the samples and standard solutions were filtered
through a 0.45-µm filter prior to analysis.
LC conditions
An Agilent Eclipse XDB-C18 column (3.9x150 mm; 5 µm;
Agilent Technologies, Inc.) was used to analyze the samples. Data
analysis was performed on an Agilent 1260 HPLC system (Agilent
Technologies, Inc.) equipped with a diode array detector. The
mobile phase consisted of acetonitrile (A) and 0.4%
(v/v) acetic acid aqueous solution (B), and was
pumped at a flow rate of 0.8 ml/min. The column temperature was
maintained at 35˚C. The injection volume of each sample was 10 µl.
The chromatograms were monitored at 254 nm. The gas was
N2 and its flow rate was 1.60 SLM with the DAD.
The gradient elution program of LJT was as follows:
5-6% A, 0-10 min; 6% A, 10-12 min; 6-7% A, 12-20 min; 7-8% A, 20-25
min; 8-10% A, 25-30 min; 10-12% A, 30-35 min; 12-14% A, 35-40 min;
14% A, 40-45 min; 14-16% A, 45-50 min; 16% A, 50-55 min; 16-18% A,
55-60 min; 18-20% A, 60-65 min; 20-30% A, 65-70 min; 30-40% A,
70-75 min; 40-60% A, 75-80 min; 60-5% A, 80-85 min; and 5% A, 85-90
min.
The gradient elution program of LMH was as follows:
5-10% A, 0-10 min; 10-15% A, 10-20 min; 15% A, 20-25 min; 15-20% A,
25-30 min; 20-25% A, 30-40 min; 25-30% A, 40-50 min; 30-40% A,
50-60 min; 40% A, 60-70 min; 40-5% A, 70-75 min; and 5% A, 75-80
min.
The gradient elution program of LFH was as follows:
5-10% A, 0-10 min; 10-15% A, 10-20 min; 15% A, 20-30 min; 15-20% A,
30-40 min; 20% A, 40-50 min; 20-30% A, 50-60 min; 30-40% A, 60-70
min; 40% A, 70-75 min; 40-5% A, 75-80 min; and 5% A, 80-85 min.
For quantitative analysis, the mobile phase was
pumped at a flow rate of 1.0 ml/min. The column temperature was
maintained at 30˚C. In addition, the gradient elution program was
the same as LMH. All other conditions were kept the same.
Fingerprint evaluation
LC fingerprints of the samples collected from
different species were established and matched automatically using
the Similarity Evaluation System for Chromatographic Fingerprint of
TCM (version 2012; China Pharmacopoeia Committee). Furthermore,
cluster analysis using SPSS (version 22; IBM Corp.) was applied to
evaluate the quality of the samples from different species.
Principal component analysis
(PCA)
PCA is a multivariate statistical method that can
retain sufficient information from data acquisition. In the present
study, characteristic peaks from LC chromatograms were screened
using PCA in order to identify active constituents based on
spectrum-effect relationships. PCA was conducted using SPSS
software (version 22.0; IBM Corp.).
Establishment of rat models of LPS
toxemia
Animal experimentation was initiated following 3
days of acclimatization. The rats were divided into 12 groups (8
per group, with equal numbers of males and females). Groups 1-9
received high, medium and low doses of water extracts from LJT, LFH
and LMH. The high dose was 27 g/kg body weight (20 times the
clinical dose), the medium dose was 13.5 g/kg (10 times the
clinical dose) and the low dose was 6.75 g/kg (5 times the clinical
dose). Group 10 was the fever model group, which was administered
water extract by gavage daily for 6 days. Group 12 (blank) received
no treatment and group 11 (positive control) received low dosage
normal saline and 6.75 g/kg Banlangen Granules, which were
administered by gavage daily for 6 days. The rats were fasted
overnight with free access to water prior to administration of the
test solutions. On day 7, the model was considered to be
established successfully when after 1 h, 100 µg/kg LPS endotoxin
was injected into the abdominal cavity of rats in groups 1-11. The
protocol was approved by the Animal Ethical Committee of Guizhou
University. All animals were treated according to the guidelines of
the National Institutes of Health (41). All procedures were performed under
sodium pentobarbital anesthesia (intraperitoneal injection at a
dose of 50 mg/kg).
Tissue lysate ELISA
Following anesthesia the rats were sacrificed by
decapitation 6 h after the peak of fever. The whole brain and the
hypothalamus tissue were removed quickly and placed in an ice bath.
Then, 0.5 ml cell lysis buffer (cat. no. 87792; Thermo Fisher
Scientific, Inc.) was added to 50 mg fresh hypothalamus tissue.
After lysis at room temperature for 30 min, sonication was
continued for 1 min. The samples were centrifuged (3,662 x g; 15
min; 4˚C), and the supernatants were separated for testing. In each
standard well, 50 µl standard of different concentrations were
added. In each sample well, 10 µl testing sample and 40 µl sample
diluent were added. In blank wells, nothing was added. In all wells
except the blanks, 100 µl horseradish peroxidase (HRP) labeled
detection antibody was added. cAMP (cat. no. LE-H3962), AVP (cat.
no. LE-H1112) and ET (cat. no. LE-H8973) ELISA kits (rat) were
obtained from Heifei Lyle Biotech Co., Ltd. The protocol was in
accordance with the manufacturer's instructions. The plates were
sealed with sealing film, then incubated at 37˚C for 1 h. After
discarding the excess liquid, each well was filled with detergent
five times for 1 min each time. In each well, 50 µl substrate A and
50 µl substrate B were added to each well, and the plates were
incubated at 37˚C in the dark for 15 min. After incubation, 50 µl
termination solution was added to each well. After 15 min at 37˚C,
the optical density (OD) value of each well was measured using a
1510 microplate reader at 450 nm. A standard curve was drawn using
the OD values obtained from the standards. According to this curve
equation, the concentration of each sample was calculated.
Serum ELISA
Rats were anesthetized with sodium pentobarbital 6 h
after the peak of fever, and 5 ml blood was obtained from the
abdominal aorta. The samples were centrifuged (845 x g; 30 min,
4˚C) in order to obtain serum for testing. The concentrations of ET
(cat. no. LE-H8973) in serum samples was determined using a double
antibody sandwich ELISA, for which the determination method was the
same as that of cAMP (cat. no. LE-H3962) and AVP (cat. no.
LE-H1112). All kits were obtained from Heifei Lyle Biotech Co.,
Ltd.
Statistical analysis
Two-tailed paired t-tests and one-way ANOVA followed
by Tukey's post hoc test were used to identify statistically
significant between groups. P<0.05 (95% confidence interval) was
considered to indicate a statistically significant difference.
Pearson's correlation coefficient was used to calculate the
relative peak areas, which corresponded with antipyretic effect and
anti-endotoxin activity of the samples. Correlation coefficients
>0.3 were considered significant (P<0.05), whereas
correlation coefficients >0.5 were considered highly
significantly (P<0.01). PCA was used to evaluate characteristic
peak areas in the chromatograms of the samples from different
species. Bivariate analysis was used to assess the correlation of
peak areas with their antipyretic effect and anti-endotoxin
activity. Statistical analysis was conducted using SPSS software
(version 22.0; IBM Corp.). Data are presented as the mean ± SD and
6 experimental repeats of each test were performed.
Results
Establishment and evaluation of
fingerprint
The relative standard deviation of the retention
time and peak area of characteristic peaks were 0.041 and 0.082%
for precision, 0.390 and 0.173% for reproducibility, and 0.098 and
0.103% for stability. The similaritiesof the chromatograms were all
>0.9. These findings indicated that the present LC method of
fingerprint establishment was reliable.
Cluster analysis
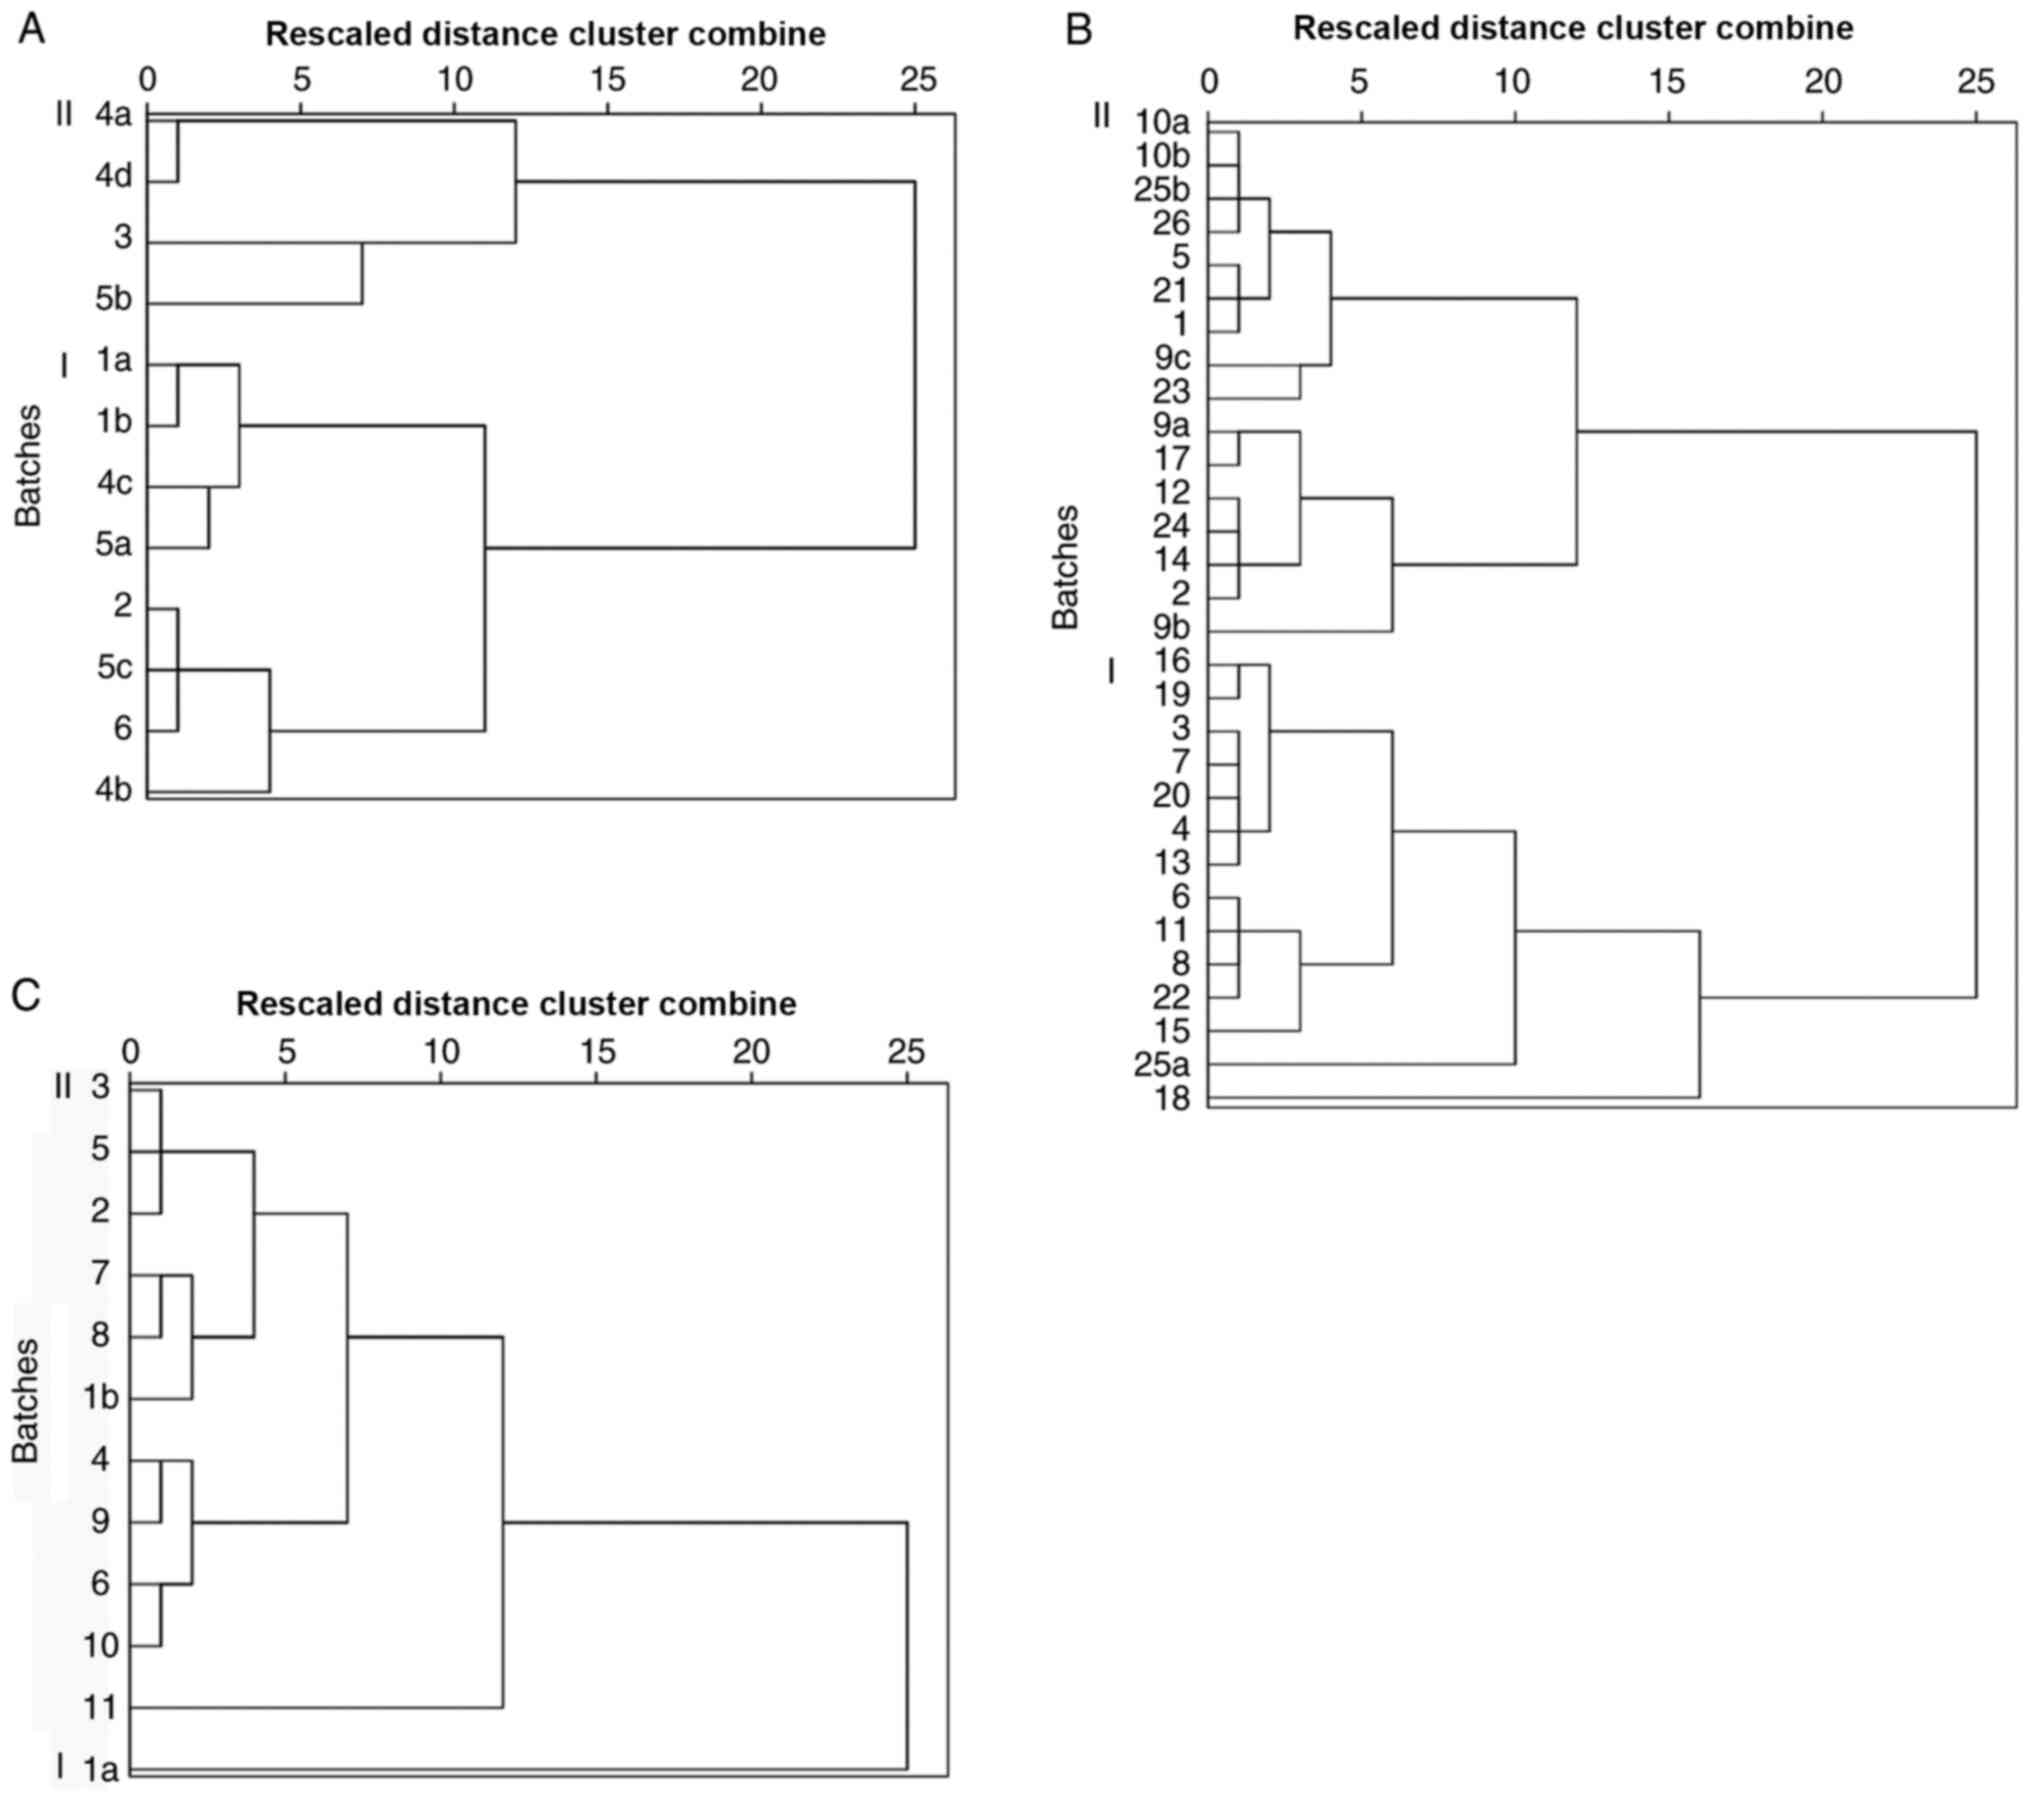
The results of cluster analysis are presented in
Fig. 1. The 12 different batches of
LJT were divided into two categories. The first category consisted
of 4b, 6, 5c, 2, 5a, 4c, 1b and 1a. The second category consisted
of 5b, 3, 4d and 4a. The 30 different batches of LFH were divided
into two categories. The first category consisted of 18, 25, 15,
22, 8, 11, 6, 13, 4, 20, 7, 3, 19 and 16. The second category
comprised 9b, 2, 14, 24, 12, 17, 9a, 23, 9c, 1, 21, 5, 26, 25b, 10b
and 10a. The 12 different batches of LMH were divided into two
categories as follows: i) a; and ii) 11, 10, 6, 9, 4, 1b, 8, 7, 2,
5 and 3. Although they were clustered into two categories, the
differences were not significant, which indicated that there was no
marked difference between different species of LJT, LFH and
LMH.
Qualitative and quantitative analysis
of the eight main chemical constituents
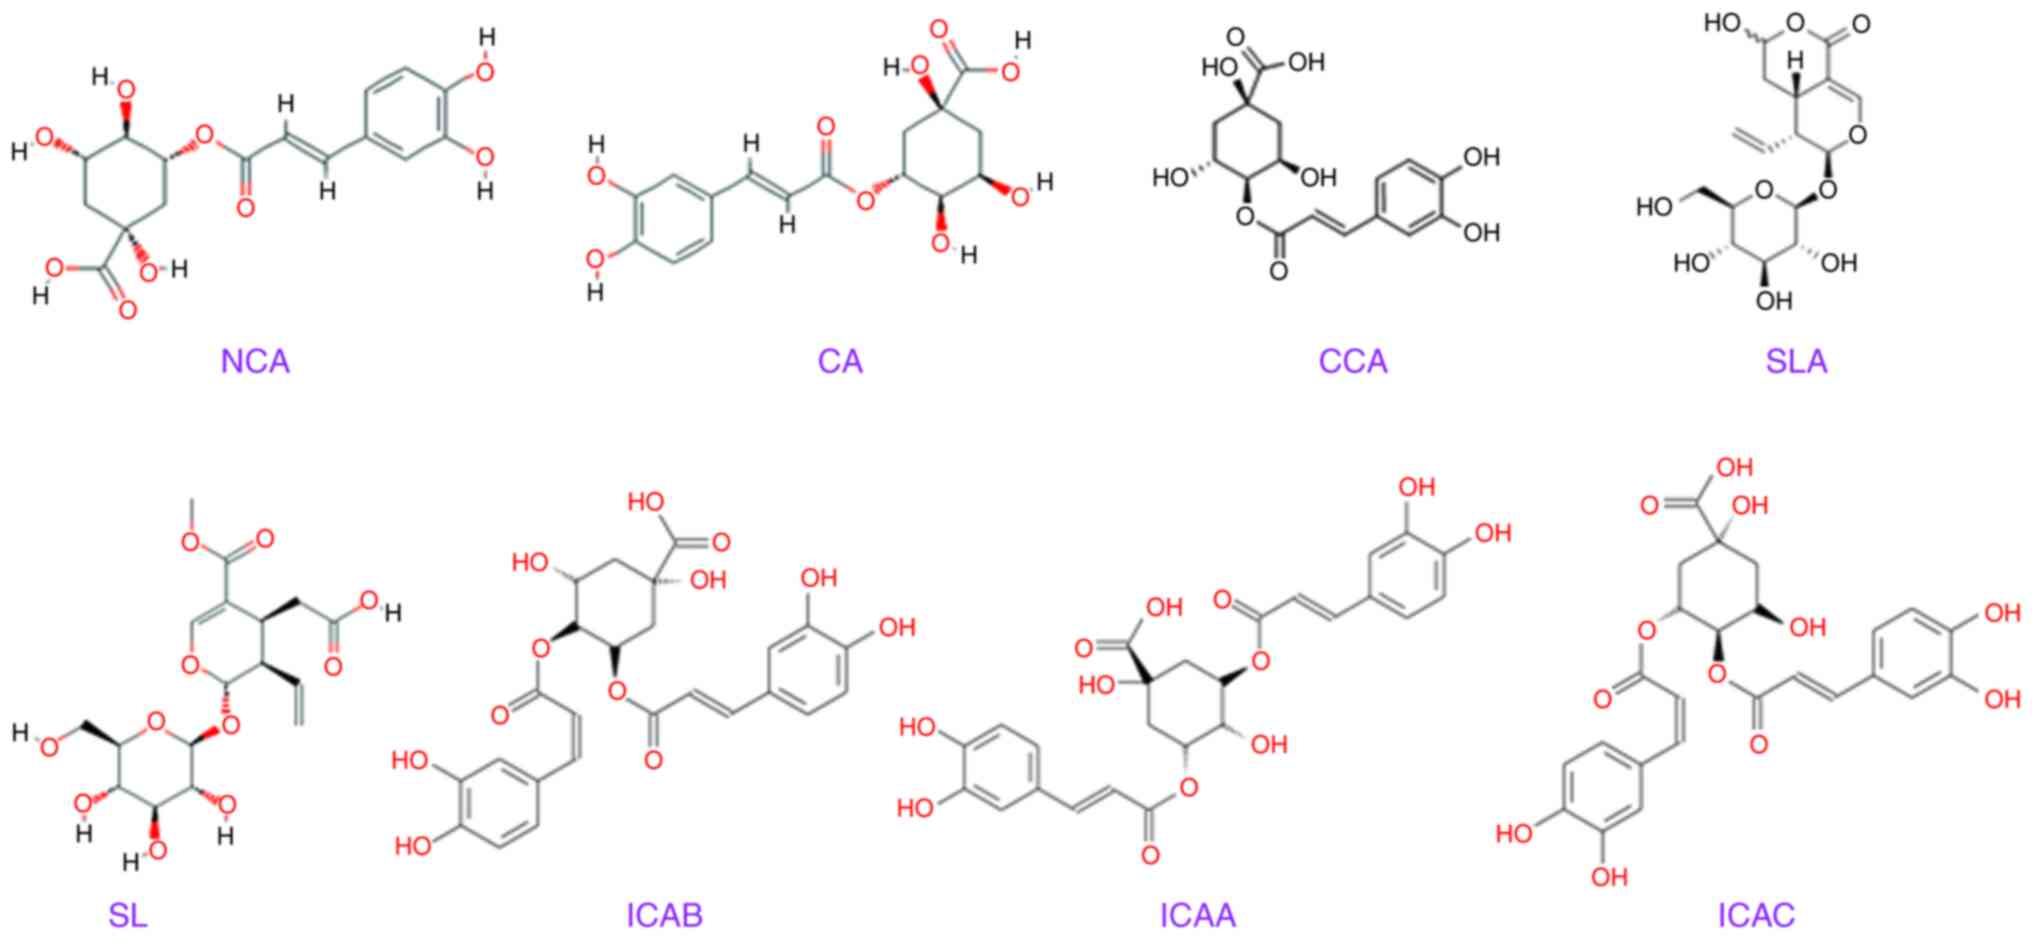
Under quantitative analysis conditions, the linear
regression equations for NCA, CA, CCA, SLA, SL, ICAB, ICA and ICAC
were as follows: i) NCA, Y=1104.2X+26.119 (r=1) in the
concentration range of 1.50-13.50 µg/ml; ii) CA, Y=1105.4X+15.676
(r=1) in the concentration range of 2.59-17.28 µg/ml; iii) CCA,
Y=973.46X+5.8348 (r=1) in the concentration range of 0.72-12.96
µg/ml; iv) SLA, Y=598.22X+28.842 (r=0.9998) in the concentration
range of 0.76-12.96 µg/ml; v) SL, Y=509.85X-2.865 (r=1) in the
concentration range of 1.04-9.36 µg/ml; vi) ICAB, Y=1277.9X+2.5534
(r=1) in the concentration range of 2.14-19.26 µg/ml; vii) ICAA,
Y=1169.4X-1.0839 (r=1) in the concentration range of 0.84-15.12
µg/ml; and viii) ICAC, Y=1588.8X+8.6825 (r=1) in the concentration
range of 2.24-21.78 µg/ml. These results all indicated a linear
relationship (Table I). The
structures of eight main chemical constituents identified in
different species of LJT, LFH and LMH are presented in Fig. 2.
 | Table IQuantitative analysis of the eight
main chemical constituents from different species of LJT, LFH and
LMH. |
Table I
Quantitative analysis of the eight
main chemical constituents from different species of LJT, LFH and
LMH.
| Compound | LJT (mg/g) | LFH (mg/g) | LMH (mg/g) |
|---|
| NCA | 19.33±3.35 | 11.05±0.34 | 33.62±0.91 |
| CA | 48.48±8.05 | 19.81±0.60 | 64.78±1.86 |
| CCA | 26.05±4.27 | 18.40±0.56 | 47.49±1.53 |
| SLA | 29.42±5.97 | 29.94±0.95 | 0.00 |
| SL | 12.92±2.32 | 39.90±0.88 | 27.50±1.21 |
| ICAB | 22.28±13.85 | 53.46±1.58 | 27.68±0.78 |
| ICAA | 13.85±2.28 | 30.89±0.84 | 17.22±0.32 |
| ICAC | 24.58±4.22 | 52.55±1.44 | 25.60±0.54 |
Determination of the antipyretic
effect and anti-endotoxin activity
There was a highly significant difference in body
temperature between the normal groups and the model control group
(Table II), indicating that the
rat endotoxin model was successfully established. Compared with the
model group, there was significant difference in antipyretic effect
in each experimental group. The extract significantly inhibited the
increase in cAMP and its secretion, thus reducing the heat output
of the body. Compared with the model group, there were highly
significant differences in the experimental groups 2, 3, 5, 6, 7, 8
and 9 (Table II). This indicated
that the extract promoted an increase in the levels of the
antidiuretic hormone AVP to different degrees. Compared with the
model group, there was a highly significant difference in all 9
experimental groups. Thus, the extract had an anti-endotoxin effect
in vivo.
| Table IIcAMP, AVP and ET content in rats from
different experimental groups (n=8 rats/group). |
Table II
cAMP, AVP and ET content in rats from
different experimental groups (n=8 rats/group).
| No | Group | cAMP content
(nmol/ml) | AVP content
(pg/ml) | ET content
(EU/ml) |
|---|
| 1 | LJT (6.75
g/kg) |
24.40±1.598a,d |
23.28±2.12b |
164.13±12.98b,c |
| 2 | LJT (13.5
g/kg) |
21.85±0.669b |
24.96±0.91b,c |
146.62±10.03b,c |
| 3 | LJT (27 g/kg) |
19.73±1.084b,c |
27.78±1.58b |
131.15±10.51b,c |
| 4 | LFT (6.75
g/kg) |
24.85±1.058a |
24.22±1.87b,c |
178.34±13.83b,c |
| 5 | LFT (13.5
g/kg) |
22.16±0.934b |
25.88±2.59b,c |
159.20±14.28b,c |
| 6 | LFT (27 g/kg) |
20.66±0.762b,c |
27.20±3.08b,c |
146.60±5.29b,c |
| 7 | LMT (6.75
g/kg) |
22.45±1.719b |
23.69±2.27b,c |
153.23±12.93b,c |
| 8 | LMT (13.5
g/kg) |
20.63±1.068b,c |
25.62±2.07b,c |
138.38±6.33b,c |
| 9 | LMT (27 g/kg) |
18.71±1.553b,c |
27.33±1.73b,c |
122.82±10.44b,c |
| 10 | Model (6.75
g/kg) |
25.95±1.175a |
17.88±3.26b,c |
208.68±12.87c |
| 11 | Positive (6.75
g/kg) |
20.64±1.421b |
28.59±1.74b,c |
143.78±9.94b |
| 12 | Blank (6.75
g/kg) |
22.84±0.677b |
22.92±1.83b |
102.80±8.23b |
PCA
As presented in Table
III, the eigenvalues of the first two principal components were
>1, and the contribution rate of the first principal component
was 67.447%, indicating that the first principal componentwas able
to explain 67.447% of the antipyretic effect of different species
of LJT, LFH and LMH. The second principal component could explain
32.553%, and the cumulative contribution rate of the first two
principal components was 100%. Therefore, the first two principal
components were further evaluated. Table III presents the eigen values and
factor loadings of these two principal components. The first
principal component exhibited significant load based on the
eigenvalues of NCA, CA, CCA, ICAB, ICAA and ICAC (>0.8).
Consequently, these six constituents were selected as
representative variables for the antipyretic effect.
| Table IIIEigen values and corresponding
percentages of the variables of antipyretic effect (top two
principal components). |
Table III
Eigen values and corresponding
percentages of the variables of antipyretic effect (top two
principal components).
| | Initial eigen
values | Extraction sums of
squared loadings |
|---|
| Component | Total | Variance (%) | Cumulative (%) | Total | Variance (%) | Cumulative (%) |
|---|
| 1 | 9.443 | 67.447 | 67.447 | 9.443 | 67.447 | 67.447 |
| 2 | 4.557 | 32.553 | 100.000 | 4.557 | 32.553 | 100.000 |
As presented in Table
IV, the eigen values of the first two principal components were
>1, and the contribution rate of the first principal component
was 82.246%. The results indicated that the first principal
component could explain 82.246% of the anti-endotoxin activity of
different species of LJT, LFH and LMH. The second principal
component could explain 17.754%, and the cumulative contribution
rate of the first two principal components was 100%. Therefore, the
first two principal components were evaluated further. Table IV indicates their eigen values and
factor loadings. The first principal component exhibited
significant load based on the eigenvalues of the six constituents
(>0.8). Consequently, NCA, CA, CCA, ICAB, ICAA and ICAC, were
selected as representative variables for anti-endotoxin
activity.
| Table IVEigen values and corresponding
percentages of the variables of anti-endotoxin activity (top two
principal components). |
Table IV
Eigen values and corresponding
percentages of the variables of anti-endotoxin activity (top two
principal components).
| | Initial eigen
values | Extraction sums of
squared loadings |
|---|
| Component | Total | Variance (%) | Cumulative (%) | Total | Variance (%) | Cumulative (%) |
|---|
| 1 | 9.047 | 82.246 | 82.246 | 9.047 | 82.246 | 82.246 |
| 2 | 1.953 | 17.754 | 100.000 | 1.953 | 17.754 | 100.000 |
Bivariate analysis (BA)
The antipyretic effect and anti-endotoxin activity
of these extracts are indicated in Figs. 3 and 4. Based on these results, a total of eight
constituents significantly correlated with the concentration of
cAMP (P<0.05), whereas seven constituents highly significantly
correlated with the concentration of cAMP (P<0.01); a total of
seven constituents significantly correlated with AVP levels
(P<0.05), whereas four constituents highly significantly
correlated with AVP levels (P<0.01). The constituents that
significantly correlated with the concentrations of cAMP and AVP
were NCA, CA, CCA, SL, ICAB, ICAA and ICAC (Fig. 3). These seven constituents exerted
antipyretic effects. A total of eight constituents highly
significantly correlated with ET levels (P<0.01). The
constituents that significantly correlated with ET content were
NCA, CA, CCA, SLA, SL, ICAB, ICAA and ICAC (Fig. 4). Therefore, these eight
constituents were demonstrated to exert anti-endotoxin activity.
The comprehensive findings of the present study verified that
different species of LJT, LFH and LMH exhibited antipyretic effects
and anti-endotoxin activities.
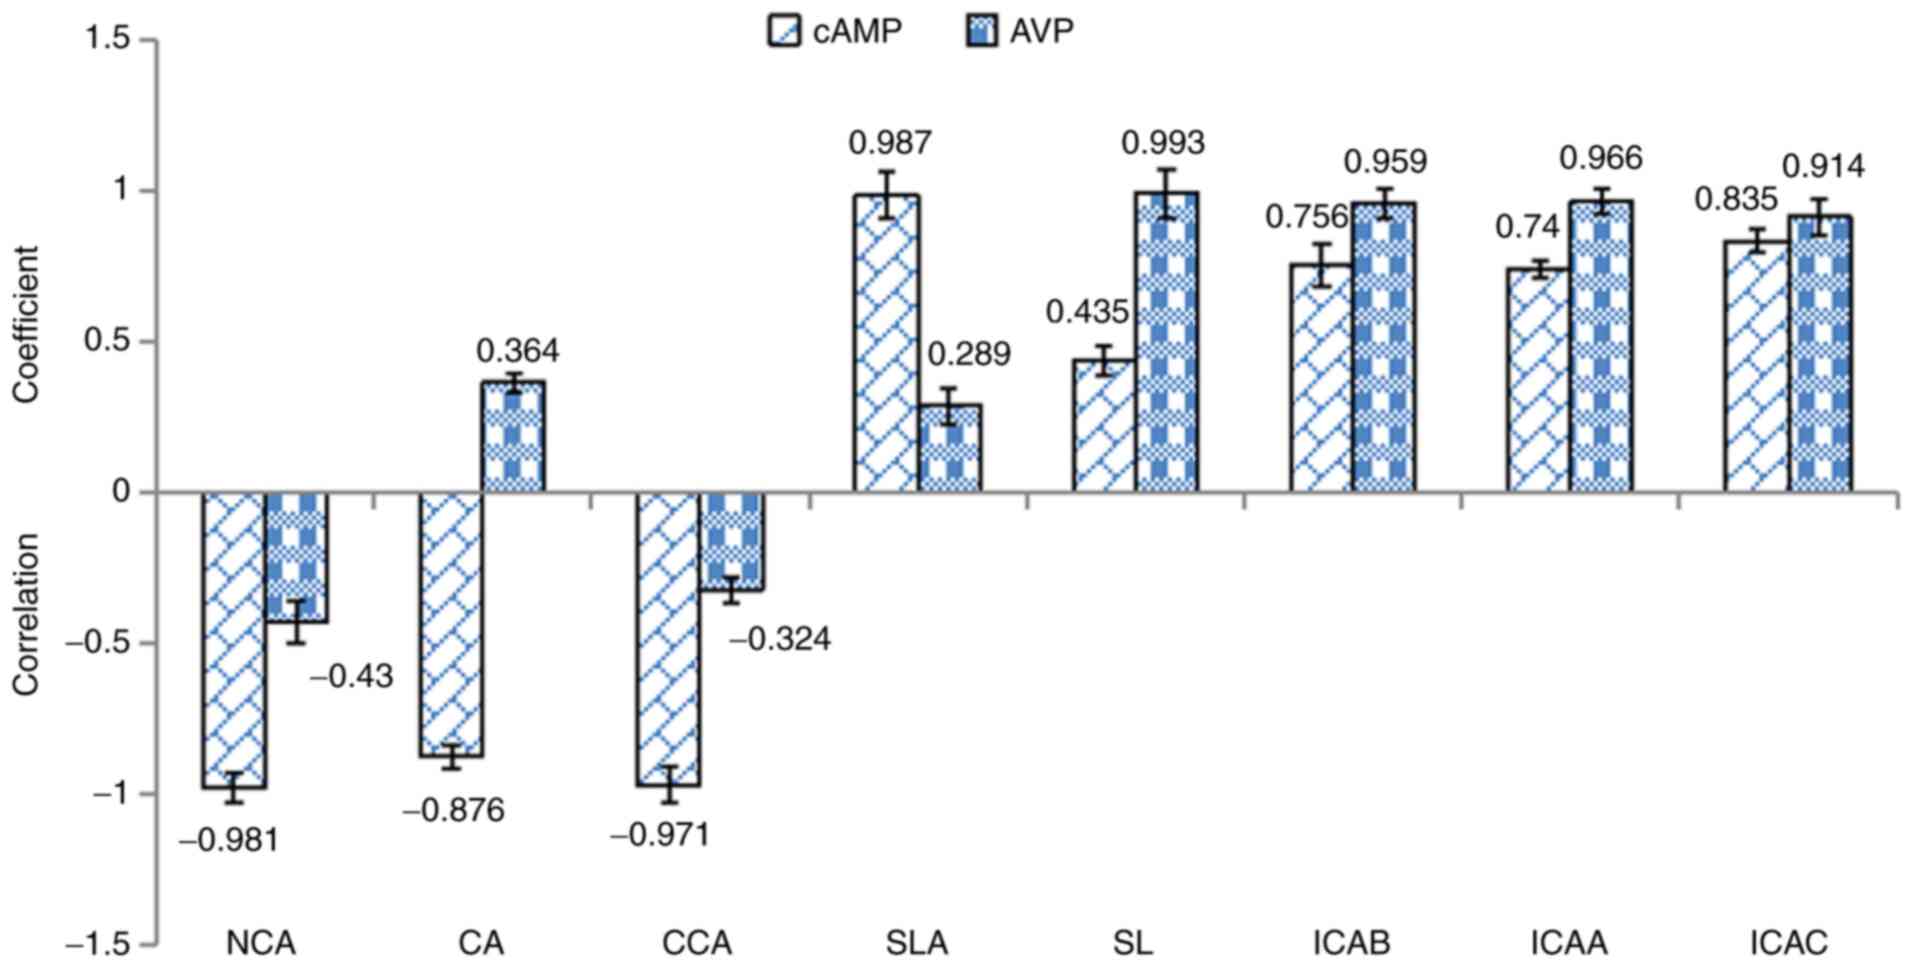 | Figure 3Bivariate analysis of eight main
chemical constituents identified in different species of
Lonicera japonica Thunb., Lonicera fulvotomentosa Hsu
et S. C. Cheng and Loniceramacranthoides Hand-Mazz. with
regards to the antipyretic effect. Correlation coefficients >0.3
or <-0.3 were considered significant (P<0.05), whereas
correlation coefficients >0.5 or <-0.5 were considered highly
significant (P<0.01). NCA, neochlorogenic acid; CA, chlorogenic
acid; CCA, cryptochlorogenic acid; SLA, secologanic acid; SL,
secoxyloganin; ICAB, isochlorogenic acid B; ICAA, isochlorogenic
acid A; ICAC, isochlorogenic acid C; AVP, arginine vasopressin. |
 | Figure 4Bivariate analysis of the eight main
chemical constituents identified in different species of
Lonicera japonica Thunb., Lonicerafulvotomentosa Hsu
et S. C. Cheng and Loniceramacranthoides Hand-Mazz. with
regards to anti-endotoxin activity. Correlation coefficients
>0.3 or <-0.3 were considered significant (P<0.05),
whereas correlation coefficients >0.5 or <-0.5 were
considered highly significant (P<0.01). NCA, neochlorogenic
acid; CA, chlorogenic acid; CCA, cryptochlorogenic acid; SLA,
secologanic acid; SL, secoxyloganin; ICAB, isochlorogenic acid B;
ICAA, isochlorogenic acid A; ICAC, isochlorogenic acid C; ET,
endotoxin. |
Discussion
To obtain a better chromatogram map, methanol-water,
acetonitrile-water, methanol-0.15% formic acid, acetonitrile-0.15%
formic acid, acetonitrile-0.4% acetic acid, acetonitrile: Methanol
(1:1)-0.4% acetic acid and acetonitrile-0.4% phosphoric acid were
investigated and screened as mobile phases. The combination of
acetic acid (0.4%, v/v)-acetonitrile was the best mobile phase for
separation and analysis. In the range of 190-400 nm full wavelength
scanning, 254 nm was selected as optimal. The column temperature
was set at 25, 30 and 35˚C, respectively. A temperature of 35˚C was
selected. Flow rates of 0.8, 1.0 and 1.2 ml/min were also tested,
and peak resolution of the samples was improved when the flow rate
was 0.8 ml/min. Lastly, injection volumes of 10, 15 and 20 µl were
also compared, and peak resolution was optimized when the injection
volume was 10 µl.
TCM has the characteristics of multi-component,
multi-effect and collaborative integration. The composition of its
components and the interactions between then is complex. It is
important to identify a suitable research method to determine the
efficacy of TCM and its mechanism of action. At present, the most
common research method is to determine pharmacodynamics and assess
the correlation of its ‘spectrum-effect’ (19-29).
Pearson's correlation coefficient was used in the current study to
calculate the relative peak areas, which corresponded to the
antipyretic effect and anti-endotoxin activity of the samples.
Based on these results, different species of LJT, LFH and LMH
exhibited antipyretic effects and anti-endotoxin activities.
Correlation coefficients >0.3 or <-0.3 were considered
significant (P<0.05), whereas correlation coefficients >0.5
or <-0.5 were considered highly significant (P<0.01). Based
on the comprehensive results of PCA and BA, these eight
constituents (NCA, CA, CCA, SLA, SL, ICAB, ICAA and ICAC) were
demonstrated to exert anti-endotoxin activity.
LC technology was used for the qualitative and
quantitative analysis of eight main chemical constituents in
different species of LJT, LFH and LMH. The present study
illustrated how six constituents, namely NCA, CA, CCA, ICAB, ICAA
and ICAC, were selected as representative variables for the
antipyretic effect and anti-endotoxin activity. The constituents
that significantly correlated with the concentration of cAMP and
AVP were NCA, CA, CCA, SL, ICAB, ICAA and ICAC. The constituents
that significantly correlated with ET levels were NCA, CA, CCA,
SLA, SL, ICAB, ICAA and ICAC. Therefore, NCA, CA, CCA, ICAB, ICAA
and ICAC were demonstrated to bethe key substances that mediate the
antipyretic effect and anti-endotoxin activity of different species
of Lonicera japonica.
Acknowledgements
Not applicable.
Funding
Funding: The present project was supported by the Science and
Technology Project of Guizhou Province [grant no. QKHZC (2016)
2909], Guizhou Discipline Construction Project [grant no. GNYL
(2017) 008], the Guizhou Province ‘Hundred’ Innovative Talents
Project [grant no. QKHRC (2015) 4032] and the Guizhou University of
Traditional Chinese Medicine Construction Project of Undergraduate
Teaching Engineering [grant no. GZYJXGCHZ (2019) 54].
Availability of data and materials
The datasets used and/or analyzed during the current
study are available from the corresponding author on reasonable
request.
Authors' contributions
JXD wrote the manuscript and analyzed data. YZ
designed the experiments. WNY established and evaluated the
fingerprint. WPL carried out the ELISA experiments. HS and JXL
performed the animal experiments. CLT recorded and analyzed the
experimental data. CL and XWL analyzed the data. All authors read
and approved the final manuscript.
Ethics approval and consent to
participate
All experimental procedures were reviewed and
approved by The Animal Ethics Committee of Guizhou University
(approval no. GZU-2019-11).
Patient consent for publication
Not applicable.
Competing interests
The authors declare that they have no competing
interests.
References
|
1
|
Wang Z, Xia Q, Liu X, Liu W, Huang W, Mei
X, Luo J, Shan M, Lin R, Zou D and Ma Z: Phytochemistry,
pharmacology, quality control and future research of Forsythia
suspensa (Thunb.) Vahl: A review. J Ethnopharmacol. 210:318–339.
2018.PubMed/NCBI View Article : Google Scholar
|
|
2
|
Shu Y, Liu Z, Zhao S, Song Z, He D, Wang
M, Zeng H, Lu C, Lu A and Liu Y: Integrated and global
pseudotargeted metabolomics strategy applied to screening for
quality control markers of Citrus TCMs. Anal Bioanal Chem.
409:4849–4865. 2017.PubMed/NCBI View Article : Google Scholar
|
|
3
|
Zhuo L, Peng J, Zhao Y, Li D, Xie X, Tong
L and Yu Z: Screening bioactive quality control markers of
QiShenYiQi dripping pills based on the relationship between the
ultra-high performance liquid chromatography fingerprint and
vascular protective activity. J Sep Sci. 40:4076–4084.
2017.PubMed/NCBI View Article : Google Scholar
|
|
4
|
Sander MH, Joost F, Ger TR, Ronald JAW,
Wietse K and Hans RW: Temperature dependence of mutant mevalonate
kinase activity as a pathogenic factor in hyper-IgD and periodic
fever syndrome. Hum Mol Genet. 11:3115–3124. 2002.PubMed/NCBI View Article : Google Scholar
|
|
5
|
Kailash P and Shuchita T: Therapeutic
interventions for advanced glycation-end products and its receptor-
mediated cardiovascular disease. Curr Pharm Des. 23:937–943.
2017.PubMed/NCBI View Article : Google Scholar
|
|
6
|
Jaroslawska J, Chabowska-Kita A, Kaczmarek
MM and Kozak LP: Npvf: Hypothalamic biomarker of ambient
temperature independent of nutritional status. PLoS Genet.
11(e1005287)2015.PubMed/NCBI View Article : Google Scholar
|
|
7
|
do Nascimento AF, Thompsom B,
Dell'Armelina Rocha PR, Kirychuk S, Bernardi MM and Felicio LF:
Hyperprolactinemia impaired the effects of lipopolysaccharide on
both body temperature and sickness behavior in virgin female rats.
Neuroimmunomodulation. 26:285–291. 2019.PubMed/NCBI View Article : Google Scholar
|
|
8
|
Sylvia KE and Demas GE: Acute
intraperitoneal lipopolysaccharide influences the immune system in
the absence of gut dysbiosis. Physiol Rep. 6(e13639)2018.PubMed/NCBI View Article : Google Scholar
|
|
9
|
Hussain MS, Azam F, Ahamed KF,
Ravichandiran V and Alkskas I: Anti-endotoxin effects of terpenoids
fraction from Hygrophila auriculata in lipopolysaccharide-induced
septic shock in rats. Pharm Biol. 54:628–636. 2016.PubMed/NCBI View Article : Google Scholar
|
|
10
|
Malan M, Serem JC, Bester MJ, Neitz AW and
Gaspar AR: Anti-inflammatory and anti-endotoxin properties of
peptides derived from the carboxy-terminal region of a defensin
from the tick Ornithodoros savignyi. J Pept Sci. 22:43–51.
2016.PubMed/NCBI View
Article : Google Scholar
|
|
11
|
Cavaillon JM: Exotoxins and endotoxins:
Inducers of inflammatory cytokines. Toxicon. 149:45–53.
2018.PubMed/NCBI View Article : Google Scholar
|
|
12
|
Saleh E, Moody MA and Walter EB: Effect of
antipyretic analgesics on immune responses to vaccination. Hum
Vaccin Immunother. 12:2391–402. 2016.PubMed/NCBI View Article : Google Scholar
|
|
13
|
Elahe M, Johan LÅN, Kiseko S and Anders B,
Peter MZ, David E, Edward DH and Anders B: The antipyretic effect
of paracetamol occurs independent of transient receptor potential
ankyrin 1-mediated hypothermia and is associated with prostaglandin
inhibition in the brain. FASEB J. 32:5751–5759. 2018.PubMed/NCBI View Article : Google Scholar
|
|
14
|
Jennifer L and Hazel MW: Antipyretic drugs
in patients with fever and infection: Literature review. Br J Nurs.
28:610–618. 2019.PubMed/NCBI View Article : Google Scholar
|
|
15
|
Muhammad TI: Antipyretic effect of phytol,
possibly via 5KIR-dependent COX-2 inhibition pathway.
Inflammopharmacology. 27:857–862. 2019.PubMed/NCBI View Article : Google Scholar
|
|
16
|
Lü SW, Su H, Sun S, Guo YY, Liu T, Ping Y
and Li YJ: Isolation and characterization of nanometre aggregates
from a Bai-Hu-Tang decoction and their antipyretic effect. Sci Rep.
8(12209)2018.PubMed/NCBI View Article : Google Scholar
|
|
17
|
Wang XM, Xu WJ, Xu LK, Song S, Xing XF and
Luo JB: Antipyretic effect of Herba Ephedrae-Ramulus Cinnamomi herb
pair on yeast-induced pyrexia rats: A metabolomics study. Chin J
Integr Med. 24:676–682. 2018.PubMed/NCBI View Article : Google Scholar
|
|
18
|
Choi SJ, Moon S, Choi UY, Chun YH, Lee JH,
Rhim JW, Lee J, Kim HM and Jeong DC: The antipyretic efficacy and
safety of propacetamol compared with dexibuprofen in febrile
children: A multicenter, randomized, double-blind, comparative,
phase 3 clinical trial. BMC Pediatr. 18(201)2018.PubMed/NCBI View Article : Google Scholar
|
|
19
|
Ding JX, Li WL, Hu Y, Song H, Sun XM and
Ji YB: Characterization of estrogenic active ingredients in
Cuscutachinensis Lam. based on spectral characteristics and
high-performance liquid chromatography/quadrupole time-of-flight
mass spectrometry. Mol Med Rep. 19:1238–1247. 2019.PubMed/NCBI View Article : Google Scholar
|
|
20
|
Hernaez R and Thrift AP: High negative
predictive value, low prevalence, and spectrum effect: Caution in
the interpretation. Clin Gastroenterol Hepatol. 15:1355–1358.
2017.PubMed/NCBI View Article : Google Scholar
|
|
21
|
Liang J, Chen Y, Ren G, Dong W, Shi M,
Xiong L, Li J, Dong J, Li F and Yuan J: Screening hepatotoxic
components in Euodia rutaecarpa by UHPLC-QTOF/MS based on the
spectrum-toxicity relationship. Molecules. 22(E1264)2017.PubMed/NCBI View Article : Google Scholar
|
|
22
|
Chopard G, Puyraveau M, Binetruy M, Meyer
A, Vandel P, Magnin E, Berger E, Galmiche J and Mauny F: Spectrum
effect and spectrum bias in the screening test performance for
amnestic mild cognitive impairment: What are the clinical
implications? J Alzheimers Dis. 48:385–393. 2015.PubMed/NCBI View Article : Google Scholar
|
|
23
|
Xu GL, Xie M, Yang XY, Song Y, Yan C, Yang
Y, Zhang X, Liu ZZ, Tian YX, Wang Y, et al: Spectrum-effect
relationships as a systematic approach to traditional chinese
medicine research: Current status and future perspectives.
Molecules. 19:17897–17925. 2014.PubMed/NCBI View Article : Google Scholar
|
|
24
|
Zheng Q, Zhao Y, Wang J, Liu T, Zhang B,
Gong M, Li J, Liu H, Han B, Zhang Y, et al: Spectrum-effect
relationships between UPLC fingerprints and bioactivities of crude
secondary roots of Aconitum carmichaelii Debeaux (Fuzi) and its
three processed products on mitochondrial growth coupled with
canonical correlation analysis. J Ethnopharmacol. 153:615–623.
2014.PubMed/NCBI View Article : Google Scholar
|
|
25
|
Li W, Sun X, Liu B, Zhang L, Fan Z and Ji
Y: Screening and identification of hepatotoxic component in Evodia
rutaecarpa based on spectrum-effect relationship and UPLC-Q-TOFMS.
Biomed Chromatogr. 30:1975–1983. 2016.PubMed/NCBI View
Article : Google Scholar
|
|
26
|
Shi Z, Liu Z, Liu C, Wu M, Su H, Ma X,
Zang Y, Wang J, Zhao Y and Xiao X: Spectrum-effect relationships
between chemical fingerprints and antibacterial effects of
Lonicerae Japonicae Flos and Lonicerae Flos base on UPLC and
microcalorimetry. Front Pharmacol. 7(12)2016.PubMed/NCBI View Article : Google Scholar
|
|
27
|
Chen Y, Yu H, Wu H, Pan Y, Wang K, Liu L,
Jin Y and Zhang C: Tracing novel hemostatic compounds from heating
products of total flavonoids in Flos Sophorae by spectrum-effect
relationships and column chromatography. J Sep Sci. 38:1691–1699.
2015.PubMed/NCBI View Article : Google Scholar
|
|
28
|
Liu X, Wang XL, Wu L, Li H, Qin KM, Cai H,
Pei K, Liu T and Cai BC: Investigation on the spectrum-effect
relationships of Da-Huang-Fu-Zi-Tang in rats by UHPLC-ESI-Q-TOF-MS
method. J Ethnopharmacol. 154:606–612. 2014.PubMed/NCBI View Article : Google Scholar
|
|
29
|
Xie RF, Zhou X, Shi ZN, Li YM and Li ZC:
Study on spectrum-effect relationship of rhizome Rhei, cortex
Magnoliae Officinalis, fructus Aurantii Immaturus and their
formula. J Chromatogr Sci. 51:524–532. 2013.PubMed/NCBI View Article : Google Scholar
|
|
30
|
Li WL, Ding JX, Bai J, Hu Y, Song H, Sun
XM and Ji YB: Research on correlation of compositions with
oestrogenic activity of Cistanche based on LC/QTOF-MS/MS
technology. Open Chem. 17:1–12. 2019.
|
|
31
|
Li WL, Ding JX, Liu BM, Zhang DL, Song H,
Sun XM, Liu GY, Wang JY and Ji YB: Phytochemical screening and
estrogenic activity of total glycosides of
Cistanchedeserticola. Open Chem. 17:279–287. 2019.
|
|
32
|
Li YK, Li W, Fu CM, Song Y and Fu Q:
Lonicerae Japonicae Flos and Lonicerae Flos: A systematic
review of ethnopharmacology, phytochemistry and pharmacology.
Phytochem Rev. 1–61. 2019.PubMed/NCBI View Article : Google Scholar
|
|
33
|
National Pharmacopoeia Committee.
Pharmacopoeia of the people's Republic of China. Volume I. Beijing:
China Medical Science and Technology Press, 221, 2015.
|
|
34
|
Zhang F, Shi PL, Liu HY, Zhang YQ, Yu X,
Li J and Pu GB: A simple, rapid, and practical method for
distinguishing Lonicerae Japonicae Flos from Lonicerae Flos.
Molecules. 24(3455)2019.PubMed/NCBI View Article : Google Scholar
|
|
35
|
Zhang X, Guo Q and Yu BY: Rapid
quantitative analysis of adulterant Lonicera species in
preparations of Lonicerae Japonicae Flos. J Sep Sci.
38:4014–4020. 2015.PubMed/NCBI View Article : Google Scholar
|
|
36
|
Qian WJ, Kang A, Peng LX, Xie T, Ji JJ,
Zhou W, Shan JJ and Di LQ: Gas chromatography-mass spectrometry
based plasma metabolomics of H1N1-induced inflammation in mice and
intervention with Flos Lonicerae Japonica-Fructus Forsythiae herb
pair. J Chromatogr B Analyt Technol Biomed Life Sci. 1092:122–130.
2018.PubMed/NCBI View Article : Google Scholar
|
|
37
|
Yan WN: Study on fingerprint of
Lonicera japonica flos and loniceraeflos in guizhou
province. Guizhou University. Master Thesis, 2018.
|
|
38
|
Niu F, Xu X, Zhang R, Sun L, Gan N and
Wang A: Ursodeoxycholic acid stimulates alveolar fluid clearance in
LPS-induced pulmonary edema via ALX/cAMP/PI3K pathway. J Cell
Physiol. 234:20057–20065. 2019.PubMed/NCBI View Article : Google Scholar
|
|
39
|
Hitoshi S, Makoto K, Hideo O, Toshitaka N
and Yoichi U: Regulatory mechanism of the arginine
vasopressin-enhanced green fluorescent protein fusion gene
expression in acute and chronic stress. Peptides. 30:1763–1770.
2009.PubMed/NCBI View Article : Google Scholar
|
|
40
|
Bossola M, Di Stasio E, Sanguinetti M,
Posteraro B, Antocicco M, Pepe G, Mello E, Bugli F and Vulpio C:
Serum endotoxin activity measured with endotoxin activity assay is
associated with serum interleukin-6 levels in patients on chronic
hemodialysis. Blood Purif. 42:294–300. 2016.PubMed/NCBI View Article : Google Scholar
|
|
41
|
Chatkupt TT, Libal NL, Mader SL, Murphy SJ
and Saunders KE: Effect of continuous trio breeding compared with
continuous pair breeding in ‘Shoebox’ Caging on measures of
reproductive performance in estrogen receptor knockout mice. J Am
Assoc Lab Anim Sci. 57:328–334. 2018.PubMed/NCBI View Article : Google Scholar
|