Introduction
Percutaneous coronary intervention (PCI) is being
performed on an increasing number of patients. Despite recent
advances with radiocontrast agents, acute kidney injury (AKI) is
still a major complication of PCI, representing the third most
common cause of hospital-acquired acute kidney injury (AKI)
(1,2). The incidence of PCI-AKI ranges from 2%
in the healthy population to as high as 30% in high-risk patients
with pre-existing conditions, including impaired renal function,
diabetes and older age (>60-75 years). PCI-AKI is associated
with a short- and long-term increase in morbidity, such as the
development of end-stage renal disease, and mortality rates
(3,4).
Progress in improving the prognosis of PCI-AKI has
been limited. This is in part due to an incomplete understanding of
the pathophysiology of the disease process and the scarcity of
early biomarkers for the diagnosis of PCI-AKI (5). Recently, a considerable number of
novel biomarkers for the early diagnosis of PCI-AKI have been
developed, such as neutrophil gelatinase-associated lipocalin
(NGAL), interleukin-18 (IL-18) and kidney injury molecule-1 (KIM-1)
(6). In a previous study, a rise in
urine NGAL after 6 h and an increase in urine KIM-1 and IL-18
levels after 24 h post-PCI was determined (7). However, to date, there is no single
proven ideal biomarker. Therefore, it is important to screen for
ideal biomarkers with high sensitivity and specificity.
Fortunately, advances in clinical proteomics have markedly
accelerated the rate of discovery of candidate biomarkers and have
provided novel insight into the pathways and biological processes
that may hold promise as potential therapeutic targets for the
treatment of PCI-AKI (8,9). Isobaric tags for relative and absolute
quantitation (iTRAQ) coupled with liquid chromatography tandem mass
spectrometry (LC-MS/MS) have been recently applied as powerful
proteomics tools (10).
Previous studies have indicated that AKI may cause
lipid dysfunction and abnormal lipid accumulation within the
kidney, which may be either protective or toxic to the kidney
depending on the nature of the specific lipid present and the time
course of the injury (11). Studies
have also demonstrated that lower levels of high-density
lipoprotein cholesterol (HDL-C) are associated with an increased
risk of AKI and long-term mortality in patients undergoing PCI or
revascularization for chronic limb ischemia (12,13).
Despite previous studies demonstrating a benefit of pre-procedural
statin for reducing the risk of PCI-AKI, the role of lipids in the
development of PCI-AKI has remained to be fully elucidated. To
explore the changes in lipid composition that are involved in the
early stage of PCI-AKI, which may be pathophysiologically relevant
and/or have the potential to serve as an early biomarker, the
accumulation of urine protein in patients with and without PCI-AKI
were investigated in the present study using the iTRAQ LC-MS/MS
approach. In addition, differentially expressed proteins (DEPs)
related to the expression of various lipids were further confirmed
using parallel reaction monitoring (PRM), which has been widely
used to quantify and detect target proteins (14).
Patients and methods
Study population
The present study was a single-center, prospective
nested, case-control study. A total of 114 elderly patients
undergoing elective PCI at HwaMei Hospital, University of Chinese
Academy of Sciences (Ningbo, China) between July 2015 and June 2016
were eligible for enrollment. The exclusion criteria for the
present study were as follows: i) Age <60 years; ii)
pre-existing estimated glomerular filtration rate (eGFR) <30
ml/min/1.73 m2 or dialysis; iii) established AKI; iv)
liver failure; v) tumors, vi) cardiogenic or septic shock; vii)
emergency PCI; viii) exposure to contrast medium 48 h prior to
study; and ix) use of nephrotoxic drugs at least 1 week prior to or
during the study period. Each enrolled patient was given the
non-ionic, iso-osmolar contrast medium Iodixanol (GE Healthcare)
and intravenous hydration after PCI, without any specific protocols
and medications for AKI prevention. The present study was approved
by the ethics committee of HwaMei Hospital, University of Chinese
Academy of Sciences (Ningbo, China). Written informed consent was
obtained from each of the patients involved in the study.
Criteria for AKI were according to the Kidney
Disease, Improving Global Outcomes guidelines from 2012(15) and were applied for the diagnosis of
PCI-AKI, defined as an absolute rise in serum creatinine (Scr) ≥0.3
mg/dl (26.5 µmol/l) within 48 h or a ≥50% increase from the
baseline value within 7 days after the procedure. The urine
criteria for AKI were not used in the present study as urine output
may be affected by previous medical therapies.
Cases and controls
Of the 114 subjects, 14 elderly patients with AKI
(12.28%) were assigned to the AKI-group. A total of 14 patients
[the control (CON) group], 1:1 matched by age and sex, were
selected from the remaining 100 patients who did not develop AKI
(the non-AKI group) in the cohort.
Urine sample collection and
storage
From the total cohort (n=114), serial urine samples
were collected prospectively pre-PCI and 24 h post-PCI. Samples
were centrifuged at 3,500 x g for 15 min at 4˚C. The supernatants
were stored at -80˚C until use. Finally, 56 urine samples from the
AKI group (n=14) and CON group (n=14) were used (28 patients at 2
time-points). The samples were divided into a discovery set,
comprising 24 urine samples from 6 AKI- and 6 CON-group patients at
2 time-points; and a validation set of 32 urine samples from 8 AKI-
and 8 CON-group patients at 2 time-points.
Clinical and laboratory data
Basic data were collected, including demographics,
medical history, use of medications, number of diseased vessels,
the contrast volume used and left ventricular ejection fraction
(LVEF) as measured by echocardiography, as well as laboratory
findings including Scr levels prior to, as well as 24 and 48 h
after PCI, as measured using an automated biochemistry analyzer
(DXC800; Beckmann Coulter, Inc.) at the hospital's clinical
laboratory. The eGFR was calculated using the Chronic Kidney
Disease (CKD) Epidemiology Collaboration formula (16).
Sample preparation
For the discovery phase, 24 urine samples from the
discovery set were used. Pooled urine samples (6-7 ml) were
centrifuged at 2,000 x g for 10 min at 4˚C to remove cell debris.
The supernatants were concentrated in Amicon Ultra-15 Centrifugal
Filters (EMD Millipore) at 4,000 x g for 60 min at 4˚C. The
concentrated solutes were recovered from the filter device.
Proteins were precipitated by adding five volumes of pre-chilled
(-20˚C) acetone and freezing at -20˚C overnight. Samples were
centrifuged at 12,000 x g for 15 min at 4˚C. Acetone was carefully
removed and 1 ml of pre-chilled acetone was added. The samples were
vortexed for 15 min twice to wash the pellets. The samples were
centrifuged at 12,000 x g for 15 min at 4˚C and subsequently, the
acetone was decanted. The pellets were then left to dry at room
temperature.
Protein digestion
Protein was dissolved in 100 buffer (7 M urea, 2 M
thiourea, 120 mM dithiothreitol and 40 mM Tris) and incubated at
37˚C for 15 min. Protein concentrations were determined using
Bradford protein assays. A total of 60 µg protein per condition was
added into a new tube and the final volume was adjusted to 100 µl
with 100 mM triethylammonium bicarbonate (TEAB). A total of 1 µl 1
M Tris (2-carboxyethyl) phosphine was added to each sample,
followed by incubation at 55˚C for 30 min. Subsequently, 2 µl 1 M
iodoacetamide was added to each sample, followed by incubation in
the dark for 30 min at room temperature. Proteins were precipitated
by adding five volumes of pre-chilled (-20˚C) acetone and freezing
at -20˚C overnight. Samples were centrifuged at 12,000 x g for 15
min at 4˚C. The acetone was carefully removed and 1 ml pre-chilled
50% ethanol/50% acetone was added, followed by vortexing twice for
10 min to wash the pellets. The samples were centrifuged at 12,000
x g for 10 min at 4˚C and the ethanol/acetone was decanted. The
pellets were then allowed to dry at room temperature. The
precipitated protein pellets were resuspended in 100 µl of 50 mM
TEAB. Proteins were digested using sequence-grade modified trypsin
(1:50 w/w; Promega Corp.) at 37˚C overnight. The peptide mixture
was lyophilized using a vacuum concentrator and then dissolved with
0.5 M TEAB for subsequent iTRAQ labeling.
iTRAQ labeling
The resultant peptide mixture was labeled with iTRAQ
8-Plex reagent (SCIEX) following the manufacturer's protocol. The
labeled peptide samples were then pooled and lyophilized in a
vacuum concentrator.
High-pH reverse-phase separation
The peptide mixture was re-dissolved in buffer A,
consisting of 20 mM ammonium formate in water (pH 10.0), adjusted
using ammonium hydroxide, and then fractionated by high-pH
separation using an Ultimate 3000 system (Thermo Fisher Scientific,
Inc.) connected to a reverse-phase column (XBridge C18 column;
4.6x250 mm, 5 µm; Waters Corp.). High pH separation was performed
using a linear gradient. Starting from 5-45% solution B in 40 min
(solution B consisted of 20 mM ammonium formate in 80% acetonitrile
(ACN) (pH 10.0), adjusted with ammonium hydroxide. The column was
re-equilibrated at the initial conditions for 15 min. The column
flow rate was maintained at 1 ml/min and the column temperature was
maintained at 30˚C. In total, 12 fractions were collected. Each
fraction was dried in a vacuum concentrator for the next step.
Low-pH nano-HPLC-MS/MS analysis
The fractions were resuspended in 30 µl solvent C,
which consisted of water with 0.1% formic acid, separated using
nanoLC and analyzed by on-line electrospray tandem mass
spectrometry. The experiments were performed on an Easy-nLC 1000
system (Thermo Fisher Scientific, Inc.) connected to an Orbitrap
Fusion Tribrid mass spectrometer (Thermo Fisher Scientific, Inc.)
equipped with an online nano-electrospray ion source. A total of 10
µl peptide sample was loaded onto the trap column (Acclaim PepMap
C18; 100 µm x 2 cm; Thermo Fisher Scientific, Inc.) with a flow of
10 µl/min for 3 min and subsequently separated on the analytical
column (Acclaim PepMap C18; 75 µm x 15 cm; Thermo Fisher
Scientific, Inc.) with a linear gradient, from 3-32% phase B (phase
B consisted of ACN with 0.1% formic acid), and phase A was water
(with 0.1% formic acid) in 120 min. The column was re-equilibrated
to the initial conditions for 10 min. The column flow rate was
maintained at 300 nl/min. The electrospray voltage of 2 kV vs. the
inlet of the mass spectrometer was used. The mass spectrometer was
run in the data-dependent acquisition mode and automatically
switched to the MS and MS/MS mode. The MS1 mass resolution was set
to 120 K with a mass-to-charge ratio (m/z) of 350-1,550 and the
MS/MS resolution was set to 30 K under the high energy collision
dissociation (HCD) mode. The dynamic exclusion time was set as 30
sec.
Data analysis
Tandem mass spectra were processed using PEAKS
Studio version 8.5 (Bioinformatics Solutions, Inc.). PEAKS DB was
set up to search the UniProt database (https://www.uniprot.org/proteomes/UP000005640; 70,956
entries) assuming the digestion enzyme trypsin. The PEAKS DB search
was performed with a fragment ion mass tolerance of 0.05 Da and a
parent ion tolerance of 7.0 ppm. Carbamidomethylation, iTRAQ 8plex
(K, N-term) was specified as a fixed modification. Oxidation (M),
deamidation (NQ), acetylation (protein N-term), acetylation (K),
acetylation (N-term), amidation, β-methylthiolation, biotinylation
and 304 more modifications were specified as variable
modifications. Peptides were filtered with a peptide hit threshold
(-10logP) of 30.0. PEAKS Q was used for peptide and protein
abundance calculations. Normalization was performed on the average
levels of all peptides. Medians were used for averaging. DEPs were
filtered if their fold change was >1.2, with P<0.05.
Biological information function
analysis of the DEPs
Blast2GO version 4 (www.blast2go.com) was used for functional annotations.
The whole protein sequence database (The Uniprot Human database
used for DB search) was analyzed using BlastP (https://blast.ncbi.nlm.nih.gov/Blast.cgi?PROGRAM=blastp&PAGE_TYPE=BlastSearch&LINK_LOC=blasthome),
then all human sequences in the Uniprot database were mapped for
annotation background and DEPs were used for Fisher's exact test
with the Gene Ontology (GO) database (www.geneontology.org). Statistically altered functions
of DEPs were calculated using Fisher's exact tests in BLAST2GO
(https://www.blast2go.com). The intersections of
the DEPs between AKI-24 h/AKI-Pre and AKI-24 h/CON-24 h were
presented using a Venn diagram. The protein-protein interaction
network was generated using the Search Tool for the Retrieval of
Interacting Genes and proteins (STRING) database (http.//string-db.org/) and Cytoscape software
(http.//www.cytoscape.org/; version
3.2.1). Kyoto Encyclopedia of Genes and Genomes (KEGG) pathway
mapping was performed using the KEGG database (http./www.kegg.jp/kegg/pathway.html).
PRM MS acquisition
Targeted quantification and verification was
performed on 32 urine samples from the discovery set, across 6
different operational conditions. The DEPs that were related to the
lipid composition were selected, with 3-7 peptides per protein and
the peptide information was from a previous data-dependent
acquisition and Selected Reaction Monitoring Atlas database
(http://www.srmatlas.org/). Only peptides meeting
the following conditions were selected for target proteomics: i)
Fully digested with trypsin (0 missed cleavages); and ii) ≥7 amino
acids. PRM analysis was performed using the Orbitrap
Fusion™ Tribrid™ (Thermo Fisher Scientific,
Inc.). Approximately 0.5 µg of urine protein was separated and
eluted with a linear 120-min gradient of 2-35% solvent B (0.1% v/v
formic acid in CAN), and solvent A was water (with 0.1% formic
acid) at a flow rate of 300 nl/min. After each gradient, the column
was flushed with 80% solvent B for 10 min and equilibrated with 2%
solvent B for another 20 min. The MS acquisition mode was a
combination of two scan events, namely a full scan and a
time-scheduled scan. The full scan was taken with a resolution of
60,000 at m/z 200, with a scan mass range of m/z 270-1,470. An
automatic gain control (AGC) target of 2x10⁵ was used
and the maximum injection fill time was 100 msec. The non-scheduled
scan was employed with a resolution of 15,000 at m/z 200. A target
AGC of 5x10⁴ was used and the maximum injection fill
time was 60 msec. The precursor ion of each target peptide was
isolated with a 2-Da window. Precursor ions were fragmented with an
HCD normalized collision energy of 35%.
PRM MS data analysis
MS raw files (raw) from parallel reaction monitoring
acquisition were first analyzed using the Trans-Proteomic Pipeline
software suite version 4.7.0 (TPP; Institute for Systems Biology).
Raw files were first converted to mzXML and the MS/MS spectra
acquired were searched using Comet version 2.0 (http://comet-ms.sourceforge.net/) against the
Swissprot human canonical database (https://www.uniprot.org/uniprot/?query=proteome:UP000005640%20reviewed:yes;
20,192 entries) with reversed sequences. Common contaminants were
included. Searching parameters were set as follows: i) Precursor
ion mass tolerance, ±10 ppm; ii) fragment ion mass tolerance, 0.02
Da; iii) semi-tryptic termini and two missing cleavages were
allowed; iv) fixed modification, carbamidomethylation; and v)
dynamic modification, oxidation. Search results were further
processed using PeptideProphet embedded in TPP. Peptide
probabilities were calculated and the false discovery rate for each
peptide was set to 0.01. The generated interact.pep.xml files were
imported into Skyline version 3.1.0 to create a library and the
cut-off score was set as 0.90. The list of target precursors was
then uploaded to Skyline and the 6 most intense product ions
matching the library were selected as transitions. Peak picking was
manually checked and corrected according to the transitions,
retention time, mass accuracy and MS/MS spectra. The relative
protein abundance was defined as the average intensity of
peptides.
Statistical analysis
Continuous variables were tested for normality of
distribution using the Shapiro-Wilk W and Kolmogorov-Smirnov tests
and are expressed as the mean ± standard deviation or as medians
with interquartile ranges (25-75th percentile). When comparing two
groups, a two-samples t-test, or Mann-Whitney U test were used to
compare continuous variables. Categorical variables are expressed
as n (%) and comparisons between groups were performed using the
χ2 test or Fisher's exact test. ANOVA followed by the
least-significant difference test was used to evaluate significant
differences among different time-points. P<0.05 was considered
to indicate a statistically significant difference. Statistical
analyses were performed using SPSS for Windows version 22.0 (IBM
Corp.).
Results
Patient demographics
Among the patients of the present study (mean age,
74.57±6.13 years, 53.57% males), 13 (92.86%) developed AKI within
48 h after PCI. One patient (7.14%) developed AKI within 7 days
after PCI. None of the patients in the cohort with or without AKI
required renal replacement therapy or died during their
hospitalization. Table I displays
the demographic and clinical characteristics of the AKI group, CON
group (selected from the non-AKI group) and the non-AKI group.
There were no significant differences between the AKI group and CON
group with respect to sex, age, body mass index, smoking status,
hypertension, diabetes, chronic kidney disease (CKD), hemoglobin,
albumin, baseline Scr, baseline eGFR, brain natriuretic peptide,
LVEF, use of medications (aspirin, angiotensin-converting enzyme
inhibitors/angiotensin II receptor blockers, calcium channel
blockers, β-blockers, diuretics and statins), dosage of statins,
number of diseased vessels and contrast volume. Regarding the lipid
profile, only high-density lipoprotein (HDL)-cholesterol (P=0.023)
and apolipoprotein (apo)A-I (P=0.047) levels were lower in the AKI
group. There were no significant differences between the CON-group
and non-AKI group regarding the baseline levels of any other
parameter, including the lipid profile.
 | Table IBaseline clinical characteristics of
patients undergoing elective percutaneous coronary intervention in
the AKI (n=14), control (n=14) and non-AKI (n=100) groups. |
Table I
Baseline clinical characteristics of
patients undergoing elective percutaneous coronary intervention in
the AKI (n=14), control (n=14) and non-AKI (n=100) groups.
| Item | AKI group | Control group | Non-AKI group | P-valuea | P-valueb |
|---|
| Male sex | 8 (53.3) | 7 (50.0) | 67 (67.0) | 0.715 | 0.348 |
| Age, years | 74.21±7.99 | 74.93±5.96 | 71.45±10.01 | 0.797 | 0.225 |
| BMI,
kg/m2 | 24.18±2.94 | 22.39±3.17 | 24.01±3.53 | 0.142 | 0.118 |
| Smoking | 2 (14.3) | 2 (14.3) | 17 (16.0) | 1.000 | 0.445 |
| Hypertension | 12 (85.7) | 9 (64.3) | 73 (73.0) | 0.190 | 0.774 |
| Diabetes
mellitus | 4 (28.6) | 5 (35.7) | 30 (30.0) | 0.686 | 0.535 |
| CKD | 4 (28.6) | 3 (21.4) | 17 (17.0) | 0.663 | 0.589 |
| Hemoglobin,
g/l | 120.21±13.70 | 115.62±12.03 | 122.94±16.50 | 0.365 | 0.211 |
| Albumin, g/l | 36.91±4.62 | 39.45±4.43 | 39.45±4.58 | 0.158 | 0.999 |
| Baseline eGFR,
ml/min/1.73 m2 | 72.13±22.42 | 68.66±19.79 | 77.34±18.86 | 0.674 | 0.075 |
| Scr, µmol/l | | | | | |
|
Baseline | 85.42±29.30 | 90.40±29.42 | 82.30±25.86 | 0.664 | 0.298 |
|
Post-24
h | 102.41±44.37 |
86.83±25.02c | 82.54±25.35 | 0.270 | 0.569 |
|
Post-48
h | 123.71±38.66 |
87.30±22.05d | 83.07±23.58 | 0.006 | 0.545 |
| BNP, pg/ml | 6258
(394,8248) | 897 (394,1968) | 544 (278,1032) | 0.123 | 0.180 |
| LVEF, % | 60.00±7.90 | 60.38±7.25 | 63.34±8.16 | 0.896 | 0.218 |
| Lipid profile | | | | | |
|
TC,
mmol/l | 3.76±0.65 | 3.55±1.43 | 3.86±1.07 | 0.614 | 0.284 |
|
TG,
mmol/l | 1.50±0.89 | 1.16±0.40 | 1.51±0.11 | 0.205 | 0.129 |
|
HDL-C,
mmol/l | 0.99±0.27 | 1.32±0.43 | 1.21±0.28 | 0.023 | 0.198 |
|
LDL-C,
mmol/l | 2.07±0.66 | 2.01±0.80 | 2.06±0.89 | 0.808 | 0.330 |
|
ApoA-I,
g/l | 1.09±0.23 | 1.27±0.21 | 1.22±0.18 | 0.047 | 0.542 |
|
ApoB,
g/l | 0.83±0.22 | 0.69±0.19 | 0.83±0.28 | 0.113 | 0.078 |
|
ApoE,
mg/dl | 4.37±1.84 | 4.67±1.18 | 4.71±1.70 | 0.624 | 0.760 |
|
Lipoprotein
(a), mg/l | 202.23±157.85 | 207.63±167.97 | 233.75±224.61 | 0.932 | 0.489 |
| Medication | | | | | |
|
Aspirin | 14(100) | 14(100) | 100(100) | 1.000 | 1.000 |
|
ACEI/ARB | 9 (64.3) | 8 (57.1) | 67 (67.0) | 0.699 | 0.776 |
|
CCB | 4 (28.6) | 3 (21.4) | 17 (17.0) | 0.663 | 0.589 |
|
β-blocker | 12 (85.7) | 10 (71.4) | 71 (71.0) | 0.357 | 0.942 |
|
Diuretics | 9 (64.3) | 7 (50.0) | 37 (37.0) | 0.445 | 0.241 |
|
Statins | 14(100) | 14(100) | 100(100) | 1.000 | 1.000 |
| Statin dosage,
mg | | | | | |
|
Atorvastatin | 24.00±8.43 | 22.00±6.32 | 24.00±8.58 | 0.556 | 0.441 |
|
Rosuvastatin | 12.50±5.00 | 13.33±5.77 | 12.52±6.11 | 0.846 | 0.849 |
| Number of diseased
vessels | 2.21±0.80 | 2.00±0.91 | 2.03±0.83 | 0.522 | 0.904 |
| Contrast volume,
ml | 182.86±46.81 | 180.00±39.79 | 168.30±32.23 | 0.866 | 0.233 |
Regarding the Scr levels at 24 h post-contrast, no
significant differences were detected in the AKI-24 h vs. AKI-Pre
(P=0.243) and AKI-24 h vs. CON-24 h groups (P=0.270). However,
there was a significant rise at 48 h post-contrast, with AKI-48 h
vs. AKI-Pre (P=0.011) and AKI-48 h vs. CON-48 h (P=0.006). The Scr
levels did not significantly change at any time-point in the
control group (CON-24 h vs. CON-Pre, P=0.723; CON-48 h vs. CON-Pre,
P=0.664; Table I).
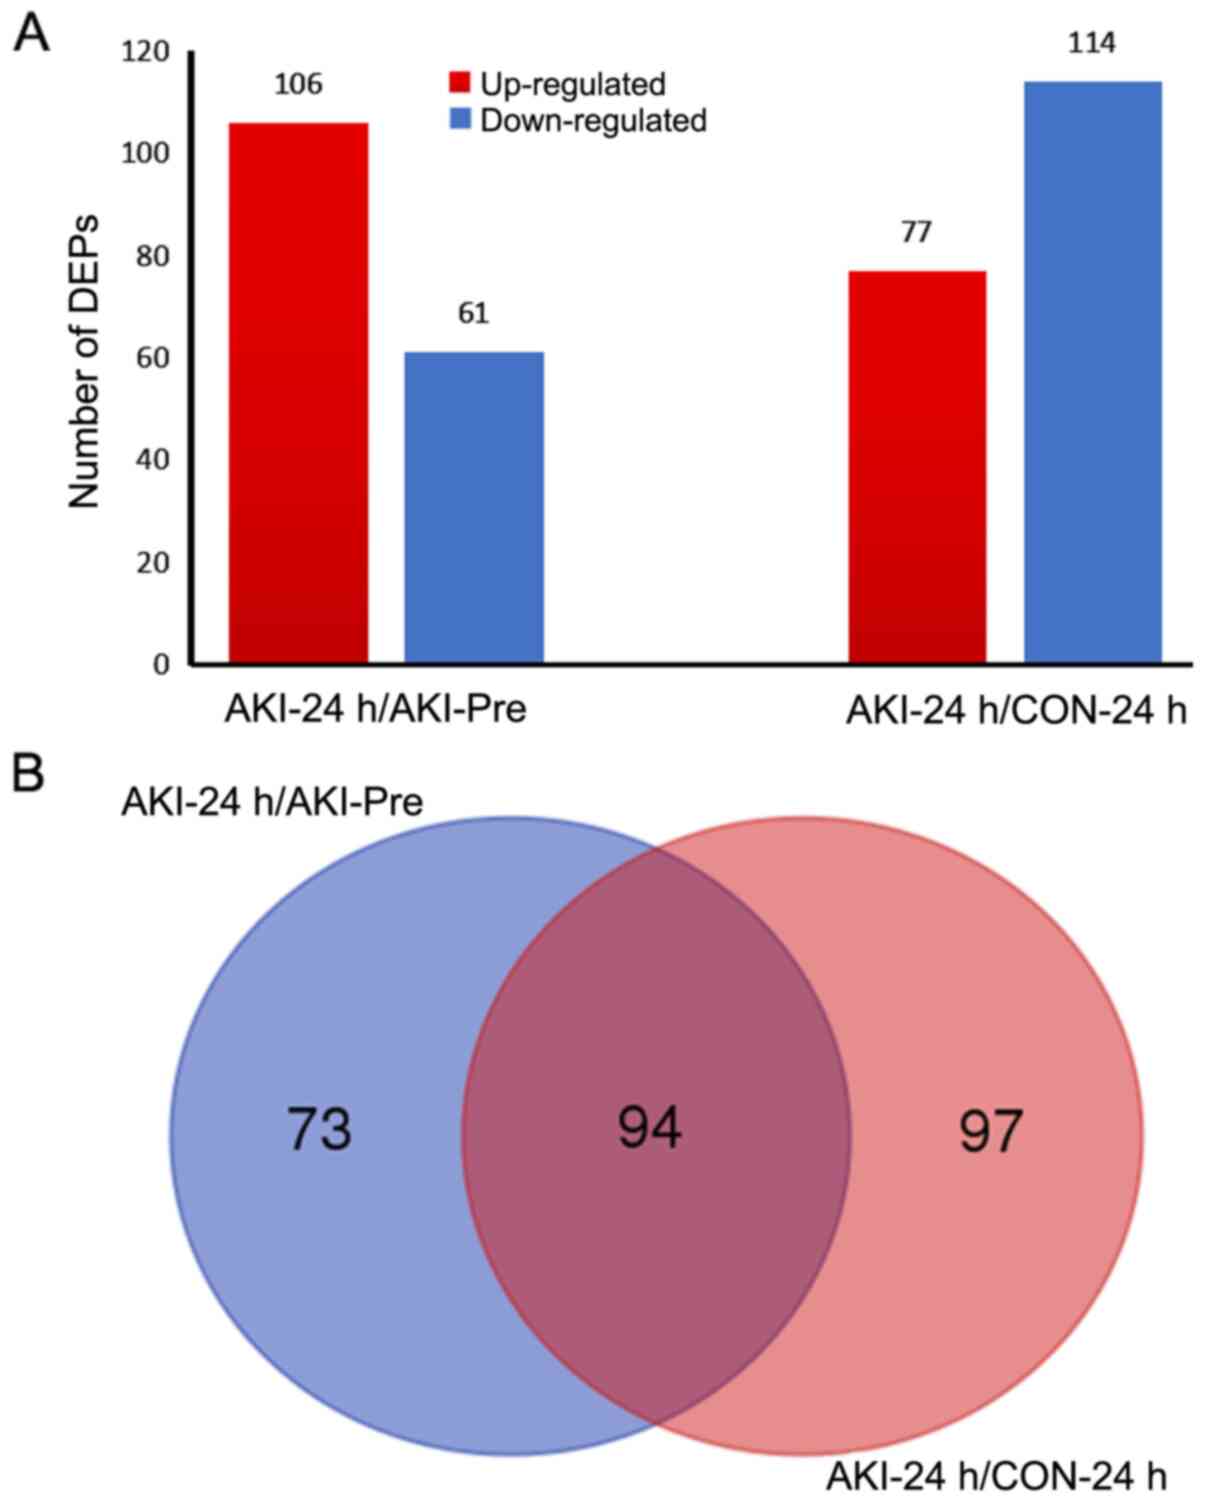
DEPs obtained by
iTRAQ-2D-LC-MS/MS
According to the criteria used in the present study
for judging DEPs (fold change >1.2 or <0.83 and P<0.05),
106 and 77 upregulated proteins were identified for the AKI-24
h/AKI-Pre and AKI-24 h/CON-24 h comparisons, respectively. In
addition, 61 and 114 downregulated proteins were identified
(Fig. 1A). All DEPs in the AKI-24
h/AKI-Pre and AKI-24 h/CON-24 h comparisons are presented in
Table SI.
As illustrated in the Venn diagram in Fig. 1B, 94 proteins were overlapped in
both the AKI-24 h/AKI-Pre and AKI-24 h/CON-24 h comparisons. Among
them, only apoA-I [Accession no. sp|P02647|APOA1_HUMAN; Peptides
(95%), 21; Table SI] was related
to lipids, displaying significantly upregulated levels in both the
AKI-24 h/AKI-Pre and AKI-24 h/CON-24 h comparisons, while no
significant differences were observed for both the CON-24 h/CON-Pre
and AKI-Pre/CON-Pre comparisons (Table
II). It is worth mentioning that the fold changes observed for
apoA-I were striking before the Scr levels were raised, because as
mentioned above, no significant differences were detected in the
comparisons between the AKI-24 h/AKI-Pre (P=0.243) and AKI-24
h/CON-24 h (P=0.270) in Scr at 24 h post-contrast.
| Table IIFold changes of apolipoprotein A-I
expressed in AKI and control groups determined via isobaric tags
for relative and absolute quantitation technology. |
Table II
Fold changes of apolipoprotein A-I
expressed in AKI and control groups determined via isobaric tags
for relative and absolute quantitation technology.
| Comparison | Fold change | P-value |
|---|
| AKI-24
h/AKI-Pre | 18.8799 | 0.0338 |
| AKI-24 h/CON-24
h | 10.8643 | <0.0001 |
| CON-24
h/CON-Pre | 1.3305 | 0.0855 |
|
AKI-Pre/CON-Pre | 0.0794 | 0.0695 |
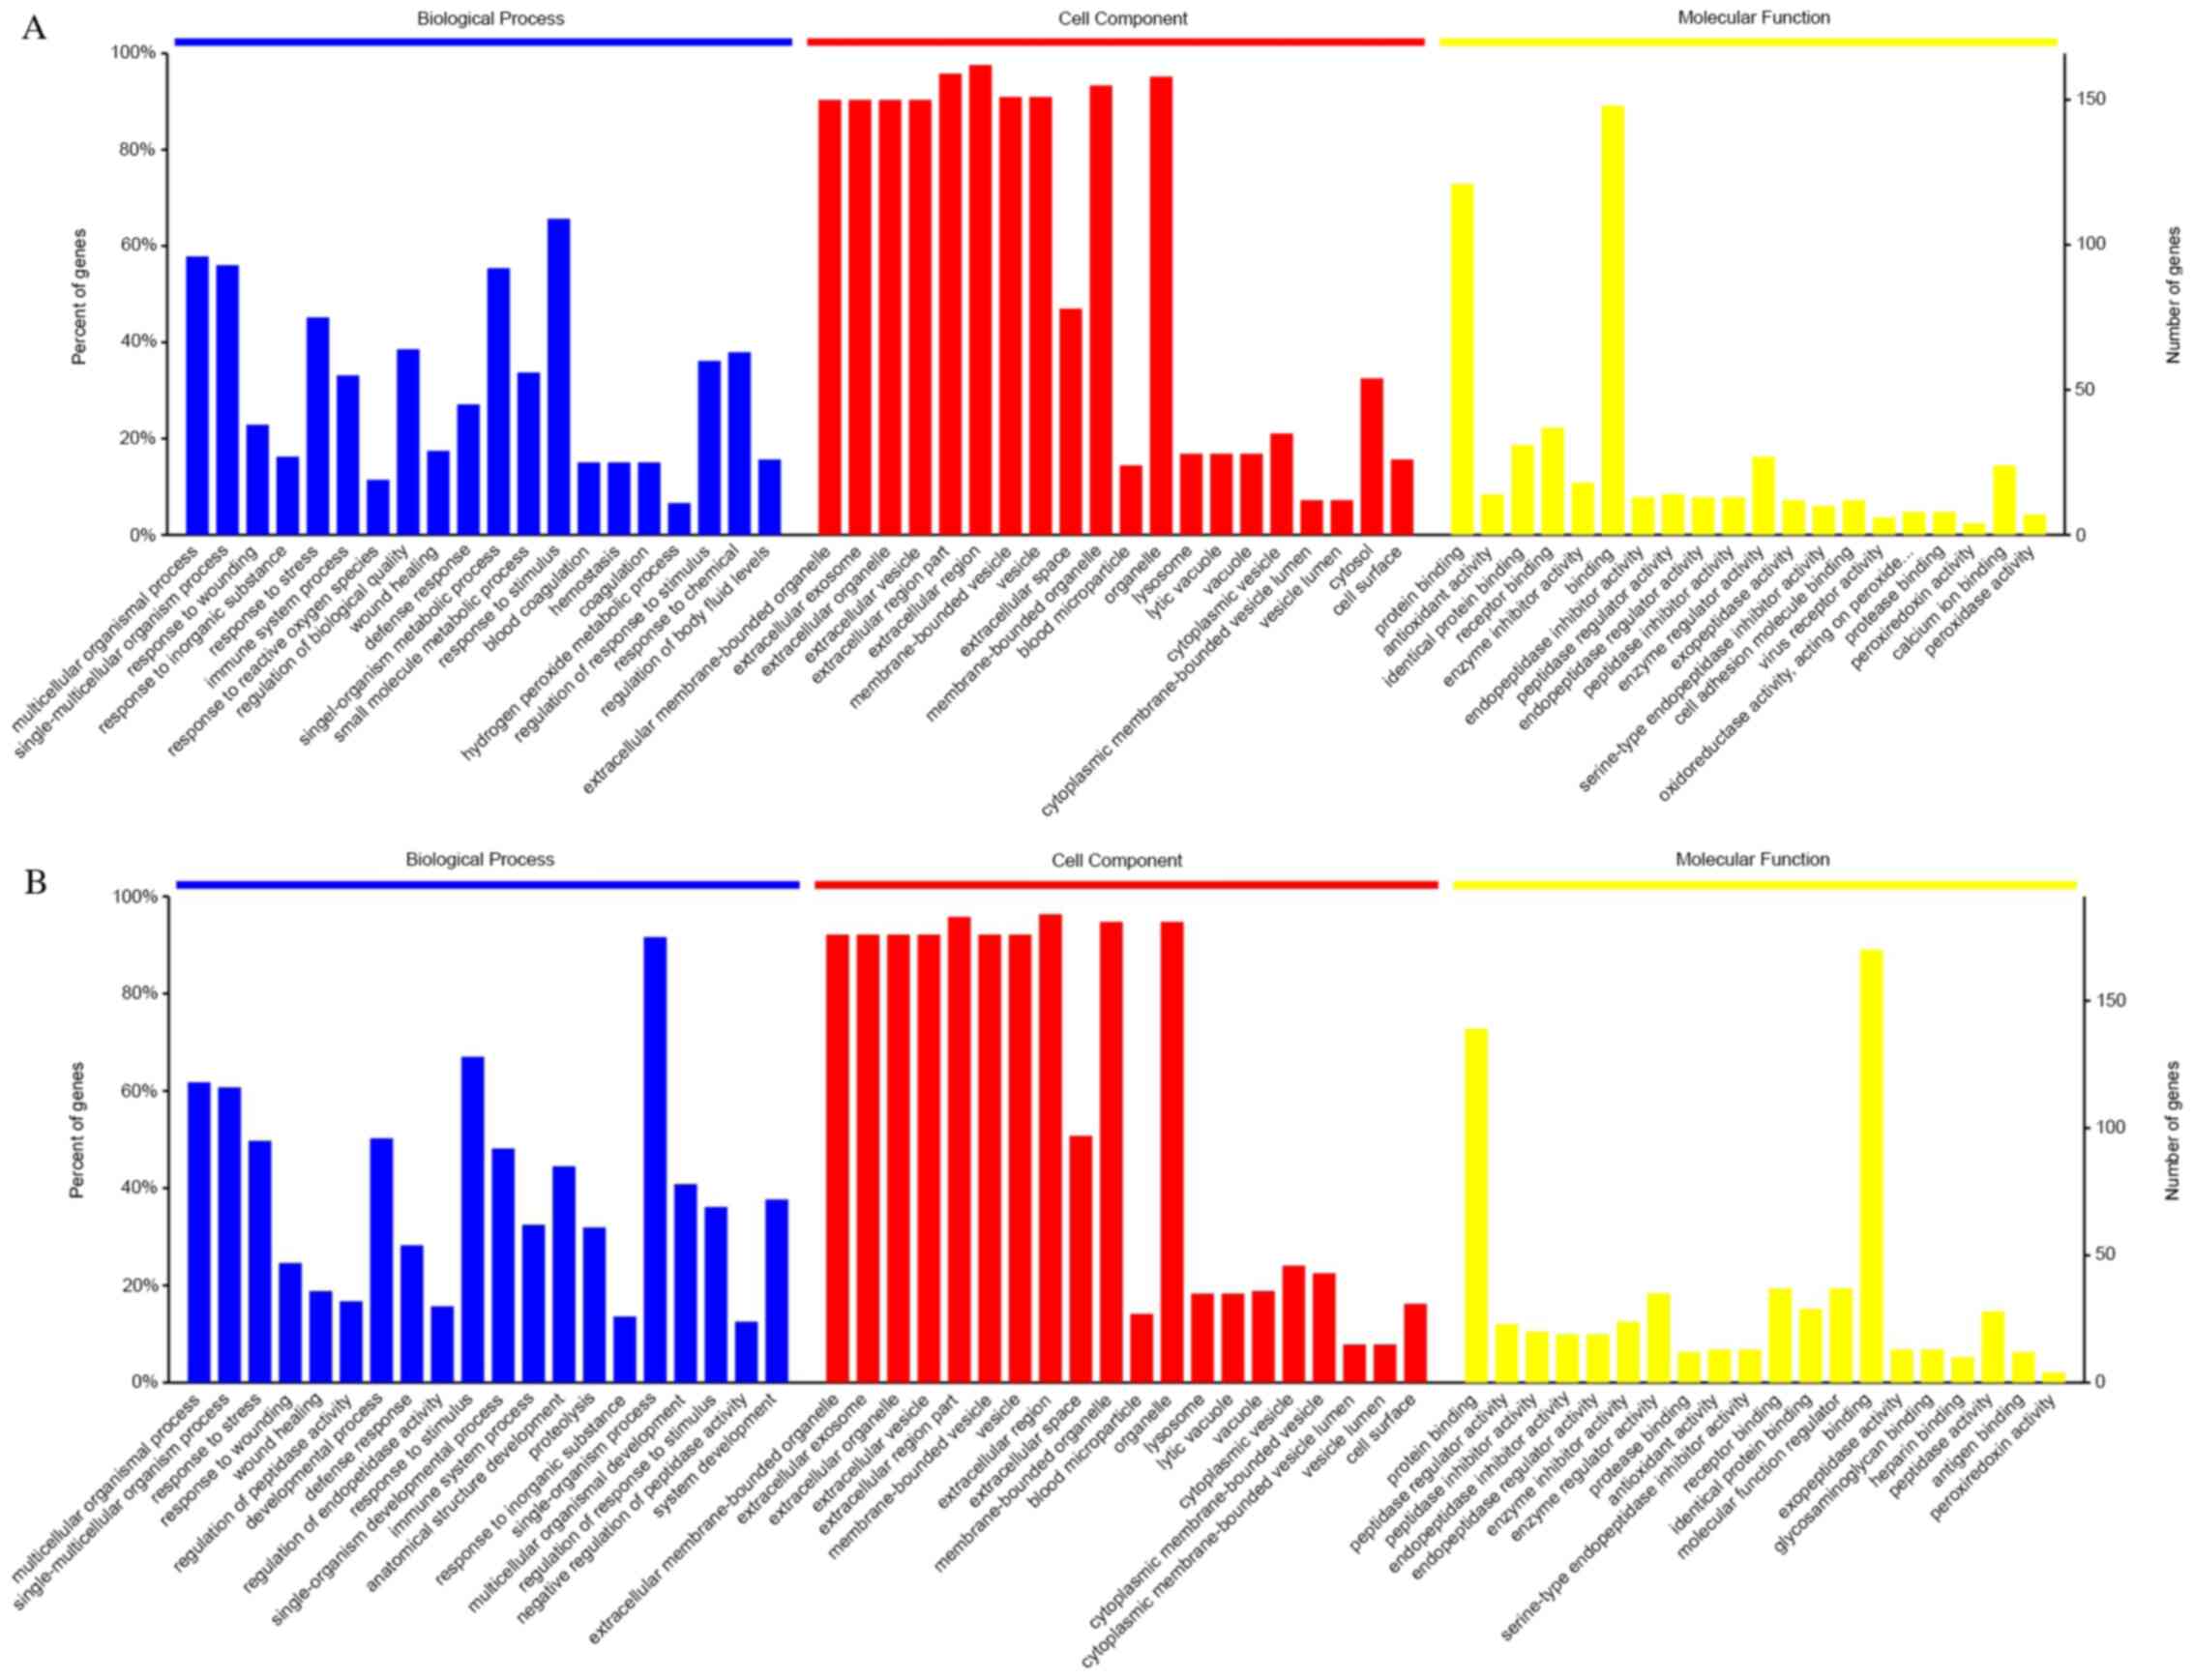
Bioinformatics analyses of urinary
proteome
The 20 most significantly enriched GO terms and
their percentages in the enrichment results of 3 of the basic
categories are presented in Fig. 2A
and B. All statistically
significant GO terms in the categories biological process, cellular
component and molecular function are listed in Tables SII and SIII. The most relevant terms were
‘extracellular region’ in the category cellular component,
‘response to stress’ in biological process and ‘binding’ in
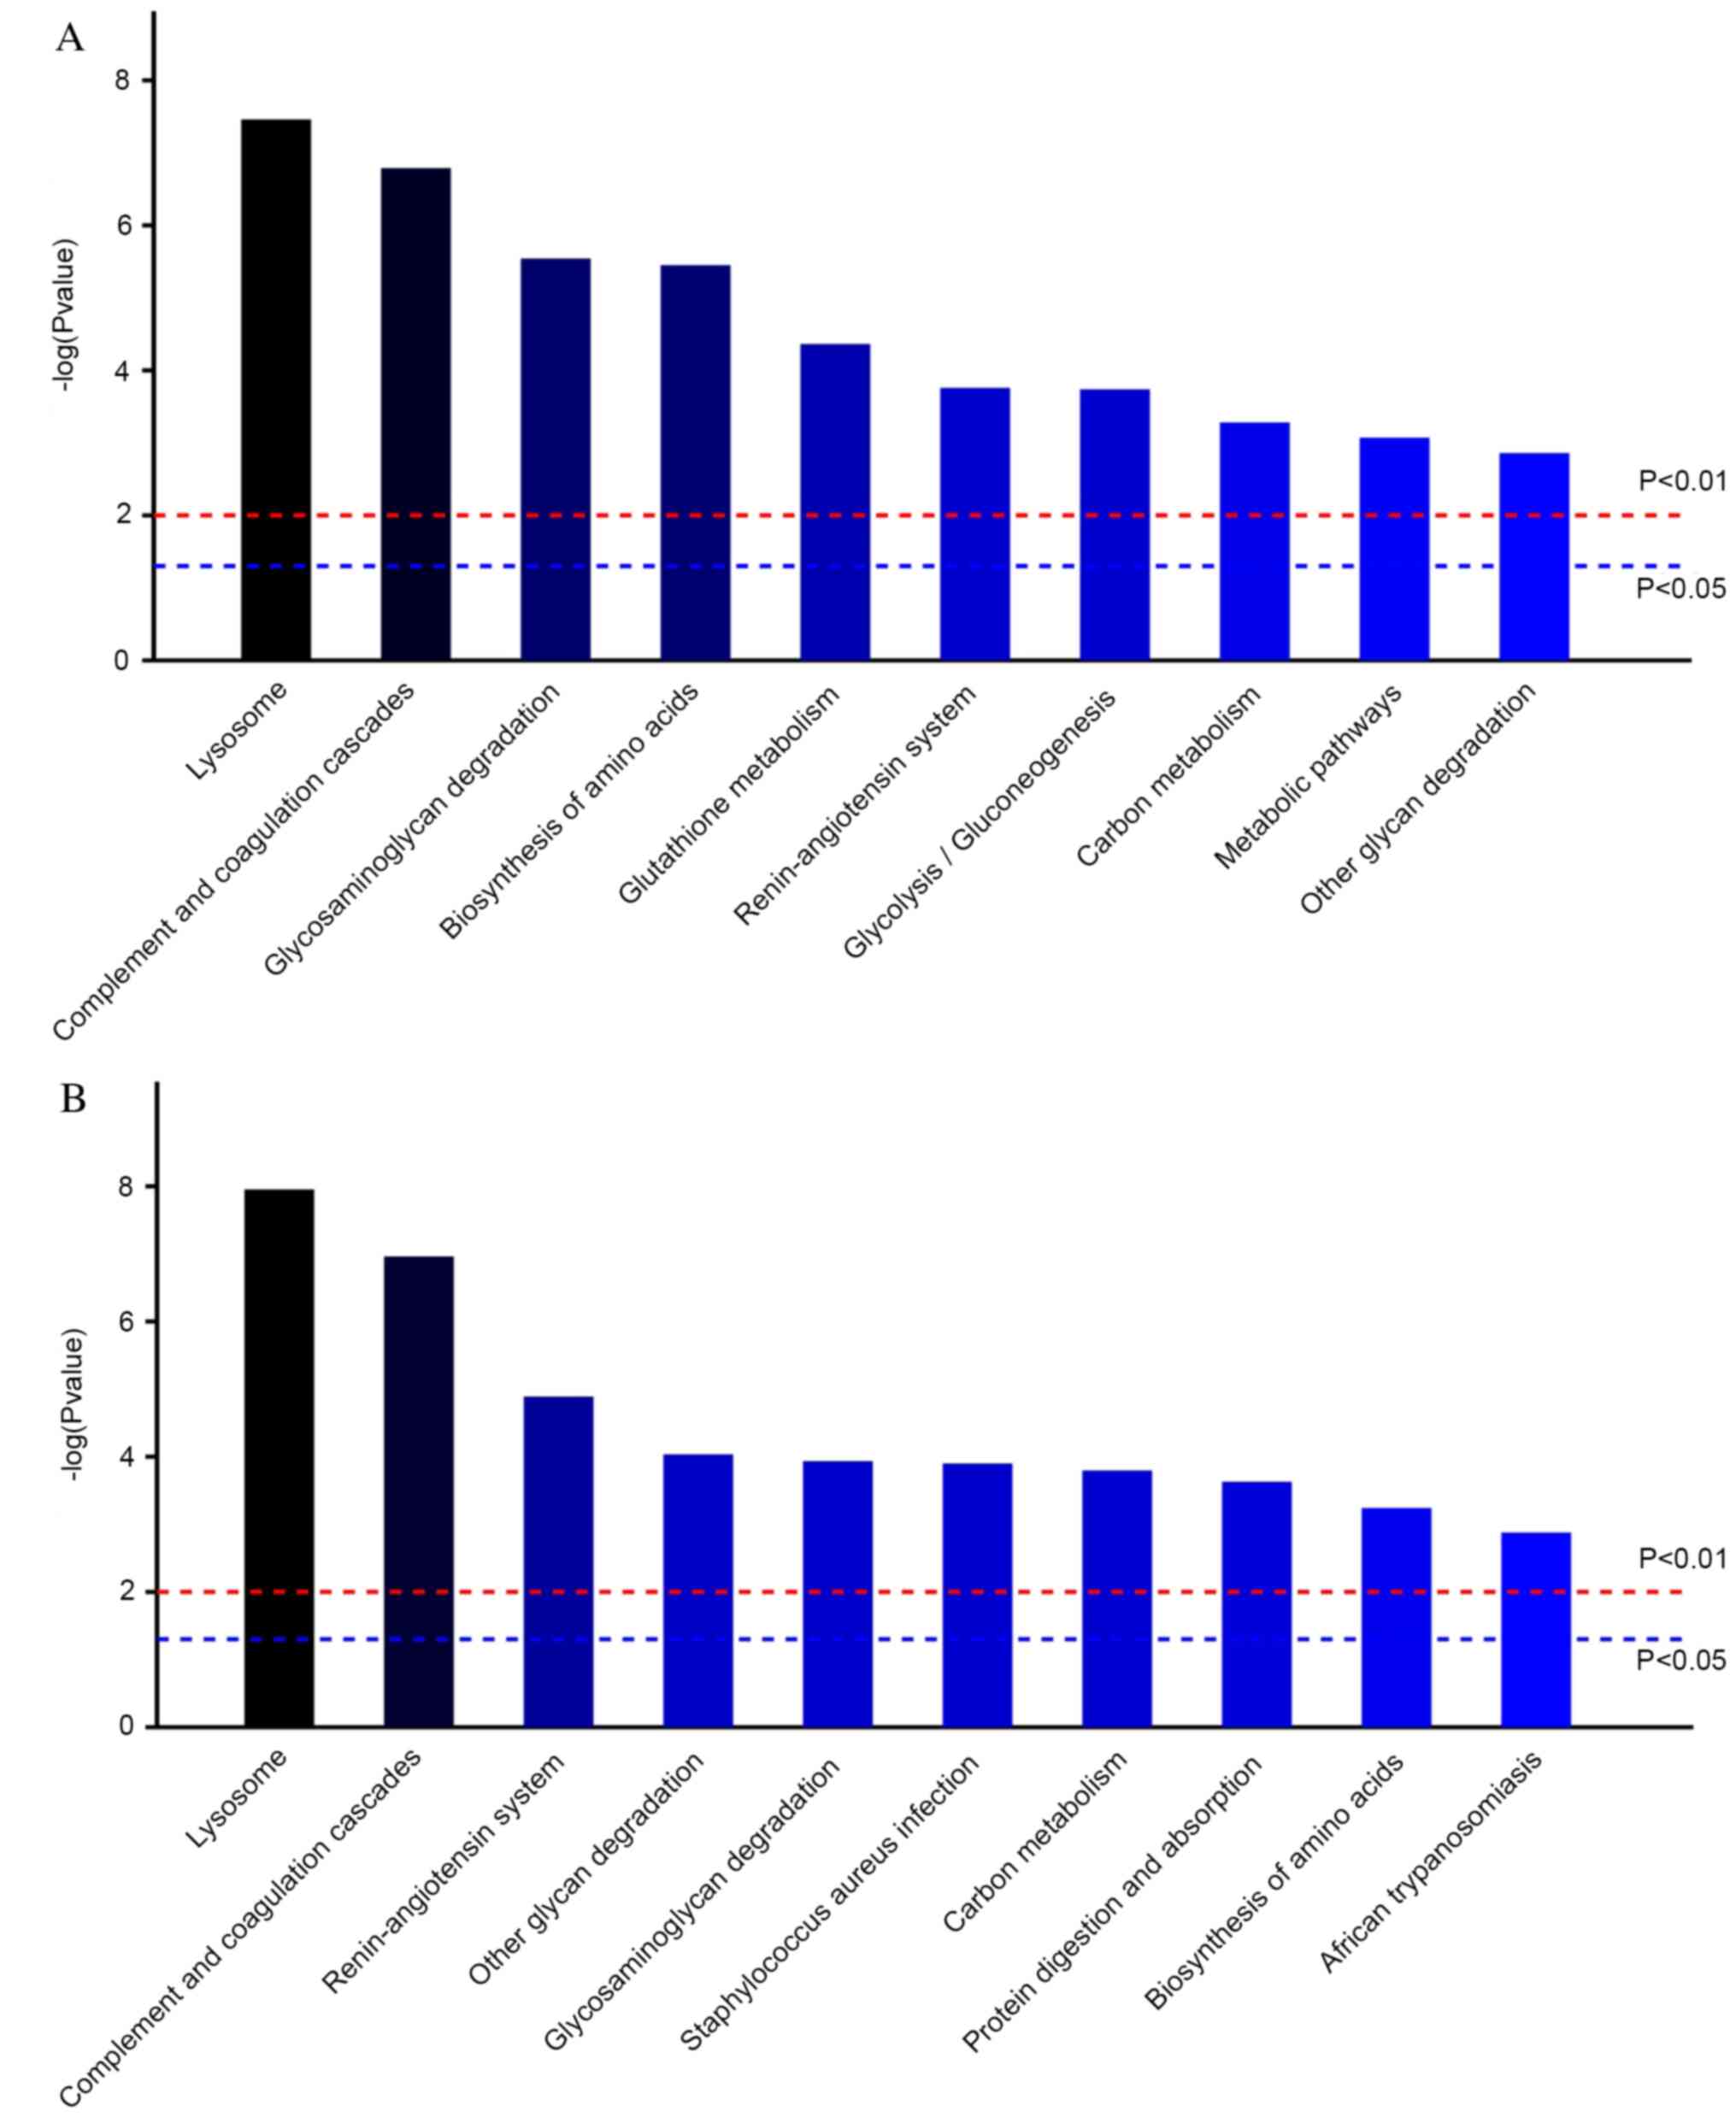
molecular function. According to the KEGG pathway analysis,
‘lysosome’, ‘complement’ and ‘coagulation cascades’ were the most
relevant in the AKI-24 h/AKI-Pre and AKI-24 h/CON-24 h comparisons
(Fig. 3A and B). All statistically significant KEGG
pathways are listed in Tables SIV
and SV.
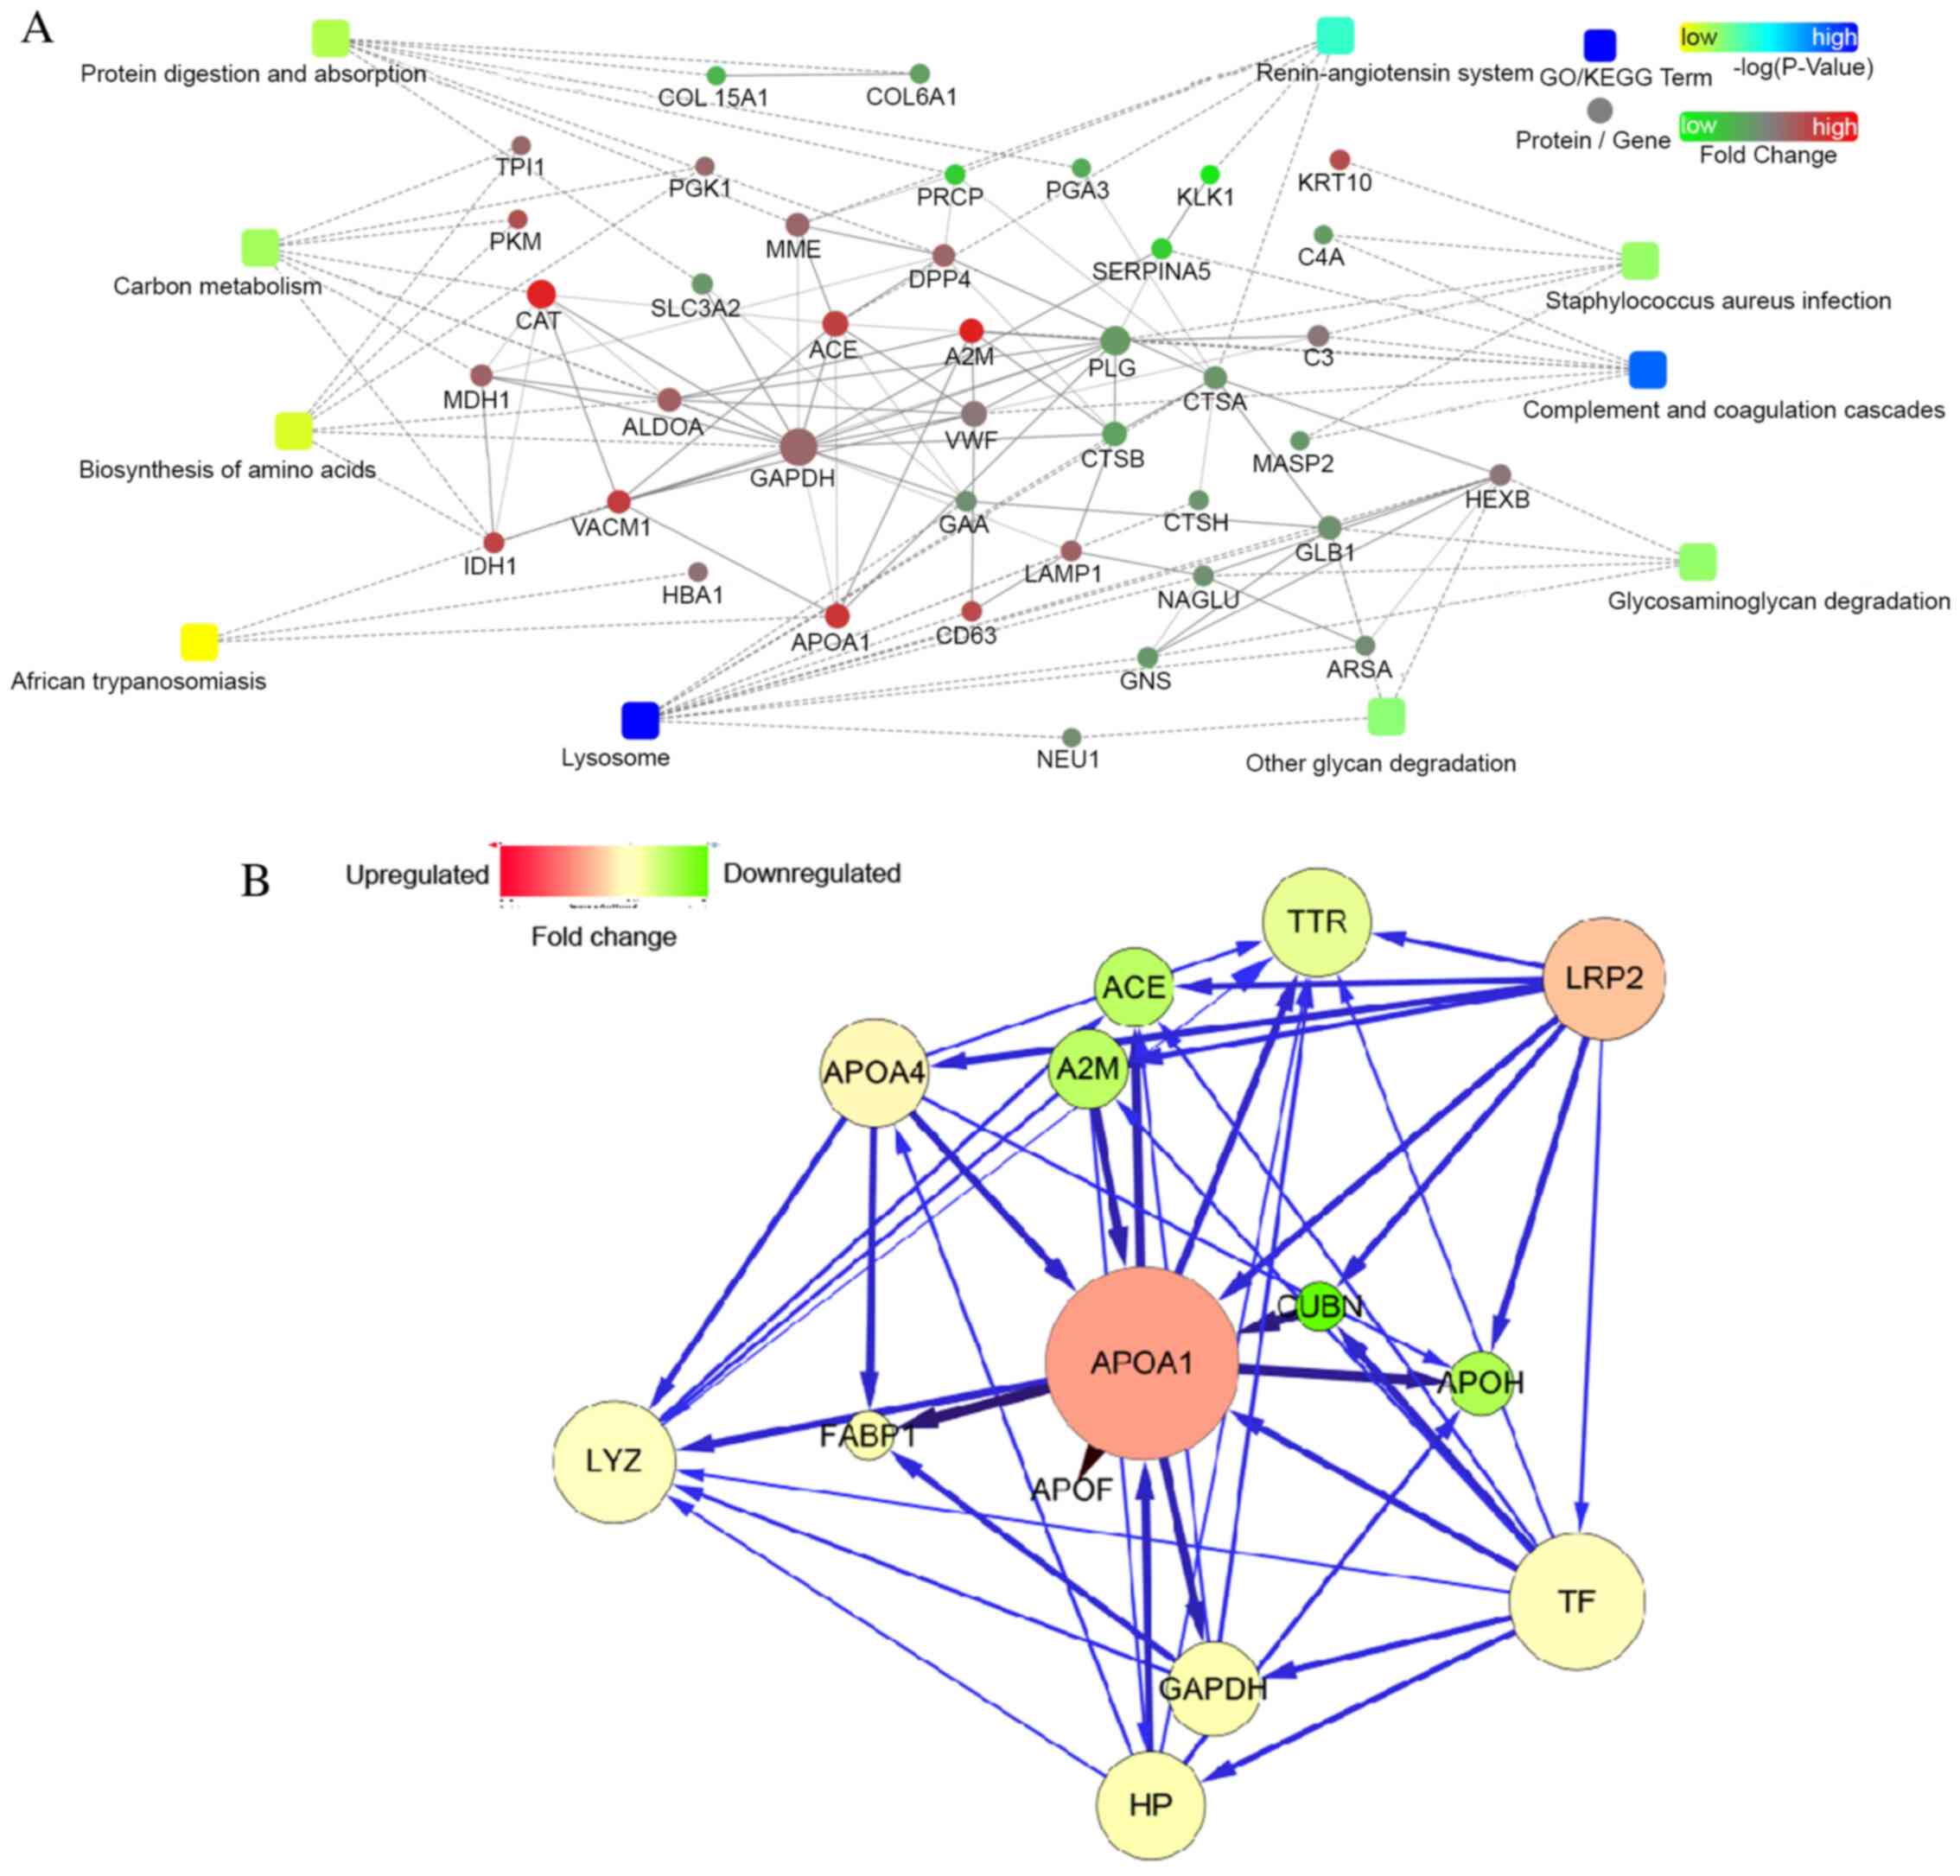
Bioinformatics analyses of apoA-I
The interaction network was illustrated using
Cytoscape software. Differentially expressed nodes identified from
the iTRAQ analysis between the AKI-24 h and AKI-Pre samples were
used as input. A force-directed layout that was restricted to the
selected node of apoA-I and its first neighbors was produced, based
on the interactions between apoA-I and proteins provided by the
STRING database (Fig. 4A and
B). ApoA-I is likely functionally
linked to the complement and coagulation cascades [with
α-2-macroglobulin (A2M)], renin-angiotensin system [with
angiotensin-converting enzyme (ACE)] and the hypoxia-inducible
factor (HIF)-1 signaling pathway (with GAPDH). Using pathway
analysis tools (http.//www.kegg.jp), several pathways
were identified to be associated with apoA-I, including ‘fat
digestion and absorption’, ‘vitamin digestion and absorption’ (with
Cubilin) and the ‘peroxisome proliferator activated receptor (PPAR)
signaling pathway’ (with fatty acid-binding protein 1). Relevant
KEGG pathways are listed in Table
SIV.
PRM validation results
In the validation set from 8 AKI- and 8 CON-group
patients (AKI-v group vs. Control-v group; Table SVI), the mean age of AKI-v group
was 75.50±9.63 years vs. 74.00±4.95 years of CON-v group, and there
were 62.5% males in AKI-v group vs. 75% in CON-v group. The
differential accumulation of the protein apoA-I was validated using
PRM analyses. The fragments selected for quantification are
presented in Table III. At 24 h
after PCI, the protein expression levels of apoA-I displayed a
5.98-fold increase from the baseline levels, as well as a 2.09-fold
increase compared with the CON group. The PRM results are
consistent with the iTRAQ quantification results.
| Table IIIPeptides and protein abundance of
apolipoprotein A-I expressed in AKI and control groups determined
via parallel reaction monitoring technology. |
Table III
Peptides and protein abundance of
apolipoprotein A-I expressed in AKI and control groups determined
via parallel reaction monitoring technology.
| Peptide | Charge | m/z | AKI-Pre | AKI-24 h | CON-24 h |
|---|
|
EQLGPVTQEFWDNLEK | 2 | 966.9705 |
1.23x10⁵ |
4.20x10⁶ | NA |
| THLAPYSDELR | 2 | 651.3279 | NA |
6.09x10⁶ |
2.87x10⁵ |
| VQPYLDDFQK | 2 | 626.8141 |
5.22x10⁶ |
8.74x10⁶ |
1.72x10⁶ |
| LLDNWDSVTSTFSK | 2 | 806.8963 | NA |
7.85x10⁶ |
3.57x10⁵ |
| ATEHLSTLSEK | 2 | 608.3144 |
2.64x10⁶ |
9.05x10⁵ | NA |
| General protein
abundance | | |
2.66x10⁶ |
5.56x10⁶ |
9.30x10⁵ |
| Fold change of
apoA-I | | | | 5.98a | 2.09b |
Discussion
At present, there is no single proven intervention
or therapy for AKI. Using novel biomarkers for early detection of
renal impairment, combined with preventive or supportive measures
may improve patient outcomes (8).
Urine is a useful sample for biomarker analysis, as it contains
cellular elements, biochemicals and proteins which may reveal, at a
given time-point, an individual's pathophysiological state.
Proteomics approaches provide unbiased information on the protein
changes in a biological sample as a whole, without pre-selection of
potential targets of interest. In the last decade, tremendous
progress has been made in urinary proteomics, in terms of
uncovering novel biomarkers and potential therapeutic targets. In
the present study, iTRAQ-based quantitative proteome analysis was
performed for the identification of urinary biomarkers for PCI-AKI.
iTRAQ has been demonstrated to be a useful tool for protein
biomarker discovery. It markedly increases the identification
sensitivity and quantitation accuracy of proteomic analyses and is
more reliable than traditional two-dimensional electrophoresis
(17). Using iTRAQ, the present
study identified a significant rise in apoA-I levels in urine of
patients with AKI as early as 24 h after PCI when compared to the
baseline levels and to that of patients in the CON group,
demonstrating that urinary apoA-I is a sensitive marker of renal
injury after PCI in elderly patients. These results were then
confirmed in an additional homogeneous cohort of individuals using
the PRM-based targeted procedure, which has been demonstrated to
have higher sensitivity and specificity for biomarker validation
compared with the traditional antibody-based ELISA or western
blotting approach (18).
These changed protein levels of apoA-I may also
provide insight into the molecular mechanisms of action underlying
the pathogenesis of PCI-AKI. While the pathophysiology of AKI
following PCI has remained to be fully elucidated, two mechanisms
of action, namely contrast media effects on renal perfusion and
direct renal tubular toxicities, are thought to be mainly involved.
The resultant reactive oxygen species-mediated oxidative stress
brought about by these two mechanisms induces an inflammatory
response in the kidneys, which may have an important role in the
pathogenesis behind PCI-AKI (5,19).
HDL-cholesterol, in addition to its well-known reverse cholesterol
transport effect, has anti-oxidative and anti-inflammatory
properties (20). ApoA-I is the
major apolipoprotein of HDL. Thiemermann et al (21) demonstrated that HDL alleviated renal
dysfunction and injury in a rat model of renal ischemia/reperfusion
(I/R). This capability of HDL was in part related to an independent
property of apoA-I, which may reduce lipid peroxidation subsequent
to oxidative stress in kidneys subjected to renal I/R.
Administration of the synthetic apoA-I mimetic peptide 4F resulted
in the induction of nitric oxide synthase, preventing the release
of proinflammatory cytokines and the restoration of renal function.
Li et al (22) determined
that apoA-I overexpression in mice had a protective effect on
LPS-induced systemic inflammation and multiple organ injury
including the kidneys through the suppression of endothelial cell
adhesion molecules (intercellular adhesion molecule-1 and
P-selectin), downregulation of NF-κB and the inhibition of
neutrophil activation. Hence, it is conceivable that raised
expression levels of apoA-I in urine may suggest the absence of its
protective role early in the course of PCI-AKI. Furthermore, the
anti-oxidant and anti-inflammatory properties demonstrated in
previous studies (23,24), along with the bioinformatics
analysis in the present study, revealed that the network
interactions of proteins confirmed a close relationship between
apoA-I and A2M, ACE, GAPDH and FABP1. These proteins may
participate in the metabolism of apoA-I, which is associated with
the complement and coagulation cascades, as well as the
renin-angiotensin system, and the HIF-1 and the PPAR signaling
pathways. These results indicated that the combination of these
genes was responsible for the development of the AKI-group, which
suggested potential directions for future research.
The data from the clinical tests in the present
study also indicated that lower levels of plasma HDL-C and apoA-I
prior to PCI were associated with a higher incidence of subsequent
PCI-AKI. This result was not related to statin use or its dosage,
consistent with previous studies. However, it is not clear whether
low plasma HDL-C and apoA-I levels prior to PCI are related to the
overexpression of urinary apoA-I after PCI, as the current
experiment cannot distinguish whether urinary apoA-I was derived
from plasma or the proximal tubules reflecting AKI. In addition, the
present study enrolled patients with a wide range of clinical
presentations. It was inevitable that patients with decreased renal
function (30< eGFR <60 ml/min) were involved in the present
study. Recent studies have indicated that there is a relationship
between patients with CKD and HDL-C dysfunction rather than HDL-C
deficiency, leading to increased oxidative stress and inflammation
(21). As such, further research
may be performed to investigate the HDL-C/apoA-I quality during the
development of PCI-AKI, particularly in high-risk populations.
The present study had several limitations. First,
the study was a single-center study with a relatively small sample
size. The patients enrolled were all older than 60 years with
hypertension, CKD or diabetes. Although baseline-matched patients
were selected as controls and pooled samples were analyzed to
eliminate the individual heterogeneity, the nested case-control
design of the present study may still have been predisposed to bias
and residual confounding. However, this relatively non-selected
patient population was used in the current study, which may reflect
the real clinical condition. Further studies are required to
replicate and validate the current findings. Moreover, due to the
limited sample size of the present study, a multi-center study with
a larger sample size would be needed. As another limitation, in the
present study, apoA-I was the only protein selected for validation,
which may have resulted in certain valuable proteins which are not
related to lipids being neglected. There are likely to be other
proteins, besides apoA-I, which may prove useful as biomarkers for
PCI-AKI. Additional biomarker candidates from the current iTRAQ
results should be further investigated in future studies to
determine their clinical value in PCI-AKI. It is also possible that
a multiple urine-protein panel consisting of multiple biomarkers
may provide greater specificity and sensitivity than individual
biomarkers alone. As such, a panel may be more valuable to be
developed a reliable biomarker for PCI-AKI. Furthermore, all
clinical information should be considered when evaluating biomarker
data, including patients <60 years old, without hypertension,
CKD or diabetes. Further analyses may be performed in the future,
such as receiver operating characteristic or multivariate logistic
regression, to better determine the marker ability of apoA-I for
PCI-AKI.
In conclusion, apoA-I may be a promising biomarker
candidate for early diagnosis (24 h post-contrast, prior to Scr
levels rising) for PCI-AKI in elderly patients. It may be
hypothesized that there are causal mechanisms involving apoA-I in
PCI-AKI. In future studies, the role and regulation of apoA-I
should be investigated further during the development of PCI-AKI,
particularly the relationship between plasma HDL-C and apoA-I
levels prior to PCI and the raised expression levels of urinary
apoA-I after PCI.
Supplementary Material
Differentially expressed proteins in
the AKI-24h/CON-24h comparison.
Statistically significant GO terms in
the category of molecular function for AKI-24 h/AKI-Pre.
Statistically significant GO terms in
the category of molecular function for AKI-24 h/CON-24 h.
Statistically significant KEGG
pathways for AKI-24 h/AKI-Pre.
Statistically significant KEGG
pathways for AKI-24 h/CON-24 h.
Baseline clinical characteristics of
patients from the validation set in the AKI-v (n=8) and control-v
(n=8) groups.
Acknowledgements
The authors would like to thank Dr Chenpin Shen
(Department of Chemistry and Institutes of Biomedical Sciences,
Fudan University, Shanghai, China) for helpful experimental
assistance. Results presented in this study were included in a
poster presentation (abstract no. SP242) at the 55th European Renal
Association-European Dialysis and Transplant Association Congress
in 2018 (Copenhagen, Denmark).
Funding
Funding: This study was supported in part by a project from the
Medical Sciences Research Foundation of Zhejiang Province (grant
no. 201336474 to QL) and Ningbo City Natural Sciences Research
Foundation of Ningbo City (grant no. 2013A610266 to FZ). The
funders had no role in the study design, data collection and
analysis, decision to publish or preparation of the manuscript.
Availability of data and materials
The datasets used and/or analyzed during the present
study are available from the corresponding author on reasonable
request. The dataset generated in the present study was deposited
at https://www.iprox.org (project ID IPX0002961000;
https://www.iprox.org//page/subproject.html?id=IPX0002961000).
Authors' contributions
FZ and QL conceived and designed the study. LHa, GS
and LHu performed the experiments. HY contributed to acquisition of
data. FZ contributed to the analysis and interpretation of data,
and wrote the paper. QL and HY reviewed and edited the manuscript.
All authors read and approved the final manuscript.
Ethics approval and consent to
participate
The present study was approved by the ethics
committee of HwaMei Hospital, University of Chinese Academy of
Sciences (Ningbo, China). Written informed consent was obtained
from each of the patients involved in the study.
Patient consent for publication
Not applicable.
Competing interests
The authors declare that they have no competing
interests.
References
|
1
|
Ozkok S and Ozkok A: Contrast-induced
acute kidney injury, A review of practical points. World J Nephrol.
6:86–99. 2017.PubMed/NCBI View Article : Google Scholar
|
|
2
|
Chalikias G, Drosos I and Tziakas DN:
Prevention of contrast-induced acute kidney injury: An update.
Cardiovasc Drugs Ther. 30:215–228. 2016.PubMed/NCBI View Article : Google Scholar
|
|
3
|
Fähling M, Seeliger E, Patzak A and
Persson PB: Understanding and preventing contrast-induced acute
kidney injury. Nat Rev Nephrol. 13:169–180. 2017.PubMed/NCBI View Article : Google Scholar
|
|
4
|
McCullough PA, Choi JP, Feghali GA,
Schussler JM, Stoler RM, Vallabahn RC and Mehta A: Contrast-induced
acute kidney injury. J Am Coll Cardiol. 68:1465–1473.
2016.PubMed/NCBI View Article : Google Scholar
|
|
5
|
Mamoulakis C, Tsarouhas K, Fragkiadoulaki
I, Heretis I, Wilks MF, Spandidos DA, Tsitsimpikou C and Tsatsakis
A: Contrast-induced nephropathy: Basic concepts, pathophysiological
implications and prevention strategies. Pharmacol Ther. 180:99–112.
2017.PubMed/NCBI View Article : Google Scholar
|
|
6
|
Andreucci M, Faga T, Riccio E, Sabbatini
M, Pisani A and Michael A: The potential use of biomarkers in
predicting contrast-induced acute kidney injury. Int J Nephrol
Renovasc Dis. 9:205–221. 2016.PubMed/NCBI View Article : Google Scholar
|
|
7
|
Luo Q, Zhou F, Dong H, Wu L, Chai L, Lan K
and Wu M: Implication of combined urinary biomarkers in early
diagnosis of acute kidney injury following percutaneous coronary
intervention. Clin Nephrol. 79:85–92. 2013.PubMed/NCBI View
Article : Google Scholar
|
|
8
|
De Loor J, Gevaert K, Hoste E and Meyer E:
How has urinary proteomics contributed to the discovery of early
biomarkers of acute kidney injury? Expert Rev Proteomics.
11:415–424. 2014.PubMed/NCBI View Article : Google Scholar
|
|
9
|
Sigdel TK, Gao Y, He J, Wang A, Nicora CD,
Fillmore TL, Shi T, Webb-Robertson BJ, Smith RD, Qian WJ, et al:
Mining the human urine proteome for monitoring renal transplant
injury. Kidney Int. 89:1244–1252. 2016.PubMed/NCBI View Article : Google Scholar
|
|
10
|
Luczak M, Formanowicz D, Marczak Ł,
Suszyńska-Zajczyk J, Pawliczak E, Wanic-Kossowska M and Stobiecki
M: iTRAQ-based proteomic analysis of plasma reveals abnormalities
in lipid metabolism proteins in chronic kidney disease-related
atherosclerosis. Sci Rep. 6(32511)2016.PubMed/NCBI View Article : Google Scholar
|
|
11
|
Rao S, Walters KB, Wilson L, Chen B,
Bolisetty S, Graves D, Barnes S, Agarwal A and Kabarowski JH: Early
lipid changes in acute kidney injury using SWATH lipidomics coupled
with MALDI tissue imaging. Am J Physiol Renal Physiol.
310:F1136–F1147. 2016.PubMed/NCBI View Article : Google Scholar
|
|
12
|
Park HS, Kim CJ, Hwang BH, Kim TH, Koh YS,
Park HJ, Her SH, Jang SW, Park CS, Lee JM, et al: HDL cholesterol
level is associated with contrast induced acute kidney injury in
chronic kidney disease patients undergoing PCI. Sci Rep.
6(35774)2016.PubMed/NCBI View Article : Google Scholar
|
|
13
|
Smith LE, Smith DK, Blume JD, Linton MF
and Billings FT IV: High-Density Lipoprotein cholesterol
concentration and acute kidney injury after cardiac surgery. J Am
Heart Assoc. 6(e006975)2017.PubMed/NCBI View Article : Google Scholar
|
|
14
|
Shi T, Song E, Nie S, Rodland KD, Liu T,
Qian WJ and Smith RD: Advances in targeted proteomics and
applications to biomedical research. Proteomics. 16:2160–2182.
2016.PubMed/NCBI View Article : Google Scholar
|
|
15
|
Kidney Disease: Improving Global Outcomes
(KDIGO) Acute Kidney Injury Work Group: KDIGO clinical practice
guideline for acute kidney injury. Kidney Int Suppl. 2:1–138.
2012.
|
|
16
|
Levey AS, Stevens LA, Schmid CH, Zhang YL,
Castro AF III, Feldman HI, Kusek JW, Eggers P, Van Lente F, Greene
T, et al: A new equation to estimate glomerular fltration rate. Ann
Intern Med. 150:604–612. 2009.PubMed/NCBI View Article : Google Scholar
|
|
17
|
Michael H, Justin D and Virginia E:
Current state of the art for enhancing urine biomarker discovery.
Expert Rev Proteomics. 13:609–626. 2016.PubMed/NCBI View Article : Google Scholar
|
|
18
|
Chen Y, Mao P and Wang D: Quantitation of
intact proteins in human plasma using top-down parallel reaction
monitoring-MS. Anal Chem. 90:10650–10653. 2018.PubMed/NCBI View Article : Google Scholar
|
|
19
|
Andreucci M, Faga T, Pisani A, Sabbatini M
and Michael A: Acute kidney injury by radiographic contrast media:
Pathogenesis and prevention. Biomed Res Int.
2014(362725)2014.PubMed/NCBI View Article : Google Scholar
|
|
20
|
Moreira RS, Irigoyen M, Sanches TR,
Volpini RA, Camara NO, Malheiros DM, Shimizu MH, Seguro AC and
Andrade L: Apolipoprotein A-I mimetic peptide 4F attenuates kidney
injury, heart injury, and endothelial dysfunction in sepsis. Am J
Physiol Regul Integr Comp Physiol. 307:R514–R524. 2014.PubMed/NCBI View Article : Google Scholar
|
|
21
|
Thiemermann C, Patel NS, Kvale EO,
Cockerill GW, Brown PA, Stewart KN, Cuzzocrea S, Britti D,
Mota-Filipe H and Chatterjee PK: High density lipoprotein (HDL)
reduces renal schemia/reperfusion injury. J Am Soc Nephrol.
14:1833–1843. 2003.PubMed/NCBI View Article : Google Scholar
|
|
22
|
Li Y, Dong JB and Wu MP: Human ApoA-I
overexpression diminishes LPS-induced systemic inflammation and
multiple organ damage in mice. Eur J Pharmacol. 590:417–422.
2008.PubMed/NCBI View Article : Google Scholar
|
|
23
|
van der Vorst EPC: High-density
lipoproteins and apolipoprotein A1. Subcell Biochem. 94:399–420.
2020.PubMed/NCBI View Article : Google Scholar
|
|
24
|
Tanaka S, Couret D, Tran-Dinh A, Duranteau
J, Montravers P, Schwendeman A and Meilhac O: High-density
lipoproteins during sepsis: From bench to bedside. Crit Care.
24(134)2020.PubMed/NCBI View Article : Google Scholar
|