Introduction
Leucine-rich repeat LGI family member 3 (LGI3;
formerly known as leucine-rich glioma inactivated 3) is a secretory
protein belonging to the vertebrate LGI family that is abundantly
expressed in the brain (1). LGI3
expression in the brain has been suggested to be regulated by
activating enhancer-binding protein 2 and neuron-restrictive
silencer at the transcriptional level (1). Our research group previously reported
that LGI3 regulates neuronal exocytosis and differentiation
(2,3). Additionally, LGI3 expression in the
epidermal layer of the skin has been identified, where it may act
as a cutaneous cytokine (4). Our
group previously established that LGI3 is secreted by keratinocytes
in response to ultraviolet B irradiation, protecting cells
(4). It was also determined that
LGI3 promotes the migration, differentiation and inflammatory
responses of keratinocytes (5-8)
and melanocyte pigmentation (9).
LGI3 may also be associated with the cytokine network in cancer
(10-12)
and its expression is associated with the prognosis of patients
with glioma and non-small cell lung cancer (11,13).
Notably, the expression and genetic variations of LGI3 may serve
potential prognostic roles in various types of cancer (10).
Earlier studies have indicated that LGI3 is
expressed in adipose tissues in mice and that its expression is
reduced during adipogenesis and increased in the adipose tissues of
obese mice (14,15). It has also been demonstrated that
LGI3 suppresses adipogenesis via its receptor, disintegrin and
metalloproteinase domain-containing protein 23 (ADAM23) (14). Moreover, LGI3 upregulates the
expression of proinflammatory genes, including TNF-α in macrophage
cells (14), and downregulates
adiponectin (15). Notably, LGI3
and TNF-α are mutually upregulated via NF-κB, suggesting their
cooperative role in metabolic inflammation in obesity (16). It is hypothesized that LGI3 is a
multifunctional cytokine and proinflammatory adipokine that
functionally interacts with various cytokines, adipokines,
chemokines and signaling proteins (12).
To gain an insight into the functional network of
LGI3 in adipose tissues, integrative analyses were performed based
on protein expression and phosphorylation arrays, gene
co-expression networks (GCNs), protein-protein interaction networks
and expression quantitative trait loci (eQTL). In the present
manuscript, evidence was presented to support the hypothesis that
LGI3 has differential functions in subcutaneous adipose tissues
(SATs) and visceral adipose tissues (VATs).
Materials and methods
Animals and cell culture
All animal protocols were approved by the
Institutional Animal Care and Use Committee of Chung-Ang University
(Seoul, Korea). All animal studies complied with the ARRIVE
guidelines (17). Briefly, all
animal welfare considerations were taken including daily monitoring
of health and behavior and minimizing suffering and distress by
practicing euthanasia as described below. LGI3-knockout mice were
generated by Macrogen, Inc. (15).
Adipose tissue samples at autopsy and plasma collected before
euthanasia were obtained from 6 10-week-old mice (mean body weight,
26 g) bred and maintained in a rodent facility under a 12 h
light/dark cycle, at a relative humidity of 55±15% and a constant
temperature (23±3˚C). The animals were provided with food and water
ad libitum. A total of 6 male mice (three wild type and
three LGI3 homozygous knockout mice) were euthanized by cervical
dislocation and death was confirmed by loss of respiration and
heartbeat. The duration of the experiment was 10 weeks and no mice
were found dead during the period. White adipose tissues (WATs,
epididymal fat) and plasma were obtained from mice and 3T3-L1 cells
(American Type Culture Collection) were cultured as previously
described (14).
Preparation of recombinant LGI3 and
protein array analysis
Recombinant LGI3 protein was purified as previously
described (3). Briefly,
LGI3-His6 protein was expressed in E. coli BL21
(DE3) using the pET28a(+) expression vector (Novagen;
Sigma-Aldrich; Merck KGaA) and chaperone system (pGro7; Takara
Bio., Inc.). The protein was purified using TALON Metal Affinity
Resin (Clontech Laboratories, Inc.). 3T3-L1 cells were treated with
LGI3 (10 ng/ml) at 37˚C for 1 and 24 h for phosphoprotein array
analysis and signaling protein analysis, respectively.
Phosphoprotein array analysis was performed using the Phospho
Explorer Antibody Array (cat. no. PEX100; Full Moon BioSystems,
Inc.). Signaling protein analysis was performed using the Signaling
Explorer Antibody Array (cat. no. SET100; Full Moon BioSystems,
Inc.) and the Explorer Antibody Array (cat. no. ASB600; Full Moon
BioSystems, Inc.). All assays were performed in accordance with the
manufacturer's instructions. Cell extracts were prepared using the
protein extraction buffer (EXB050; Full Moon BioSystems, Inc.) and
Antibody Array Assay Kit (cat. no. KAS02; Full Moon BioSystems,
Inc.) and analyzed using ExDEGA 1.1.9.0 (eBiogen, Inc.) according
to the manufacturer's protocol. Data normalized using
|log2(fold change)|≥1 (P<0.05) were used for
integrative analyses.
Preparation of adipose tissues and
cytokine array analysis
Adipose tissue extracts were prepared by
homogenizing tissues in Dulbecco's phosphate-buffered saline
(Sigma-Aldrich; Merck KGaA) containing a cocktail of protease
inhibitors (Roche Diagnostics). After homogenization, Triton X-100
was added to a final concentration of 1% and the samples were
frozen at -70°C, thawed and centrifuged at 10,000 x g
for 5 min at 4˚C. The supernatants were then used to investigate
the cytokine profile by employing the Mouse XL Cytokine Array kit
(cat. no. ARY028; R&D Systems, Inc.) according to the
manufacturer's protocol. The Mouse XL Cytokine Array kit differs
from the Adipokine and Cytokine Array Kits used in our previous
study (12). These contain 111
capture antibodies, including 76 cytokine antibodies that were not
included in the arrays of the previous study.
Protein-protein interaction network
and functional enrichment analysis
A protein-protein interaction network was generated
using data from the Search Tool for the Retrieval of Interacting
Genes/Proteins (version 11.0; http://string-db.org) (18) and visualized by Cytoscape 3.8.0
(https://cytoscape.org) using an interaction
degree-sorted circle layout (19).
Network centrality was analyzed by Cytoscape 3.8.0 using the
closeness centrality method (20).
Functional enrichment analysis and Kyoto Encyclopedia of Genes and
Genomes (KEGG) pathway analysis were performed using the Database
for Annotation, Visualization and Integrated Discovery (version
6.8; https://david.ncifcrf.gov) (21). The results were sorted based on the
P-values and entries with P<0.05 were presented.
Gene co-expression network (GCN)
analysis
GCN analysis was performed using the GCNs of human
SATs (UUID: 7054a727-5ca3-11e7-8f50-0ac135e8bacf) and VATs
(omentum; UUID: c8749eba-5ca3-11e7-8f50-0ac135e8bacf) (22) obtained from the Network Data
Exchange (NDEx; version 2.4.5; http://www.ndexbio.org) (23) and visualized by Cytoscape 3.8.0
using the prefuse force-directed layout. The gene ontology (GO)
categories associated with the GCN were mapped using BiNGO 3.0.4
(http://apps.cytoscape.org/apps/bingo)
and visualized by Cytoscape 3.8.0 using the edge-weighted
spring-embedded layout. The hypergeometric test and Bonferroni
correction were used to obtain P-values (24). Comparative analysis of categorized
gene groups was presented as a Venn diagram generated using Venny
2.1 (http://bioinfogp.cnb.csic.es/tools/venny). The
association between genes and transcription factors with respect to
transcriptional regulation was assessed using transcription factor
affinity prediction (http://trap.molgen.mpg.de) tools (25). RNA-seq data were obtained from the
Human Protein Atlas (https://www.proteinatlas.org) and the GTEx project
(https://www.gtexportal.org).
Analysis of eQTL
Single-tissue eQTL of adipose tissues were
identified by searching the Genotype-Tissue Expression (GTEx)
portal (https://www.gtexportal.org) (26). RNA sequencing (RNA-seq) data for the
gene expression levels in subcutaneous (n=581) and visceral
(omentum; n=469) adipose tissues were used for evaluation of the
effect of eQTL on LGI3 expression. Single nucleotide variants
(SNVs) in eQTL that affect LGI3 expression with P<0.01 and false
discovery rate <0.05 were considered to be statistically
significant.
Statistical analysis
Significance was assessed using ANOVA with
Bonferroni correction. The results were considered significant at
P<0.05. Statistical analyses were conducted using SPSS version
26 (IBM Corp.) and all statistical tests were two-sided. The
hypergeometric test and Bonferroni correction were used to obtain
P-values in BiNGO analysis and nominal P-values were generated by
the linear regression model between genotype and expression in eQTL
analysis.
Results
Effect of LGI3 knockout on cytokine
profiles
The WATs and plasma derived from wild-type and
LGI3-knockout mice were employed as samples for analyzing cytokine
profiles using protein arrays (Fig.
1). The results indicated that the expression levels of various
cytokines were increased or decreased in LGI3-knockout mice in
comparison with WT mice (Fig. 1).
The cytokines with increased expression included fibroblast growth
factor 1 (FGF1), adiponectin (C1Q and collagen domain containing;
ADIPOQ), chemokine (C-C motif) ligand 6 (CCL6), retinoic acid
receptor responder 2 (RARRES2), insulin-like growth factor binding
protein 6 (IGFBP6), periostin (POSTN), cystatin C (CST3), prolactin
family 2 subfamily c member 2 (PRL2C2), complement factor D (CFD),
dipeptidyl peptidase 4 (DPP4), regenerating islet-derived 3γ
(REG3G), resistin (RETN), α-2-HS glycoprotein (AHSG), insulin-like
growth factor binding protein 2 (IGFBP2), serpin family E member 1
(SERPINE1), delta-like noncanonical notch ligand 1 (DLK1) and
insulin-like growth factor binding protein 1 (IGFBP1) (Fig. 1 a-f,
h-p, s, v-x, α;
Table I). The cytokines with
reduced levels of expression included coagulation factor III,
tissue factor (F3), insulin-like growth factor binding protein 5
(IGFBP5), C-C motif chemokine ligand 11 (CCL11), growth arrest
specific 6 (GAS6), C-X-C motif chemokine ligand 5 (CXCL5), TNF
superfamily member 13b (TNFSF13B) and C-C motif chemokine ligand 21
(CCL21) (Table I; Fig. 1 g,
q, r, t,
u, y, z).
CCL6, PRL2C2 and RARRES2 were found to be increased in the WATs as
well as in the plasma of LGI3-knockout mice (Fig. 1; CCL6, c, p; PRL2C2, i, x; RARRES2,
d, s). Several cytokines (IGFBP5, ADIPOQ, DLK1, IGFBP1 and
SERPINE1) had previously been reported to be regulated by LGI3
(Table I) (12).
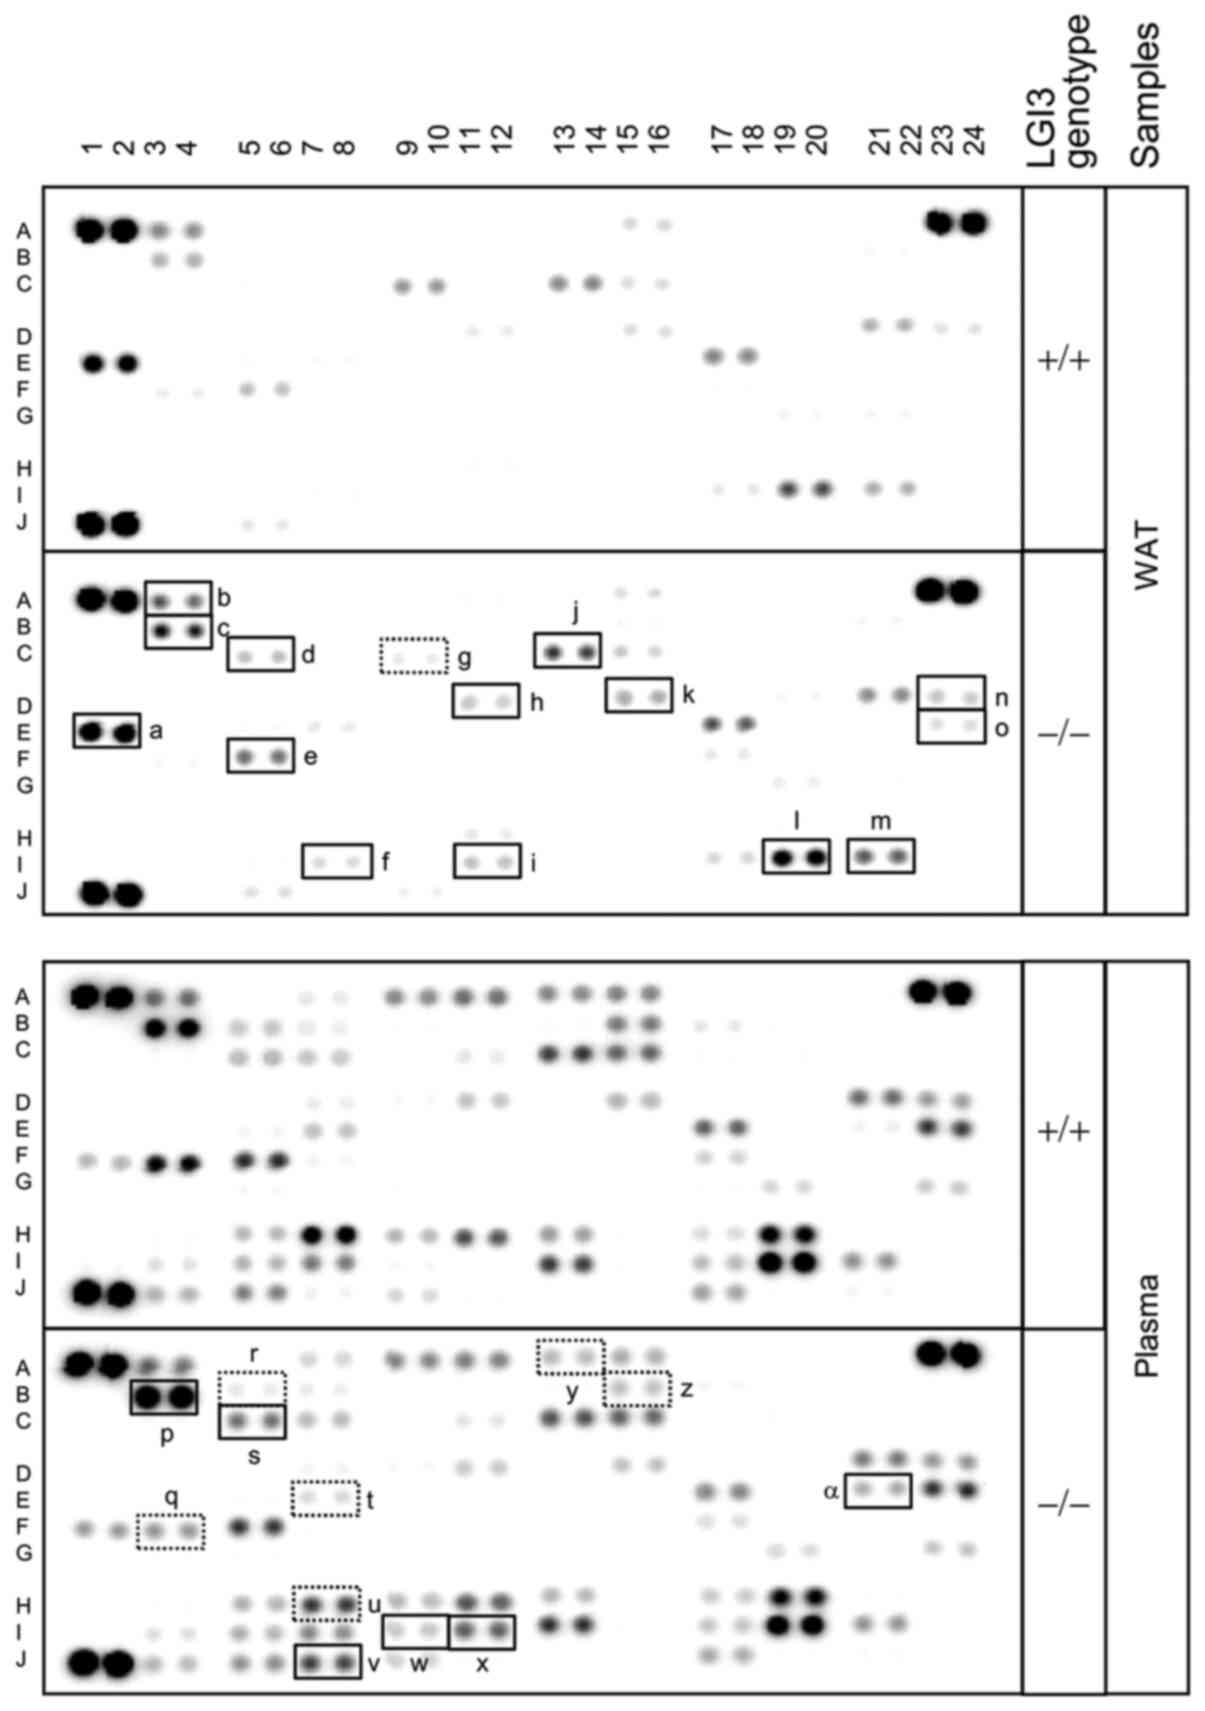 | Figure 1Effect of LGI3 knockout on cytokine
profiles. WATs and plasma from wild-type (+/+) and homozygous
LGI3-knockout (-/-) mice were analyzed using cytokine XL arrays.
Solid-line box, increased proteins in knockout mice. Numbers and
capital letters represent the labels of array coordinates (Mouse XL
Cytokine Array ARY028, R&D Systems, Inc., https://www.rndsystems.com/products/proteome-profiler-mouse-xl-cytokine-array_ary028).
Array coordinate is listed in Table
SII. Dotted-line box, decreased proteins in knockout mice. The
list of proteins has been described in the Results and in Tables I and SI. a, FGF1; b, ADIPOQ; c and p, CCL6; d
and s, RARRES2; e, IGFBP6; f, POSTN; g, F3; h, CST3; I and x,
PRL2C2; j, CFD; k, DPP4; l, REG3G; LGI3, leucine-rich repeat LGI
family member 3; m, RETN; n, AHSG; o, IGFBP2; q, IGFBP5; r, CCL11;
t, GAS6; u, CXCL5; v, SERPINE1; w, DLK1; WATs, White adipose
tissues; y, TNFSF13B; z, CCL21; α, IGFBP1. |
 | Table ISummary of LGI3-regulated gene
products identified in the present study and in previous
studies. |
Table I
Summary of LGI3-regulated gene
products identified in the present study and in previous
studies.
| Array | Upregulated gene
products (reference no.) | Downregulated gene
products (reference no.) |
|---|
| Cytokine XL
Arraya | CCL21, CXCL5, F3,
IGFBP5d, TNFSF13B,
CCL11, GAS6 | ADIPOQd, AHSG, CCL6, CFD, CST3,
DLK1d, DPP4, FGF1,
IGFBP1d, IGFBP2,
IGFBP6, POSTN, PRL2C2, RARRES2, REG3G, RETN, SERPINE1d |
| Phospho Explorer
Antibody Arrayb | BLNK, BRCA1, BTK,
CALM1, CREB1, ERBB2, FOXO3, GRK2, IKBKB, IL2RA, JUN, LIMK1, RELA,
RPS6KA1, TP73 | ALK, CAV1, CBL,
CD5, DOK1, ESR1, HSP90AB1, IRS1, KIT, KRT18, MAPK14, MTOR, PDGFRA,
PRKCA, PRKCD, RYR2, STMN1, ZAP70 |
| Signaling Explorer
Antibody Array | ADCK2, AFP, CASP1,
CD37, CD80, ERBB3, ERN1, F10, F12, GAD1, GH1, GPR151, LYN, MSTN,
PTGS1, PTK6, RCBTB1, RPS27, SND1, TUBB3, TYK2, TYRO3 | ADCK1, AKT2, AXL,
C1S, CAMKV, CD247, CD3E, CFB, COL4A3, CRYAB, CYP2S1, CYP39A1, DCC,
DDX4, DNAL4, EEF1G, EGF, EPHB1, EPN3, EXOG, F2R, FLI1, FN1, FOXA2,
KAT8, KDR, KLK3, LAMC3, MATK, MUC16, NCR1, NEUROG3, NFKBIA, POLR3D,
POU3F1, PRPF19, RCHY1, SLU7, SNAI2, TAF4, TBP, TP63, USP13 |
| Explorer Antibody
Array | CD63, E2F2, MLH1,
SEMA4D, SLC3A2 | INSR, MAP2K2 |
| Previously
reported | AKT1(3), CCL12(12),
CCL2(16), CD68(12), CSF3(12), CTNNB1(5), CXCL13(12), CXCL2(12),
CYBA (12), CYBB (12), EMR1(12), FLG(6), IGF1(12), IGFBP5(12),
IL6(12), ITGAX (12), IVL (6), KRT10(6), LOR (6), MAPK1(12),
MAPK3(12), MDM2(4), MITF (9), NCF1(12), NCF2(12), NFKB1(16),
NOS2(14), PIK3CA (3), PRKAA1(12), PTEN (12), PTGS2(14), PTK2(3),
TGM1(6), TIMP1(12), TNF (14,16) | ADIPOQ (15), BAD
(12), C5(12), CEBPA (14), CRP (12), CSF1(12), DLK1(12),
EIF4EBP1(12), ESM1(12), FABP4(14), GSK3A (12), GSK3B (5),
IGFBP1(12), LPL (14), PPARG (14), SERPINE1(12), STX1Ac (2), TP53(4) |
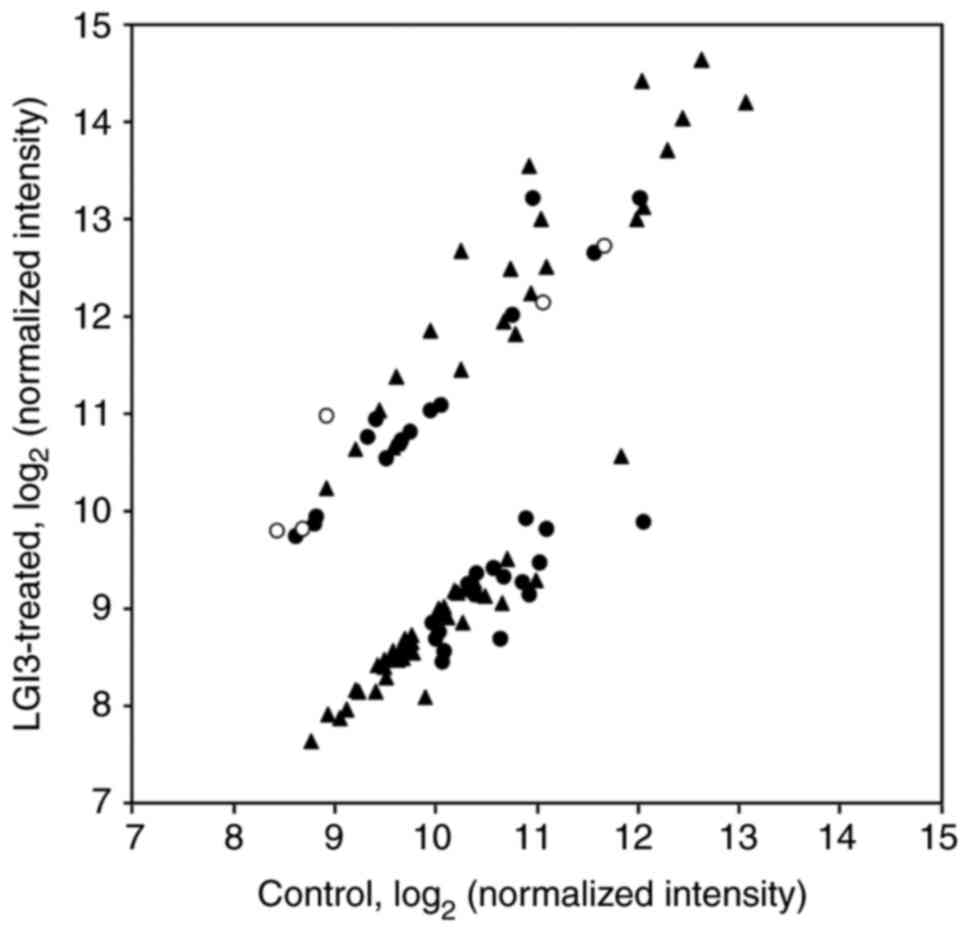
Effect of LGI3 on the phosphorylation
and expression of signaling proteins
LGI3 and its receptor ADAM23 have been demonstrated
to be expressed predominantly in 3T3-L1 preadipocytes, with their
expression declining during differentiation into adipocytes
(14). Thus, LGI3 may transduce
intracellular signaling in preadipocytes in an autocrine and
paracrine manner. To explore the LGI3-stimulated intracellular
signaling pathway, phosphoprotein array and signaling protein array
analyses were performed using extracts from 3T3-L1 preadipocytes
treated with the LGI3 protein (Fig.
2). Expression levels of 105 proteins were found to be
increased or decreased by LGI3 in comparison with a control
(Fig. 2; Tables I and SI, SII).
Additionally, 15 proteins showed upregulation following LGI3
phosphorylation and 18 proteins showed downregulation following
LGI3 phosphorylation (Fig. 2;
Tables I and SI). KEGG pathway analysis of these gene
products revealed that the proteins expressed at increased levels
were associated with the terms ‘neurotrophin signaling pathway’,
‘osteoclast differentiation’, ‘B cell receptor signaling pathway’,
‘PI3K/Akt signaling pathway’, ‘NF-κB signaling pathway’, ‘TNF
signaling pathway’, ‘insulin resistance’ and additional terms
related to various infectious diseases and cancer-related pathways
(Table SIII). The gene products
with reduced expression levels were found to be associated with the
terms ‘PI3K/Akt signaling pathway’, ‘mTOR signaling pathway’ and
various cancer-related pathways (Table
SIII). Signaling protein array analysis demonstrated that the
expression of 27 proteins was increased, while that of 45 proteins
was reduced (Fig. 2; Tables I and SI). Functional enrichment analysis of
these gene products revealed that the upregulated gene products
were involved in tyrosine kinase signaling pathways, cell
proliferation, PI3K signaling pathway, and growth hormone receptor
and melanosome functions (Table
SIV). The downregulated gene products were associated with
transcriptional regulation, PI3K/Akt signaling pathway, T cell
receptor signaling pathway, focal adhesion, and various
cancer-related pathways (Table
SIV).
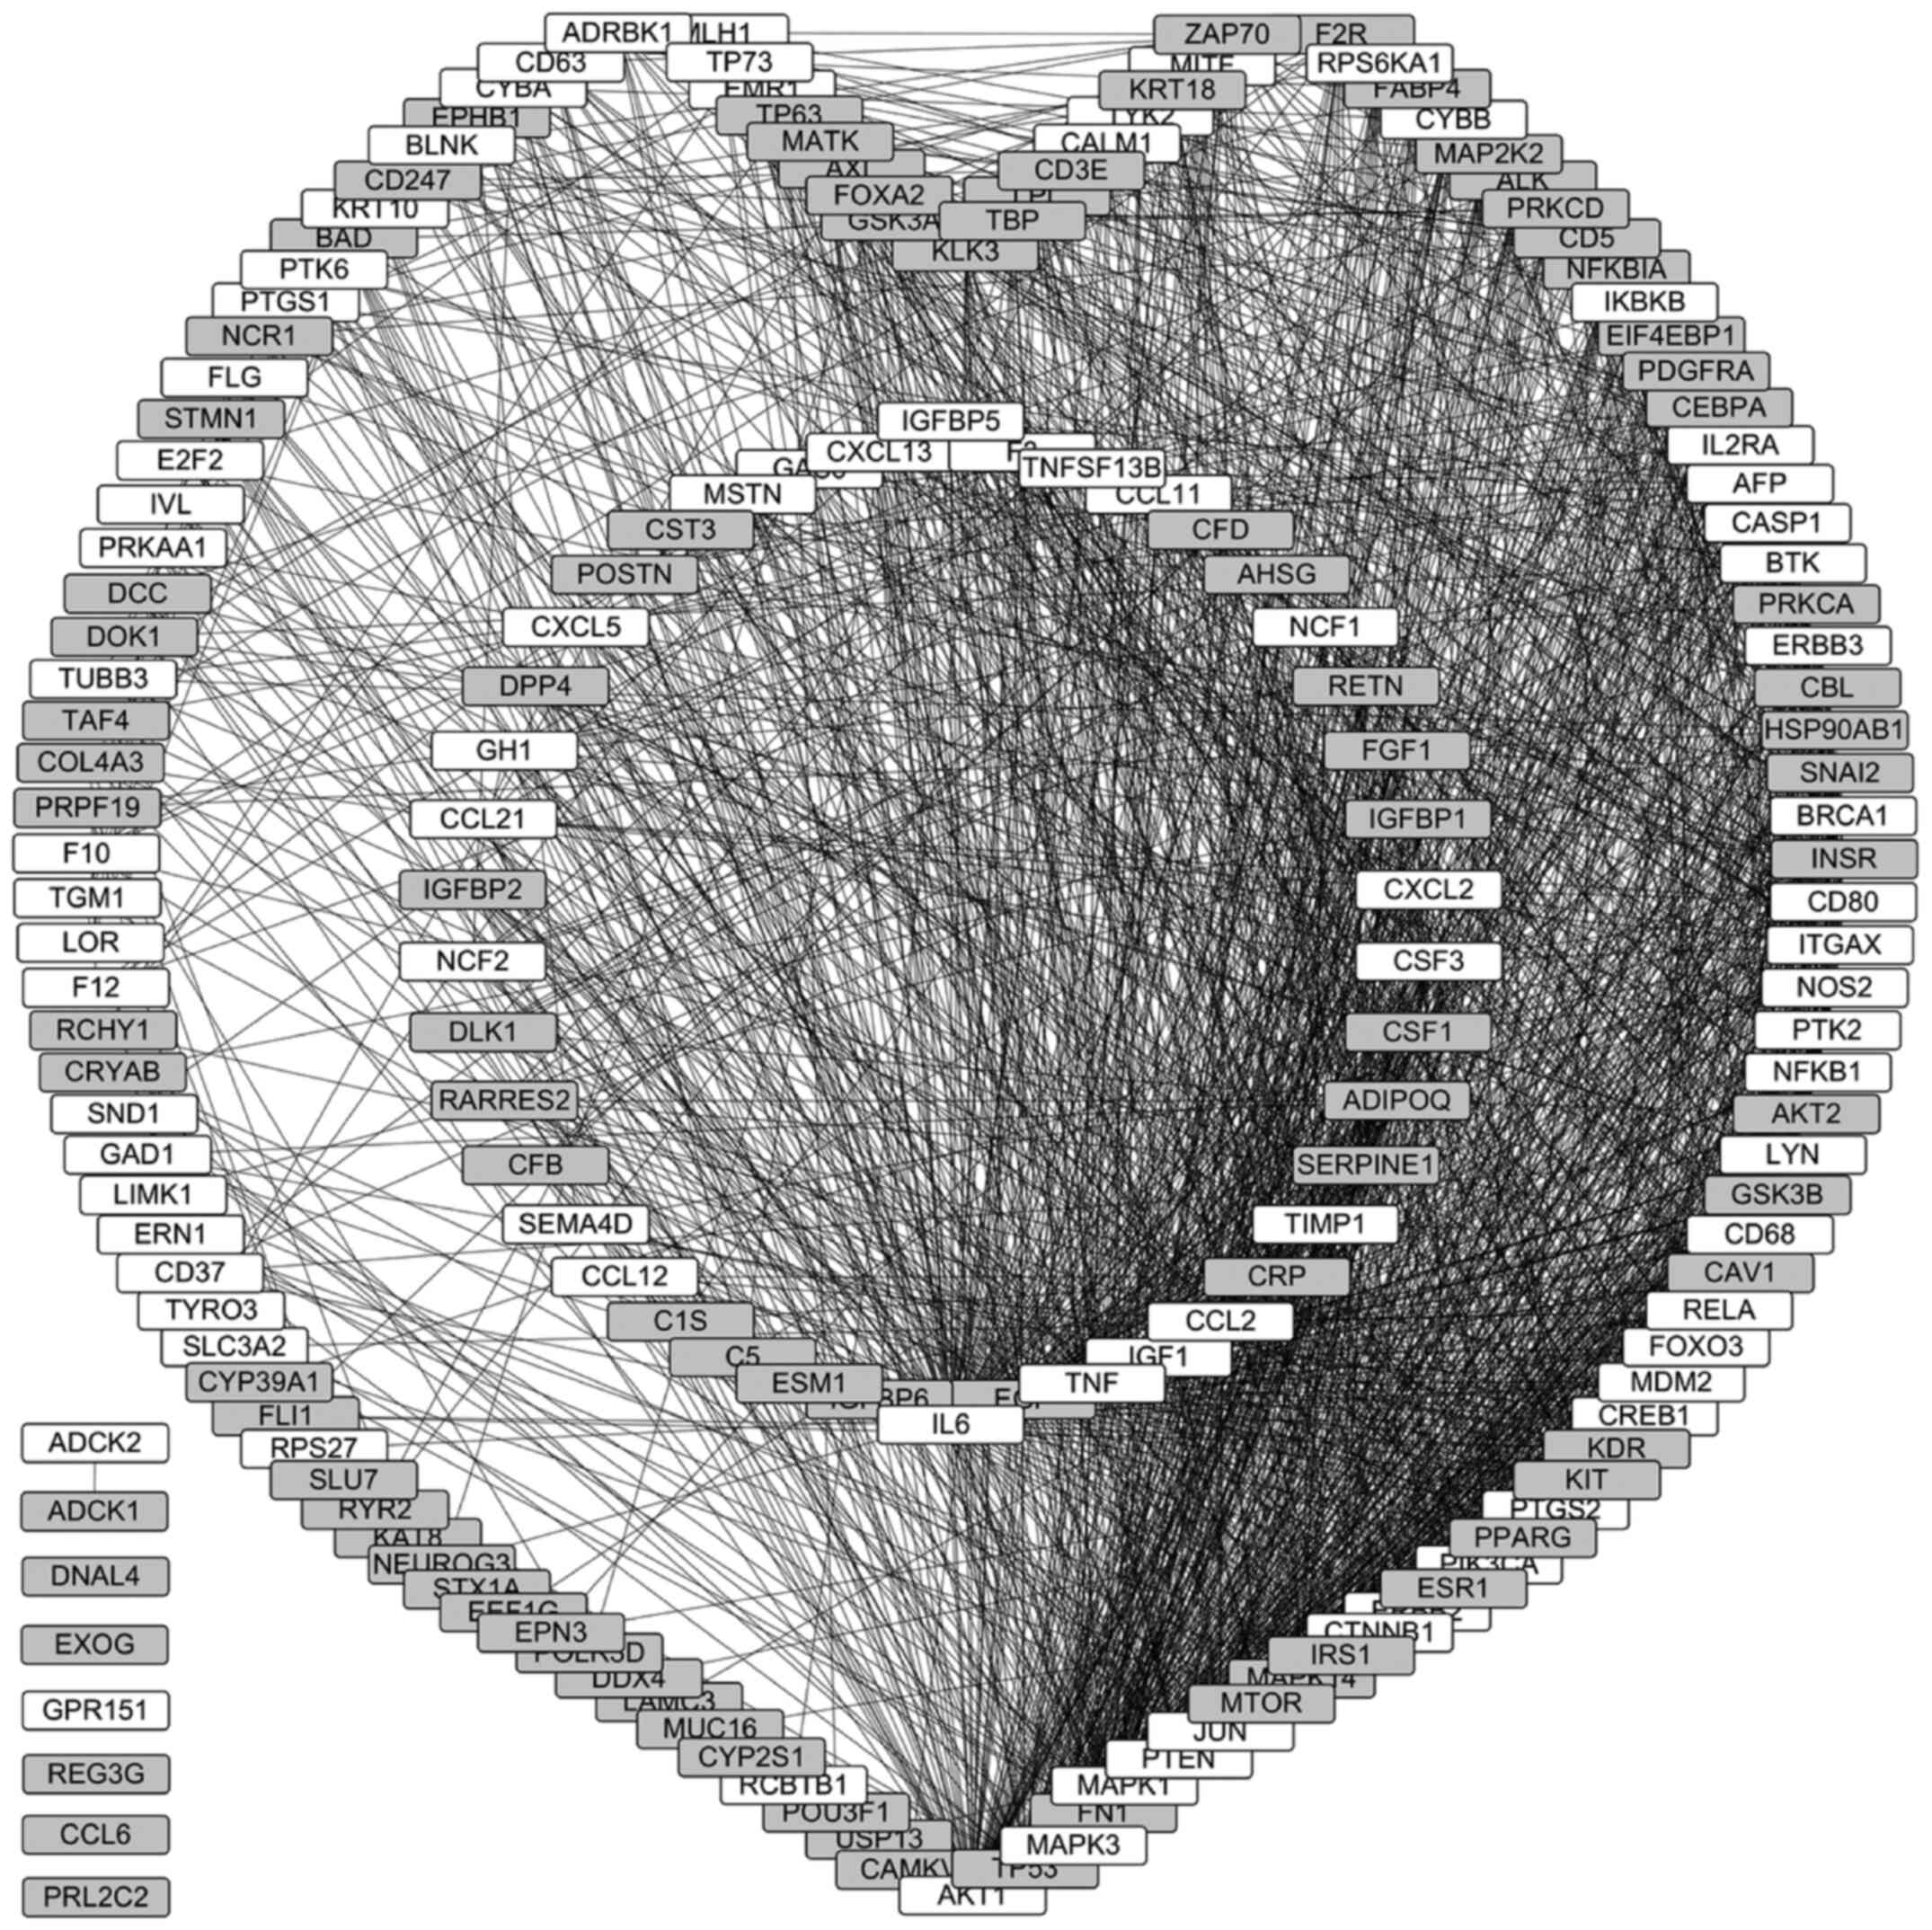
Protein-protein interaction network of
LGI3-regulated gene products
A protein-protein interaction network of
LGI3-regulated gene products, based on both the findings of the
present study (Tables I and
SI) and those of our previous
study (12), was constructed and
visualized based on the interaction degree (Fig. 3). In total, 169 gene products (95%
of 177 LGI3-regulated gene products) were associated with the
protein-protein interaction network cluster; 81 upregulated gene
products and 88 downregulated gene products were involved in the
interaction network cluster; and 42 gene products in the cluster
were cytokines, adipokines, and chemokines (Fig. 3; inner circular subnetwork). Of the
gene products, 94% (21 cytokines and 100 signaling proteins) were
identified and included the interaction network cluster, and 6% of
the gene products were not associated with the network cluster.
Notably, all cytokines, adipokines, and chemokines that were
regulated by LGI3, with the exception of REG3G, CCL6 and PRL2C2,
were included in the interaction network cluster (Fig. 3, inner circular subnetwork).
Transcriptional regulatory association analysis of this subnetwork
indicated that the member genes may be regulated by NF-κB, C/EBPα,
Pax-8, TFIIA-α/β/γ and TBP (P<0.01; Table SV). A total of 1,906 interactions
were found in the LGI3-regulated protein-protein interaction
network. The gene products with the highest interaction degrees
(>50) included IL6, AKT1, TP53, EGF, TNF, MAPK3, FN1, MAPK1,
IGF1, PTEN, JUN, CCL2, MTOR, CTNNB1, IRS1, MAPK14 and ERBB2. The
cytokines, adipokines and chemokines in the network with the
highest interaction degrees (>30) included IL6, EGF, TNF, IGF1,
CCL2, CRP, TIMP1, SERPINE1, ADIPOQ, CSF1 and CSF3.
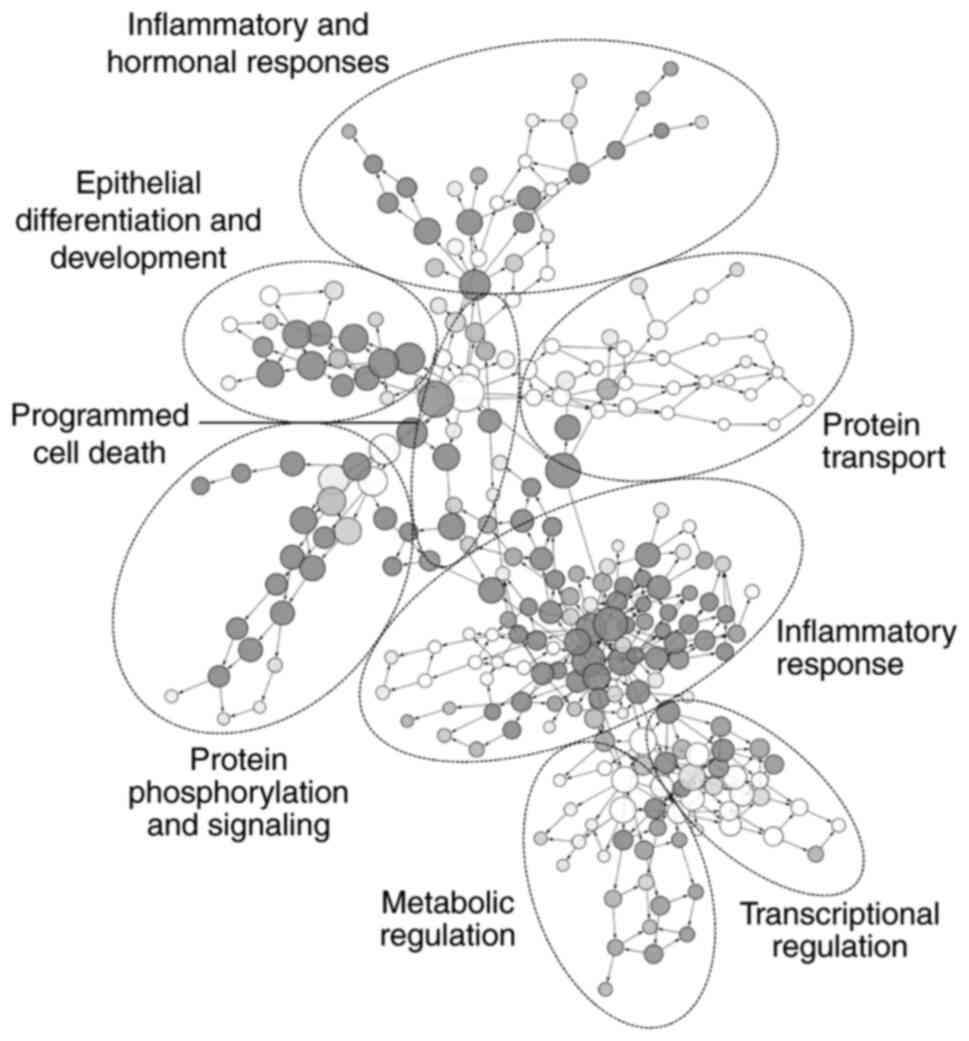
Functional enrichment analysis of
LGI3-regulated genes
To elucidate the biological functions associated
with the protein-protein interaction network of LGI3-regulated gene
products, a functional enrichment analysis was performed using the
gene members of the network. GO categories were mapped using
statistically overrepresented functional themes in a hierarchical
manner (Fig. 4). GO terms with the
highest significance were associated with inflammatory responses,
hormonal responses, epithelial differentiation and development,
protein phosphorylation and signaling, metabolic and
transcriptional regulation, programmed cell death, and protein
transport (Fig. 4). Notably,
inflammatory response was the most significant and highly
represented GO category.
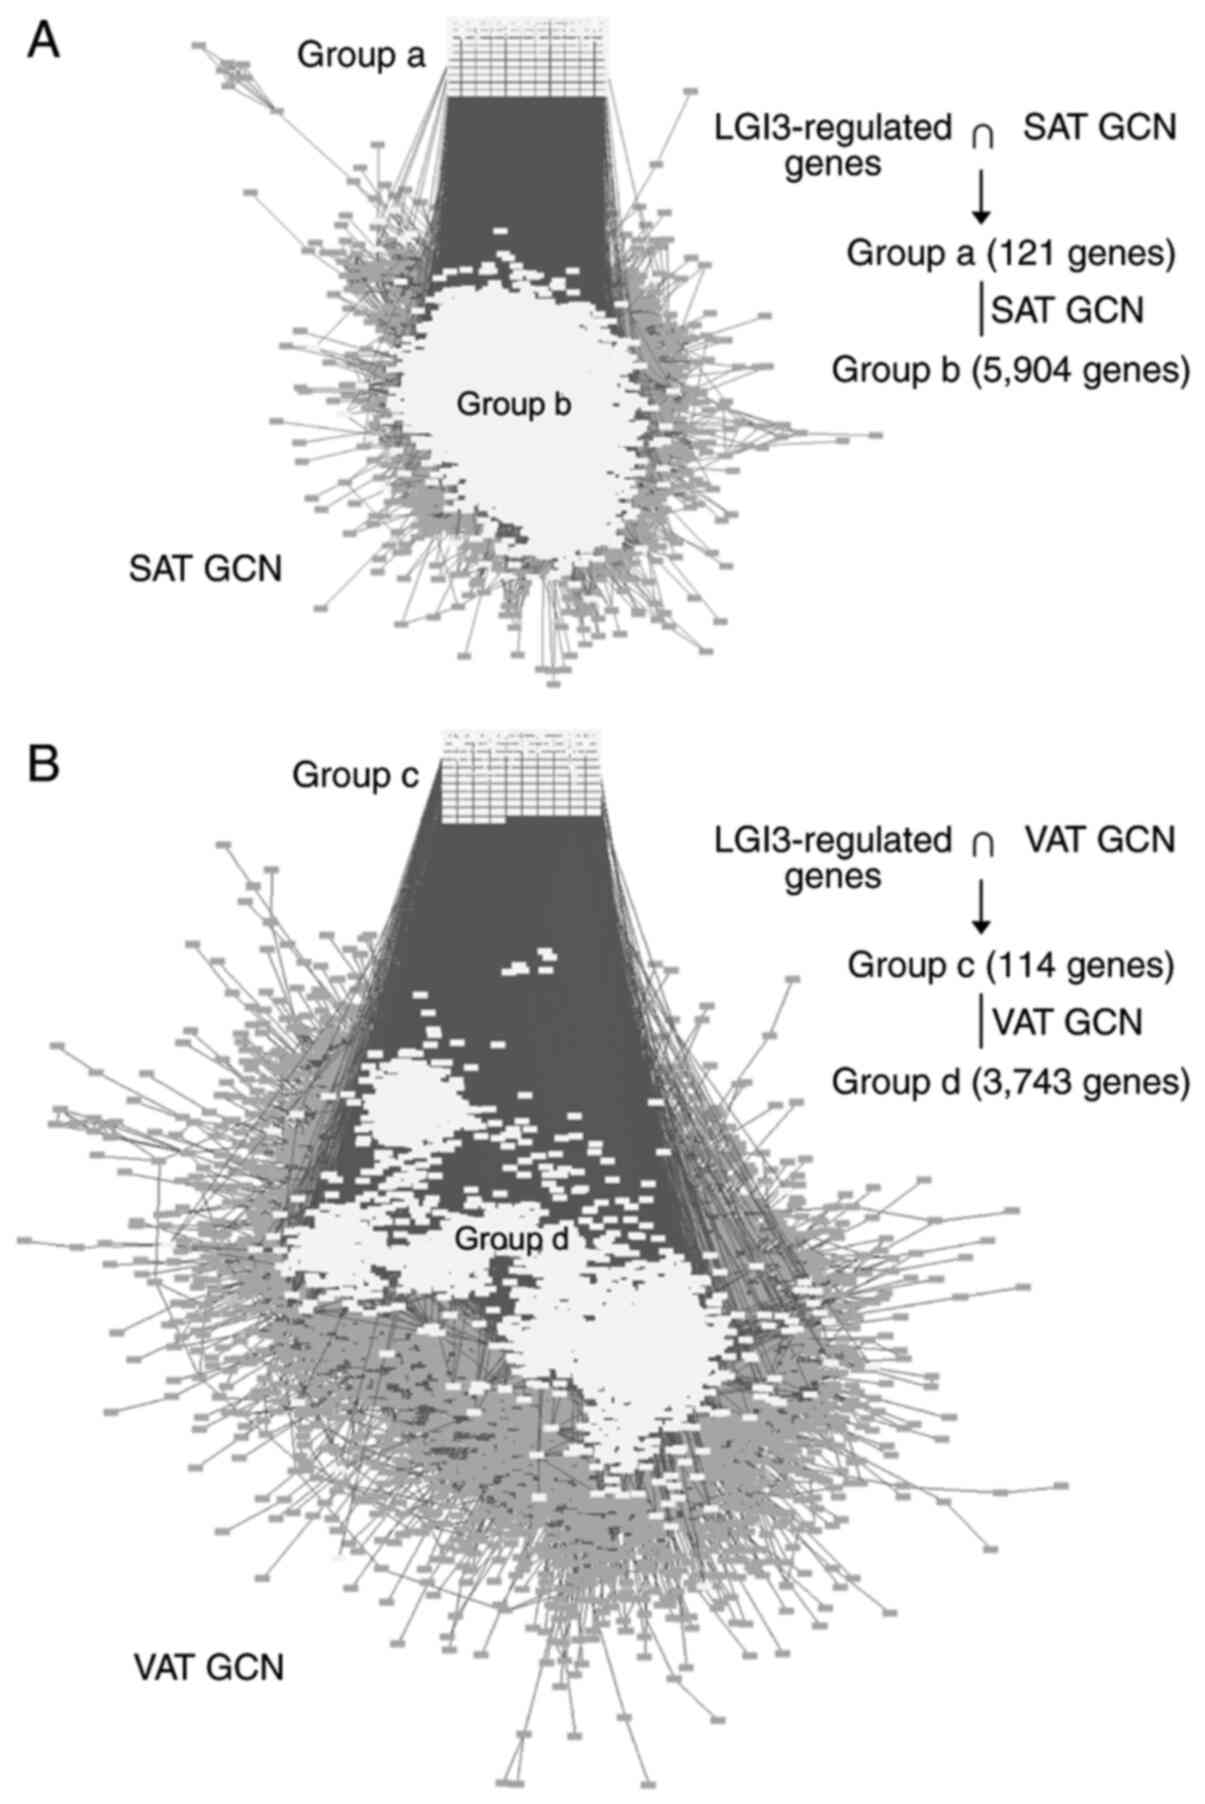
Gene co-expression network
analysis
All LGI3-regulated gene products were queried
against the GCNs of SATs and VATs. GCNs are networks of genes
connected by significant co-expression relationships that provide
insights into the tissue-specific functions of gene sets, as
co-expressed genes are regulated by common transcriptional
regulatory programs and are components of the same protein complex
or signaling pathway (27). A total
of 121 and 114 gene products in the LGI3-regulated gene set were
identified in the GCNs of SATs and VATs, respectively (Fig. 5A, group
a; Fig. 5B, group c; Table
SVI). These LGI3-regulated gene product subsets were associated
with 5,904 gene products in the SAT GCN and with 3,743 gene
products in the VAT GCN (Fig. 5A,
group b; Fig. 5B, group
d; Table SVI). Notably, these
subnetworks of first-neighboring co-expressed genes (Fig. 5A, group
b; Fig. 5B, group d) revealed distinct distributions
between the GCNs of SATs and VATs. Comparative analysis was
performed with the sum of the sets for LGI3-regulated genes and
their first-neighboring co-expressed genes in the GCNs of SATs and
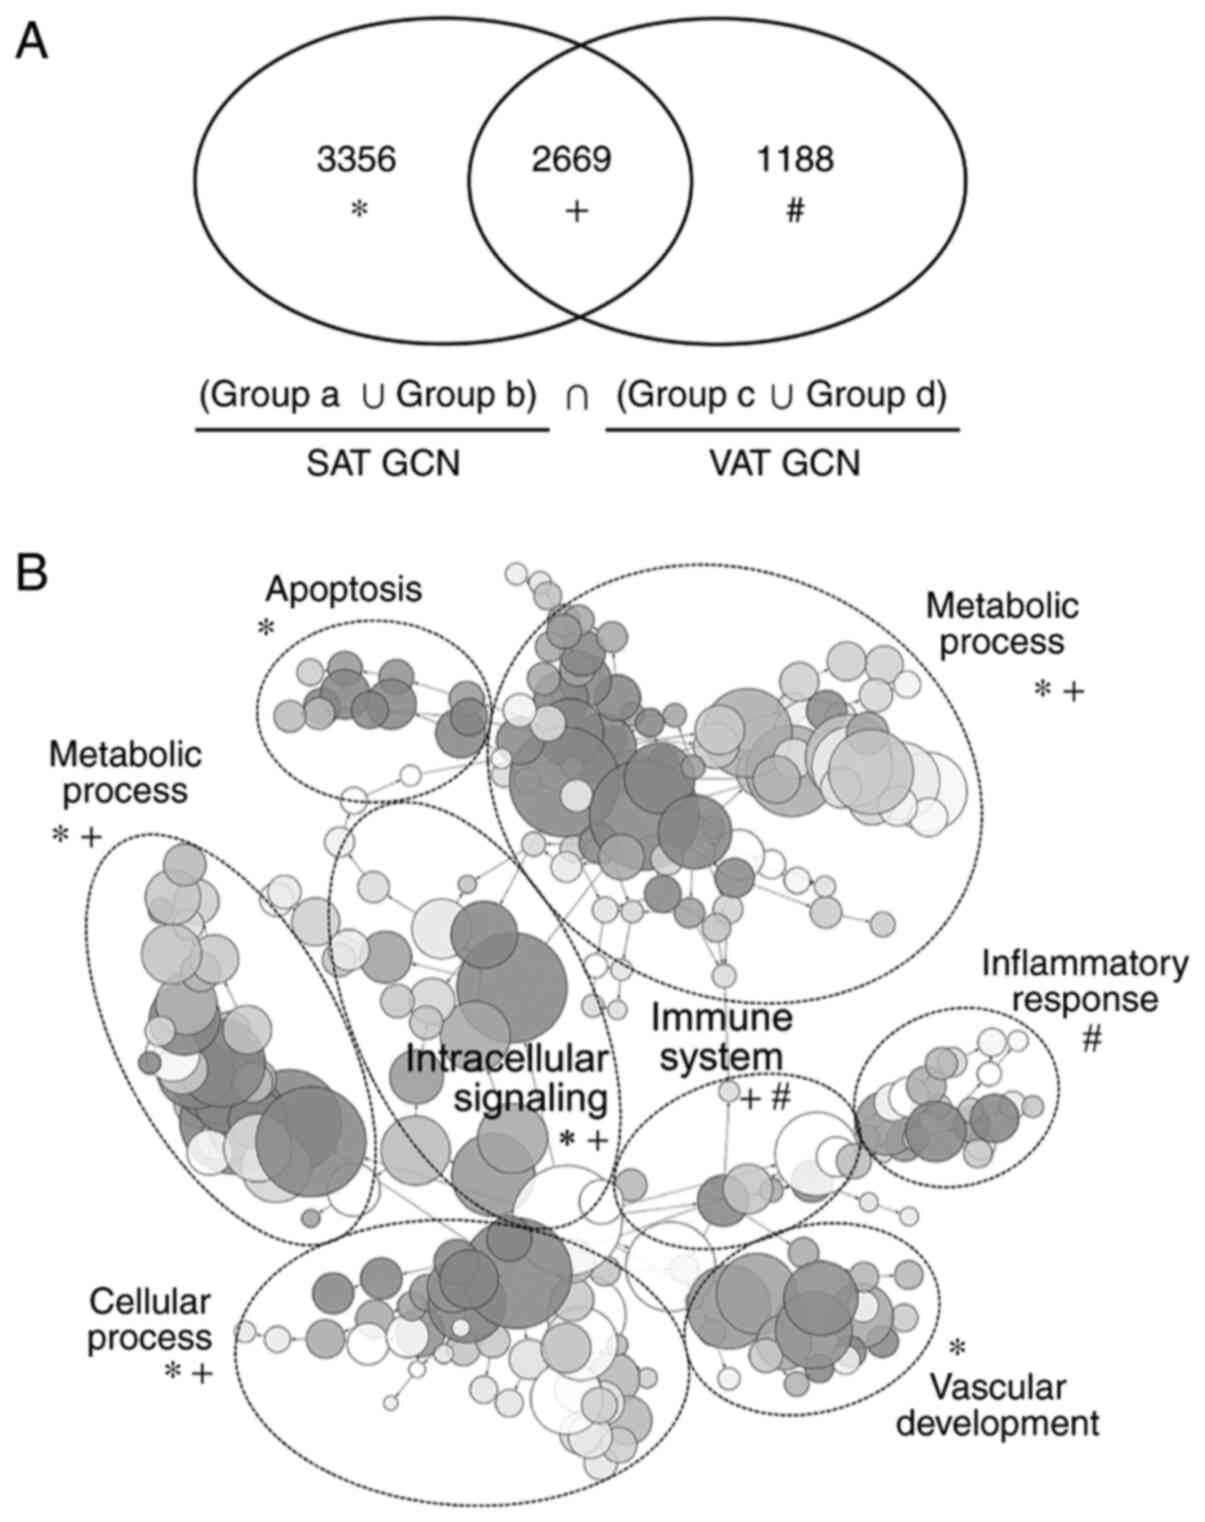
VATs (Fig. 6A). The intersection of
the sets included 2,669 genes, with 3,356 genes and 1,188 genes
occurring only in the GCNs of SATs and VATs, respectively (Fig. 6A). A GO category map of the sum of
gene co-expression subnetworks (Fig.
5, groups a-d; Fig. 6A) demonstrated that the gene
products were involved in inflammatory and immune system, metabolic
processes, apoptosis and vascular development (Fig. 6B). It was also observed that
inflammatory response is a predominant GO term in the
LGI3-regulated GCNs of VATs and that apoptosis and vascular
development are preferentially associated with the LGI3-regulated
GCNs of SATs (Fig. 6B; Table SVII). Transcriptional regulatory
association analysis of these subnetworks predicted that distinct
and common transcription factors may be involved in the
LGI3-regulated GCNs of SATs and VATs (Table SVIII).
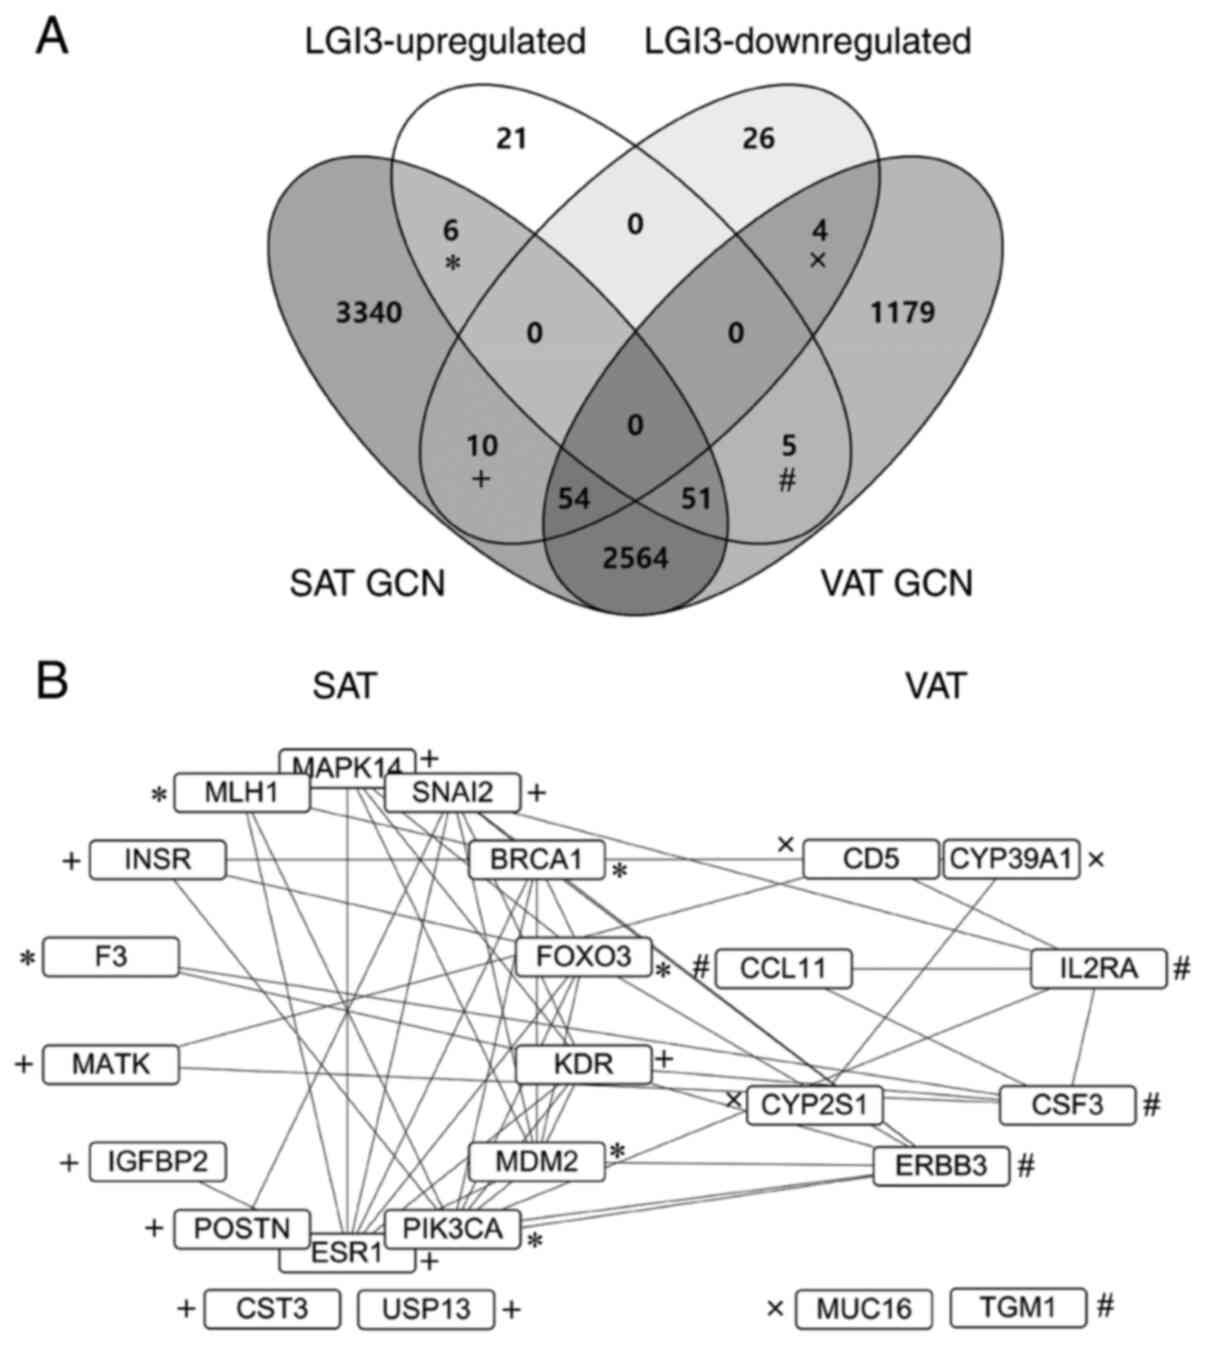
Venn diagram analysis of LGI3-regulated genes and
their associated GCNs of adipose tissues revealed that six
LGI3-upregulated genes and 10 LGI3-downregulated genes belonged to
the set of SAT GCN, and that five LGI3-upregulated genes and four
LGI3-downregulated genes belonged to the set of VAT GCN (Fig. 7A). Protein-protein interaction
network analysis of the 25 LGI3-regulated genes associated with
adipose tissue GCNs demonstrated that 21 gene products formed an
interaction network cluster (Fig.
7B). The interaction network cluster included 14 SAT-specific
and seven VAT-specific LGI3-regulated genes in GCNs (Fig. 7B). Functional enrichment analysis of
these genes revealed their involvement in various biological
processes in a depot-specific manner (Table II). Notably, hematopoietic cell
lineage, immune response and cytokine-cytokine receptor interaction
were predominant functions of LGI3-regulated genes in VAT GCN.
| Table IIFunctional enrichment analysis of the
LGI family member 3-regulated gene products associated with GCNs of
SAT and VAT. |
Table II
Functional enrichment analysis of the
LGI family member 3-regulated gene products associated with GCNs of
SAT and VAT.
| A, SAT |
|---|
| Category | Term | Count | P-value |
|---|
| GO
TERM_MF_DIRECT | GO:0005515 protein
binding | 16 |
5.53x10⁻⁵ |
| KEGG_PATHWAY | hsa04068:FoxO
signaling pathway | 5 |
6.04x10⁻⁵ |
| GO
TERM_BP_DIRECT | GO:0032355 response
to estradiol | 4 |
6.68x10⁻⁵ |
| KEGG_PATHWAY | hsa04151:PI3K-Akt
signaling pathway | 6 |
1.82x10⁻⁴ |
| KEGG_PATHWAY | hsa04917:Prolactin
signaling pathway | 4 |
2.17x10⁻⁴ |
| KEGG_PATHWAY |
hsa05205:Proteoglycans in cancer | 5 |
2.86x10⁻⁴ |
| GO
TERM_BP_DIRECT | GO:0090090 negative
regulation of canonical Wnt signaling pathway | 4 |
3.75x10⁻⁴ |
| GO
TERM_BP_DIRECT | GO:0030335 positive
regulation of cell migration | 4 |
5.34x10⁻⁴ |
| GO
TERM_BP_DIRECT | GO:0038083
peptidyl-tyrosine autophosphorylation | 3 |
5.70x10⁻⁴ |
| GO
TERM_BP_DIRECT | GO:0008284 positive
regulation of cell proliferation | 5 |
6.27x10⁻⁴ |
| B, VAT |
| Category | Term | Count | P-value |
| KEGG_PATHWAY |
hsa04640:Hematopoietic cell lineage | 3 |
2.29x10⁻³ |
|
GOTERM_BP_DIRECT | GO:0006955 immune
response | 3 |
1.59x10⁻² |
| KEGG_PATHWAY |
hsa04060:Cytokine-cytokine receptor
interaction | 3 |
1.70x10⁻² |
|
GOTERM_CC_DIRECT | GO:0005615
extracellular space | 4 |
1.70x10⁻² |
|
GOTERM_BP_DIRECT | GO:0030838 positive
regulation of actin filament polymerization | 2 |
2.12x10⁻² |
|
GOTERM_MF_DIRECT | GO:0016705
oxidoreductase activity, acting on paired donors, with
incorporation or reduction of molecular oxygen | 2 |
2.67x10⁻² |
|
GOTERM_BP_DIRECT | GO:0043547 positive
regulation of GTPase activity | 3 |
2.77x10⁻² |
|
GOTERM_BP_DIRECT | GO:0014068 positive
regulation of phosphatidylinositol 3-kinase signaling | 2 |
3.06x10⁻² |
|
GOTERM_CC_DIRECT | GO:0031090
organelle membrane | 2 |
3.76x10⁻² |
|
GOTERM_CC_DIRECT | GO:0016021 integral
component of membrane | 6 |
4.59x10⁻² |
In the present study, GCN analysis of the
LGI3-regulated gene products demonstrated distinct co-expression
network profiles between SATs and VATs. RNA-seq data of adipose
tissues from the Human Protein Atlas indicated that LGI3
transcripts were expressed in adipocytes [40-60% of the total
transcripts per million (TPM), fibroblasts (20-40%), smooth muscle
cells (15%) and other cell types (5%)]. Moreover, RNA-seq data from
the GTEx project of human adipose tissues revealed that the
expression of LGI3 was higher in SATs [average protein transcripts
per million (pTPM)=0.5] than in VATs (average pTPM=0.2). The gene
products in the LGI3-regulated gene co-expression subnetworks may
be regulated by common transcriptional regulatory programs.
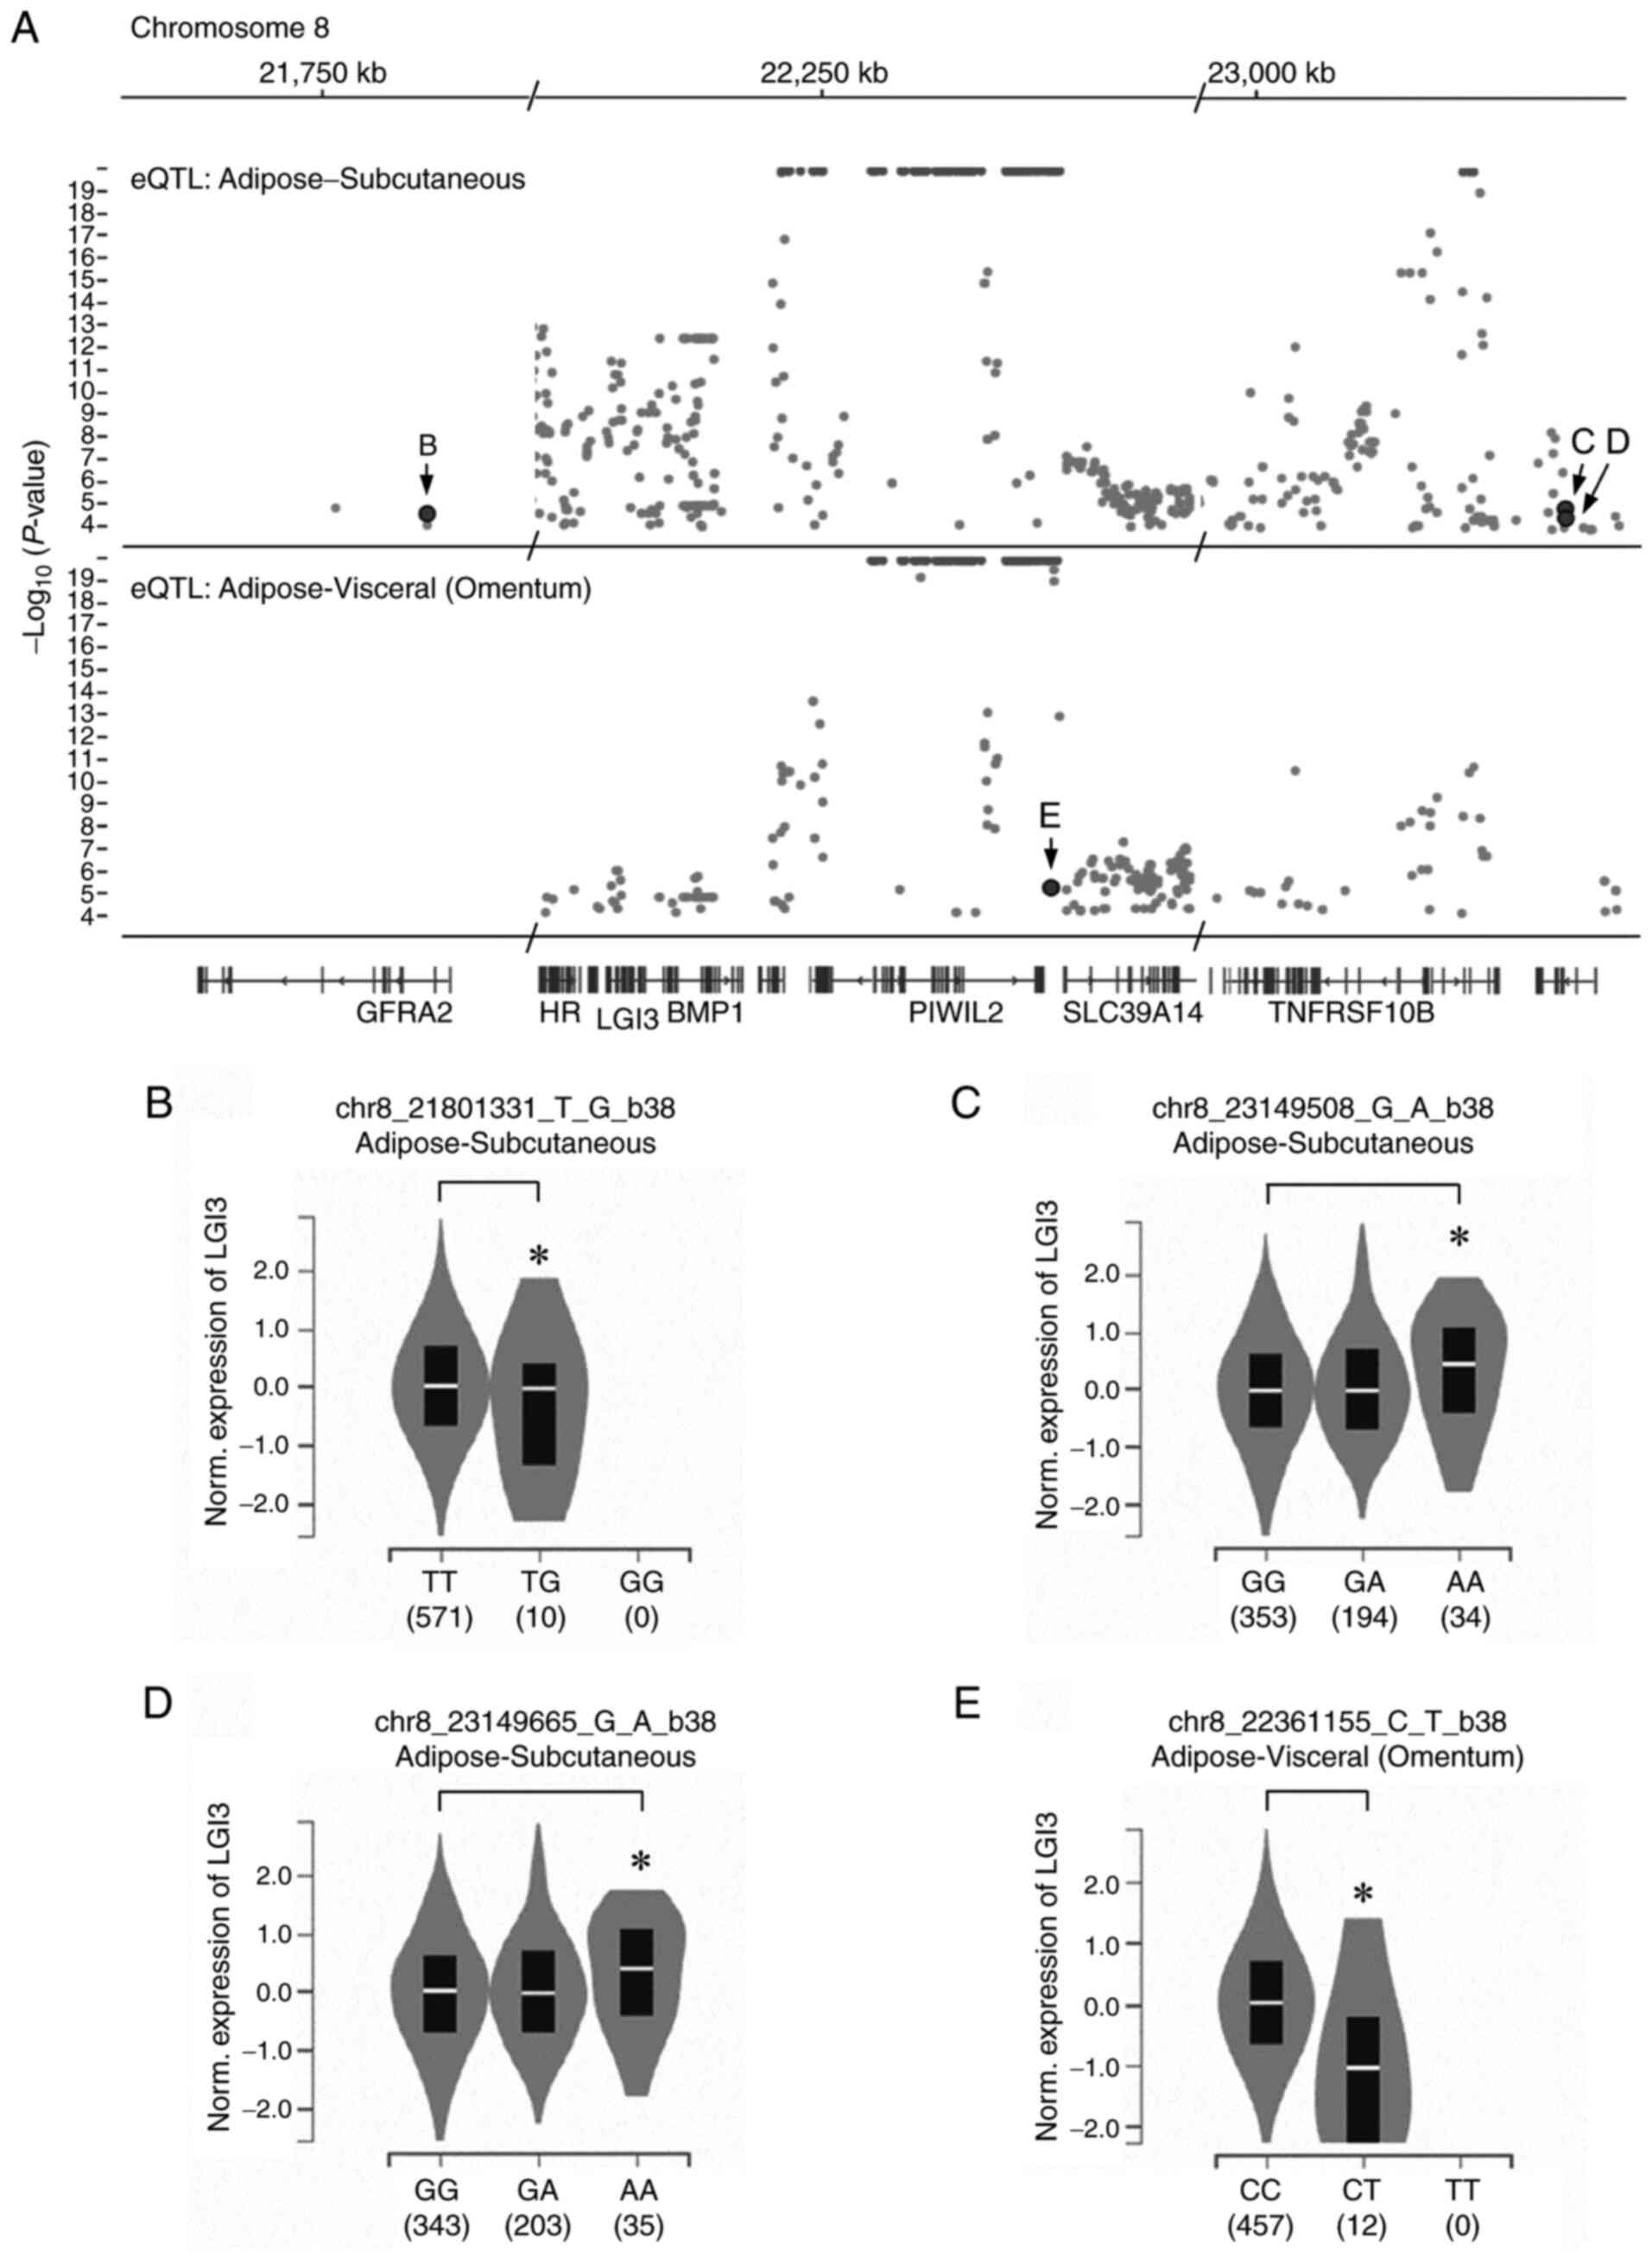
Expression quantitative trait loci for
LGI3 expression in adipose tissues
To explore the adipose depot-specific regulation of
LGI3, single tissue eQTL were analyzed for the genomic loci that
affect the expression levels of LGI3 in adipose tissues. eQTL are
SNVs in genomic loci that account for variation in expression
levels of mRNA (26). It was
identified that three SNVs (Fig.
8A-D) in SAT and one in VAT (Fig.
8A and E) significantly altered
LGI3 (Table III). These SNVs were
cis-eQTL located 0.2-1.1 Mb apart from the LGI3 gene on chromosome
8. Analysis of single tissue RNA-seq data revealed that two SNVs
(chr8_23149508_G_A_b38 and chr8_23149665_G_A_b38) increased LGI3
expression in SAT (Fig. 8C and
D), and two SNVs
(chr8_21801331_T_G_b38 and chr8_22361155_C_T_b38) decreased LGI3
expression in SAT and VAT (Fig. 8B
and E).
| Table IIISummary of depot-specific expression
quantitative trait loci that regulate the expression of LGI family
member 3. |
Table III
Summary of depot-specific expression
quantitative trait loci that regulate the expression of LGI family
member 3.
| Variant ID | SNV ID | P-value | NES | MAF | Tissue |
|---|
|
chr8_21801331_T_G_b38 | rs373132699 |
2.9x10⁻⁵ | -0.9 | 0.0018 | SAT |
|
chr8_23149508_G_A_b38 | rs13256716 |
1.7x10⁻⁵ | 0.18 | 0.2514 | SAT |
|
chr8_23149665_G_A_b38 | rs13257094 |
4.7x10⁻⁵ | 0.17 | 0.2618 | SAT |
|
chr8_22361155_C_T_b38 | rs56251182 |
6.4x10⁻⁶ | -0.79 | 0.0174 | VAT (Omentum) |
Discussion
The proinflammatory adipokine hypothesis for LGI3 is
supported by the increased levels of LGI3 in adipose tissues in
conditions of genetic obesity or high-fat-diet-induced obesity
(14,15). Furthermore, our previous results
revealed that LGI3 downregulated adiponectin and upregulated TNF-α
(15,16). These results led to the hypothesis
that LGI3 serves a regulatory role in the cytokine network of
adipose tissues. It was further determined that LGI3-regulated gene
products formed a protein-protein interaction network cluster
(12). The present study revealed
an extended LGI3-regulated protein-protein interaction network and
depot-specific association of LGI3 with adipose tissues by
employing GCN and eQTL analyses in addition to functional
enrichment analysis used in the previous study (12). In addition to adipose tissues,
LGI3-regulated protein-protein interaction networks have been
implicated in the prognosis of patients with glioma (11) and non-small cell lung cancer
(13). Thus, LGI3-regulated
functional networks may be large with numerous gene product members
in multiple tissues.
The altered expression of various cytokines in the
adipose tissue and plasma of LGI3-knockout mice suggests that the
regulatory interactions of LGI3 with these factors may have both
local and systemic effects (12).
Moreover, the increased expression of cytokines in LGI3-knockout
mice may be due to compensatory upregulation in response to LGI3
deficiency or may represent cytokines that are negatively regulated
by LGI3 in wild-type mice (12).
The downregulated cytokines in LGI3-knockout mice suggest that LGI3
may upregulate these factors in wild-type mice (12). Moreover, the protein-protein
interaction network cluster of LGI3-regulated cytokines supports
the critical role of LGI3 in the homeostasis of adipose tissues
through the cytokine network. It has been predicted that the
LGI3-regulated cytokine network is primarily regulated by NF-κB, a
key transcription factor in immune and inflammatory processes
(28). It has also been
demonstrated that LGI3 is a target gene and activator of NF-κB
(8,16). Multiple genes with altered
expressions in obesity have been found to be regulated by NF-κB
(29). Thus, the increased
expression of LGI3 observed in obesity may perturb the cytokine
network largely through NF-κB and lead to metabolic inflammation in
obese adipose tissues.
The components of the intracellular signaling
pathways induced by LGI3 have been explored in various cell types.
In neuronal cells, it has been revealed that LGI3-induced neurite
outgrowth is mediated by Akt and focal adhesion kinase (3). p53 and MDM2 have also been determined
to be involved in LGI3-promoted survival in ultraviolet
B-irradiated keratinocytes (4).
Moreover, it has been demonstrated that GSK3β and β-catenin
mediated LGI3-promoted keratinocyte migration (5). Multiple signaling proteins (Erk1/2,
AMPK, Bad, PTEN, 4E-BP1, Akt and GSK3β) are regulated in
LGI3-treated preadipocytes (12).
Notably, the suppressive effect of LGI3 on adipogenesis in 3T3-L1
cells is mediated by its receptor, ADAM23(14), whereas ADAM22 was determined to be
the primary receptor for LGI3 in keratinocyte inflammatory
signaling (8). Thus, LGI3 may
transduce intracellular signaling through distinct receptors with
common or unique signaling components in various target cell types.
As 3T3-L1 cells express ADAM23 but not ADAM22, the LGI3-regulated
signaling protein network of the present study may represent the
components and crosstalk effectors of the LGI3-ADAM23 signaling
pathways.
The proximal signaling mechanisms of ADAM23 are
still largely unknown. However, ADAM23 associates with αvβ3
integrin to promote cell adhesion (30), with αvβ3 integrin regulating
macrophage inflammatory responses via PI3K/Akt-dependent NF-κB
activation (31). Presumably,
short-term upregulation by LGI3-induced protein phosphorylation
occurred in the gene products that were predicted to be involved in
immune response, inflammatory response and the PI3K/Akt signaling
pathway, whereas gene products downregulated in response to
phosphorylation were predominantly associated with cancer-related
pathways (11,13,15,16).
These results support the hypothesis that LGI3 is a proinflammatory
adipokine upregulated in conditions of obesity-associated metabolic
inflammation and downregulated in cancer (10,11,13-15).
In the current study, long-term upregulation of expression in
LGI3-treated 3T3-L1 cells was demonstrated in the gene products
predicted to be associated with receptor protein tyrosine
kinase/non-membrane spanning protein tyrosine kinase signaling
pathway, cell proliferation, PI3K signaling pathway and growth
hormone receptor function. Notably, gene products with
downregulated expression were predicted to be involved in the
positive regulation of transcription, cancer pathways, nuclear
chromatin function, and cell migration. It was also observed that
the PI3K signaling pathway and cancer-related pathways were
regulated by phosphorylation and expression levels. Presumably, the
suppressive effect of LGI3 on adipogenesis (14) may be mediated by ADAM23 via NF-κB
and PI3K/Akt pathways. NF-κB may be activated cooperatively by LGI3
and TNF-α to antagonize insulin signaling in adipogenesis (14). LGI3 may also regulate the PI3K/Akt
pathway, a component of adipogenic signaling pathways, by an
unknown mechanism that may counteract adipogenesis.
The majority of LGI3-regulated gene products were
involved in a protein-protein interaction network cluster with high
interaction degrees. In the present study, the LGI3-regulated
interaction network reported in our previous study (12) was extended by ~4 fold in node
number. Statistical analysis of network centrality to identify
critical gene products in the network revealed that the gene
products with the highest centrality in rank order were AKT1, IL6,
TP53, EGF, TNF, FN1, MAPK3, MAPK1, PTEN, IGF1, JUN, CCL2, MTOR,
CTNNB1, MAPK14, ESR1, IRS1, ERBB2, PIK3CA and PPARG (data not
shown). These gene products have previously been reported to be
involved in obesity-associated metabolic disorders (32-51).
Moreover, a subset of these gene products has been previously
reported to be regulated by LGI3; these included AKT1, TP53, TNF,
MAPK3, MAPK1, PTEN, IGF1, CTNNB1, PIK3CA and PPARG (4-6,12,16).
The functional enrichment map of LGI3-regulated gene
products demonstrated that the LGI3-regulated protein-protein
interaction network was associated most significantly with
inflammatory responses, epithelial differentiation and development,
and metabolic regulation. Previous results indicated that LGI3 may
serve a proinflammatory role by upregulating COX-2, iNOS, MCP-1,
TNF-α and NF-κB (14,16). Notably, LGI3 differentially
increases the expression of multiple inflammatory genes in
preadipocytes, adipocytes and macrophages (12). These LGI3-regulated inflammatory
gene products are known to be involved in obesity-associated
metabolic disorders (36,52-61).
It was also previously reported that LGI3 regulated the
differentiation of keratinocytes (6), neuronal cells (3) and adipocytes (14), as well as the inflammatory response
of keratinocytes (8),
preadipocytes, adipocytes and macrophages (12). These results support the multitarget
and pleiotropic nature of LGI3.
Comparative analysis of the LGI3-regulated gene
products in the GCNs of SATs and VATs revealed common and distinct
subsets of gene products. A larger number of gene products were
involved in the LGI3-regulated GCNs in SATs than in VATs. The
larger size of the LGI3-regulated SAT GCN may be due to the
relatively higher expression of LGI3 in SATs than in VATs, and the
difference in the transcription factor repertoires that control
LGI3-regulated GCNs. The functional enrichment map of
LGI3-regulated GCNs of SATs and VATs revealed that vascular
development and inflammatory responses are the predominant function
categories in SATs and VATs, respectively. These results imply that
LGI3 may serve as a multifunctional cytokine in cellular
differentiation and development (3,6,12) in
SATs and as a proinflammatory adipokine in obesity-associated
metabolic disorders in VATs (14-16).
GCN analysis of the metabolic disorder-associated modules of the
co-expressed genes in adipose tissues demonstrated enrichment of
the immune response and oxidative phosphorylation pathways
(62). Moreover, GCN and protein
interaction network analyses indicated that NF-κB was implicated in
angiogenesis and inflammation in adipose tissue (29). Transcription factor GCN of adipose
tissue RNA-seq data also indicated that the obesity-associated
network module was enriched for regulation processes in the immune
system (63). Protein-protein
interaction networks of LGI3-regulated gene products associated
with adipose tissue GCNs further supported that these gene products
may be differentially regulated in SAT and VAT in a cooperative
manner. Hence, LGI3-regulated GCNs may serve multiple and
differential roles in the homeostasis and dysregulation of
metabolic, cellular and inflammatory processes in SATs and
VATs.
Whole-genome analysis of eQTL revealed four SNVs
that account for the regulation of LGI3 expression in adipose
tissues. All eQTL were located within ~1.1 Mb of the LGI3 gene and
may serve as a cis-acting regulatory elements for LGI3 expression.
These eQTL were located in intergenic regions
(chr8_21801331_T_G_b38, chr8_22361155_C_T_b38) and in introns of
the TNFRSF10D gene (chr8_23149508_G_A_b38, chr8_23149665_G_A_b38).
Notably, an intergenic SNV (chr8_22361155_C_T_b38) decreased the
expression of LGI3 in VAT. These results suggested that genetic
variations in SNVs near the LGI3 gene are associated with adipose
depot-specific regulation of LGI3.
Macrophage polarization in adipose tissues is a
hallmark of the proinflammatory switch in obesity (64-66),
and the predominance of proinflammatory M1-type macrophages over
those of the anti-inflammatory M2-type represents a major component
of metabolic inflammation in VATs (67,68).
Our previous studies indicated that LGI3 upregulated M1-polarized
macrophage markers (TNF-α, iNOS, CCL-2/MCP-1, IL-6, CD68 and CD80)
(12,14,16).
The increased expression of LGI3 in adipose tissue macrophages is
observed in obesity and may serve a critical regulatory role in M1
macrophage polarization and proinflammatory transition of cytokine
networks (12,14,16).
It was hypothesized that LGI3 may contribute to innate tumor
immunity in the cancer microenvironment by promoting M1
polarization of the tumor-associated macrophages (13). Thus, LGI3-regulated cytokine
networks may serve pathological and prognostic roles in
obesity-associated metabolic diseases through macrophage
polarization in VATs. The limitations of the present study were
that mouse epididymal adipose tissues and 3T3-L1 cells were used
for array analyses and GCN and eQTL databases for integrative
analysis. The present results warrant further studies to validate
the predominant proinflammatory role of LGI3 in VAT via M1
macrophage polarization using VAT from obese animals and
humans.
In conclusion, the present study provided an
integrative insight into LGI3-regulated gene products and the
association of their protein-protein interaction and co-expression
networks in adipose tissues with common and differential biological
processes in SATs and VATs. It is hypothesized from these data that
LGI3 may serve a homeostatic and pathological role in adipose
tissues in a depot-specific manner.
Supplementary Material
Summary of LGI3-regulated gene
products from the present study and previous studies.
Mouse XL Cytokine Array
coordinates.
KEGG pathway analysis of the gene
products regulated by phosphorylation in LGI3-treated 3T3-L1
cells.
Functional enrichment analysis of the
gene products regulated by expression in leucine-rich repeat LGI
family member 3-treated 3T3-L1 cells.
Transcription factor affinity
prediction of the genes included in the inner circular subnetwork
of cytokines, adipokines and chemokines that are presented in
Fig. 3.
List of the gene products in the
LGI3-regulated GCN subnetworks. SUID, set user identification.
Name, the official gene symbols.
Functional enrichment analysis by
BiNGO of the gene sets in the category groups presented in Fig. 6A.
Transcription factor binding
predictions table of genes in the gene co-expression subnetworks in
Fig. 5 (P<0.01).
Acknowledgements
Not applicable.
Funding
Funding: This work was supported by a National Research
Foundation of Korea (NRF) grant funded by the Korean government
Ministry of Science and ICT (grant. no. 2018R1D1A1A09082440).
Availability of data and materials
The datasets used and/or analyzed during the current
study are not deposited in public repositories due to pending
patent but are available from the corresponding author on
reasonable request.
Authors' contributions
HYY conceived and designed the study, performed the
data analysis and wrote the manuscript. HAK performed the
experiments and data analysis. KJB contributed to the analysis and
interpretation of data. HYY, HAK and KJB confirm the authenticity
of all the raw data. All the authors read and approved the final
manuscript.
Ethics approval and consent to
participate
Not applicable.
Patient consent for publication
Not applicable.
Competing interests
The datasets used and/or analyzed during the current
study are partially related with pending patent (HYY, Korean patent
application reference no. 10-2018-0060762. 2018.5.28). The authors
declare that they have no other competing interests.
References
|
1
|
Lee SE, Lee AY, Park WJ, Jun DH, Kwon NS,
Baek KJ, Kim YG and Yun HY: Mouse LGI3 gene: Expression in brain
and promoter analysis. Gene. 372:8–17. 2006.PubMed/NCBI View Article : Google Scholar
|
|
2
|
Park WJ, Lee SE, Kwon NS, Baek KJ, Kim DS
and Yun HY: Leucine-rich glioma inactivated 3 associates with
syntaxin 1. Neurosci Lett. 444:240–244. 2008.PubMed/NCBI View Article : Google Scholar
|
|
3
|
Park WJ, Lim YY, Kwon NS, Baek KJ, Kim DS
and Yun HY: Leucine-rich glioma inactivated 3 induces neurite
outgrowth through Akt and focal adhesion kinase. Neurochem Res.
35:789–796. 2010.PubMed/NCBI View Article : Google Scholar
|
|
4
|
Lee SH, Jeong YM, Kim SY, Jeong HS, Park
KC, Baek KJ, Kwon NS, Yun HY and Kim DS: Ultraviolet B-induced LGI3
secretion protects human keratinocytes. Exp Dermatol. 21:716–718.
2012.PubMed/NCBI View Article : Google Scholar
|
|
5
|
Jeong YM, Park WJ, Kim MK, Baek KJ, Kwon
NS, Yun HY and Kim DS: Leucine-rich glioma inactivated 3 promotes
HaCaT keratinocyte migration. Wound Repair Regen. 21:634–640.
2013.PubMed/NCBI View Article : Google Scholar
|
|
6
|
Kim IW, Jeong HS, Kwon NS, Baek KJ, Yun HY
and Kim DS: LGI3 promotes human keratinocyte differentiation via
the Akt pathway. Exp Dermatol. 27:1224–1229. 2018.PubMed/NCBI View Article : Google Scholar
|
|
7
|
Kim US, Park JW, Park ES, Bang JS, Jung
TW, Kim DS, Abd El-Aty AM, Lee JH and Jeong JH: The suppressive
effect of leucine-rich glioma inactivated 3 (LGI3) peptide on
impaired skin barrier function in a murine model atopic dermatitis.
Pharmaceutics. 12(750)2020.PubMed/NCBI View Article : Google Scholar
|
|
8
|
Lee SH, Kwon NS, Baek KJ, Yun HY and Kim
DS: LGI3 is secreted and binds to ADAM22 via TRIF-dependent NF-κB
pathway in response to LPS in human keratinocytes. Cytokine.
126(154872)2020.PubMed/NCBI View Article : Google Scholar
|
|
9
|
Jeong HS, Jeong YM, Kim J, Lee SH, Choi
HR, Park KC, Kim BJ, Baek KJ, Kwon NS, Yun HY and Kim DS:
Leucine-rich glioma inactivated 3 is a melanogenic cytokine in
human skin. Exp Dermatol. 23:600–602. 2014.PubMed/NCBI View Article : Google Scholar
|
|
10
|
Kwon NS, Baek KJ, Kim DS and Yun HY:
Leucine-rich glioma inactivated 3: Integrative analyses reveal its
potential prognostic role in cancer. Mol Med Rep. 17:3993–4002.
2018.PubMed/NCBI View Article : Google Scholar
|
|
11
|
Kwon NS, Kim DS and Yun HY: Leucine-rich
glioma inactivated 3: Integrative analyses support its prognostic
role in glioma. Onco Targets Ther. 10:2721–2728. 2017.PubMed/NCBI View Article : Google Scholar
|
|
12
|
Kim HA, Kwon NS, Baek KJ, Kim DS and Yun
HY: Leucine-rich glioma inactivated 3: Integrative analyses support
its role in the cytokine network. Int J Mol Med. 40:251–259.
2017.PubMed/NCBI View Article : Google Scholar
|
|
13
|
Kim DS, Kwon NS and Yun HY: Leucine rich
repeat LGI family member 3: Integrative analyses reveal its
prognostic association with non-small cell lung cancer. Oncol Lett.
18:3388–3398. 2019.PubMed/NCBI View Article : Google Scholar
|
|
14
|
Kim HA, Park WJ, Jeong HS, Lee HE, Lee SH,
Kwon NS, Baek KJ, Kim DS and Yun HY: Leucine-rich glioma
inactivated 3 regulates adipogenesis through ADAM23. Biochim
Biophys Acta. 1821:914–922. 2012.PubMed/NCBI View Article : Google Scholar
|
|
15
|
Kim HA, Kwon NS, Baek KJ, Kim DS and Yun
HY: Leucine-rich glioma inactivated 3 associates negatively with
adiponectin. Cytokine. 62:206–209. 2013.PubMed/NCBI View Article : Google Scholar
|
|
16
|
Kim HA, Kwon NS, Baek KJ, Kim DS and Yun
HY: Leucine-rich glioma inactivated 3 and tumor necrosis factor-α
regulate mutually through NF-κB. Cytokine. 72:220–223.
2015.PubMed/NCBI View Article : Google Scholar
|
|
17
|
Animal research: Reporting of in vivo
experiments (ARRIVE) guidelines. Available from: https://arriveguidelines.org.
|
|
18
|
Szklarczyk D, Franceschini A, Wyder S,
Forslund K, Heller D, Huerta-Cepas J, Simonovic M, Roth A, Santos
A, Tsafou KP, et al: STRING v10: Protein-protein interaction
networks, integrated over the tree of life. Nucleic Acids Res.
43:D447–D452. 2015.PubMed/NCBI View Article : Google Scholar
|
|
19
|
Lopes CT, Franz M, Kazi F, Donaldson SL,
Morris Q and Bader GD: Cytoscape web: An interactive web-based
network browser. Bioinformatics. 26:2347–2348. 2010.PubMed/NCBI View Article : Google Scholar
|
|
20
|
Alvarez-Ponce D, Feyertag F and
Chakraborty S: Position matters: Network centrality considerably
impacts rates of protein evolution in the human protein-protein
interaction network. Genome Biol Evol. 9:1742–1756. 2017.PubMed/NCBI View Article : Google Scholar
|
|
21
|
Huang dW, Sherman BT and Lempicki RA:
Systematic and integrative analysis of large gene lists using DAVID
bioinformatics resources. Nat Protoc. 4:44–57. 2009.PubMed/NCBI View Article : Google Scholar
|
|
22
|
Lee S, Zhang C, Liu Z, Klevstig M,
Mukhopadhyay B, Bergentall M, Cinar R, Stahlman M, Sikanic N, Park
JK, et al: Network analyses identify liver-specific targets for
treating liver diseases. Mol Syst Biol. 13(938)2017.PubMed/NCBI View Article : Google Scholar
|
|
23
|
Pratt D, Chen J, Welker D, Rivas R,
Pillich R, Rynkov V, Ono K, Miello C, Hicks L, Szalma S, et al:
NDEx, the network data exchange. Cell Syst. 1:302–305.
2015.PubMed/NCBI View Article : Google Scholar
|
|
24
|
Maere S, Heymans K and Kuiper M: BiNGO: A
cytoscape plugin to assess overrepresentation of gene ontology
categories in biological networks. Bioinformatics. 21:3448–3449.
2005.PubMed/NCBI View Article : Google Scholar
|
|
25
|
Thomas-Chollier M, Hufton A, Heinig M,
O'Keeffe S, Masri NE, Roider HG, Manke T and Vingron M:
Transcription factor binding predictions using TRAP for the
analysis of ChIP-seq data and regulatory SNPs. Nat Protoc.
6:1860–1869. 2011.PubMed/NCBI View Article : Google Scholar
|
|
26
|
GTEx Consortium: The genotype-tissue
expression (GTEx) project. Nat Genet. 45:580–585. 2013.PubMed/NCBI View Article : Google Scholar
|
|
27
|
Stuart JM, Segal E, Koller D and Kim SK: A
gene-coexpression network for global discovery of conserved genetic
modules. Science. 302:249–255. 2003.PubMed/NCBI View Article : Google Scholar
|
|
28
|
Zhang Q, Lenardo MJ and Baltimore D: 30
years of NF-κB: A blossoming of relevance to human pathobiology.
Cell. 168:37–57. 2017.PubMed/NCBI View Article : Google Scholar
|
|
29
|
Sabir JS, El Omri A, Shaik NA,
Banaganapalli B, Al-Shaeri MA, Alkenani NA, Hajrah NH, Awan ZA,
Zrelli H, Elango R and Khan M: Identification of key regulatory
genes connected to NF-κB family of proteins in visceral adipose
tissues using gene expression and weighted protein interaction
network. PLoS One. 14(e0214337)2019.PubMed/NCBI View Article : Google Scholar
|
|
30
|
Verbisck NV, Costa ET, Costa FF, Cavalher
FP, Costa MD, Muras A, Paixão VA, Moura R, Granato MF, Ierardi DF,
et al: ADAM23 negatively modulates alpha(v)beta(3) integrin
activation during metastasis. Cancer Res. 69:5546–5552.
2009.PubMed/NCBI View Article : Google Scholar
|
|
31
|
Antonov AS, Antonova GN, Munn DH, Mivechi
N, Lucas R, Catravas JD and Verin AD: αVβ3 integrin regulates
macrophage inflammatory responses via PI3 kinase/Akt-dependent
NF-κB activation. J Cell Physiol. 226:469–476. 2011.PubMed/NCBI View Article : Google Scholar
|
|
32
|
Huang XF and Chen JZ: Obesity, the
PI3K/Akt signal pathway and colon cancer. Obes Rev. 10:610–616.
2009.PubMed/NCBI View Article : Google Scholar
|
|
33
|
Mauer J, Chaurasia B, Goldau J, Vogt MC,
Ruud J, Nguyen KD, Theurich S, Hausen AC, Schmitz J, Brönneke HS,
et al: Signaling by IL-6 promotes alternative activation of
macrophages to limit endotoxemia and obesity-associated resistance
to insulin. Nat Immunol. 15:423–430. 2014.PubMed/NCBI View Article : Google Scholar
|
|
34
|
Yokoyama M, Okada S, Nakagomi A, Moriya J,
Shimizu I, Nojima A, Yoshida Y, Ichimiya H, Kamimura N, Kobayashi
Y, et al: Inhibition of endothelial p53 improves metabolic
abnormalities related to dietary obesity. Cell Rep. 7:1691–1703.
2014.PubMed/NCBI View Article : Google Scholar
|
|
35
|
Adachi H, Kurachi H, Homma H, Adachi K,
Imai T, Sakata M, Matsuzawa Y and Miyake A: Involvement of
epidermal growth factor in inducing adiposity of age female mice. J
Endocrinol. 146:381–393. 1995.PubMed/NCBI View Article : Google Scholar
|
|
36
|
Hotamisligil GS, Shargill NS and
Spiegelman BM: Adipose expression of tumor necrosis factor-alpha:
Direct role in obesity-linked insulin resistance. Science.
259:87–91. 1993.PubMed/NCBI View Article : Google Scholar
|
|
37
|
Lukjanenko L, Jung MJ, Hegde N,
Perruisseau-Carrier C, Migliavacca E, Rozo M, Karaz S, Jacot G,
Schmidt M, Li L, et al: Loss of fibronectin from the aged stem cell
niche affects the regenerative capacity of skeletal muscle in mice.
Nat Med. 22:897–905. 2016.PubMed/NCBI View Article : Google Scholar
|
|
38
|
Jager J, Corcelle V, Grémeaux T, Laurent
K, Waget A, Pagès G, Binétruy B, Le Marchand-Brustel Y, Burcelin R,
Bost F and Tanti JF: Deficiency in the extracellular
signal-regulated kinase 1 (ERK1) protects leptin-deficient mice
from insulin resistance without affecting obesity. Diabetologia.
54:180–189. 2011.PubMed/NCBI View Article : Google Scholar
|
|
39
|
Donohoe F, Wilkinson M, Baxter E and
Brennan DJ: Mitogen-activated protein kinase (MAPK) and
obesity-related cancer. Int J Mol Sci. 21(1241)2020.PubMed/NCBI View Article : Google Scholar
|
|
40
|
Pal A, Barber TM, Van de Bunt M, Rudge SA,
Zhang Q, Lachlan KL, Cooper NS, Linden H, Levy JC, Wakelam MJ, et
al: PTEN mutations as a cause of constitutive insulin sensitivity
and obesity. N Engl J Med. 367:1002–1011. 2012.PubMed/NCBI View Article : Google Scholar
|
|
41
|
Berryman DE, Glad CA, List EO and
Johannsson G: The GH/IGF-1 axis in obesity: Pathophysiology and
therapeutic considerations. Nat Rev Endocrinol. 9:346–356.
2013.PubMed/NCBI View Article : Google Scholar
|
|
42
|
Zhang X, Xu A, Chung SK, Cresser JH,
Sweeney G, Wong RL, Lin A and Lam KS: Selective inactivation of
c-Jun NH2-terminal kinase in adipose tissue protects against
diet-induced obesity and improves insulin sensitivity in both liver
and skeletal muscle in mice. Diabetes. 60:486–495. 2011.PubMed/NCBI View Article : Google Scholar
|
|
43
|
Rull A, Camps J, Alonso-Villaverde C and
Joven J: Insulin resistance, inflammation, and obesity: Role of
monocyte chemoattractant protein-1 (or CCL2) in the regulation of
metabolism. Mediators Inflamm. 2010(326580)2010.PubMed/NCBI View Article : Google Scholar
|
|
44
|
Cai H, Dong LQ and Liu F: Recent advances
in adipose mTOR signaling and function: Therapeutic prospects.
Trends Pharmacol Sci. 37:303–317. 2016.PubMed/NCBI View Article : Google Scholar
|
|
45
|
Chen M, Lu P, Ma Q, Cao Y, Chen N, Li W,
Zhao S, Chen B, Shi J, Sun Y, et al: CTNNB1/β-catenin dysfunction
contributes to adiposity by regulating the cross-talk of mature
adipocytes and preadipocytes. Sci Adv. 6(eaax9605)2020.PubMed/NCBI View Article : Google Scholar
|
|
46
|
Matesanz N, Nikolic I, Leiva M,
Pulgarin-Alfaro M, Santamans AM, Bernardo E, Mora A, Herrera-Melle
L, Rodriguez E, Beiroa D, et al: p38α blocks brown adipose tissue
thermogenesis through p38δ inhibition. PLoS Biol.
16(e2004455)2018.PubMed/NCBI View Article : Google Scholar
|
|
47
|
Fatima LA, Campello RS, Santos RS, Freitas
HS, Frank AP, Machado UF and Clegg DJ: Estrogen receptor 1 (ESR1)
regulates VEGFA in adipose tissue. Sci Rep. 7(16716)2017.PubMed/NCBI View Article : Google Scholar
|
|
48
|
Kubota T, Kubota N and Kadowaki T:
Imbalanced insulin actions in obesity and type 2 diabetes: Key
mouse models of insulin signaling pathway. Cell Metab. 25:797–810.
2017.PubMed/NCBI View Article : Google Scholar
|
|
49
|
Ray A: Tumor-linked HER2 expression:
Association with obesity and lipid-related microenvironment. Horm
Mol Biol Clin Investig. 32:2017.PubMed/NCBI View Article : Google Scholar
|
|
50
|
Huang X, Liu G, Guo J and Su Z: The
PI3K/AKT pathway in obesity and type 2 diabetes. Int J Biol Sci.
14:1483–1496. 2018.PubMed/NCBI View Article : Google Scholar
|
|
51
|
Lefterova MI, Haakonsson AK, Lazar MA and
Mandrup S: PPARγ and the global map of adipogenesis and beyond.
Trends Endocrinol Metab. 25:293–302. 2014.PubMed/NCBI View Article : Google Scholar
|
|
52
|
Antonopoulos AS, Margaritis M, Coutinho P,
Shirodaria C, Psarros C, Herdman L, Sanna F, De Silva R, Petrou M,
Sayeed R, et al: Adiponectin as a link between type 2 diabetes and
vascular NADPH oxidase activity in the human arterial wall: The
regulatory role of perivascular adipose tissue. Diabetes.
64:2207–2219. 2015.PubMed/NCBI View Article : Google Scholar
|
|
53
|
Du J, Fan LM, Mai A and Li JM: Crucial
roles of Nox2-derived oxidative stress in deteriorating the
function of insulin receptors and endothelium in dietary obesity of
middle-aged mice. Br J Pharmacol. 170:1064–1077. 2013.PubMed/NCBI View Article : Google Scholar
|
|
54
|
Fernandez-Twinn DS, Blackmore HL, Siggens
L, Giussani DA, Cross CM, Foo R and Ozanne SE: The programming of
cardiac hypertrophy in the offspring by maternal obesity is
associated with hyperinsulinemia, AKT, ERK, and mTOR activation.
Endocrinology. 153:5961–5971. 2012.PubMed/NCBI View Article : Google Scholar
|
|
55
|
Kanda H, Tateya S, Tamori Y, Kotani K,
Hiasa K, Kitazawa R, Kitazawa S, Miyachi H, Maeda S, Egashira K and
Kasuga M: MCP-1 contributes to macrophage infiltration into adipose
tissue, insulin resistance, and hepatic steatosis in obesity. J
Clin Invest. 116:1494–1505. 2006.PubMed/NCBI View Article : Google Scholar
|
|
56
|
Kapur S, Marcotte B and Marette A:
Mechanism of adipose tissue iNOS induction in endotoxemia. Am J
Physiol. 276:E635–E641. 1999.PubMed/NCBI View Article : Google Scholar
|
|
57
|
Pietiläinen KH, Kannisto K,
Korsheninnikova E, Rissanen A, Kaprio J, Ehrenborg E, Hamsten A and
Yki-Järvinen H: Acquired obesity increases CD68 and tumor necrosis
factor-alpha and decreases adiponectin gene expression in adipose
tissue: A study in monozygotic twins. J Clin Endocrinol Metab.
91:2776–2781. 2006.PubMed/NCBI View Article : Google Scholar
|
|
58
|
Ronis MJ, Sharma N, Vantrease J,
Borengasser SJ, Ferguson M, Mercer KE, Cleves MA, Gomez-Acevedo H
and Badger TM: Female mice lacking p47phox have altered adipose
tissue gene expression and are protected against high fat-induced
obesity. Physiol Genomics. 45:351–366. 2013.PubMed/NCBI View Article : Google Scholar
|
|
59
|
Sindhu S, Thomas R, Shihab P, Sriraman D,
Behbehani K and Ahmad R: Obesity is a positive modulator of IL-6R
and IL-6 expression in the subcutaneous adipose tissue:
Significance for metabolic inflammation. PLoS One.
10(e0133494)2015.PubMed/NCBI View Article : Google Scholar
|
|
60
|
Uchida K, Satoh M, Inoue G, Onuma K,
Miyagi M, Iwabuchi K and Takaso M: CD11c(+) macrophages and levels
of TNF-α and MMP-3 are increased in synovial and adipose tissues of
osteoarthritic mice with hyperlipidaemia. Clin Exp Immunol.
180:551–559. 2015.PubMed/NCBI View Article : Google Scholar
|
|
61
|
Weisberg SP, McCann D, Desai M, Rosenbaum
M, Leibel RL and Ferrante AW Jr: Obesity is associated with
macrophage accumulation in adipose tissue. J Clin Invest.
112:1796–1808. 2003.PubMed/NCBI View Article : Google Scholar
|
|
62
|
Min JL, Nicholson G, Halgrimsdottir I,
Almstrup K, Petri A, Barrett A, Travers M, Rayner NW, Mägi R,
Pettersson FH, et al: Coexpression network analysis in abdominal
and gluteal adipose tissue reveals regulatory genetic loci for
metabolic syndrome and related phenotypes. PLoS Genet.
8(e1002505)2012.PubMed/NCBI View Article : Google Scholar
|
|
63
|
Skinkyte-Juskiene R, Kogelman LJ and
Kadarmideen HN: Transcription factor co-expression networks of
adipose RNA-seq data reveal regulatory mechanisms of obesity. Curr
Genomics. 19:289–299. 2018.PubMed/NCBI View Article : Google Scholar
|
|
64
|
Lumeng CN, DelProposto JB, Westcott DJ and
Saltiel AR: Phenotypic switching of adipose tissue macrophages with
obesity is generated by spatiotemporal differences in macrophage
subtypes. Diabetes. 57:3239–3246. 2008.PubMed/NCBI View Article : Google Scholar
|
|
65
|
Mosser DM and Edwards JP: Exploring the
full spectrum of macrophage activation. Nat Rev Immunol. 8:958–969.
2008.PubMed/NCBI View Article : Google Scholar
|
|
66
|
Appari M, Channon KM and McNeill E:
Metabolic regulation of adipose tissue macrophage function in
obesity and diabetes. Antioxid Redox Signal. 29:297–312.
2018.PubMed/NCBI View Article : Google Scholar
|
|
67
|
Morris DL, Singer K and Lumeng CN: Adipose
tissue macrophages: Phenotypic plasticity and diversity in lean and
obese states. Curr Opin Clin Nutr Metab Care. 14:341–346.
2011.PubMed/NCBI View Article : Google Scholar
|
|
68
|
Mathis D: Immunological goings-on in
visceral adipose tissue. Cell Metab. 17:851–859. 2013.PubMed/NCBI View Article : Google Scholar
|