Introduction
The global prevalence of diabetes has increased
rapidly since the turn of the millennium (1). By 2025, the number of diabetic
patients is predicted to reach 300 million in the world, with an
increase rate of 200% in developing countries (1).
Diabetes mellitus (DM) is a metabolic disorder that
is caused by high blood sugar levels as a result of either
deficiencies in insulin secretion (type I) or insulin resistance
(type II DM, or T2DM) (2,3). Subsequently, utilization of glucose is
hindered, which causes stress to multiple organs. Long term
hyperglycemia can alter the metabolic and hemodynamic balance, in
turn activating different inflammatory pathways and inducing injury
to a number of organs, including blood vessels, heart, eyes, nerves
and in particular the kidney (4).
Diabetic nephropathy (DN) is a major complication that is
associated with T2DM and also serve as the leading cause of
end-stage renal disease (5). Renal
microcirculation disorder and increased glycated protein levels can
cause ischemia and stress damage to kidney tissues, which leads to
glomerular injury (6).
DN is characterized by filtration barrier injury in
the glomerulus, with features including glomerular mesangium
expansion, increased glomerular basement membrane thickness and
glomerulosclerosis, which is also known as glomerular atrophy
(5). Transforming growth factor
(TGF)-β1 had been reported to be an important factor for DN
pathogenesis that participates in the progression from glomerular
sclerosis to interstitial fibrosis (7).
In addition, hyperglycemia can enhance TGF-β1
expression, which stimulates the synthesis of extracellular matrix
(ECM) proteins, including collagen, fibronectin and proteoglycan,
whilst suppressing ECM degradation (8).
During latter stages of the disease, hyperglycemia
can lead to atrophy and fibrosis of the glomerulus and DN
progression (5).
The pathophysiology of DN remain to be fully
elucidated. However, previous studies showed that in addition to
hemodynamic and metabolic changes caused by hyperglycemia,
activation of inflammatory pathways may also be an important
underlying cause of DN (5,9).
Chronic low-grade inflammation can induce DN in
patients with T2DM (10). In
particular, IL-6 was previously found to be a promising novel serum
and urine marker for DN diagnosis and prognosis (11). Additonally, CD4+,
CD8+ T cell infiltration in the diabetic kidney has been
demonstrated to increase the expression of IL-6 and promote the
development of DN in mice with streptozotocin (STZ)-induced
diabetes (12,13). Diet, medicine and exercise have
traditionally been regarded to be the cornerstone of diabetes
management (14). However, studies
on the prevention and management of diabetes through exercise
remain insufficient. Therefore, in the present study, rat T2DM
models induced by high fat diet followed by injection with STZ were
established, to study the effects of exercise intervention on the
prevention of diabetes.
Materials and methods
Ethics approval
The present study was approved by the Ethics
Committee of Central China Normal University (Wuhan, China). In
total, 50 specific pathogen-free male Sprague-Dawley rats (weight,
170-230 g; age, 6 weeks) were purchased from The Hubei Experimental
Animal Research Center [license no. SCXK(E) 2015-0018, no.
42000600025097]. The animals were maintained on a 12-h light/dark
cycle, at the temperature of 20-22˚C with the relative humidity of
40-70% and allowed to eat and drink freely.
Animals and experimental design
After 1 week of adaptive feeding, rats were randomly
divided into the following five groups (n=10 rats per group): i)
Control group (NC); ii) the diabetes group (DM); iii) the
low-intensity exercise group (LE); iv) the moderate-intensity
exercise group (ME); and v) the high-intensity exercise group (HE).
One animal in the HE group died before the end of the experiment.
At the same time of exercise intervention, rats in each group were
fed with different diets. The NC group was fed with the national
standard diet, whilst the DM, LE, ME and HE groups were all fed
with high fat feed (64.5% basic feed, 18% sucrose, 10% lard, 5% egg
yolk powder, 2% cholesterol, 0.5% sodium bileate). After 8 weeks,
rats were injected with STZ. A total of 1 week later, blood glucose
was measured and the rats were euthanized.
Exercise regime
Rats in the NC and DM groups were allowed to move
freely within their respective cages whereas those in the LE, ME
and HE groups performed varying intensities of treadmill exercises
during the feeding period with high fat diet. According to the
preliminary experimental results of a pilot experiment and a
previous study by Bedford et al (15), the exercise regimen designed for the
present study was 8 m/min and 0˚ slope for the LE group, 15 m/min
and 5˚ slope for the ME group and 20 m/min and 10˚ slope for the HE
group. For 1 h/per day and 5 days per week, all three groups of
rats that underwent exercise were able to complete 1 h of daily
running training for 8 weeks. High-fat diet feeding were combined
concomittantly with the three different intensity exercise regimens
until the end of week 8.
Animal model establishment
T2DM rat model was established according to
protocols decribed in a previous study (16). Briefly, rats in all 5 groups were
fasted overnight without water for 12 h, whilst those in the NC
group were given a single intraperitoneal injection of 0.1 mM
citrate buffer according to the dose of 30 mg/kg STZ. Rats in the
DM, LE, ME and HE groups, in addition to undergoing exercise
training for 8 weeks, were given a single intraperitoneal injection
of 30 mg/kg 2% streptozotocin (STZ) solution after 8 weeks of HFD
feeding. A total of 1 week later, 50 µl blood collected from the
tip of the rat's tail was used to measure blood glucose 1 week
after STZ injection, where random blood glucose ≥16.7 mmol/l was
used as the standard for T2MD modeling.
Oral Glucose tolerance test
Glucose solution was administered to all rats at a
50% concentration of glucose at a dose of 2 g/kg 1 week after STZ
injection. A total of 200 µl blood were collected directly from
each rat's tail and blood glucose measurements were performed using
a blood glucose meter before gavage and then 30, 60 and 120 min
after gavage, following which the blood glucose concentration was
measured using a glucose meter (Sinacare). The trapezoidal method
(17-18) was used to calculate the glucose area
under the curve (AUC) during the OGTT. The formula is as follows:
AUCFBG=Fasting blood glucose (FBG) at 0 min) x1/4 + FBG
at 0 min x½ + FBG at 60 min x3/4 + FBG (120 min) x1/2.
Measurement of serum biochemical
indices
After anesthesia with 10% chloral hydrate (400
mg/kg), 5 ml blood was collected from the orbital sinus. The rats
were then sacrificed by cervical dislocation. None of the rats
showed any signs of peritonitis following administration of 10%
chloral hydrate. Serum was separated by centrifugation at 2,000 x g
for 10 min. ELISA was used to measure the protein levels in the
serum. IL-6 (cat. no. EK0412) and TNF-α (cat. no. EK0526) was
measured using ELISA kits (Boster Biological Technology) according
to the manufacturer's protocols. The level of glycosylated serum
protein (GSP) was measured using the GSP assay kit (cat. no A037-2,
Nanjing Jiancheng Bioengineering Institute). Levels of blood urea
nitrogen (BUN) and creatinine (Cr) were measured by an automatic
biochemical analyzer (COBAS 701).
Western blot analysis
After euthanasia,the renal tissue was lysed using
RIPA (Beyotime Institute of Biotechnology) on ice to extract the
total protein. Protein concentration was determined using the
bicinchoninic acid protein assay kit. A total of 40 µg
heat-denatured protein samples were separated by 10% SDS-PAGE.
Subsequently, proteins were transferred onto PVDF membranes,
followed by blocking with 5% skimmed milk powder for 2 h at room
temperature. The supernatant was collected as the total protein
extract. The protein concentration was estimated by the Bradford
Protein Assay kit (Aidlab Biotechnologies), according to the
manufacturer's instructions. The membranes were then rinsed with
TBS-0.05% Tween-20 (TBST) and incubated with the following primary
antibodiesat 4˚C overnight: Mouse anti-β-actin antibody (cat. no.
KM9001; Tiangen Sungene Biotech Co., Ltd.; 1:8,000), anti-matrix
metalloproteinase (MMP) 9 (cat. no. 10375-2-AP; ProteinTech Group,
Inc.; 1:1,000); anti-tissue inhibitors of metalloproteinases
(TIMP)1 (cat. no. 10753-1-AP; ProteinTech group, Inc.; 1:1,000) and
anti-TGF-β1 (cat. no. 21898-1-AP; ProteinTech Group, Inc.;
1:1,000). After washing with TBST three times, PVDF membranes were
incubuated overnight at 4˚C with the goat anti-rat secondary
antibody (cat. no. ANT022; 1:10,000; Wuhan Antejie Biotechnology
Co., Ltd.). After further washing with TBST, the membranes were
submerged in BeyoECL Plus reagent (cat. no. P0018; Beyotime
Institute of Biotechnology) and incubated for 1 min at room
temperature. The membrane was wrapped in cling film and images were
taken using a ChemiScope 3300 Mini gel imaging system (CLiNX;
Scientific Instruments Co., Ltd.). The relative intensity of
protein bands compared with those of β-actin was quantified using
the Quantity One software (version 4.6.2; Bio-Rad Laboratories,
Inc.).
Haematoxylin and eosin (H&E)
staining for histopathology
HE staining were performed to evaluate the renal
pathological changes, glomerular morphological changes and renal
fibrosis in the rats kidneys. Kidney tissues from all the rats were
fixed with 4% paraformaldehyde at 4˚C for 24 h and embedded in
paraffin blocks before they were sectioned at ~3-4 µm thickness.
The sections were treated with xylene for 5-10 min, immersed in a
mixture of xylene and pure ethanol (1:1) for 5 min and then in 100,
95, 85 and 75% ethanol, each for 5 min. Samples were then stained
in Harris hematoxylin for 4 min at room temperature and rinsed in
tap water for 2 min. Differentiation was conducted using 1%
hydrochloric acid, followed by washing with tap water. Slides were
then counterstained with eosin for 2 min at room temperature. After
eosin staining, the slices were dehydrated in 95 and 100% alcohol
for 1 min at room temperature. The tissues were then stained with
H&E and evaluated at x400 magnification under a light
microscope (Olympus BX51).
Glomerular diameter measurements
In total, six images of the glomerulus containing
the vascular/urinary poles were randomly taken for each
H&E-stained kidney tissue section. NDP.view 2.6.13 image
analysis software (Hamamatsu Photonics KK), was used to directly
measure the maximum diameter of each glomerulus and to subsequently
calculate the average glomerular diameter (19).
Statistical analysis
SPSS 20.0 (IBM Corp.) was used for statistics
analysis and the data were expressed as the mean ± SD. Data were
analyzed using one-way ANOVA with the Tukey's post hoc test. Mixed
ANOVA followed by Bonferroni's test was used to measure differences
in weight and fasting blood glucose (FBG) between groups at
different time points. P<0.05 was considered to indicate a
statistically significant difference.
Results
Effects of exercise during DM modeling
on the weight of rats
At the end of the 8th week, compared with those in
the NC group, whilst rats in DM group showed significant body
weight gain (P<0.05), no such increase was observed for rats in
any of the three exercise groups. In addition, the weight of rats
in the HE group was significantly lower compared with that in the
LE and ME groups (P<0.05). Subsequently, 7 days after STZ
injection, the weight of rats in HE group was lower compared with
that in rats in the NC, DM, LE and ME groups (P<0.05). Compared
with the weight of rats at the end of week 8, those in rats in the
DM, LE and HE groups were significantly reduced 1 week after STZ
injection (P<0.05; Table I).
 | Table IChanges in body weight of rats in the
different groups at different stages. |
Table I
Changes in body weight of rats in the
different groups at different stages.
| Groups | N | Initial (g) | End of week 8
(g) | Day 7 after
streptozotocin injection (g) |
|---|
| NC | 10 | 214.80±9.17 | 496.56±36.01 | 501.07±38.24 |
| DM | 10 | 211.50±12.88 |
549.86±15.08b |
499.80±47.99a |
| LE | 10 | 207.50±11.40 | 520.23±43.36 |
482.89±30.75a |
| ME | 10 | 212.00±13.28 | 524.30±65.97 | 511.53±86.00 |
| HE | 9 | 202.4±30.52 |
465.22±25.93c,d,e |
432.00±19.32a,b,c,d,e |
Exercise can alleviate insulin
resistance in rats with DM
No statistical difference was observed in the FBG
levels among the groups after week 8. FBG levels remained unchanged
1 week after STZ injection in rats in the NC group but were
increased significantly in those in the DM, LE, ME and HE groups
(P<0.05) compared with week 8. By contrast, FBG levels in rats
in the ME and HE groups were significantly lower compared with
those in the DM group (P<0.05). Additionally, GSP levels were
measured 1 week after STZ injection. Compared with those in the NC,
GSP levels were significantly increased in DM group (P<0.05).
GSP levels were significantly decreased in ME group compared with
those in the DM group (P<0.05; Table II). However, there was no
significant difference between other exercise groups and the DM
group in terms of GSP.
| Table IIFasting blood glucose and
glycosylated serum protein levels. |
Table II
Fasting blood glucose and
glycosylated serum protein levels.
| | Fasting blood
glucose (mmol/l) | |
|---|
| Group | Week 1 | Week 8 | 1 week after
streptozotocin injection | Glycated serum
protein (mmol/l) |
|---|
| NC | 4.91±0.56 | 4.38±0.64 | 4.87±0.50 | 1.59±0.21 |
| DM | 4.88±0.57 | 4.65±0.57 |
16.11±5.10a,b |
2.92±0.85b |
| LE | 4.69±0.51 | 4.29±0.68 |
15.26±4.63a,b | 2.48±0.42 |
| ME | 4.79±0.59 | 4.57±0.55 |
9.09±3.40a,b,c,d |
2.19±0.52c |
| HE | 4.72±0.65 | 4.64±0.95 |
9.00±3.88a,b,c,d | 2.53±0.77 |
The AUCFBG of the rats in DM group was
significantly greater compared with that in the NC group
(P<0.05), but there was no significant difference between that
in DM and LE groups (Table III).
AUCFBG in the ME and HE groups are almost identical, but
both are significantly lower compared with those in the DM group
(P<0.05; Fig. 1; Table III).
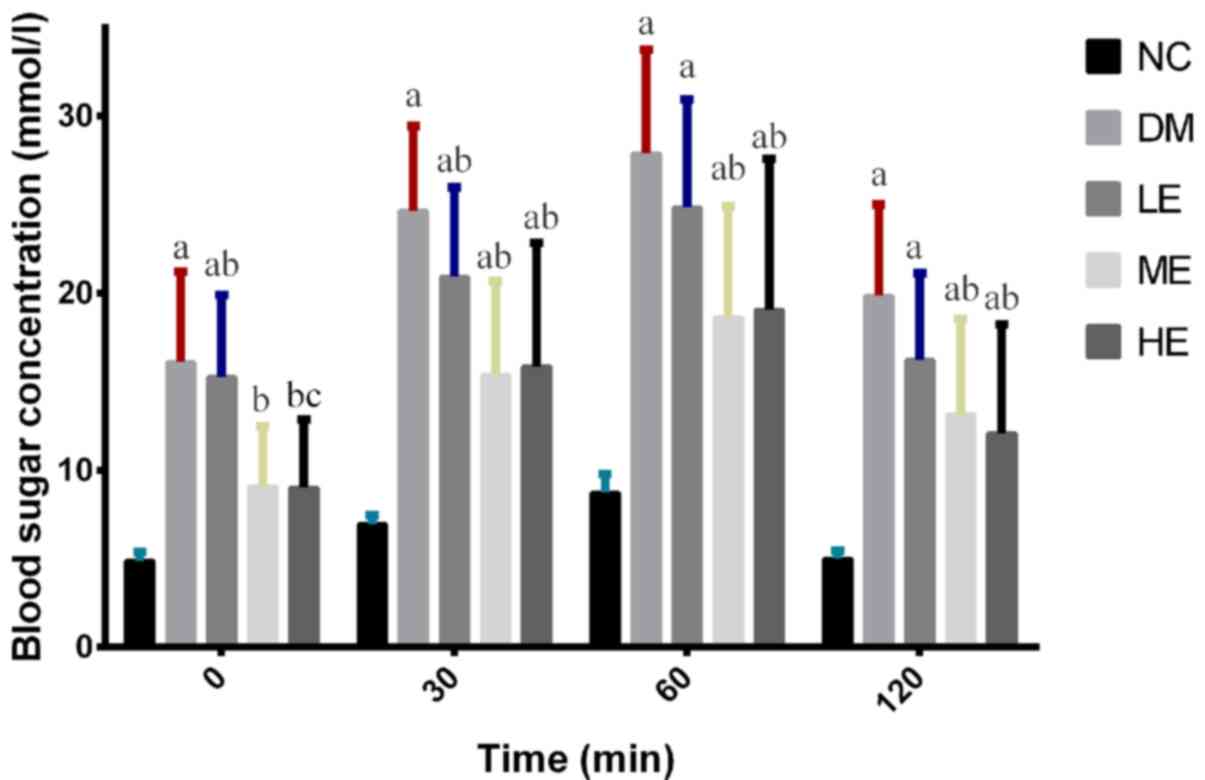 | Figure 1Serum glucose levels in oral glucose
tolerance test in each group of rats. After feeding with glucose in
rats orally, blood glucose levels were measured at 0, 30, 60, 90
and 120 min and were under the oral glucose tolerance test blood
glucose curve. Data are presented as the mean ± SD.
aP<0.05 vs. NC, bP<0.05 vs. DM,
cP<0.05 vs. LE. NC, control group; DM, diabetes
mellitus model group; LE, low intensity exercise intervention
group; ME, moderate intensity exercise intervention group; HE, high
intensity exercise intervention group. |
| Table IIIAUCFBG on day 7 after
injection of streptozotocin. |
Table III
AUCFBG on day 7 after
injection of streptozotocin.
| Group | N |
AUCFBG |
|---|
| NC | 10 | 13.73±0.95 |
| DM | 10 |
47.18±10.20a |
| LE | 10 | 41.02±10.26 |
| ME | 10 |
30.51±10.65b |
| HE | 9 |
30.52±13.68b |
Effect of exercise on serum
inflammatory cytokine levels in each group
There were no significant differences between NC and
DM in terms of both IL-6 and TNF-α. Compared with those in rats in
the LE group, serum TNF-α levels were significantly lower in the ME
and HE groups (P<0.05). Serum IL-6 levels were significantly
lower in the LE and ME groups compared with those in the DM group
(P<0.05; Table IV). Although
the difference of IL-6 between DM and HE groups appeared to be
large, there was no statistical difference.
| Table IVSerum inflammatory factor content in
each group. |
Table IV
Serum inflammatory factor content in
each group.
| Group | N | TNF-α (pg/ml) | IL-6 (pg/ml) |
|---|
| NC | 10 | 8.88±4.22 | 74.66±41.06 |
| DM | 10 | 9.00±4.35 | 88.37±48.63 |
| LE | 10 | 11.71±5.80 |
30.79±18.56a |
| ME | 10 |
5.14±3.72a,b |
31.64±19.73a |
| HE | 9 |
2.85±1.22a,b | 51.77±29.80 |
Effects of exercise on renal
function
Serum concentrations of urea and creatinine were
subsequently measured 1 week after STZ injection, where no
significant differences were observed among the five groups tested
(Table V).
| Table VConcentration of serum urea and
creatinine. |
Table V
Concentration of serum urea and
creatinine.
| Group | N | Urea (mmol/l) | Creatinine
(µmol/l) |
|---|
| NC | 10 | 1.13±0.15 | 6.00±1.25 |
| DM | 10 | 1.09±0.14 | 5.80±0.63 |
| LE | 10 | 1.24±0.24 | 5.44±0.88 |
| ME | 10 | 1.00±0.23 | 6.30±1.49 |
| HE | 9 | 1.16±0.22 | 5.56±0.88 |
Effects of exercise on the expression
MMP-9/TIMP-1 and TGF-β1 in the kidney
The expression levels MMP-9, TIMP-1 and TGF-β1 in
renal tissue were next measured by western blotting 1 week after
STZ injection. There were no statistically significant differences
in the expression levels of MMP-9, TIMP-1 and TGF-β1 in tissues
among the five groups tested (Fig.
2).
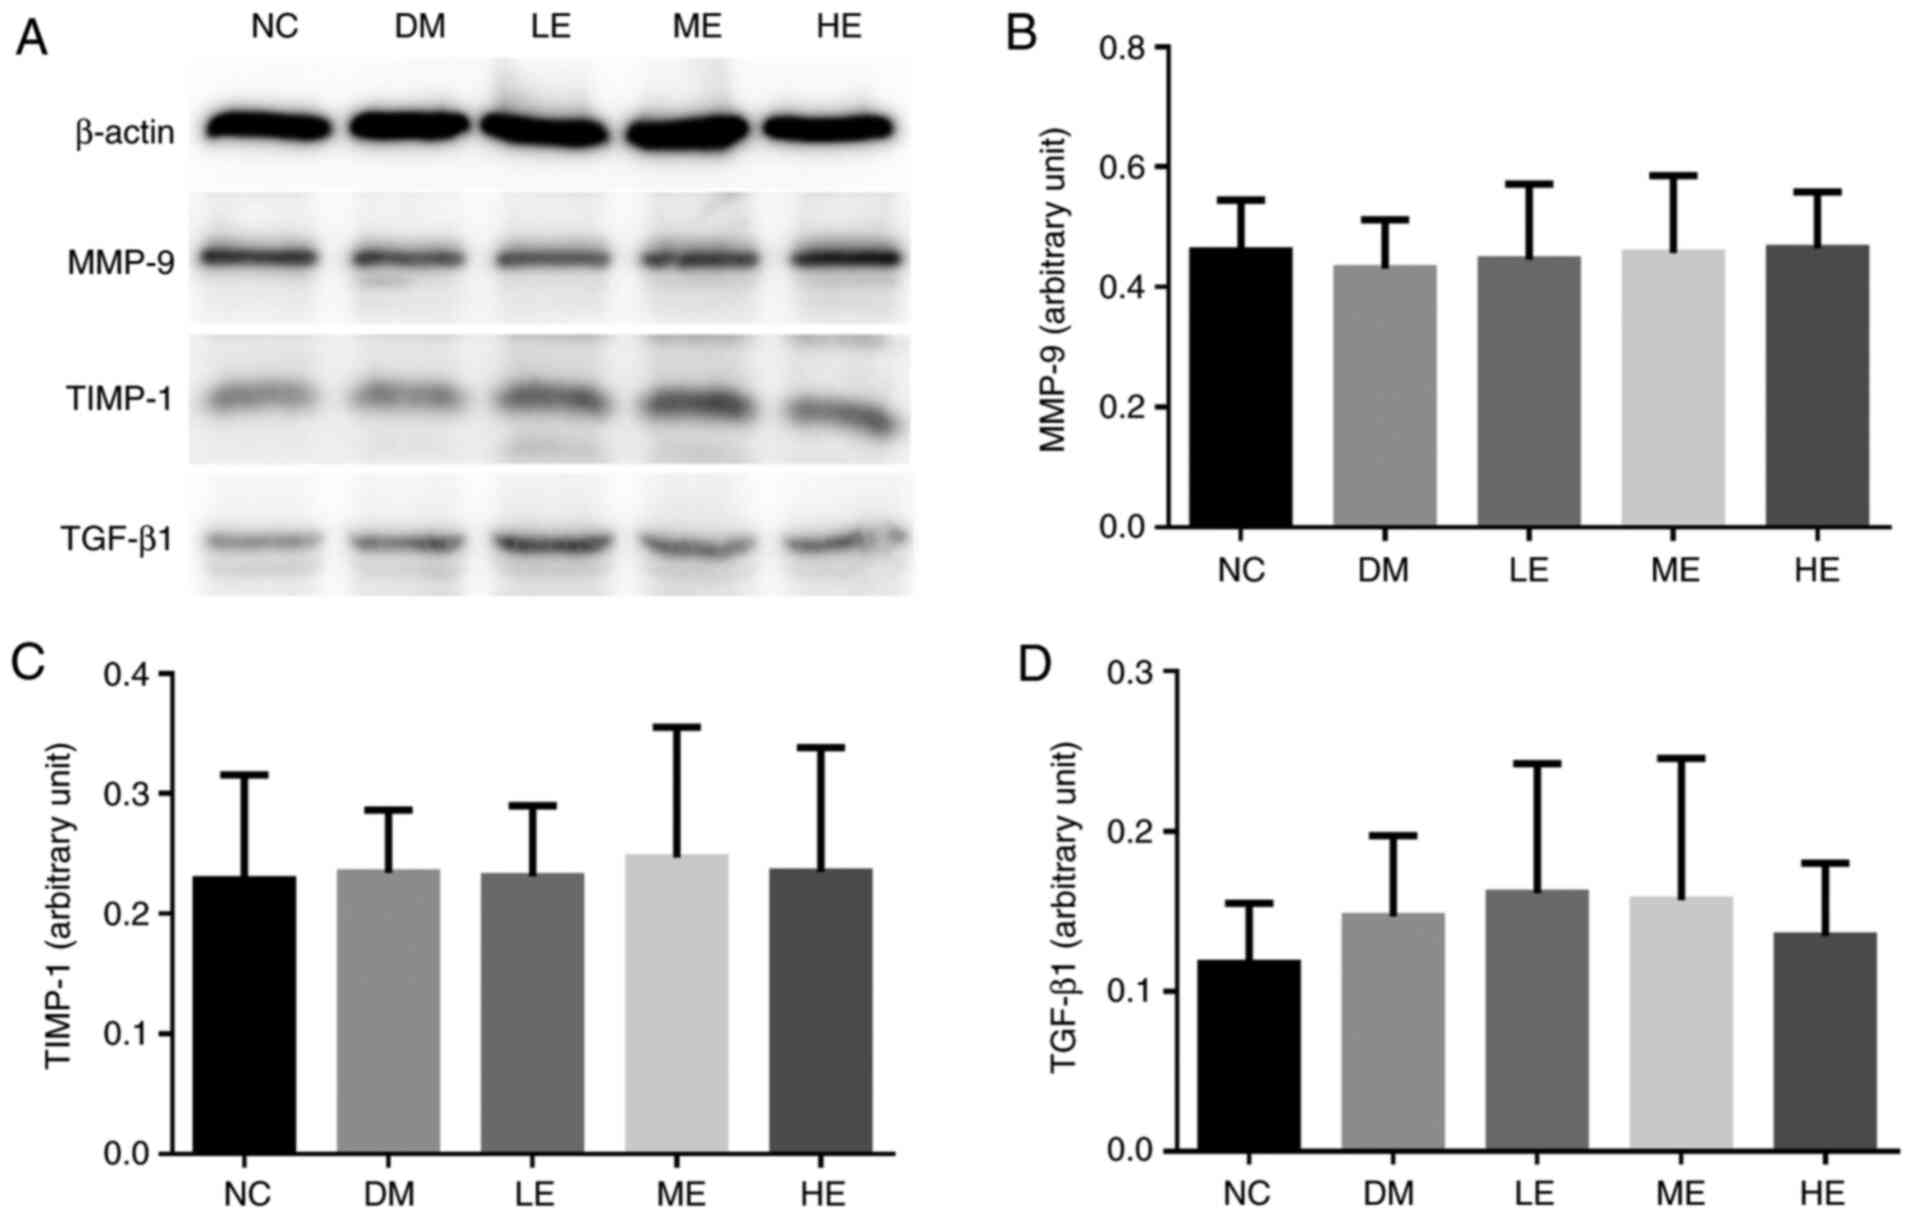 | Figure 2Expression of MMP-9/TIMP-1 protein in
the kidney tissues from rats in each group. (A) Representative
western blotting images of the expression of MMP-9, TIMP-1 and
TGF-β1. Quantification of (B) MMP-9, (C) TIMP-1 and (D) TGF-β1.
Data represent the mean ± SD (n=10). NC, control group; DM,
diabetes mellitus model group; LE, low intensity exercise
intervention group; ME, moderate intensity exercise intervention
group; HE, high intensity exercise intervention group; MMP, matrix
metalloproteinase; TIMP, tissue inhibitors of metalloproteinase;
TGF, transforming growth factor. |
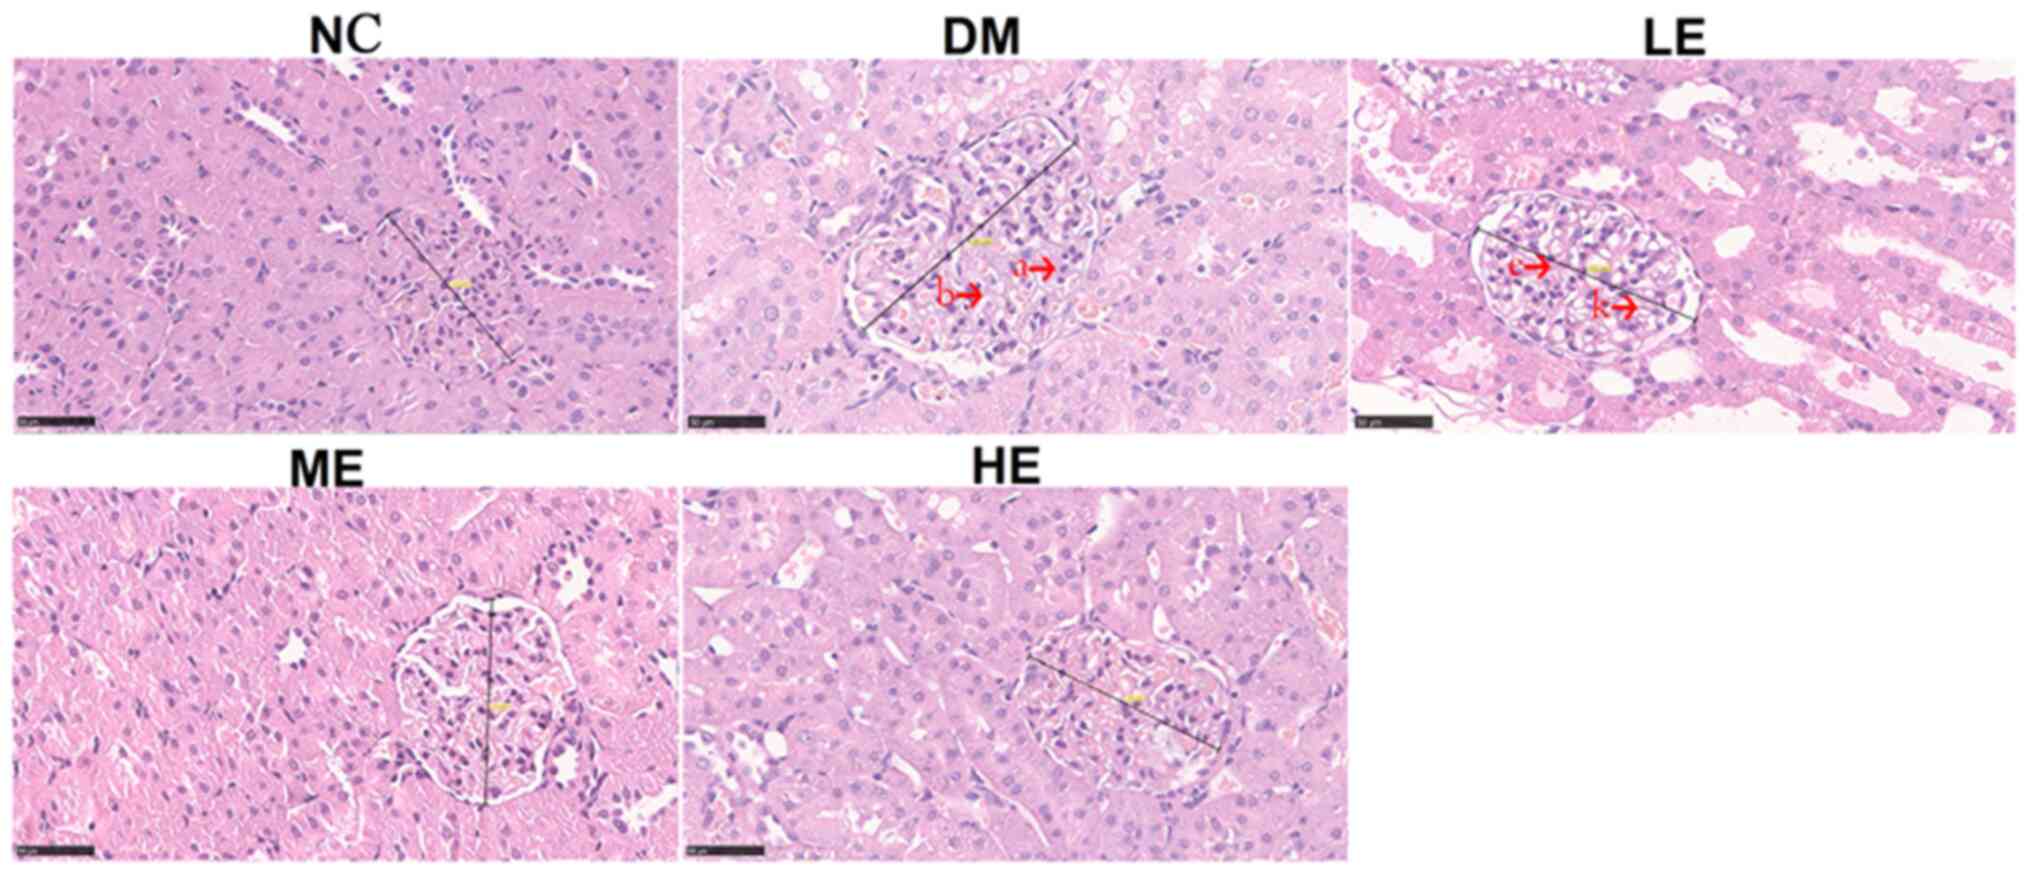
Effects of exercise on the kidney
morphological structure and glomerular diameter
Compared with that in the NC group, glomerular
diameter exhibited a significant increase in DM and LE groups
(P<0.05). Compared with that in the DM group, glomerular
diameter was significantly reduced in the ME and HE groups
(P<0.05) (Table VI).
| Table VIGlomerular diameter measurements. |
Table VI
Glomerular diameter measurements.
| Group | N | Diameter (µm) |
|---|
| NC | 10 | 138.22±5.23 |
| DM | 10 |
155.43±4.20a |
| LE | 10 |
157.67±3.69a |
| ME | 10 |
137.75±2.23b |
| HE | 9 |
135.22±3.63b |
No notable pathological changes were observed in the
kidney slices obtained from rats in the NC group by H&E
staining. In the tissues from the DM group, histological analysis
revealed unclear glomerular structures, glomerular hypertrophy,
increased basal membrane thickness and mesangial region width, in
addition to increased glomerular cell number. In the kidney tissues
of rats in the LE group, glomerular hypertrophy was also observed,
along with increased glomerular cell number and slight increases in
the mesangial region width. The renal tubular and glomerular damage
in the ME and HE groups were notably reduced, where the number of
glomerular cells were also reduced without evident glomerular
hypertrophy (Fig. 3).
Discussion
In the present study, T2DM rat model was established
by adopting high fat diet in combination with STZ injection, which
exhibits similar pathophysiology to that of T2DM caused by obesity
in humans (20).
This method confers many advantages, including short
experiment duration, ease of establishment, low cost and relative
reliability, rendering it to be one of the most commonly applied
methods for modeling T2DM (21,22).
Using this method, insulin resistance was induced in animals by
feeding them with high fat diet, followed by injection with low
doses of STZ, which enters the β cells in the pancreas via the
GLUT2 transporters (23).
In the β cells, STZ is hydrolyzed into glucose and
methyl nitrosourea, with the latter causing DNA break and
cytotoxicity (24,25).
Subsequent β cell damage leads to the failure of
insulin synthesis and release by the pancreas, which in return
causes increases in blood sugar levels. The characteristics of this
model were insulin resistance but normal plasma insulin levels,
middle to high level blood sugar levels and high blood lipid levels
(21,22).
The precise pathogenesis of DN remain unclear.
However, it has been reported that hyperglycemia promotes renal
inflammation, oxidative stress and renal fibrosis, all of which
serve important roles in the development of this condition
(26,27).
Although no difference in the FBG levels was
observed among the all groups at 8 weeks, FBG levels were
significantly lower in the ME and HE groups compared with those in
the LE and DM groups 1 week after STZ injection. This suggests that
moderate to high-intensity endurance exercise helps to suppress the
elevation of blood sugar levels induced by DM. This observation was
also in line with glycosylated serum protein levels which was
measured in the present study. GSP level is a good indicator to
reflect the average level of blood glucose in the prior 1-2 weeks
(28). In the present experiment,
due to STZ injection in the last week, in order to better evaluate
the change of blood glucose, GSP was used for auxiliary
evaluation.
Patients with impaired glucose tolerance patient
frequently exhibit periphery insulin resistance, impaired glucose
metabolism in the muscle and adipose tissues, coupled with
deficiency in insulin secretion (29,30).
In the present study, it was demonstrated that
exercise intervention during the model construction phase can
reduce the severity of impaired glucose tolerance. The
AUCFBG values in theME and HE groups were significantly
lower compared with those in the DM group. Furthermore, compared
with that in the LE group, the lower AUCFBG values in
the ME and HE groups indicates that middle and high intensity
endurance exercises are more efficient at improving glucose
metabolism by peripheral tissues. Therefore, moderate-intensity
exercise during the pre-diabetes period can potentially prevent
impairments in sugar metabolism.
T2DM is a chronic inflammatory condition caused by
adipose cell dysfunction induced by obesity (31). Adipose cells can produce excessive
amounts of inflammatory cytokines, including TNF-α and
IL-6(32). This chronic
inflammatory state further promotes insulin resistance (33,34).
Patients with DN typically display significantly elevated serum and
urine levels of inflammatory cytokines, which has been previously
demonstrated to correlate with the progression of DN (35,36).
Belotto et al (37) reported
that 3 weeks of exercise can reduce the level of serum TNF-α, IL-6
in rats with DM, where middle-intensity exercise exerted notable
anti-inflammatory effects in rats with DM rats. In the present
study, all three exercise regimens were demonstrated to reduce
TNF-α and IL-6 cytokine levels in the serum by different degrees
(compared to that in the DM group, TNF-α in the ME and HE groups
was decreased and IL-6 in the LE and ME groups was decreased), with
effects mediated by moderate-intensity exercise being superior
compared with those by low and high-intensity exercises. This
finding was consistent with that reported by Belotto et al
(37).
The mechanism of DN pathogenesis include hemodynamic
changes in the kidney induced by hyperglycemia, non-enzymatic
protein glycosylation, and the aberrant sorbitol metabolism of
cellular glucose (38).
All of those aforementioned can result in the
elevation and activation of IL-6, and TNF-α causing lesions in the
kidney tubules and increases in extracellular matrix deposition in
the glomerular mesangial matrix (39). Fakhruddin S, Alanazi W and Jackson
KE: Diabetes-induced reactive oxygen species: Mechanism of their
generation and role in renal injury. Journal of diabetes research
2017: 2017. Diabetic damage to the kidney is progressive, with its
early histological manifestation characterized by glomerular
hypertrophy, followed by the increases in GBM thickness, excessive
accumulation of collagen type IV, sedimentation of mesangial matrix
and increases in the excretion ratio of urinary proteins, which
finally results in glomerulosclerosis and renal failure (39,40).
TGF-β1 can stimulate the expression of monocyte
chemoattractant protein-1 in mesangial cells (35), which is known to be an important
mediator in ECM and collagen deposition and fibrosis formation
during DN (41). Kuusniemi et
al (41) hypothesized that
renal tubular epithelial cells can directly promote fibrosis by ECM
protein generation. The accumulation of ECM proteins was found to
be the result of increases in synthesis, reductions in degradation
or the combination of both. Under physiological conditions,
synthesis and degradation of the ECM is maintained in a dynamic
balance (42). MMPs and TIMPs are
the main mediators of ECM degradation (43). In particular, MMP-9 is an important
member of the MMPs family that is able to degrade multiple types of
ECM proteins, such as type IV collagen and endothelial junctional
protein (44,45).
Type IV collagen mainly exists in the kidney basal
membrane, where its catabolism is generally slow unless specific
degradative enzymes are activated (46). The combination of MMP-9 and TIMP-1
activities can keep the degradation and resynthesis of type IV
collagen in balance (44). In the
present study, the expression levels of MMP-9 and TIMP-1 in the
kidney did not vary among the five experimental groups, suggesting
that during the early stages of T2DM, ECM synthesis and degradation
in the rat kidney tissue was still maintained in a dynamic balance,
where this balance between MMP-9 and TIMP-1 was not disturbed. This
was also supported by the comparable expression levels of kidney
TGF-β1 expression among these groups. Therefore, it is reasonable
to suggest that at the onset of diabetes, overexpression of MMP-9
and TGF-β1 may not be evident even though sugar levelswere
disturbed.
In the present study, evident pathological changes
were observed in the kidneys of rats in the DM group, which were
prevented by endurance exercises. In addition, the present study
also measured the glomerular diameter to evaluate the degree of
glomerular hypertrophy. There was an increase in glomerular
diameter and glomerular hypertrophy during the early stages of
T2DM, which could be prevented by endurance exercise of moderate
and high intensities.
Eddy (47)
previously divided the pathological process of renal
tubulointerstitial fibrosis into four stages. The first of which is
cell activation and damage stage, where the peritubular capillary
endothelium can promote the migration of monocytes to the renal
interstitium where they would mature to become macrophages. At this
stage, myofibroblasts and activated fibroblasts would start filling
the interstitium., where soluble products, including fibronectin
and alarmins, released from these cells would cause persistent
inflammation (47). The levels of
inflammatory cytokines TNF-α and IL-6 were not found to be altered
in the DM group compared to that in the NC group in the present
study. This suggests that the renal fibrosis process did not begin
one week after the end of modeling.
The second stage of fibrosis is known as the
fibrotic signaling stage (47). At
this stage, a variety of growth factors and cytokines are involved,
where factors, such as TGF-β serve a pivotal role. Excessive
secretion of TGF-β1 has been widely reported to be one of the major
molecular events of fibrotic diseases (27). Other factors, including blood TNFs
and ILs, may also be involved (26). In the third stage, matrix protein
synthesis is increased where matrix transformation becomes
impaired, in manner that is caused by increases in the expression
of factors such as TIMPs. In the present study, expression levels
of neither TGF-β1 nor MMPs in DM group exhibited significant
difference among the five groups. The fourth stage is known as the
kidney damage stage (47), which
constitutes as the ultimate consequence of excessive matrix
accumulation.
All of the effects aforementioned suggest further
that renal tubule interstitial fibrosis may not occur during the
early stages of diabetes. Although rats in the DM groups showed no
differences in the inflammatory cytokine levels, endurance
exercises of varying intensities reduced the inflammatory cytokine
levels in the body to various degrees. Although a number of studies
previously found that exercise can reduce inflammatory cytokine
levels (48,49), few have reported the effects of
exercise intervention during the process of T2DM induction. The
results of the present study suggest that exercise may inhibit
renal fibrosis by reducing the inflammation level in the body,
thereby protecting the renal structure from further damage.
However, a limitation of the present study was that all experiments
were terminated 1 week after STZ injection, at which time the rats
could still be at the early stages of T2DM, such that the extent of
kidney damage may not have been significant, since most indicators
did not show differences.
In conclusion, at the onset of T2DM, whilst the
levels of inflammatory cytokines were not significantly increased,
disrupted renal structures and the compensatory glomerulus
hypertrophy were observed. Exercise intervention could reduce the
inflammation levels and inhibit renal fibrosis by improving glucose
metabolism, which served to preserve renal structure and
function.
Acknowledgements
Not applicable.
Funding
Funding: No funding was received.
Availability of data and materials
The datasets used and/or analyzed during the current
study are available from the corresponding author on reasonable
request.
Authors' contributions
SL performed animal experiments and
immunohistochemical staining. SJ and MZ performed molecular biology
experiments. FZ analyzed the data. YH designed the present study
and prepared the manuscript. SL and MZ revised the manuscript. All
authors read and approved the final manuscript.
Ethics approval and consent to
participate
All of the animal procedures were approved by the
Animal Care and Use Committee at Central China Normal University
(Wuhan, China).
Patient consent for publication
Not applicable.
Competing interests
The authors declare that they have no competing
interests.
References
|
1
|
Green A, Christian Hirsch N and Pramming
SK: The changing world demography of type 2 diabetes. Diabetes
Metab Res Rev. 19:3–7. 2003.PubMed/NCBI View
Article : Google Scholar
|
|
2
|
Zimmet P: Globalization, coca-colonization
and the chronic disease epidemic: Can the Doomsday scenario be
averted? J Intern Med. 247:301–310. 2000.PubMed/NCBI View Article : Google Scholar
|
|
3
|
Zimmet P, Alberti KG and Shaw J: Global
and societal implications of the diabetes epidemic. Nature.
414:782–787. 2001.PubMed/NCBI View
Article : Google Scholar
|
|
4
|
Rask-Madsen C and King GL: Vascular
complications of diabetes: Mechanisms of injury and protective
factors. Cell Metab. 17:20–33. 2013.PubMed/NCBI View Article : Google Scholar
|
|
5
|
Piccoli GB, Grassi G, Cabiddu G, Nazha M,
Roggero S, Capizzi I, De Pascale A, Priola AM, Di Vico C, Maxia S,
et al: Diabetic kidney disease: A syndrome rather than a single
disease. Rev Diabet Stud. 12:87–109. 2015.PubMed/NCBI View Article : Google Scholar
|
|
6
|
Jha JC, Banal C, Chow BS, Cooper ME and
Jandeleit-Dahm K: Diabetes and kidney disease: Role of oxidative
stress. Antioxid Redox Signal. 25:657–684. 2016.PubMed/NCBI View Article : Google Scholar
|
|
7
|
Huang K, Chen C, Hao J, Huang J, Wang S,
Liu P and Huang H: Polydatin promotes Nrf2-ARE anti-oxidative
pathway through activating Sirt1 to resist AGEs-induced
upregulation of fibronetin and transforming growth factor-β1 in rat
glomerular messangial cells. Mol Cell Endocrinol. 399:178–189.
2015.PubMed/NCBI View Article : Google Scholar
|
|
8
|
Hu C, Sun L, Xiao L, Han Y, Fu X, Xiong X,
Xu X, Liu Y, Yang S, Liu F and Kanwar YS: Insights into the
mechanisms involved in the expression and regulation of
extracellular matrix proteins in diabetic nephropathy. Curr Med
Chem. 22:2858–2870. 2015.PubMed/NCBI View Article : Google Scholar
|
|
9
|
Duran-Salgado MB and Rubio-Guerra AF:
Diabetic nephropathy and inflammation. World J Diabetes. 5:393–398.
2014.PubMed/NCBI View Article : Google Scholar
|
|
10
|
Yeo ES, Hwang JY, Park JE, Choi YJ, Huh KB
and Kim WY: Tumor necrosis factor (TNF-alpha) and C-reactive
protein (CRP) are positively associated with the risk of chronic
kidney disease in patients with type 2 diabetes. Yonsei Med J.
51:519–525. 2010.PubMed/NCBI View Article : Google Scholar
|
|
11
|
Campion CG, Sanchez-Ferras O and Batchu
SN: Potential role of serum and urinary biomarkers in diagnosis and
prognosis of diabetic nephropathy. Can J Kidney Health Dis.
4(2054358117705371)2017.PubMed/NCBI View Article : Google Scholar
|
|
12
|
Dalla Vestra M, Mussap M, Gallina P,
Bruseghin M, Cernigoi AM, Saller A, Plebani M and Fioretto P:
Acute-phase markers of inflammation and glomerular structure in
patients with type 2 diabetes. J Am Soc Nephrol. 16 (Suppl
1):S78–S82. 2005.PubMed/NCBI View Article : Google Scholar
|
|
13
|
Moon JY, Jeong KH, Lee TW, Ihm CG, Lim SJ
and Lee SH: Aberrant recruitment and activation of T cells in
diabetic nephropathy. Am J Nephrol. 35:164–174. 2012.PubMed/NCBI View Article : Google Scholar
|
|
14
|
Sigal RJ, Kenny GP, Wasserman DH and
Castaneda-Sceppa C: Physical activity/exercise and type 2 diabetes.
Diabetes Care. 27:2518–2539. 2004.PubMed/NCBI View Article : Google Scholar
|
|
15
|
Bedford TG, Tipton CM, Wilson NC, Oppliger
RA and Gisolfi CV: Maximum oxygen consumption of rats and its
changes with various experimental procedures. J Appl Physiol Respir
Environ Exerc Physiol. 47:1278–1283. 1979.PubMed/NCBI View Article : Google Scholar
|
|
16
|
Guo XX, Wang Y, Wang K, Ji BP and Zhou F:
Stability of a type 2 diabetes rat model induced by high-fat diet
feeding with low-dose streptozotocin injection. J Zhejiang Univ Sci
B. 19:559–569. 2018.PubMed/NCBI View Article : Google Scholar
|
|
17
|
Stančáková A, Kuulasmaa T, Paananen J,
Jackson AU, Bonnycastle LL, Collins FS, Boehnke M, Kuusisto J and
Laakso M: Association of 18 confirmed susceptibility loci for type
2 diabetes with indices of insulin release, proinsulin conversion,
and insulin sensitivity in 5,327 nondiabetic Finnish men. Diabetes.
58:2129–2136. 2009.PubMed/NCBI View Article : Google Scholar
|
|
18
|
Cantrell Stanford J, Morris AJ, Sunkara M,
Popa GJ, Larson KL and Özcan S: Sphingosine 1-phosphate (S1P)
regulates glucose-stimulated insulin secretion in pancreatic beta
cells. J Biol Chem. 287:13457–13464. 2012.PubMed/NCBI View Article : Google Scholar
|
|
19
|
Cheng H, Dong HR, Lin RQ, Sun LJ and Chen
YP: Determination of normal value of glomerular size in Chinese
adults by different measurement methods. Nephrology (Carlton).
17:488–492. 2012.PubMed/NCBI View Article : Google Scholar
|
|
20
|
Nath S, Ghosh SK and Choudhury Y: A murine
model of type 2 diabetes mellitus developed using a combination of
high fat diet and multiple low doses of streptozotocin treatment
mimics the metabolic characteristics of type 2 diabetes mellitus in
humans. J Pharmacol Toxicol Methods. 84:20–30. 2017.PubMed/NCBI View Article : Google Scholar
|
|
21
|
Chatzigeorgiou A, Halapas A, Kalafatakis K
and Kamper E: The use of animal models in the study of diabetes
mellitus. In Vivo. 23:245–258. 2009.PubMed/NCBI
|
|
22
|
Eleazu CO, Eleazu KC, Chukwuma S and
Essien UN: Review of the mechanism of cell death resulting from
streptozotocin challenge in experimental animals, its practical use
and potential risk to humans. J Diabetes Metab Disord.
12(60)2013.PubMed/NCBI View Article : Google Scholar
|
|
23
|
Elsner M, Guldbakke B, Tiedge M, Munday R
and Lenzen S: Relative importance of transport and alkylation for
pancreatic beta-cell toxicity of streptozotocin. Diabetologia.
43:1528–1533. 2000.PubMed/NCBI View Article : Google Scholar
|
|
24
|
Mohamed AH, Abd El-Hameed MN, Khamis HH,
Sharkawy GK and Samir AE: Antidiabetic and anti-inflammatory
effects of two Fabaceae extracts against streptozotocin induced
diabetic impairment in male rats. World J Adv Res Rev. 6:12–29.
2020.
|
|
25
|
Bennett RA and Pegg AE: Alkylation of DNA
in rat tissues following administration of streptozotocin. Cancer
Res. 41:2786–2790. 1981.PubMed/NCBI
|
|
26
|
Turkmen K: Inflammation, oxidative stress,
apoptosis, and autophagy in diabetes mellitus and diabetic kidney
disease: The four Horsemen of the apocalypse. Int Urol Nephrol.
49:837–844. 2017.PubMed/NCBI View Article : Google Scholar
|
|
27
|
Sharma K: Obesity, oxidative stress, and
fibrosis in chronic kidney disease. Kidney Int Suppl (2011).
4:113–117. 2014.PubMed/NCBI View Article : Google Scholar
|
|
28
|
Goldstein DE, Little RR, Lorenz RA, Malone
JI, Nathan D, Peterson CM and Sacks DB: Tests of glycemia in
diabetes. Diabetes Care. 27:1761–1773. 2004.PubMed/NCBI View Article : Google Scholar
|
|
29
|
DeFronzo RA and Tripathy D: Skeletal
muscle insulin resistance is the primary defect in type 2 diabetes.
Diabetes Care. 32 (Suppl 2):S157–S163. 2009.PubMed/NCBI View Article : Google Scholar
|
|
30
|
Muoio DM and Newgard CB: Mechanisms in
disease: Molecular and metabolic mechanisms of insulin resistance
and beta-cell failure in type 2 diabetes. Nat Rev Mol Cell Biol.
9:193–205. 2008.PubMed/NCBI View
Article : Google Scholar
|
|
31
|
Donath MY and Shoelson SE: Type 2 diabetes
as an inflammatory disease. Nat Rev Immunol. 11:98–107.
2011.PubMed/NCBI View
Article : Google Scholar
|
|
32
|
Zinman B, Hanley AJ, Harris SB, Kwan J and
Fantus IG: Circulating tumor necrosis factor-α concentrations in a
native Canadian population with high rates of type 2 diabetes
mellitus. J Clin Endocrinol Metab. 84:272–278. 1999.PubMed/NCBI View Article : Google Scholar
|
|
33
|
Pradhan AD, Manson JE, Rifai N, Buring JE
and Ridker PM: C-reactive protein, interleukin 6, and risk of
developing type 2 diabetes mellitus. JAMA. 286:327–334.
2001.PubMed/NCBI View Article : Google Scholar
|
|
34
|
Abrahamian H, Endler G, Exner M, Mauler H,
Raith M, Endler L, Rumpold H, Gerdov M, Mannhalter C, Prager R, et
al: Association of low-grade inflammation with nephropathy in type
2 diabetic patients: Role of elevated CRP-levels and 2 different
gene-polymorphisms of proinflammatory cytokines. Exp Clin
Endocrinol Diabetes. 115:38–41. 2007.PubMed/NCBI View Article : Google Scholar
|
|
35
|
Soetikno V, Sari FR, Veeraveedu PT,
Thandavarayan RA, Harima M, Sukumaran V, Lakshmanan AP, Suzuki K,
Kawachi H and Watanabe K: Curcumin ameliorates macrophage
infiltration by inhibiting NF-κB activation and proinflammatory
cytokines in streptozotocin induced-diabetic nephropathy. Nutr
Metab (Lond). 8(35)2011.PubMed/NCBI View Article : Google Scholar
|
|
36
|
Wolkow PP, Niewczas MA, Perkins B,
Ficociello LH, Lipinski B, Warram JH and Krolewski AS: Association
of urinary inflammatory markers and renal decline in
microalbuminuric type 1 diabetics. J Am Soc Nephrol. 19:789–797.
2008.PubMed/NCBI View Article : Google Scholar
|
|
37
|
Belotto MF, Magdalon J, Rodrigues HG,
Vinolo MA, Curi R, Pithon-Curi TC and Hatanaka E: Moderate exercise
improves leucocyte function and decreases inflammation in diabetes.
Clin Exp Immunol. 162:237–243. 2010.PubMed/NCBI View Article : Google Scholar
|
|
38
|
Kumar Pasupulati A, Chitra PS and Reddy
GB: Advanced glycation end products mediated cellular and molecular
events in the pathology of diabetic nephropathy. Biomol Concepts.
7:293–309. 2016.PubMed/NCBI View Article : Google Scholar
|
|
39
|
Fakhruddin S, Alanazi W and Jackson KE:
Diabetes-induced reactive oxygen species: Mechanism of their
generation and role in renal injury. J Diabetes Res.
2017(8379327)2017.PubMed/NCBI View Article : Google Scholar
|
|
40
|
Diez-Marques L, Ortega-Velazquez R, Langa
C, Rodriguez-Barbero A, Lopez-Novoa JM, Lamas S and Bernabeu C:
Expression of endoglin in human mesangial cells: Modulation of
extracellular matrix synthesis. Biochim Biophys Acta. 1587:36–44.
2002.PubMed/NCBI View Article : Google Scholar
|
|
41
|
Kuusniemi AM, Lapatto R, Holmberg C,
Karikoski R, Rapola J and Jalanko H: Kidneys with heavy proteinuria
show fibrosis, inflammation, and oxidative stress, but no tubular
phenotypic change. Kidney Int. 68:121–132. 2005.PubMed/NCBI View Article : Google Scholar
|
|
42
|
Lu P, Takai K, Weaver VM and Werb Z:
Extracellular matrix degradation and remodeling in development and
disease. Cold Spring Harb Perspect Biol. 3(a005058)2011.PubMed/NCBI View Article : Google Scholar
|
|
43
|
Tan RJ and Liu Y: Matrix
metalloproteinases in kidney homeostasis and diseases. Am J Physiol
Renal Physiol. 302:F1351–F1361. 2012.PubMed/NCBI View Article : Google Scholar
|
|
44
|
Catania JM, Chen G and Parrish AR: Role of
matrix metalloproteinases in renal pathophysiologies. Am J Physiol
Renal Physiol. 292:F905–F911. 2007.PubMed/NCBI View Article : Google Scholar
|
|
45
|
Song L, Ge S and Pachter JS: Caveolin-1
regulates expression of junction-associated proteins in brain
microvascular endothelial cells. Blood. 109:1515–1523.
2007.PubMed/NCBI View Article : Google Scholar
|
|
46
|
Mariappan MM: Signaling mechanisms in the
regulation of renal matrix metabolism in diabetes. Exp Diabetes
Res. 2012(749812)2012.PubMed/NCBI View Article : Google Scholar
|
|
47
|
Eddy AA: Molecular basis of renal
fibrosis. Pediatr Nephrol. 15:290–301. 2000.PubMed/NCBI View Article : Google Scholar
|
|
48
|
Abd El-Kader SM: Aerobic versus resistance
exercise training in modulation of insulin resistance,
adipocytokines and inflammatory cytokine levels in obese type 2
diabetic patients. J Adv Res. 2:179–183. 2011.
|
|
49
|
Stewart LK, Flynn MG, Campbell WW, Craig
BA, Robinson JP, Timmerman KL, McFarlin BK, Coen PM and Talbert E:
The influence of exercise training on inflammatory cytokines and
C-reactive protein. Med Sci Sports Exerc. 39:1714–1719.
2007.PubMed/NCBI View Article : Google Scholar
|