Introduction
Preeclampsia is a pregnancy disorder in which
hypertension coupled with proteinuria or other symptoms of organ
damage are present after the 20th week of gestation (1). Increased morbidity and mortality in
pregnant women occur due to the damage caused to the body systems,
such as the circulatory, urinary and digestive systems (1); however, the only effective way to
treat this condition is to detach the placenta. During pregnancy,
various factors as sFlt-1 and sEng are released from the placenta
into the mother's bloodstream that trigger spasms of systemic small
vessels, ischemia of organs and ultimately can lead to systemic
damage (1).
As a main component of the human placenta,
trophoblast cells play an irreplaceable role in healthy
pregnancies. The trophoblasts are located on the surface of the
blastocyst. During adhesion of the late blastocyst to the
endometrium, trophoblast cells begin to differentiate and invade
the endometrium, the 1/3 of the uterine muscle layer and the
vascular system, which ensures a sufficient blood supply to the
placenta, maintaining normal embryo development (1,2).
Previous studies have revealed that an invasive insufficiency of
trophoblast cells can lead to the occurrence of preeclampsia
(3,4). Moreover, it has been shown that
hypoxia can lead to an insufficiency in invasion in the trophoblast
cells (1).
Previous pathological investigations of preeclampsia
have indicated that trophoblast cells that are immersed in a
hypoxic environment have a reduced invasive capacity (1). Coupling factor 6 (CF6), also known as
ATP5J, is a component of ATP synthase, an energy converter that is
further composed of two subunits, namely F0 and F1(2). As a component of F0, CF6 is released
into the extracellular fluid as a circulating peptide and is also
located on the membrane of various cells, such as endothelial cells
in blood vessels (2,5). Following binding to specific ligands,
CF6 interrupts the vascular homeostasis through the activation of
downstream signaling factors (5).
After comparing normal pregnant women and normal non-pregnant women
of childbearing age, a previous study demonstrated that the levels
of CF6 were increased (1.5-3-fold) in the peripheral blood of the
pregnant women with preeclampsia compared with those exhibiting
normal pregnancies, with this result being particularly evident in
patients with early-onset preeclampsia and severe preeclampsia
(6). Therefore, it was hypothesized
that a percentage of the CF6 levels detected in the peripheral
blood circulation are secreted from the placenta. Previously, a
search was performed for associated data in The Human Protein Atlas
(http://www.proteinatlas.org/). The data
demonstrated that CF6 is expressed in normal placental villous and
extravillous trophoblast cells, although no information was present
regarding its expression in abnormal cells, such as those noted in
the preeclamptic placenta (7).
The present study aimed to determine the potential
differences in CF6 expression between the normal and the
preeclamptic placenta through the detection of CF6 protein using
placental tissue microarrays (TMAs). The present findings indicated
the clinical relevance of CF6 alterations in preeclampsia and may
further expand existing knowledge concerning the biological
functions of CF6.
Materials and methods
TMA materials
The placental TMAs, including placental villous
cytotrophoblast (VCT) microarrays and extravillous cytotrophoblast
(EVCT) microarrays, were previously successfully constructed and
validated by our research group (8). The placental tissues collected for
constructing TMAs were obtained from pregnant women (age range,
23-36-years old) recruited at the Third Affiliated Hospital of the
Zhengzhou University (Zhengzhou, China) and Henan Provincial
People's Hospital (Zhengzhou, China), from December 2007 to
December 2010(8). The employed
diagnostic criteria of severe preeclamptic patients were defined
based on the ‘diagnosis and management of preeclampsia and
eclampsia’ guidelines (9). All of
the pregnant women selected for the placental TMAs in the present
study had singleton pregnancies, without chronic hypertension,
diabetes, heart disease, liver disease or kidney disease.
Deliveries were performed by cesarean section due to the scarred
uterus, contracted pelvis, macrosomic infants or additional social
reasons. The sample collection was approved by The Ethics Committee
of Henan Provincial People's Hospital and The Ethics Committee of
The Third Affiliated Hospital of the Zhengzhou University. The
patients agreed to the use of their samples and each patient signed
an informed consent form.
Immunohistochemistry of the placenta
samples
Immunohistochemical staining. Immunohistochemistry
was performed to assess the localization and expression of CF6
protein in placental TMA samples. The TMA samples were fixed with
1.4% paraformaldehyde and 0.1 mol/l phosphoric acid buffer (pH 7.3)
at 37˚C for 24 h. The thickness of a TMA slide was 4-µm (8). In brief, TMA slides were
deparaffinized three times with xylene for 5 min each, and then
dehydrated using 100, 90, 80 and 70% alcohol at room temperature.
Antigens were retrieved by boiling TMA slides in 0.01 M sodium
citrate solution (Boster Biological Technology). The slides were
then allowed to cool and treated with 3% H2O2
for 10 min at room temperature to quench endogenous peroxidase
activity. To reduce the non-specific background staining, the
sections were blocked with fetal bovine serum albumin (cat. no.
SA1052; Wuhan Boster Biological Technology, Ltd.) for 30 min at
room temperature. Subsequently, the slides were probed with a
rabbit anti-human CF6 polyclonal antibody (1:250; cat. no.
ab224139; Abcam) in a humidified chamber at 4˚C overnight.
Following thorough washing in PBS, the staining was detected using
an anti-rabbit immunohistochemistry kit (cat. no. SA1052; Wuhan
Boster Biological Technology, Ltd.) and visualized using a DAB kit
(Boster Biological Technology), both used according to the
manufacturer's instructions. Finally, the slides were
counterstained with hematoxylin (Boster Biological Technology).
Evaluation of staining
All images were obtained using an Olympus IX-71
inversion fluorescence microscope (Olympus Corporation) equipped
with a DP-71 Digital Camera (Olympus Corporation). The images for
analysis were captured using a digital camera using ImagePro 6.0
software (Media Cybernetics, Inc). The results were graded on a
semiquantitative scale as follows: 0 (Negative), 1 (yellow), 2
(brown-yellow) and 3 (brown). The percentage of relevant positive
cells was graded using the following scale: 0 (<5%), 1 (5-25%),
2 (26-50%), 3 (51-75%) and 4 (76-100%). The sum of the product of
the two scores was regarded as the final score, which were graded
by a four-point scale: 0 (Negative, -), <4 (weak staining, +),
4-8 (moderate staining, ++) and >8 (intense staining, +++). The
maximum score used was 12. For each block, 3 high-power fields
(magnification, x400) were examined. The score was calculated by
combining the staining intensity and the percentage of positive
cells. The staining intensity was evaluated by two independent
pathologists.
Cell culture and grouping
JAR and JEG-3 trophoblast cell lines were purchased
from the American Type Culture Collection (ATCC) and were
maintained in complete medium containing 90% RPMI-1640 (without
FBS; cat. no. 21870076; Gibco; Thermo Fisher Scientific, Inc.), 10%
FBS (cat. no. 11011-6123; Hangzhou Sijiqing Biological Engineering
Materials Co., Ltd.), 100 U/ml of penicillin and 100 U/ml of
streptomycin (cat. no. 15140-122; Gibco; Thermo Fisher Scientific,
Inc) at 37˚C in a humidified atmosphere with 5% CO2.
Following analysis of the growth curves of the two cell lines,
cells in the exponential phase were seeded into a 6-well cell
culture plate containing 2 ml of complete medium at a density of
1.5x10⁶ cells/well overnight until 60-70% confluence was
reached. The following morning, the cells were divided into three
groups: Control, hypoxia and CF6 stimulation group.
The hypoxic cellular model was established by adding
a solution of CoCl2 to the cell culture medium as
previously described (9). The final
concentration of CoCl2 used was 200 µM and the cells
were incubated for an additional 24 h. The hypoxic cellular model
was deemed successful by detecting the protein expression levels of
hypoxia-inducible factor 1α (HIF-1α) of the cells using western
blotting.
The CF6 stimulation group contained cells incubated
in the complete medium that were mixed with exogenous human
recombinant CF6 protein (Abcam) for 24 h. The final concentration
of CF6 was 0.1 µM, based on previous studies (10,11).
Subsequently, the cell culture medium was prepared and total RNA
and protein levels from the cells were obtained for further
use.
Enzyme-linked immunosorbent assay
(ELISA)
ELISA was performed to examine the cell medium
concentration of CF6 in the hypoxia and control groups using the
Human coupling factor 6 (CF6) kit (cat. no. CSB-E13880h; CUSABIO
Technology LLC) according to the manufacturer's instructions. The
optical density (OD) value was measured at 450 nm within 5 min
following termination of the reaction using a Microplate Reader-K3
(Thermo Fisher Scientific, Inc.). The concentration of CF6 was
calculated based on the resultant standard curve. The measurement
range was 3.12-200 ng/ml.
Reverse transcription-quantitative PCR
(RT-qPCR)
RT-qPCR was performed to determine the
transcriptional level of CF6 mRNA in the trophoblast cells in the
hypoxia group and MMP mRNA expression in the CF6 stimulation group.
The cells in the various groups were washed with PBS gently and
collected. The total RNA was extracted from the placental tissues
using the Trigol reagent (cat. no. NEP019-1; Beijing Dingguo
Changsheng Biotechnology Co., Ltd.) according to the manufacturer's
recommendations. Total RNA was then quantified using an ultraviolet
spectrophotometer at 260 nm. The RNA integrity was evaluated by
agarose gel electrophoresis in order to determine the ratio of
28S/18S rRNA in each sample. A total of 1 µg RNA from each sample
was reverse-transcribed into cDNA using a ReverTra Ace qPCR RT kit
(Toyobo Life Science) at 95˚C and qPCR analysis of CF6 was
performed using Realtime PCR Master Mix (Toyobo Life Science). The
human β-actin gene was used as an internal control for
normalization of the mRNA amount. The sequences of the primers were
as follows: CF6 forward, 5'-GCGACAGACATCTGGAGGAC-3' and reverse,
5'-GCCTGGGGTTTTTCGATGAC-3'; MMP-2 forward,
5'-ACCAGATCACATACAGGATC-3' and reverse, 5'-CTCTCCATCATGGATTCGAG-3';
MMP-9 forward, 5'-AGATGCGTGGAGAGTCGAAATC-3' and reverse, 5'
GGTTCGCATGGCCTTCAGT-3'; and β-actin forward,
5'-CAGCAAGTGGGAAGGTGTAATCC-3' and reverse,
5'-CCCATTCTATCATCAACGGGTACAA-3'. All primers were designed and
synthesized by Sangon Biotech Co., Ltd. RT-qPCR was performed in a
final volume of 20 µl and the samples were run in triplicate. As a
negative control for all reactions, preparations lacking RNA were
used in the place of cDNA. The reference gene was β-actin. PCR
amplification was conducted via the following steps: Initial
denaturation at 95˚C for 1 min, followed by 40 cycles at 95˚C for
15 sec and 60˚C for 1 min. The comparative method 2-ΔΔCq
was used for the relative quantification of CF6 and MMP
transcription in the various treatment groups (12).
Western blot analysis
Western blotting was performed to determine the
protein expression levels of CF6, MMP enzymes and HIF-1α in the
various treatment groups. The cells were directly homogenized on
ice using RIPA buffer containing a protease inhibitor cocktail
(Beijing Solarbio Science & Technology Co., Ltd.). The total
protein concentration was determined using BCA assays (Beijing
Solarbio Science & Technology Co., Ltd.). Following
quantification, each of the samples, containing 80 µg of protein,
was separated via 15% SDS-PAGE and subsequently electrophoretically
transferred to nitrocellulose membranes. Following blocking with 5%
nonfat milk in 0.05% TBS-Tween-20 (TBST) at room temperature for 1
h, the membranes were subsequently incubated with primary
antibodies at 4˚C overnight. The following antibodies were used:
β-actin (1:4,000; cat. no. ab6302; Abcam;), CF6 (1:500; cat. no.
ab224139, Abcam), MMP-2 (1:1,000; cat. no. ab92536; Abcam), MMP-9
(1:1,000; cat. no. ab76003; Abcam) and HIF-1α (1:500; cat. no.
BA0912-2, Wuhan Boster Biological Technology, Ltd.). The following
day, the membranes were incubated with the horseradish
peroxidase-conjugated goat anti-mouse immunoglobulin (1:5,000; cat.
no. 926-32210) and goat anti-rabbit immunoglobulin (1:5,000; cat.
no. 926-68021) (both LI-COR Biosciences) as the secondary
antibodies for 2 h at room temperature in the dark. The membranes
were washed with TBST, scanned and the protein bands were observed
using an Odyssey infrared scanner (LI-COR Biosciences). The
relative density of the proteins of interest was used for the
relative quantification of expression.
MTT assay
An MTT assay was performed to determine the cell
viability in the CF6 stimulation group. Following digestion of the
cells with trypsin, the cells in the logarithmic phase were
resuspended with complete culture medium and were seeded in 96-well
plates. The cell concentration was adjusted to
2.5x10³/ml before cell adherence. The medium in the
wells of the experimental group was changed to complete medium and
0.1 µM CF6 was added. The cells were then incubated in a cell
incubator for observation for 6, 12, 18 and 24 h. Furthermore, 50
µl MTT solution (5 mg/ml; Beijing Dingguo Changsheng Biotechnology
Co., Ltd.) was added into each well. The medium was removed
following 4 h of incubation and 200 µl DMSO was added into each
well to terminate the reaction. Finally, the OD value of each well
was measured at 570 nm and the curve indicated the cell
proliferation at the 24-h time point.
Transwell assay
A Transwell assay was performed to analyze the cell
invasive ability under stimulation by exogenous CF6 according to
the instructions of the manufacturer (Corning, Inc.). Briefly,
Matrigel™ was diluted with cell culture medium (without FBS) at a
ratio of 1:10 on the surface of the membrane in the upper chamber
and incubated for 4-6 h in 37˚C. The Matrigel was solidified, and
the cells (2.5x10⁵/ml) were trypsinized and resuspended
with basic medium (without FBS), mixed with 0.1 µM CF6 and seeded
into the upper chamber of the 24-well plate. The lower chamber was
filled with complete medium (750 µl/well), ensuring that the bottom
surface of the membrane was in contact with the medium. Following
incubation for 24 h, the cells were fixed (3.7% formaldehyde
solution; room temperature; 2 min), permeabilized (100% methanol;
room temperature; 15 min) and stained (Giemsa dye; room
temperature; 15 min). The cells remaining in the upper chamber were
carefully removed using a cotton swab, whereas the attached cells
on the side of the membrane facing the lower chamber were counted
under a light microscope (x400). At total of five fields were
randomly counted in each chamber. The experiment was repeated three
times.
Statistical analysis
Statistical analysis was conducted using SPSS 21.0
software (IBM Corp.). The normally distributed data were presented
as the mean ± SD, whereas the data that was not normally
distributed were presented as the median and interquartile range [M
(P25-P75)]. Comparisons between the two
groups were performed using the following tests: Unpaired Student's
t-test, Mann-Whitney U test, Kruskal-Wallis or one-way ANOVA tests.
Bonferroni tests were used as the post hoc tests for multiple
comparisons. P<0.05 was considered to indicate a statistically
significant difference.
Results
Clinical characteristics of the
pregnant women in the preeclampsia and normal control groups
To analyze the differences between the preeclampsia
and normal control groups of pregnant women from whom placental
tissues were collected and delivered, the present study analyzed
the clinical characteristics of the pregnant women in both TMA
groups. As seen in Table I, in
placental VCT tissue microarray, the age of pregnant women in the
PE group was 30.30±5.67-years-old, and that in the control group
was 28.43±3.90-years-old, with no statistically significant
difference. The gestational weeks were 33.92±3.12 and 39.02±1.38
weeks, respectively, with statistically significant difference. In
placental EVCT tissue microarray, the age of pregnant women in PE
group was 29.68±5.58-years-old, and that in the control group was
28.87±3.71-years-old, with no statistically significant difference.
The gestational weeks were 33.92±3.31 and 38.97±1.19 weeks,
respectively, with statistically significant difference.
 | Table IClinical characteristics of the
pregnant women in the preeclampsia and normal groups. |
Table I
Clinical characteristics of the
pregnant women in the preeclampsia and normal groups.
| | VCT TMA | EVCT TMA |
|---|
| Characteristic | Preeclampsia
(n=56) | Normal (n=42) | P-value | Preeclampsia
(n=47) | Normal (n=29) | P-value |
|---|
| Age, years | 30.30±5.67 | 28.43±3.90 | 0.055 | 29.68±5.58 | 28.87±3.71 | 0.416 |
| Systolic pressure,
mmHg | 159.84±18.10 | 105.00±12.26 | 0.001a | 160.93±17.62 | 111.06±10.34 | 0.001a |
| Diastolic pressure,
mmHg | 109.67±8.68 | 72.05±8.15 | 0.001a | 105.16±11.94 | 72.10±7.24 | 0.001a |
| Proteinuria, g/24
h | 8.29±6.50 | 0.00 | 0.001a | 9.02±7.11 | 0.00 | 0.001a |
| Gestational age,
weeks | 33.92±3.12 | 39.02±1.38 | 0.001a | 33.95±3.31 | 38.97±1.19 | 0.001a |
| Preeclampsia | | | | | | |
|
Early-onset | 41 | | | 38 | | |
|
Late-onset | 15 | | | 9 | | |
|
Mild | 8 | | | 3 | | |
|
Severe | 48 | | | 44 | | |
CF6 protein expression is higher in
the VCTs and EVCTs of patients with preeclampsia
To verify the location of CF6 in the placenta,
immunohistochemistry was initially performed on VCT and EVCT TMAs,
which included both preeclamptic and normal blocks. The results
showed that in the VCT TMA, CF6 was expressed in the cytoplasm and
on the plasma membrane of the cytotrophoblasts. CF6 displayed
stronger staining intensity in the preeclamptic blocks than in the
normal control blocks (Fig. 1A-D).
The same results were obtained in the EVCT TMAs (Fig. 1E-H). The positive levels of
immunostaining of CF6 in the preeclamptic VCT TMA reached 47/56
(83.9%), which was significantly increased compared with the
respective value in the normal VCT TMA (Table II). Among the preeclamptic VCT
blocks, the positive rates in severe and early-onset preeclampsia
were 42/48 (87.5%) and 37/41 (90.2%), respectively (Table II). The difference between the
total positive percentages of the severe preeclampsia and the
normal groups was statistically significant (Table II). In addition, the results showed
that the positive percentage was higher in the early-onset
preeclampsia group compared with in the normal group, although this
difference was not statistically significant. Similar results were
obtained from the EVCT TMA. The positive percentages of CF6
expression in preeclampsia, severe preeclampsia and early-onset
preeclampsia were 39/47 (83.0%), 36/44 (81.8%), and 34/38 (89.5%),
respectively (Table III). These
differences were statistically significant compared with those of
the normal group (24/31, 77.4%; Table
III). The data of CF6 staining from the VCT and EVCT TMAs are
presented in Tables II and
III, respectively.
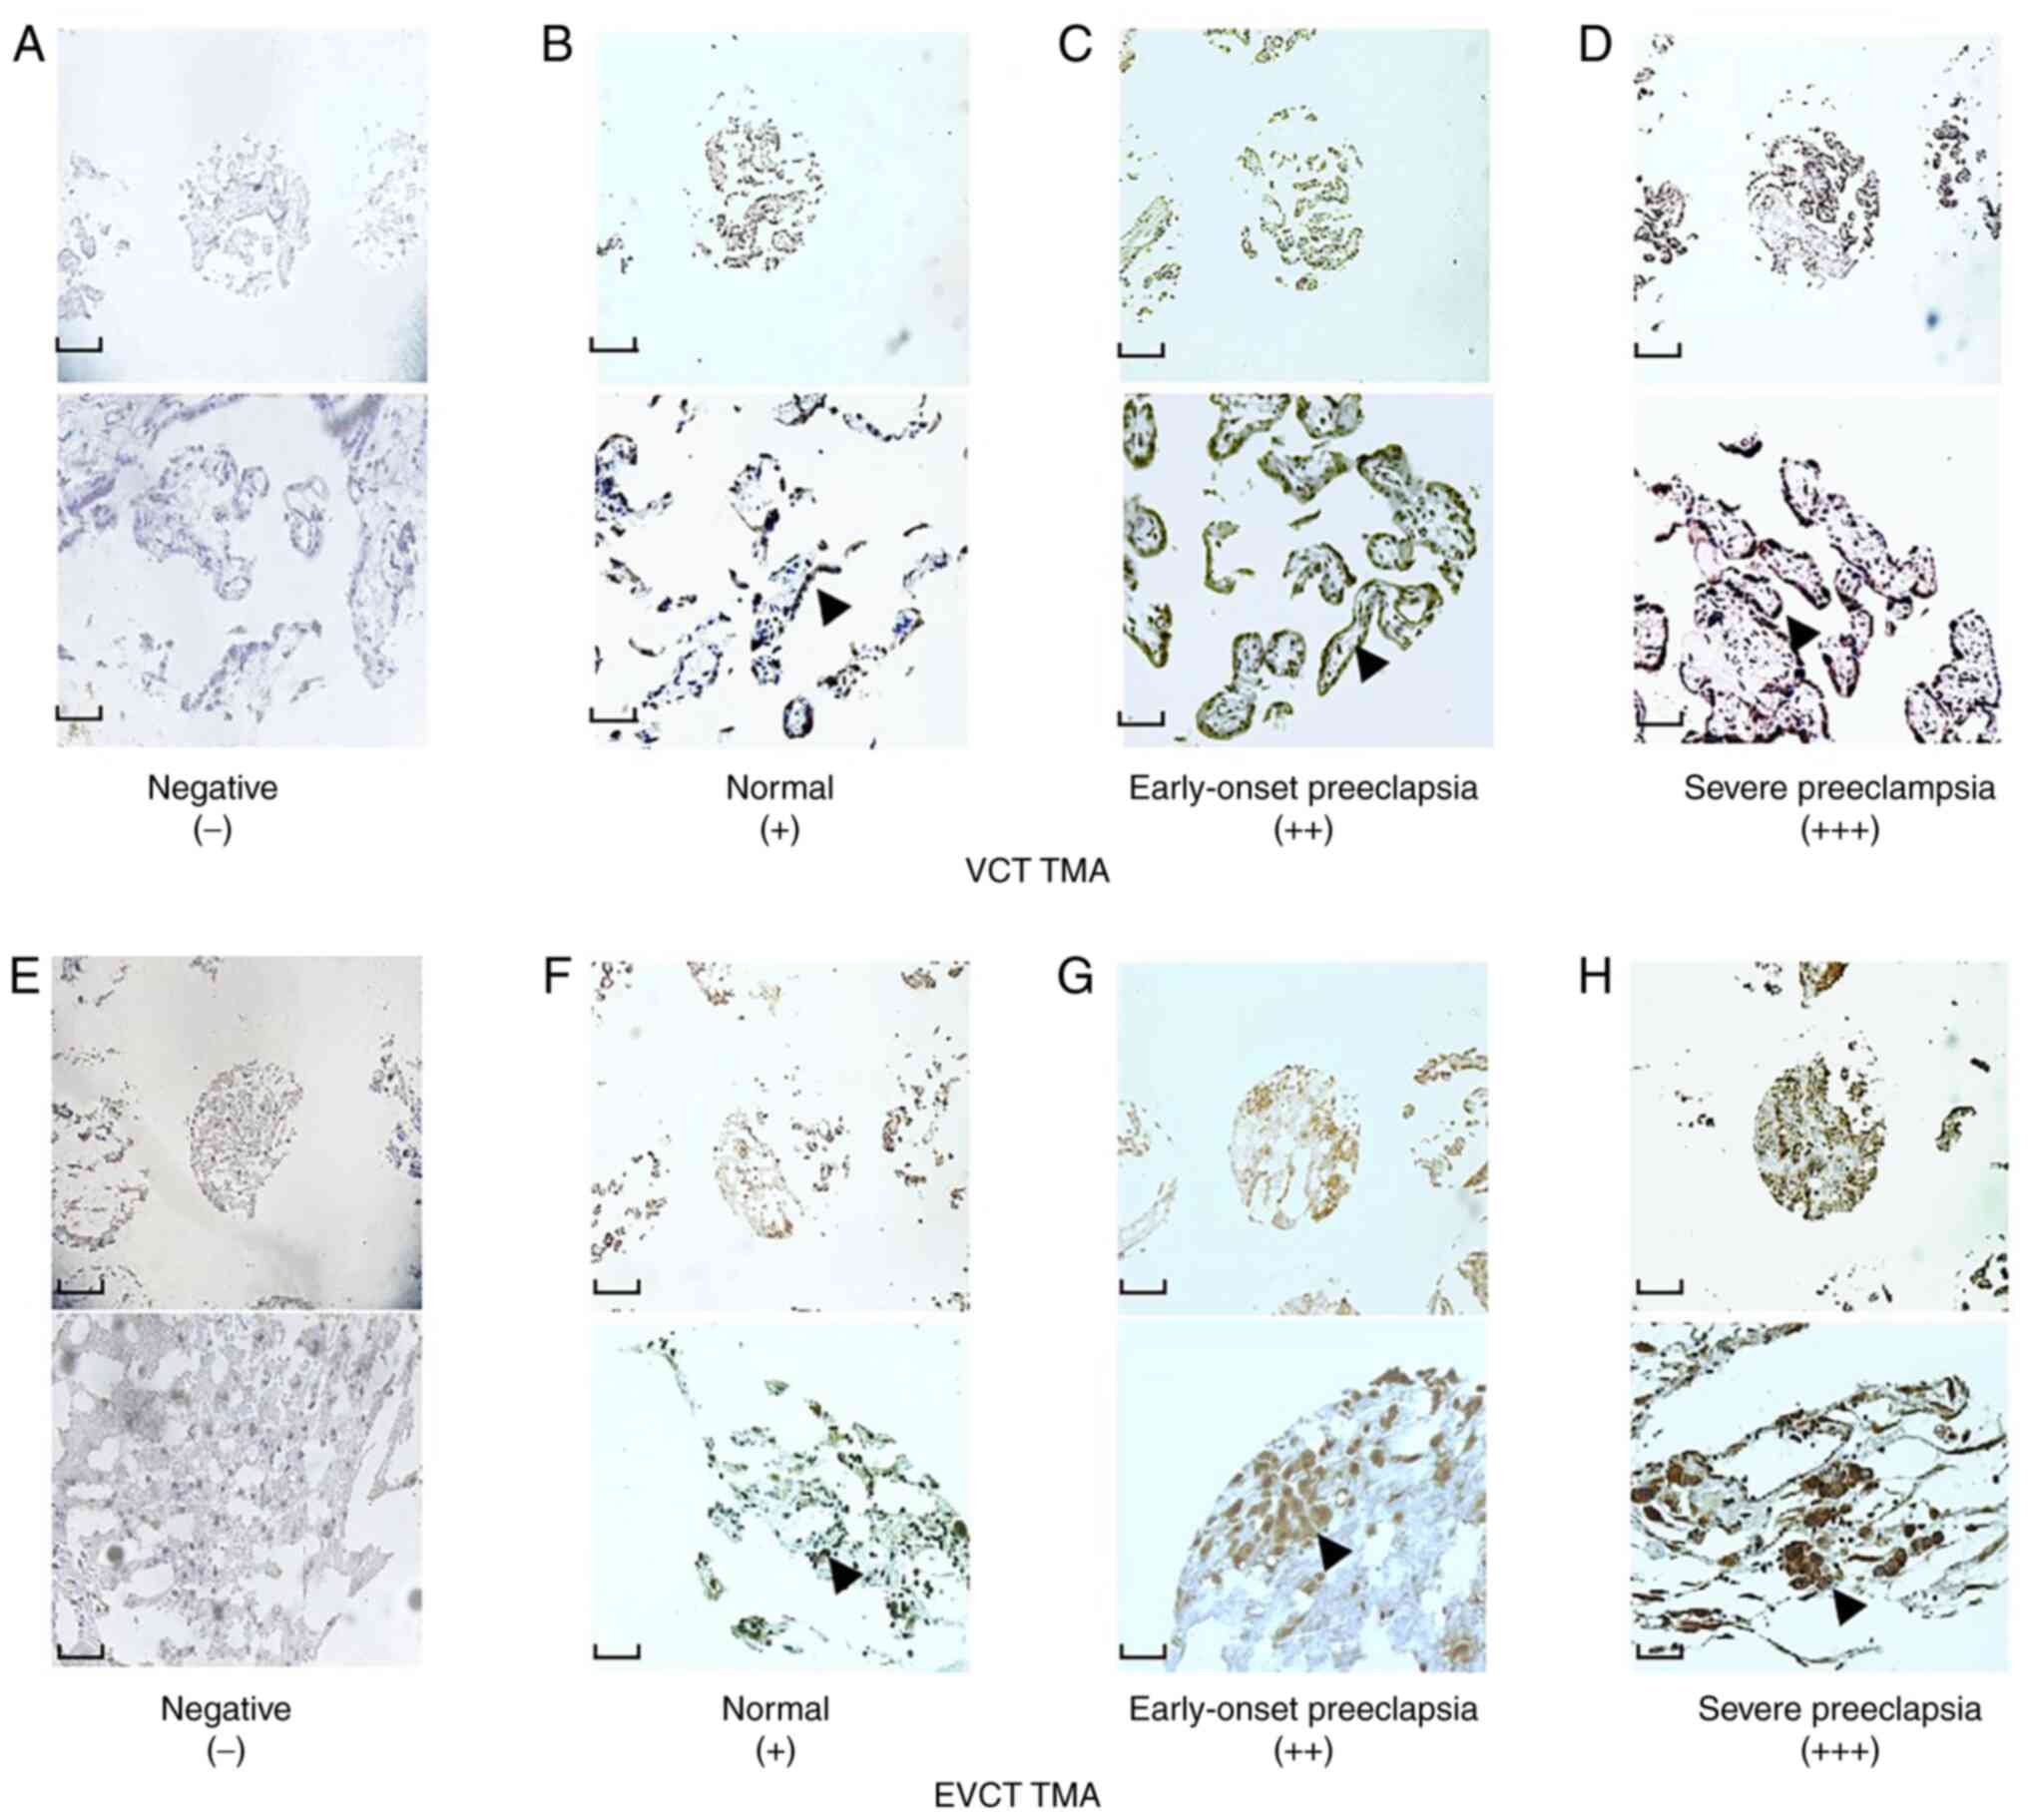 | Figure 1Representative results of CF6
immunohistochemistry staining in placental VCT and EVCT TMAs.
Immunostaining of CF6 in VCT TMAs exhibiting (A) negative), (B)
weak and (C) moderate staining, the latter in the early-onset
group. (D) Intense staining in severe preeclampsia. Immunostaining
of CF6 in EVCT TMAs exhibiting (E) negative, (F) weak and (G)
moderate staining, the latter in the early-onset group. (H) Intense
staining in severe preeclampsia. Magnification, x100 (top scale
bar, 10 mm) and x400 (bottom scale bar, 40 mm) for each panel.
Black arrows indicate positive expression of CF6. CF6, coupling
factor 6; EVCT, extravillous cytotrophoblast; TMA, tissue
microarray; VCT, villous cytotrophoblast. |
| Table IIImmunostaining results for coupling
factor 6 in villous cytotrophoblast tissue microarrays. |
Table II
Immunostaining results for coupling
factor 6 in villous cytotrophoblast tissue microarrays.
| | Negative | Weak staining | Moderate
staining | Intense
staining | |
|---|
| Group | N | N | % | N | % | N | % | N | % | U | P-value |
|---|
| Preeclampsia | 56 | 9 | 16.1 | 11 | 19.6 | 15 | 26.8 | 21 | 37.5 | 560.5 |
<0.001a |
|
Severe | 48 | 6 | 12.5 | 9 | 18.8 | 13 | 27.1 | 20 | 41.7 | 708.5 | 0.014a |
|
Mild | 8 | 3 | 37.5 | 2 | 25 | 2 | 25 | 1 | 12.5 | | |
|
Early-onset | 41 | 4 | 9.8 | 6 | 14.6 | 11 | 26.8 | 20 | 48.8 | 706.0 | 0.152b |
|
Late-onset | 15 | 5 | 33.3 | 5 | 33.3 | 4 | 26.7 | 1 | 6.7 | | |
| Normal | 42 | 12 | 28.6 | 7 | 16.7 | 14 | 33.3 | 9 | 21.4 | | |
| Table IIIImmunostaining results for CF6 in
extravillous cytotrophoblast tissue microarrays. |
Table III
Immunostaining results for CF6 in
extravillous cytotrophoblast tissue microarrays.
| | Negative | Weak staining | Moderate
staining | Intense
staining | |
|---|
| Group | N | N | % | N | % | N | % | N | % | U | P-value |
|---|
| Preeclampsia | 47 | 8 | 17.0 | 10 | 21.3 | 14 | 29.8 | 15 | 31.9 | 104.0 |
<0.001a |
|
Severe | 44 | 8 | 18.2 | 8 | 18.2 | 14 | 31.8 | 14 | 31.8 | 208.0 |
<0.001a |
|
Mild | 3 | 0 | 0 | 2 | 66.7 | 0 | 0 | 1 | 33.3 | | |
|
Early-onset | 38 | 4 | 10.5 | 9 | 23.7 | 12 | 31.6 | 13 | 34.2 | 164.5 |
<0.001a |
|
Late-onset | 9 | 4 | 44.4 | 1 | 11.2 | 2 | 22.2 | 2 | 22.2 | | |
| Normal | 31 | 7 | 24.1 | 7 | 24.1 | 9 | 31.0 | 8 | 27.6 | | |
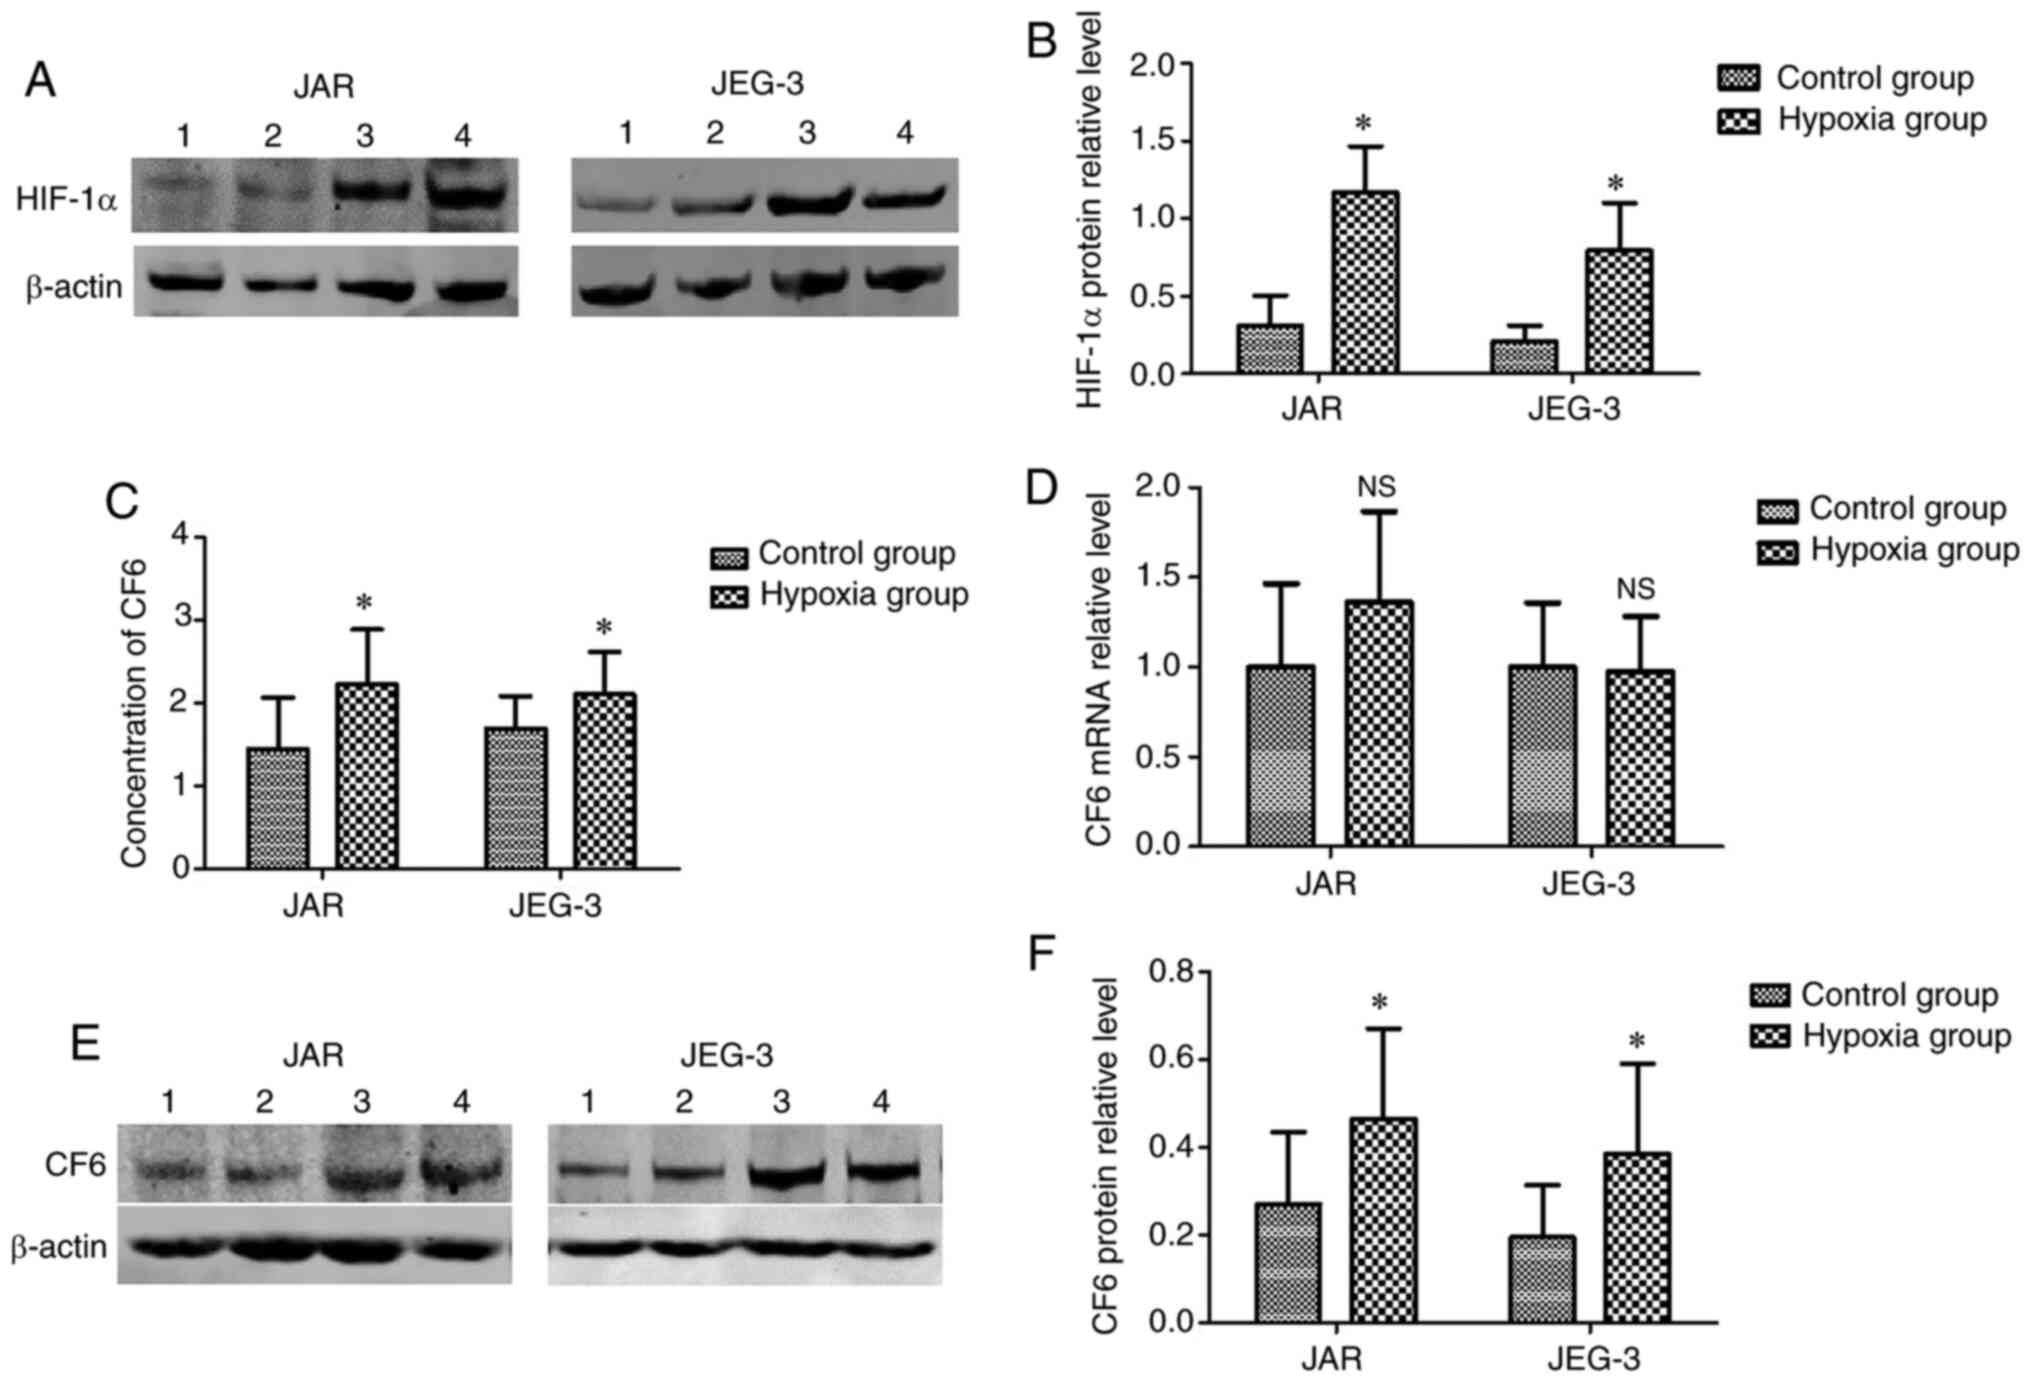
Establishment and evaluation of the
hypoxic cellular model
According to previous studies, hypoxia is common in
the placental microenvironment, and may influence the expression
and release of CF6 (6,13). In the present study, a hypoxic
cellular model was established. However, due to the absence of a
hypoxic incubator, CoCl2 (200 µM) was used for
establishing the hypoxic environment. Increased expression levels
of HIF-1α in the cells indicated that hypoxia was induced. Using
western blot assays, it was found that HIF-1α protein expression
levels were significantly upregulated in the cells incubated with
CoCl2 for 24 h compared with in the normal cells
(Fig. 2A and B). The results indicated that the hypoxic
cellular model was successfully established.
Secretion and expression levels of CF6
are higher in hypoxic JAR and JEG-3 cells
Following incubation of the cells under hypoxic
conditions for 24 h, the culture medium and cells were collected.
ELISAs were used for the detection of CF6 concentrations in the
culture medium. It was found that the secretion of CF6 was
increased in the medium from the hypoxic cells (Fig. 2C). Western blotting was used for the
detection of the CF6 protein expression levels, which were found to
be significantly increased in the hypoxia group compared with in
the control group (Fig. 2E and
F). However, RT-qPCR assays did not
reveal significant changes in CF6 mRNA expression levels between
cells cultured under hypoxic and normal conditions (Fig. 2D).
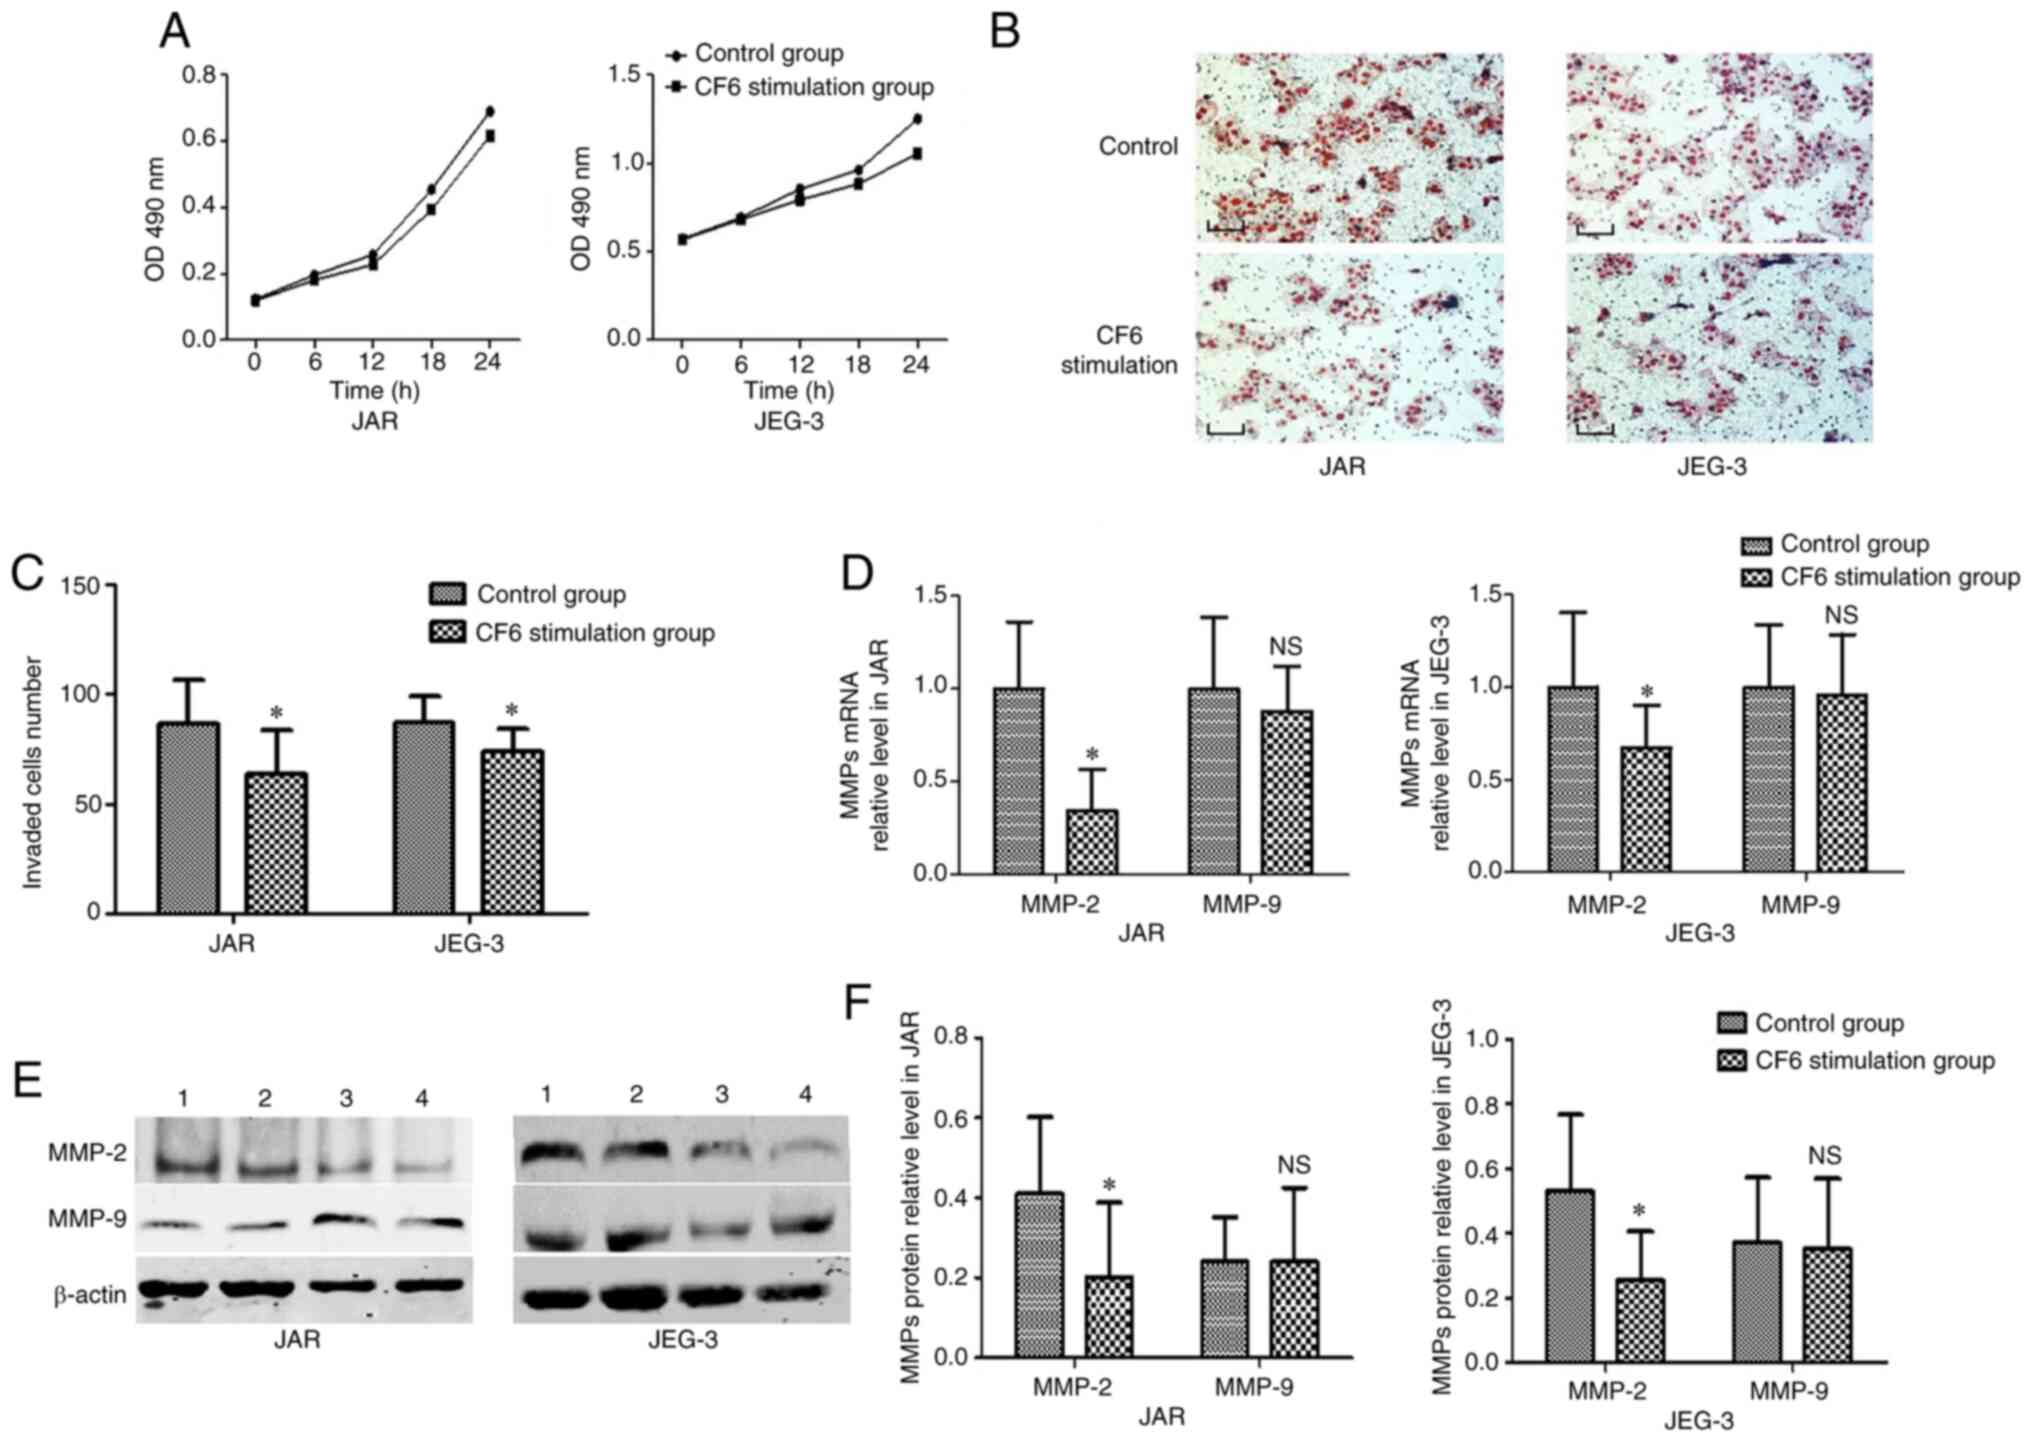
In vitro exogenous CF6 application
decreases the invasive abilities of JAR and JEG-3 cells
Exogenous CF6 was used at a concentration of 0.1 µM
in the subsequent experiments based on a previous study (11). Furthermore, to detect the
proliferative rate of JAR and JEG-3 cells, an MTT assay was
employed. No statistical difference was established between the
group treated with CF6 and the corresponding control group
(Fig. 3A). Accordingly, Transwell
assays were utilized to explore the function of CF6 on the invasive
capabilities of JAR and JEG-3 cells following incubation with 0.1
µM CF6 for 24 h. The results indicated that the two cell types
exhibited reduced invasive abilities following treatment with
exogenous CF6 (0.1 µM) compared with the control group (Fig. 3B and C).
Exogenous CF6 decreases MMP-2
expression levels in JAR and JEG-3 cells
MMP-2 and MMP-9 are considered to be molecular
biomarkers of cells with a high invasive capability (14). Therefore, the present study used
these two markers to investigate changes in JAR and JEG-3 invasive
abilities at the molecular level. RT-qPCR and western blot assays
were used to detect MMP mRNA and protein expression levels,
respectively. The results indicated that CF6 stimulation decreased
the expression levels of both MMP-2 mRNA and protein compared with
the control group (Fig. 3D-F).
However, neither MMP-9 mRNA levels nor MMP-9 protein levels were
altered in the CF6 stimulation group compared with those noted in
the control group (Fig. 3D-F).
Discussion
The present study detected the location and
expression levels of CF6 using VCT and EVCT placental TMAs, which
provided high-throughput detection, eliminating the variability
that has been observed in the immunostaining experiments from
different batches (15). It was
observed that CF6 exhibited higher expression levels in
preeclamptic placentas compared with that in the normal placentas.
Nevertheless, the expression levels of CF6 in the placenta, to the
best of our knowledge, have not been previously investigated and no
related data are currently available to make comparisons with the
present results. Based on the aforementioned findings, two human
choriocarcinoma cell lines, namely JAR and JEG-3, were used as
experimental tools to examine CF6 expression. The biological
characteristics of the two cell lines were shown to be similar to
those of normal trophoblast cells (16) and were used to explore the influence
of hypoxia on CF6 expression and its release from the cells, as
well as the effect of CF6 on cell viability and invasion. Based on
a previous study, a CoCl2 solution (200 µM) was used to
establish a hypoxic cell model (17). CoCl2 blocks oxygen signal
transduction pathways in cells, which simulates a low-oxygen or
hypoxic cellular environment (17).
A limitation of the present study is that the effects of this model
on cell migration were not investigated. Under hypoxic conditions,
the concentration of CF6 in the culture medium was significantly
increased. However, the mRNA expression levels of CF6 did not
display a significant change. Subsequently, the trophoblast cells
were cultured in the medium with exogenous CF6, which decreased
cell invasion. Presumably, these aforementioned changes were
associated with the observed changes in MMP-2 expression
levels.
A number of studies have examined cardiomyopathy
under ischemic and/or hypoxic conditions (13,15,18).
These studies revealed that the secretion of CF6 increases
gradually with prolonged hypoxia and ischemia (13,15,18).
In addition, previous pathological examinations of preeclamptic
placentas indicated that trophoblast cells that are cultured in a
hypoxic environment exhibit a reduced invasive capacity (1).
In animal models of myocardial ischemia, the
induction of arterial and left ventricular cell apoptosis in SHR
rats has been shown to be higher than that noted in WKY normal rats
(19). The CF6 levels in the blood
are also increased. Furthermore, high expression levels of CF6 mRNA
are also present in SHR rats and left ventricular and arterial
cells (19). Concomitantly, the
mRNA expression levels of the ATP synthase subunits in myocardial
tissue are significantly higher compared with those observed in
normal cells (19). This phenomenon
indicates that the increased release of CF6 in the hypoxic
environment is not only caused by cell death. Hypoxia may induce
CF6 overexpression by regulating a signal transduction pathway and
stimulating its release into the blood, thus causing a series of
downstream physiological changes (10,19).
This previous finding appears to differ from the results derived
from the present cell experiments. The reason for this difference
may be related to the different subjects or organs being tested.
Perhaps the expression of CF6 is regulated differently in different
tissues. In the present study, the experiments indicated that a
decrease in oxygen partial pressure may not affect the
transcription of the CF6 gene. However, it can influence the cell
metabolism by enhancing the CF6 protein translation.
In addition, the exogenous CF6 levels in the culture
medium following treatment with a concentration of 0.1 µM CF6
attenuated cell invasion but had no effect on cell proliferation.
Previous studies have demonstrated that MMP-2 and MMP-9 are
relevant to cell invasion and their expression levels can be used
as evaluation index of cell invasion at the molecular level
(14,20). Therefore, the present study selected
these two factors as cell invasion markers. The mRNA and protein
expression levels of the MMP enzymes were measured. The results
revealed that CF6 may affect both the transcription and translation
of MMP-2, but not that of MMP-9. These experimental results
confirmed that exogenous CF6 reduced the cell invasive abilities by
interacting with signal transduction pathways that function
upstream of MMP-2 but not MMP-9. Previous studies have shown that
the expression of MMP-2 in placental tissues during early pregnancy
is significantly increased compared with that of MMP-9 (20-22).
MMP-2 can be activated through the PKC-MAPK pathway (20), while the research of Osanai et
al (19) shows that the
downstream regulation of CF6 is also associated with this pathway
(19,23). However, the specific pathways that
are modified require further study.
CF6 is one of the subunits forming the
F0F1-ATP synthase, coded by the nuclear gene
ATP5J (23). As an essential part
of ATP synthase, CF6 is involved in the synthesis of ATP and
therefore, in its absence, the ATP synthase cannot complete the
general energy conversion process (23). Currently, to the best of our
knowledge, there are no previous studies that have examined CF6 in
trophoblast cells, and there is no clear data that shows altered
expression of CF6 between the cytoplasm and plasma membrane.
Previous studies have found that under certain conditions, such as
increased fluid shear force, hypoxia or hyperglycemia, CF6 can be
secreted from the plasma membrane into the extracellular fluid.
This recognizes and binds with ATP synthase β subunits on the
plasma membrane, inducing cell metabolism and biological reactions,
such as cell migration, invasion and apoptosis, by triggering
downstream signaling pathways (10,24).
However, it is still unknown which signaling pathways are triggered
and whether the functions of CF6 in cytoplasm are through the same
mechanism of action; therefore further studies are needed.
Previous studies on HUVECs by Osanai et al
(10) and Tomita et al
(24) indicated that the production
and release of CF6 are mediated by the NF-κB pathway (23) This was confirmed in these studies by
an increase in fluid shear stress and a decrease in the protein
expression levels of peroxisome proliferator-activated receptor γ.
Sasaki et al (25) further
verified that an increase in TNF-α levels can promote the release
of CF6 from the cells via the same pathway. A previous study
demonstrated that distinct from the mechanisms of TNF-α and fluid
shear stress, a high blood glucose concentration can induce CF6
release by activating the PKC-P38MAPK intracellular signal
transduction pathway (26). CF6 is
released from the cell, enters the blood circulation and binds to
the β-subunit of the ATP synthase in the plasma membrane, which is
different from the original function of CF6 (peripheral stalk),
which was a part of the structural stem of mitochondrial ATP
synthase, involved in the formation and hydrolysis of ATP (2). This type of interaction enhances the
hydrolysis of ATP and prompts the F0-subunit to rotate, pumping
H+ into the cell and leading to intracellular acidosis
(2). In addition, vasodilatation
occurs following the decrease in the synthesis of prostacyclin
(PGI2) through the inhibition of phospholipase
A2(19) and the enhancement of ADMA
(dimethylarginine asymmetry) in the acid environment (11). Moreover, the expression of certain
molecules contributing to atherosclerosis (phospholipase A2 and
ADMA) increases as a result of the raised expression of CF6,
aggravating the injury to blood vessels (11,27,28).
The present study revealed that CF6 was
overexpressed in the preeclamptic placental tissues and that it
could be one of the factors generated and released from the
placenta. Moreover, when the preeclamptic placental tissues are
exposed to hypoxic and ischemic conditions for an extended period
of time, this stimulates the secretion of CF6 from the trophoblasts
into the peripheral blood circulation (6,9).
Subsequently, CF6 binds to the β-subunit of ATPase on the
endothelial cell membranes, activating various downstream signaling
factors, such as the release of nitric oxide, the synthesis of
PGI2, and the generation and release of soluble fms-like
tyrosine kinase 1(29). This leads
to disruption of vascular activity. In the peripheral blood of
patients with preeclampsia, the levels of all these factors are
changed, which likely contributes to the pathogenesis behind the
disease (9). In addition, the
current study found that CF6 secreted from the trophoblast cells
may have weakened the ability of the cells to invade the
surrounding tissues, which was aggravated by the hypoxic conditions
of the placental microenvironment. However, in the present study,
appropriate experiments were not conducted to clarify whether
relevant receptors were expressed in the trophoblast cells, such as
the β-subunit of the ATPase enzyme. Further experiments are
required in the future to clarify this hypothesis.
The present study revealed that increase expression
levels of CF6 in preeclampsia placenta tissue, especially in severe
preeclampsia. Hypoxia increased the secretion of CF6 and high
concentrations of CF6 in the extracellular fluid decreased cell
invasion which lead to the lack of uterine spiral arteriolar
recasting. This may aggravate placental hypoxia, leading to the
occurrence of preeclampsia. However, the exact mechanism of action
via which CF6 is produced under hypoxic conditions and the method
through which the downstream signal peptide is activated remains
unclear, which provides a new direction for further research.
Acknowledgements
Not applicable.
Funding
Funding: Medical Science and Technology Tackle Project of Henan
Provincial Health Commission 2019 (Provincial and Ministry Joint
Construction Project; grant no. SB201901087).
Availability of data and materials
The datasets used and/or analyzed during the current
study are available from the corresponding author on reasonable
request.
Authors' contributions
WS and HW carried out the experiments, participated
in collecting data and drafted the manuscript. KL and XS performed
the statistical analysis and participated in the study design. RL,
LN and LS participated in acquisition, analysis and interpretation
of data, as well as helping with drafting the manuscript. All
authors read and approved the final manuscript. WS and HW confirm
the authenticity of all the raw data.
Ethics approval and consent to
participate
The study was approved by the Ethics committee of
Henan Provincial People's Hospital and the Ethics committee of the
Third Affiliated Hospital of the Zhengzhou University. The patients
agreed to the use of their samples and each patient signed an
informed consent form.
Patient consent for publication
Not applicable.
Competing interests
The authors declare that they have no competing
interests.
References
|
1
|
Chaiworapongsa T, Chaemsaithong P, Yeo L
and Romero R: Pre-eclampsia part 1: Current understanding of its
pathophysiology. Nat Rev Nephrol. 10:466–480. 2014.PubMed/NCBI View Article : Google Scholar
|
|
2
|
Osanai T, Magota K, Tanaka M, Shimada M,
Murakami R, Sasaki S, Tomita H, Maeda N and Okumura K:
Intracellular signaling for vasoconstrictor coupling factor 6:
Novel function of beta-subunit of ATP synthase as receptor.
Hypertension. 46:1140–1146. 2005.PubMed/NCBI View Article : Google Scholar
|
|
3
|
Goldman-Wohl DS and Yagel S: Examination
of distinct fetal and maternal molecular pathways suggests a
mechanism for the development of preeclampsia. J Reprod Immunol.
76:54–60. 2007.PubMed/NCBI View Article : Google Scholar
|
|
4
|
Rattila S, Dunk CEE, Im M, Grichenko O,
Zhou Y, Yanez-Mo M, Blois SM, Yamada KM, Erez O, Gomez-Lopez N, et
al: Interaction of pregnancy-specific glycoprotein 1 with integrin
Α5β1 is a modulator of extravillous trophoblast functions. Cells.
8(1369)2019.PubMed/NCBI View Article : Google Scholar
|
|
5
|
Osanai T, Magota K and Okumura K: Coupling
factor 6 as a novel vasoactive and proatherogenic peptide in
vascular endothelial cells. Naunyn Schmiedebergs Arch Pharmacol.
380:205–214. 2009.PubMed/NCBI View Article : Google Scholar
|
|
6
|
Wang JR, Zuo H, Han XY and Yin G: Study on
changes of coupling factor 6 in pregnancy induced hypertension.
Maternal Child Health Care China. 20:2659–2660. 2005.(In
Chinese).
|
|
7
|
Zhu H, Chen L, Zhou W, Huang Z, Hu J, Dai
S, Wang X, Huang X and He C: Over-expression of the ATP5J gene
correlates with cell migration and 5-fluorouracil sensitivity in
colorectal cancer. PLoS One. 8(e76846)2013.PubMed/NCBI View Article : Google Scholar
|
|
8
|
Zhang Z, Zhang L, Yang X, Li Y and Duan Z:
Construction and validation of a placental tissue microarray from
specimens of well-documented preeclampsia patients. Placenta.
34:187–192. 2013.PubMed/NCBI View Article : Google Scholar
|
|
9
|
ACOG Committee on Practice
Bulletins-Obstetrics. ACOG practice bulletin. Diagnosis and
management of preeclampsia and eclampsia. Number 33, January 2002.
Obstet Gynecol. 99:159–167. 2002.PubMed/NCBI
|
|
10
|
Osanai T, Tanaka M, Kamada T, Nakano T,
Takahashi K, Okada S, Sirato K, Magota K, Kodama S and Okumura K:
Mitochondrial coupling factor 6 as a potent endogenous
vasoconstrictor. J Clin Invest. 108:1023–1030. 2001.PubMed/NCBI View
Article : Google Scholar
|
|
11
|
Tanaka M, Osanai T, Murakami R, Sasaki S,
Tomita H, Maeda N, Satoh K, Magota K and Okumura K: Effect of
vasoconstrictor coupling factor 6 on gene expression profile in
human vascular endothelial cells: Enhanced release of asymmetric
dimethylarginine. J Hypertens. 24:489–497. 2006.PubMed/NCBI View Article : Google Scholar
|
|
12
|
Livak KJ and Schmittgen TD: Analysis of
relative gene expression data using real-time quantitative PCR and
the 2(-Delta Delta C(T)) method. Methods. 25:402–408.
2001.PubMed/NCBI View Article : Google Scholar
|
|
13
|
Moser TL, Stack MS, Asplin I, Enghild JJ,
Hojrup P, Everitt L, Hubchak S, Schnaper HW and Pizzo SV:
Angiostatin binds ATP synthase on the surface of human endothelial
cells. Proc Natl Acad Sci USA. 96:2811–2816. 1999.PubMed/NCBI View Article : Google Scholar
|
|
14
|
Cui N, Hu M and Khalil RA: Biochemical and
biological attributes of matrix metalloproteinases. Prog Mol Biol
Transl Sci. 147:1–73. 2017.PubMed/NCBI View Article : Google Scholar
|
|
15
|
Zhang L, Li Y, Yang X and Zhang Z:
Detection of phosphorylated signal transducer and activator of
transcription 3 in extravillous trophoblast cells of preeclampsia
by placental tissue microarray. Chin J Perinatal Med. 16:479–484.
2013.
|
|
16
|
Bilban M, Tauber S, Haslinger P,
Pollheimer J, Saleh L, Pehamberger H, Wagner O and Knöfler M:
Trophoblast invasion: Assessment of cellular models using gene
expression signatures. Placenta. 31:989–996. 2010.PubMed/NCBI View Article : Google Scholar
|
|
17
|
Yuan Y, Hilliard G, Ferguson T and
Millhorn DE: Cobalt inhibits the interaction between
hypoxia-inducible factor-alpha and von Hippel-Lindau protein by
direct binding to hypoxia-inducible factor-alpha. J Biol Chem.
278:15911–15916. 2003.PubMed/NCBI View Article : Google Scholar
|
|
18
|
Sangawa H, Himeda T, Shibata H and Higuti
T: Gene expression of subunit c(P1), subunit c(P2), and oligomycin
sensitivity-conferring protein may play a key role in biogenesis of
H+-ATP synthase in various rat tissues. J Biol Chem.
272:6034–6037. 1997.PubMed/NCBI View Article : Google Scholar
|
|
19
|
Osanai T, Kamada T, Fujiwara N, Katoh T,
Takahashi K, Kimura M, Satoh K, Magota K, Kodama S, Tanaka T and
Okumura K: A novel inhibitory effect on prostacyclin synthesis of
coupling factor 6 extracted from the heart of spontaneously
hypertensive rats. J Biol Chem. 273:31778–31783. 1998.PubMed/NCBI View Article : Google Scholar
|
|
20
|
Fingleton B: Matrix metalloproteinases as
regulators of inflammatory processes. Biochim Biophys Acta Mol Cell
Res. 1864:2036–2042. 2017.PubMed/NCBI View Article : Google Scholar
|
|
21
|
Staun-Ram E, Goldman S, Gabarin D and
Shalev E: Expression and importance of matrix metalloproteinase 2
and 9 (MMP-2 and -9) in human trophoblast invasion. Reprod Biol
Endocrinol. 2(59)2004.PubMed/NCBI View Article : Google Scholar
|
|
22
|
Schafer-Somi S, Ali Aksoy O, Patzl M,
Findik M, Erünal-Maral N, Beceriklisoy HB, Polat B and Aslan S: The
activity of matrix metalloproteinase-2 and -9 in serum of pregnant
and non-pregnant bitches. Reprod Domest Anim. 40:46–50. 2005.
|
|
23
|
Knowles AF, Guillory RJ and Racker E:
Partial resolution of the enzymes catalyzing oxidative
phosphorylation. XXIV. A factor required for the binding of
mitochondrial adenosine triphosphatase to the inner mitochondrial
membrane. J Biol Chem. 246:2672–2679. 1971.PubMed/NCBI
|
|
24
|
Tomita H, Osanai T, Toki T, Sasaki S,
Maeda N, Murakami R, Magota K, Yasujima M and Okumura K:
Troglitazone and 15-deoxy-delta(12,14)-prostaglandin J2 inhibit
shear-induced coupling factor 6 release in endothelial cells.
Cardiovasc Res. 67:134–141. 2005.PubMed/NCBI View Article : Google Scholar
|
|
25
|
Sasaki S, Osanai T, Tomita H, Matsunaga T,
Magota K and Okumura K: Tumor necrosis factor alpha as an
endogenous stimulator for circulating coupling factor 6. Cardiovasc
Res. 62:578–586. 2004.PubMed/NCBI View Article : Google Scholar
|
|
26
|
Li X, Xing S, Zhang L, Xing Q, Yan S, Dai
H, You S, Pang Y and Tang C: High glucose promotes the release and
expression of novel vasoactive peptide, coupling factor 6, in human
umbilical vein endothelial cells. Peptides. 28:683–690.
2007.PubMed/NCBI View Article : Google Scholar
|
|
27
|
Kumagai A, Osanai T, Katoh C, Tanaka M,
Tomita H, Morimoto T, Murakami R, Magota K and Okumura K: Coupling
factor 6 downregulates platelet endothelial cell adhesion
molecule-1 via c-Src activation and acts as a proatherogenic
molecule. Atherosclerosis. 200:45–50. 2008.PubMed/NCBI View Article : Google Scholar
|
|
28
|
Tzima E, Irani-Tehrani M, Kiosses WB,
Dejana E, Schultz DA, Engelhardt B, Cao G, DeLisser H and Schwartz
MA: A mechanosensory complex that mediates the endothelial cell
response to fluid shear stress. Nature. 437:426–431.
2005.PubMed/NCBI View Article : Google Scholar
|
|
29
|
Echizen T, Osanai T, Ashitate T, Yokoyama
H, Shibutani S, Tanaka M, Tomita H, Magota K and Okumura K:
Upregulation of soluble vascular endothelial growth factor receptor
type 1 by endogenous prostacyclin inhibitor coupling factor 6 in
vascular endothelial cells: A role of acidosis-induced c-Src
activation. Hypertens Res. 32:182–187. 2009.PubMed/NCBI View Article : Google Scholar
|