Introduction
Osteoarthritis (OA) is the most common
age-associated degenerative disease, which causes pain, stiffness
and decreased function of the joints (1-3).
With the increasing aging of the population, the incidence of OA is
on the rise and affects >250 million individuals worldwide
(4,5). Thus far, there is no effective
treatment available for OA (6).
Non-steroidal anti-inflammatory drugs are approved for the
symptomatic treatment of OA only (7). These drugs are only symptomatic
treatments and do not delay the progression of OA (8). Therefore, understanding the mechanisms
underlying the promotion of OA is essential for developing
effective therapies for OA.
The onset of OA is dependent on TNF-α, interleukin
(IL)-1β and IL-12(9). IL-1β is
considered the initiator of the acute inflammatory response in OA
(10) and has been demonstrated to
be implicated in inducing chondrocyte apoptosis and degradation;
thus, it may be used to generate an in vitro cellular model
of OA (11).
Apoptosis is known to be important in the
pathophysiological processes of OA and IL-1β has been reported to
accelerate aging and increase the apoptotic index of chondrocytes
(12). It is known that loss of
chondrocytes induced by IL-1β decreases the production of the
chondrocyte matrix and increases cartilage damage (13). However, the changes in genes and the
specific regulatory network during IL-1β-treated chondrocytes
remain poorly understood.
It is therefore important to understand the gene
changes in chondrocytes caused by IL-1β. With the development of
high-throughput sequencing technology and bioinformatics, numerous
mRNAs have been identified. Microarray techniques and
bioinformatics analyses have been extensively used to screen for
differences at the genomic level involved in IL-1β-stimulated
chondrocyte apoptosis, enabling the identification of
differentially expressed genes (DEGs) and the potential biological
processes associated with OA progression.
In the present study, a microarray dataset was
downloaded from the Gene Expression Omnibus (GEO) database and
analyzed. Furthermore, potential Gene Ontology (GO) functional
terms and pathways of these DEGs were analyzed. A protein-protein
interaction (PPI) network was then established in order to
elucidate the hub genes that are involved in OA.
Materials and methods
Gene expression microarray data
Datasets comparing chondrocytes that had been
treated with either IL-1β or placebo were selected. Search terms
were as follows: Chondrocytes and IL-1β. The gene expression
profile from the dataset GSE104793 was downloaded from GEO
(www.ncbi.nlm.nih.gov/geo/). GSE104793
was based on the Affymetrix Mouse Gene 2.0 ST Array [transcript
(gene) version] platform. The GSE104793 dataset contained six
samples, including three untreated mouse articular chondrocyte
samples and three IL-1β-treated primary mouse articular chondrocyte
samples. The dataset GSE74220 was also downloaded from GEO. The
GSE74220 dataset contained six samples, including three untreated
human articular chondrocytes samples and three IL-1β-treated
primary human articular chondrocyte samples.
Differential expression analyses
Before the data analysis, normalization was
performed to eliminate any discrepancies based on non-conforming
units. Raw data were processed via robust multi-array average
algorithm methods, as previously described (14). The Limma package in R software was
used to select DEGs (14). To
screen for DEGs, the cut-off criteria were set as fold change (FC)
>2 (|Log FC| >1) and P<0.05. Volcano plots were generated
using the R package ggplot (15). A
heatmap was drawn using the heatmap package of the R software
(version 3.5.0).
GO and Kyoto Encyclopedia of Genes and
Genomes (KEGG) analysis of DEGs
Metascape is an online gene enrichment tool used to
extract comprehensive biological information associated with gene
lists. GO and KEGG enrichment analyses were performed with the
Metascape online tool (http://metascape.org/gp/index.html#/main/step1)
(16). GO terms, including those in
the categories biological process, cellular component and molecular
function, were determined. Furthermore, Gene Set Enrichment
Analysis (GSEA) (http://software.broadinstitute.org/gsea) was
performed.
PPI
Numerous DEGs are involved in the progress of
IL-1β-induced chondrocytes and the association between these DEGs
was determined using the Search Tool for the Retrieval of
Interacting Genes (STRING) database (https://string-db.org/). A minimum required
interaction score >0.9 was set as the criterion. Networks were
visualized using Cytoscape (version 3.7.1) (17). Subsequently, a module analysis of
the network was performed using the plugin Molecular Complex
Detection (MCODE). The MCODE criteria for selection were as
follows: Degree cut-off ≥10, node score cut-off ≥0.4, K-core ≥4 and
max depth=100.
Cell culture
Primary chondrocytes were isolated from mouse
femoral condyles and tibial plateau cartilage tissue as previously
described (18). A total of 10
C57BL/6J male mouse pups (Beijing Vital Laboratory Animal
Technology Co., Ltd; body weight, 2.5-3.0 g; age, 5-7 days) were
housed under standard laboratory conditions (22±2˚C, 12-h
light/dark cycle) with food and water available ad libitum.
Cervical dislocation euthanasia of all mouse pups was performed
after pentobarbital sodium anesthesia (40 mg/kg; I.V.). In brief,
the obtained cartilage fragments were cut into small pieces and
washed with PBS. Subsequently, cartilage pieces were digested with
0.2% (w/v) collagenase type II (Sigma Aldrich; Merck KGaA) for 4 h
at 37˚C. Next, 200 mesh-filtrating screens were used to remove
large fragments. Collected chondrocytes were cultured with
Dulbecco's modified Eagle's medium (Gibco; Thermo Fisher
Scientific, Inc.) supplemented with 25% fetal bovine serum (BD
Biosciences). Cells at the second passage were used for the
subsequent experiments. Chondrocytes were stimulated with IL-1β (10
ng/ml) for 24 h as previously described (19). The present study was approved by The
Ethics Committee of Renmin Hospital of Wuhan University (approval
no. 2019-YLS-0125, Wuhan, China).
Apoptosis assay
The apoptotic chondrocytes in the IL-1β-treated
group were identified using an Annexin V-FITC/propidium iodide (PI)
double staining kit (cat. no. 556547; BD Biosciences) according to
the manufacturer's protocol. In brief, IL-1β-treated chondrocytes
(5x10⁶ cells/tube) were collected in a centrifuge tube.
Subsequently, working solution (5 µl of FITC Annexin V and 1 µl of
50 µg/ml PI) was added, followed by incubation at room temperature
in the dark for 15 min. Analysis of apoptosis was performed using
flow cytometry (BD Biosciences).
Human cartilage
Human cartilage samples were collected from the
Orthopedics Department of Renmin Hospital of Wuhan University
(Wuhan, China). The present study was approved by the Ethics
Committee of Renmin Hospital of Wuhan University (Wuhan, China).
Written informed consent was obtained from all subjects.
Control cartilage was harvested from patients with
femoral neck fractures without any history of OA at the time-point
of total hip arthroplasty (n=20), whereas the pathological
cartilage was acquired from patients with end-stage symptomatic
hip-OA at the time-point of total hip replacement surgery (n=20).
The clinical characteristics of the patients are presented in
Table I.
 | Table IGeneral characteristics of the
patients of the present study. |
Table I
General characteristics of the
patients of the present study.
| Parameter | OA (n=20) | Control (n=20) | P-value |
|---|
| Age (years) | 67.56±5.69 | 65.19±6.53 | 0.518 |
| BMI
(kg/m2) | 24.53±4.78 | 22.64±3.36 | 0.049 |
| Body height
(m) | 162.45±7.31 | 161.86±6.47 | 0.502 |
| Body weight
(kg) | 64.29±10.91 | 59.44±10.24 | 0.731 |
| Sex | | | 0.429 |
|
Male | 5 | 3 | |
|
Female | 15 | 17 | |
PCR
Total RNA from the chondrocytes was extracted using
TRIzol® (Invitrogen; Thermo Fisher Scientific, Inc.) and
was preserved at -80˚C. The concentration of total RNA was
quantified using a NanoDrop Lite spectrophotometer (Thermo Fisher
Scientific, Inc.). Complementary (c)DNA was synthesized from 1 µg
total RNA using a BeyoRT First-Strand cDNA synthesis kit (Beyotime
Institute of Biotechnology). Reverse transcription-quantitative PCR
(RT-qPCR) was performed using a BeyoFast Probe One-Step RT-qPCR kit
(Beyotime Institute of Biotechnology). In the detection system
(LineGene 9600 Plus; SIA Biosan) the following thermocycling
conditions were used: 95˚C for 10 min, followed by 45 cycles of
95˚C for 30 sec, 60˚C for 30 sec and 72˚C for 30 min (20). The primers for each gene were as
follows: Kininogen 2 (KNG2) forward, 5'-TGGCCTCGAGATGTGCTTCAG-3'
and reverse, 5'-TCTCCTTGGCGGCCGCACTTCCTTC-3'; cyclin B1 (CCNB1)
forward, 5'-AACACGCTGCCTGTCTACACT-3' and reverse,
5'-CAGTGCAGGGTCCGAGGT-3'; cell division cycle 20 (CDC20) forward,
5'-ACACCCGTGAGAGAGACTTG-3' and reverse, 5'-AAGTCAGTCGGGAAGGAAGG-3';
cyclin A2 (CCNA2) forward, 5'-GACCCCTTTACTCTGACCCC-3' and reverse,
5'-AGGCTCCAGTGAATTCGGAA-3'; 1-phosphatidylinositol 4-kinase (PIK1)
forward, 5'-ACAGATGAAGTGCTCCTTCCA-3' and reverse,
5'-GTCGGAGATTCGTAGCTGGA-3'; BUB1 mitotic checkpoint
serine/threonine kinase (BUB1) forward, 5'-TGTCTTCCTCACCGATTCCT-3'
and reverse, 5'-ACCACCCGAGCTCTGTCTTACTC-3'; GAPDH forward,
5'-AGGTCGGTGTGAACGGATTTG-3' and reverse,
5'-TGTAGACCATGTAGTTGAGGTCA-3'; complement C3 (C3) forward,
5'-CTCGCTTCGGCAGCACA-3' and reverse, 5'-AACGCTTCACGAATTTGCGT-3';
kinesin family member 11 (KIF11) forward,
5'-TCCCTGAGACCCTAACTTGTGA-3' and reverse,
5'-AGTCTCAGGGTCCGAGGTATTC-3'; cyclin B2 (CCNB2) forward,
5'-GCACCGACCTCTTCAAGC-3' and reverse, 5'-CCATGAACTCCAGTCCTTCA3';
BUB1 mitotic checkpoint serine/threonine kinase B (Bub1b) forward,
5'-AACCAGGATGGGTCACCATA-3' and reverse, 5'-ACTGAAACCCAATGCACTCC-3'.
GAPDH was used as the internal control. Relative gene expression
levels were quantified using the 2-ΔΔCq method (21).
Venn diagram
A Venn diagram was drawn using jvenn (http://www.bioinformatics.com.cn/static/others/jvenn/example.html)
to determine the common DEGs between the datasets.
Statistical analysis
Values are expressed as the mean ± standard
deviation. Statistical analyses were performed using the Student's
t-test using IBM SPSS version 21.0, software (IBM Corp.). P<0.05
was considered to indicate a statistically significant
difference.
Results
Identification of DEGs
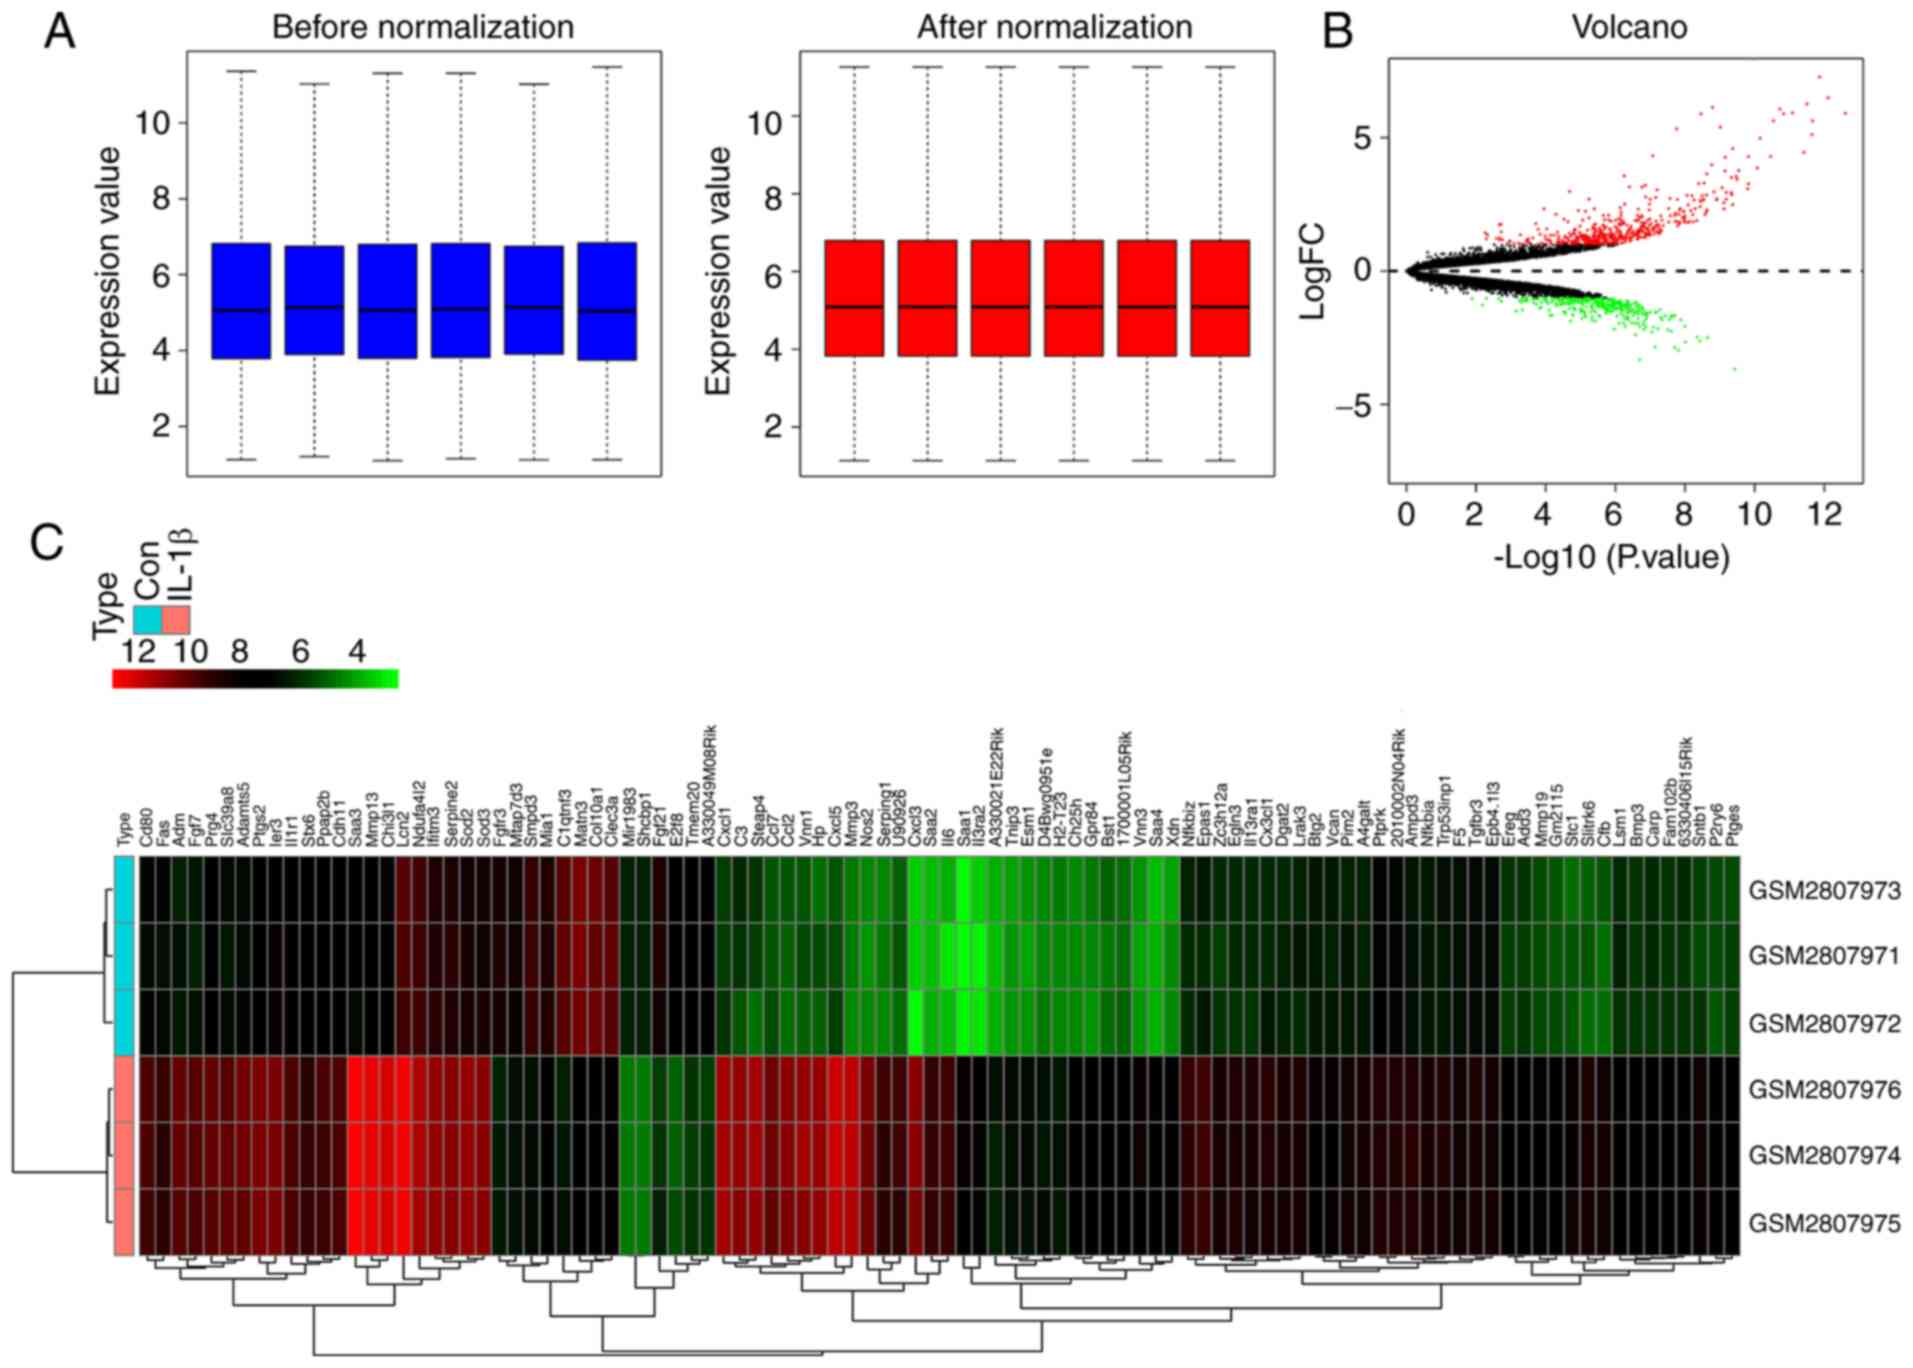
The box plot of the log expression values for all
genes in each group (control vs. IL-1β-treated chondrocytes) prior
to and after normalization were mapped (Fig. 1A). The median values of each sample
were almost at a consistent level, suggesting that the data were
eligible for further analysis.
The heatmap (Fig.
1B) and volcano plot (Fig. 1C)
display the DEGs in IL-1β-treated chondrocytes. Based on the
cut-off criteria used for determination of the DEGs, a total of 844
DEGs, including 498 upregulated and 346 downregulated DEGs, were
identified. The top 20 up- and downregulated DEGs are presented in
Tables II and III, respectively.
| Table IITop 20 upregulated differentially
expressed genes in interleukin-1β-treated chondrocytes compared
with those of the control group. |
Table II
Top 20 upregulated differentially
expressed genes in interleukin-1β-treated chondrocytes compared
with those of the control group.
| Gene | logFC | AveExpr | t | P-value | adj.P.Val | B |
|---|
| Serum amyloid
A2 | 5.9163 | 6.5406 | 73.1477 |
2.46x10⁻¹³ | 6.06E-09 | 18.6193 |
| C-X-C motif
chemokine ligand 5 | 6.5031 | 8.6703 | 64.0081 |
7.74x10⁻¹³ | 9.54E-09 | 18.1034 |
| Matrix
metallopeptidase 3 | 7.2795 | 8.1056 | 59.9409 |
1.36x10⁻¹² | 1.12E-08 | 17.8193 |
| C-X-C motif
chemokine ligand 1 | 5.6297 | 8.4909 | 56.7565 |
2.18x10⁻¹² | 1.13E-08 | 17.5675 |
| C-C motif chemokine
ligand 7 | 5.1185 | 7.8909 | 56.4355 |
2.29x10⁻¹² | 1.13E-08 | 17.5405 |
| Nitric oxide
synthase 2 | 6.2695 | 7.4200 | 54.3523 |
3.16x10⁻¹² | 1.30E-08 | 17.3578 |
| Matrix
metallopeptidase 13 | 4.4475 | 10.2420 | 53.0409 |
3.89x10⁻¹² | 1.37E-08 | 17.2355 |
| Vanin 1 | 5.9276 | 8.1563 | 48.6124 |
8.23x10⁻¹² | 2.54E-08 | 16.7762 |
| C-C motif chemokine
ligand 2 | 5.9043 | 7.8825 | 45.4236 |
1.47x10⁻¹¹ | 4.03E-08 | 16.3943 |
| Haptoglobin | 6.0710 | 8.0656 | 44.0942 |
1.90x10⁻¹¹ | 4.69E-08 | 16.2205 |
| Serum amyloid
A1 | 5.6294 | 5.3605 | 41.9865 |
2.89x10⁻¹¹ | 6.48E-08 | 15.9255 |
| Vanin 3 | 4.2944 | 6.2530 | 41.0399 |
3.52x10⁻¹¹ | 7.23E-08 | 15.7845 |
| Serpin family G
member 1 | 4.9816 | 6.8803 | 37.9014 |
6.96x10⁻¹¹ | 1.32E-07 | 15.2758 |
| SLIT and NTRK like
family member 6 | 3.8563 | 6.9691 | 37.0835 |
8.39x10⁻¹¹ | 1.48E-07 | 15.1317 |
| C-X-C motif
chemokine ligand 3 | 7.9719 | 6.9130 | 35.7119 |
1.16x10⁻¹⁰ | 1.90E-07 | 14.8786 |
| Serum amyloid A4,
constitutive | 4.2909 | 5.7558 | 34.6319 |
1.51x10⁻¹⁰ | 2.17E-07 | 14.6682 |
| NFKB inhibitor
zeta | 3.2694 | 7.6966 | 34.6222 |
1.51x10⁻¹⁰ | 2.17E-07 | 14.6663 |
| Cholesterol
25-hydroxylase | 3.0854 | 5.8962 | 34.4341 |
1.58x10⁻¹⁰ | 2.17E-07 | 14.6286 |
| Adrenomedullin | 3.7689 | 8.3151 | 32.1049 |
2.88x10⁻¹⁰ | 3.73E-07 | 14.1347 |
| Solute carrier
family 39 member 8 | 3.4395 | 8.4606 | 31.7193 |
3.19x10⁻¹⁰ | 3.93E-07 | 14.0478 |
| Table IIITop 20 downregulated differentially
expressed genes in interleukin-1β-treated chondrocytes compared
with that of the control group. |
Table III
Top 20 downregulated differentially
expressed genes in interleukin-1β-treated chondrocytes compared
with that of the control group.
| Gene | logFC | AveExpr | t | P-value | adj.P.Val | B |
|---|
| C1q and TNF related
3 | -3.6690 | 8.3401 | -31.0716 |
3.81x10⁻¹⁰ | 4.27E-07 | 13.8982 |
| Collagen type X
alpha 1 chain | -2.5009 | 9.1546 | -25.2285 |
2.25x10⁻⁹ | 1.34E-06 | 12.3160 |
| Sphingomyelin
phosphodiesterase 3 | -2.6276 | 8.1092 | -23.7519 |
3.76x10⁻⁹ | 1.68E-06 | 11.8366 |
| Fibroblast growth
factor receptor 3 | -2.4767 | 7.6773 | -23.2467 |
4.51x10⁻⁹ | 1.92E-06 | 11.6638 |
| E2F transcription
factor 8 | -2.6635 | 6.4849 | -21.2008 |
9.85x10⁻⁹ | 3.39E-06 | 10.9127 |
| Solute carrier
family 35 member G1 | -2.0720 | 6.8393 | -21.1527 |
1.00x10⁻⁸ | 3.39E-06 | 10.8940 |
| MAP7 domain
containing 3 | -1.8313 | 7.6434 | -20.4788 |
1.32x10⁻⁸ | 4.07E-06 | 10.6263 |
| Fibroblast growth
factor 21 | -2.9702 | 7.3424 | -20.1300 |
1.53x10⁻⁸ | 4.37E-06 | 10.4835 |
| Melanoma inhibitory
activity 1 | -1.6634 | 8.1435 | -19.5582 |
1.95x10⁻⁸ | 5.11E-06 | 10.2431 |
| Matrilin 3 | -2.8530 | 9.1627 | -19.5269 |
1.97x10⁻⁸ | 5.12E-06 | 10.2296 |
| mir1983 | -1.7090 | 5.4264 | -19.1513 |
2.33x10⁻⁸ | 5.94E-06 | 10.0668 |
| Noncompact myelin
associated protein | -1.6768 | 6.6249 | -19.1406 |
2.34x10⁻⁸ | 5.94E-06 | 10.0621 |
| C-type lectin
domain family 3 member A | -2.2555 | 9.0487 | -19.0299 |
2.45x10⁻⁸ | 6.17E-06 | 10.0134 |
| SHC binding and
spindle associated 1 | -1.6970 | 5.4181 | -18.8890 |
2.61x10⁻⁸ | 6.50E-06 | 9.9509 |
| Cytochrome b5
reductase 2 | -1.8194 | 6.9376 | -18.7210 |
2.82x10⁻⁸ | 6.80E-06 | 9.8757 |
| Solute carrier
family 38 member 3 | -2.1951 | 8.1691 | -18.4921 |
3.12x10⁻⁸ | 7.33E-06 | 9.7720 |
| Kinesin family
member 11 | -1.6817 | 6.2994 | -18.0989 |
3.74x10⁻⁸ | 8.70E-06 | 9.5903 |
| Family with
sequence similarity 180 member A | -1.8312 | 6.7883 | -17.6541 |
4.61x10⁻⁸ | 1.05E-05 | 9.3793 |
| Myelin protein zero
like 2 | -1.7372 | 6.1523 | -17.4783 |
5.02x10⁻⁸ | 1.10E-05 | 9.2942 |
| mir323 | -1.4407 | 5.4136 | -17.4224 |
5.16x10⁻⁸ | 1.12E-05 | 9.2670 |
The top 20 upregulated DEGs were as follows: Serum
amyloid A2, C-X-C motif chemokine ligand 5, matrix metallopeptidase
3, C-X-C motif chemokine ligand 1, C-C motif chemokine ligand 7,
nitric oxide synthase 2, matrix metallopeptidase 13, vanin 1, C-C
motif chemokine ligand 2, haptoglobin, serum amyloid A1, vanin 3,
serpin family G member 1, SLIT and NTRK like family member 6, C-X-C
motif chemokine ligand 3, serum amyloid A4, constitutive, NFKB
inhibitor zeta, cholesterol 25-hydroxylase, adrenomedullin and
solute carrier family 39 member 8. The top 20 downregulated DEGs
were C1q and TNF related 3, collagen type X alpha 1 chain,
sphingomyelin phosphodiesterase 3, fibroblast growth factor
receptor 3, E2F transcription factor 8, solute carrier family 35
member G1, MAP7 domain containing 3, fibroblast growth factor 21,
melanoma inhibitory activity 1, matrilin 3, microRNA (miR)-1983,
noncompact myelin associated protein, C-type lectin domain family 3
member A, SHC binding and spindle associated 1, cytochrome b5
reductase 2, solute carrier family 38 member 3, kinesin family
member 11, family with sequence similarity 180 member A, myelin
protein zero like 2 and miRNA 323.
GO term and KEGG pathway enrichment
analysis of DEGs
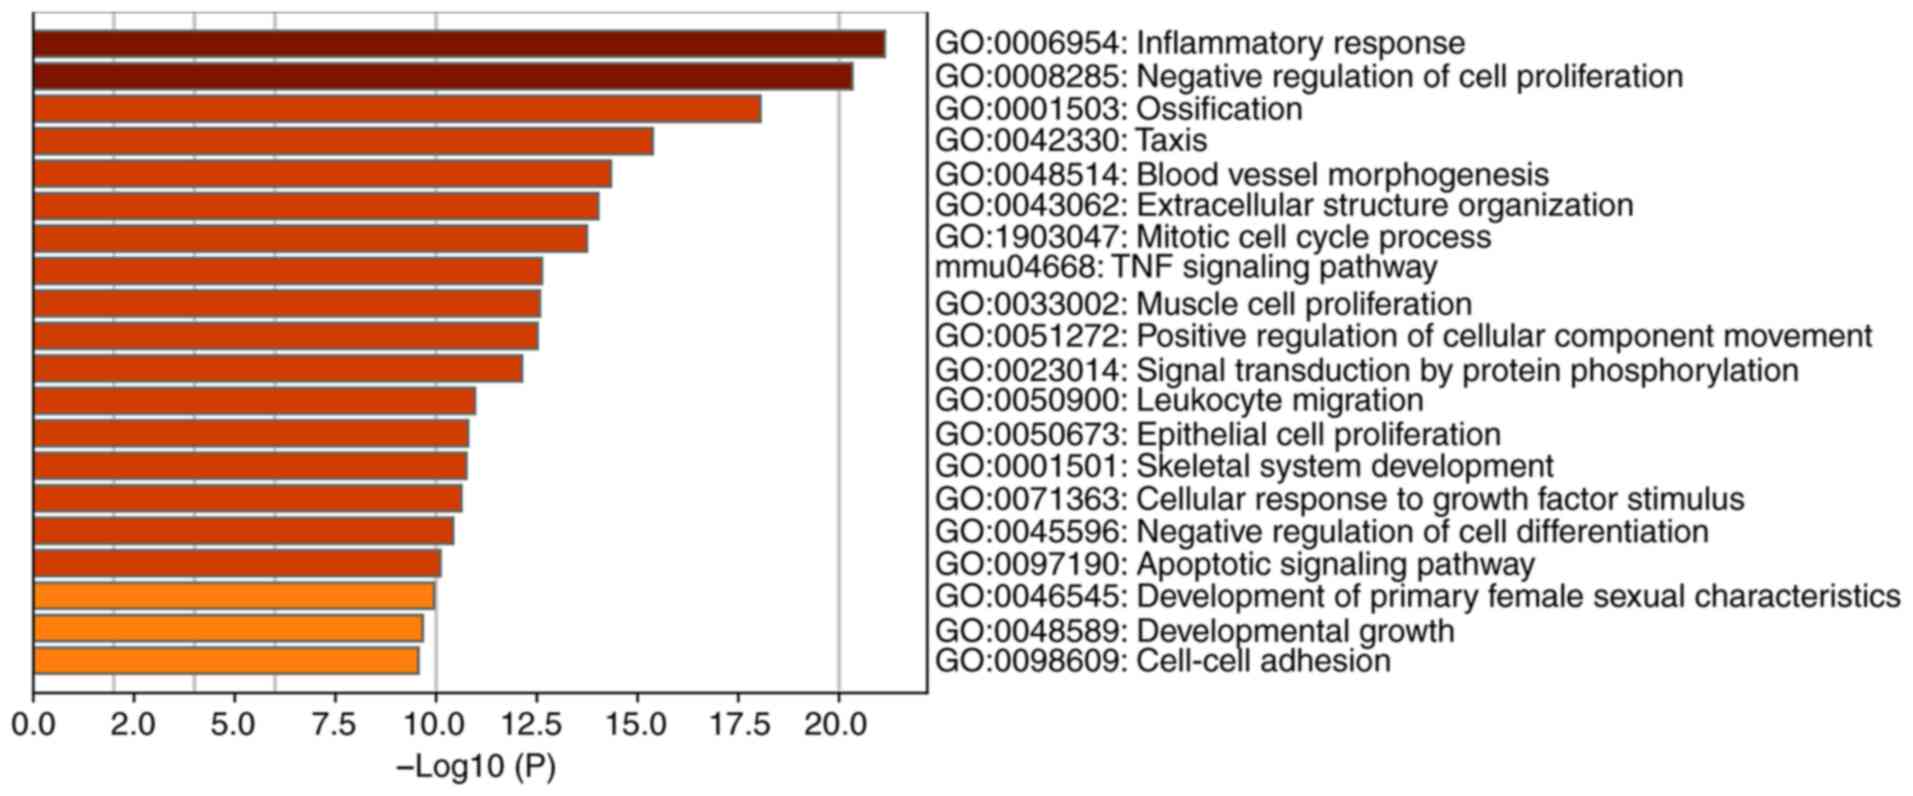
GO enrichment analysis of DEGs using the Metascape
online tool identified the enriched GO and KEGG terms, of which the
top 20 were as follows: ‘Inflammatory response’, ‘negative
regulation of cell proliferation’, ‘ossification’, ‘taxis’, ‘blood
vessel morphogenesis’, ‘extracellular structure organization’,
‘mitotic cell cycle process’, ‘TNF-α signaling pathway’, ‘muscle
cell proliferation’, ‘positive regulation of cellular component
movement’, ‘signal transduction by protein phosphorylation’,
‘leukocyte migration’, ‘epithelial cell proliferation’, ‘skeletal
system development’, ‘cellular response to growth factor stimulus’,
‘negative regulation of cell differentiation’, ‘apoptotic signaling
pathway’, ‘development of primary female sexual characteristics’
and ‘development growth and cell-cell adhesion’ (Fig. 2). Detailed information about the GO
and KEGG terms is presented in Table
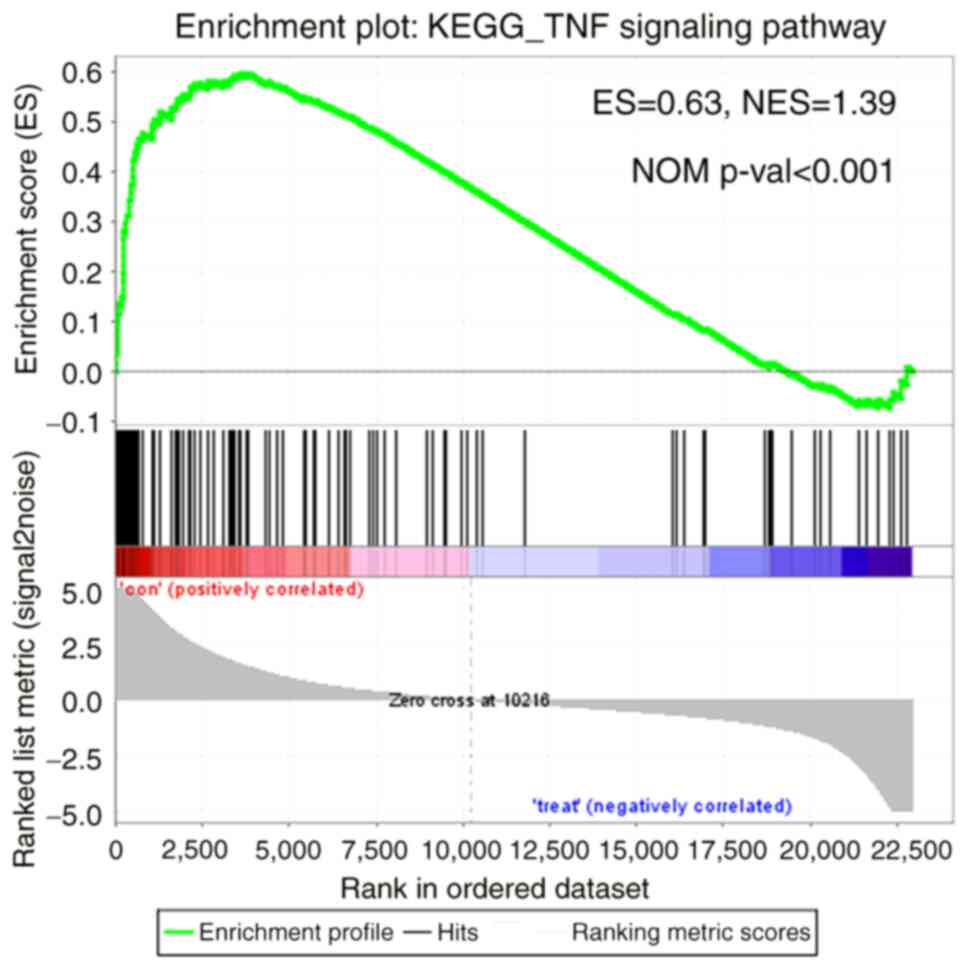
SI. GSEA was performed using the data profile of differentially
expressed mRNAs and the most significantly enriched KEGG pathway
was the TNF signaling pathway (Fig.
3).
PPI network and MCODE model in the
interaction network
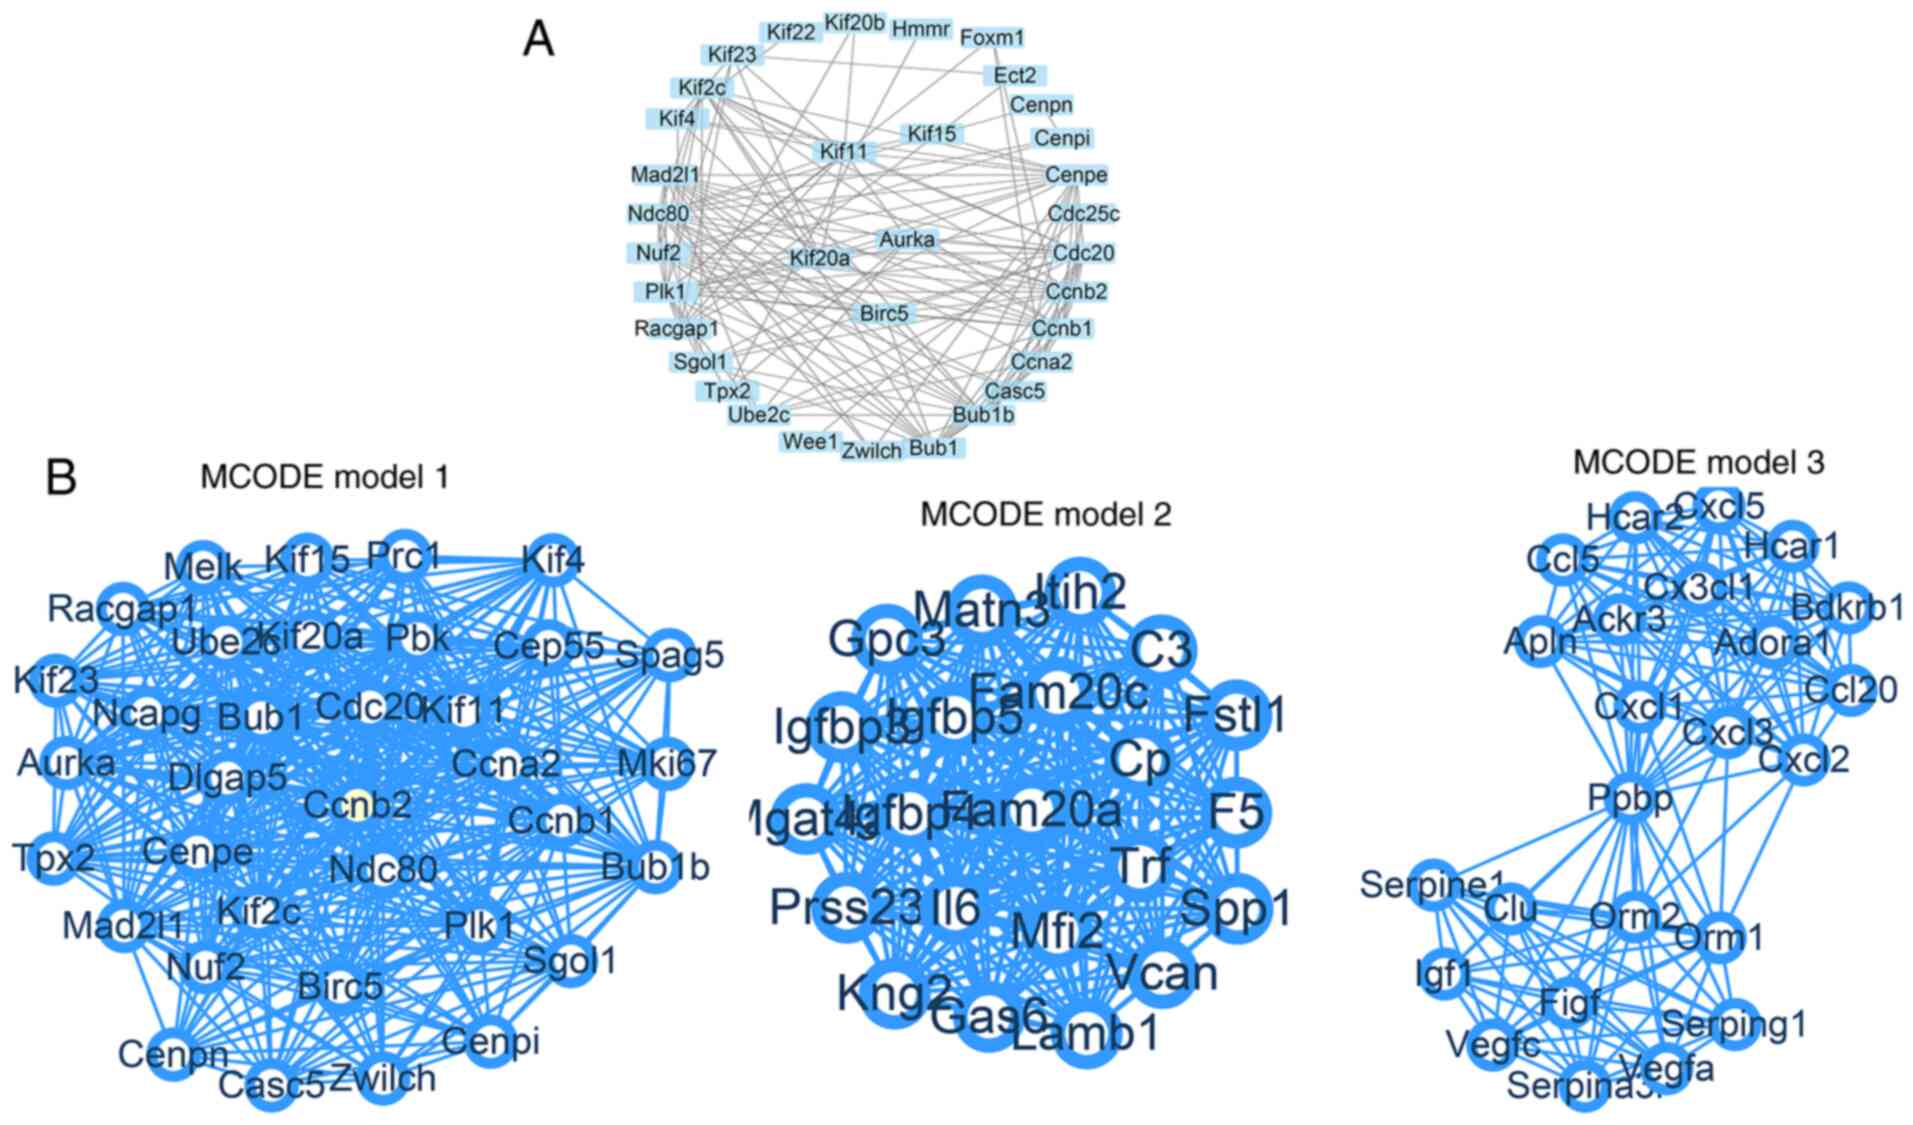
DEGs were entered into the STRING database to obtain
the gene connection network, which contained 778 nodes and 1,641
edges. The average node degree was 4.22 and the average local
clustering coefficient was 0.353. The PPI enrichment P-value was
<1.0x10⁻¹⁶ and was thus identified as statistically
significant (Fig. 4). The remaining
modules are shown in Fig. S1.
In order to improve the analysis of the PPI network,
14 modules were detected using the MCODE plugin. The top five
modules are presented in Fig.
5.
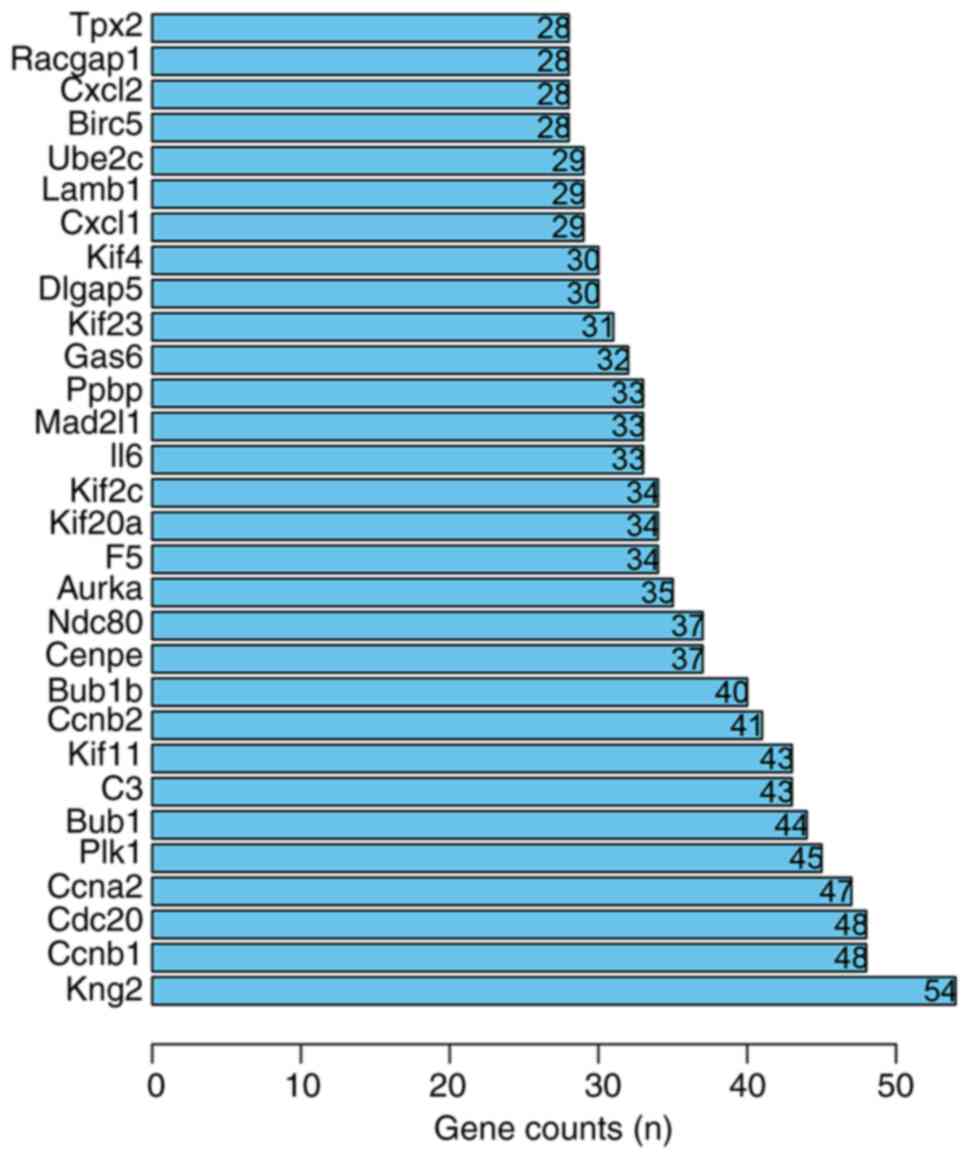 | Figure 5Top 30 core proteins of the
protein-protein interaction network. The names of the genes are
presented on the ordinate and the abscissa represents the number of
gene connections. Tpx2, TPX2 microtubule nucleation factor;
Racgap1, Rac GTPase activating protein 1; Cxcl, platelet factor 4;
Birc5, baculoviral IAP repeat containing 5; Ube2c, ubiquitin
conjugating enzyme E2 C; Lamb1, laminin subunit beta 1; Kif,
kinesin family member; Dlgap5, DLG associated protein 5; Gas6,
growth arrest specific 6; Ppbp, pro-platelet basic protein; Mad2l1,
mitotic arrest deficient 2 like 1; F5, coagulation factor V; Aurka,
aurora kinase A; Ndc80, NDC80 kinetochore complex component; Cenpe,
centromere protein E; Bub1b, BUB1 mitotic checkpoint
serine/threonine kinase B; Ccnb2, cyclin B2; C3, complement C3;
Bub1, BUB1 mitotic checkpoint serine/threonine kinase; Plk1, polo
like kinase 1; Ccna2, cyclin A2; Cdc20, cell division cycle 20;
Ccnb1, cyclin B1; Kng2, kininogen 2. |
Apoptosis and RT-qPCR results
To confirm that the cell model of OA was
successfully established, the Annexin V-FITC/PI assay was
performed. The results of the Annexin V-FITC/PI assay indicated
that after treatment with IL-1β, the apoptotic cells were
significantly increased ~3-fold compared with those in the control
group (7.5 vs. 23.5; P<0.05; Fig.
6A). To verify the bioinformatics results, RT-qPCR was used to
assess the top 10 hub genes in chondrocytes treated with IL-1b,
including three upregulated genes (KNG2, C3 and BUB1B) and seven
downregulated genes (CCNB1, CDC20, CCNA2, PIK1, BUB1, KIF11 and
CCNB2). All of the results in the present study were consistent
with the bioinformatics results (P<0.05; Fig. 6B).
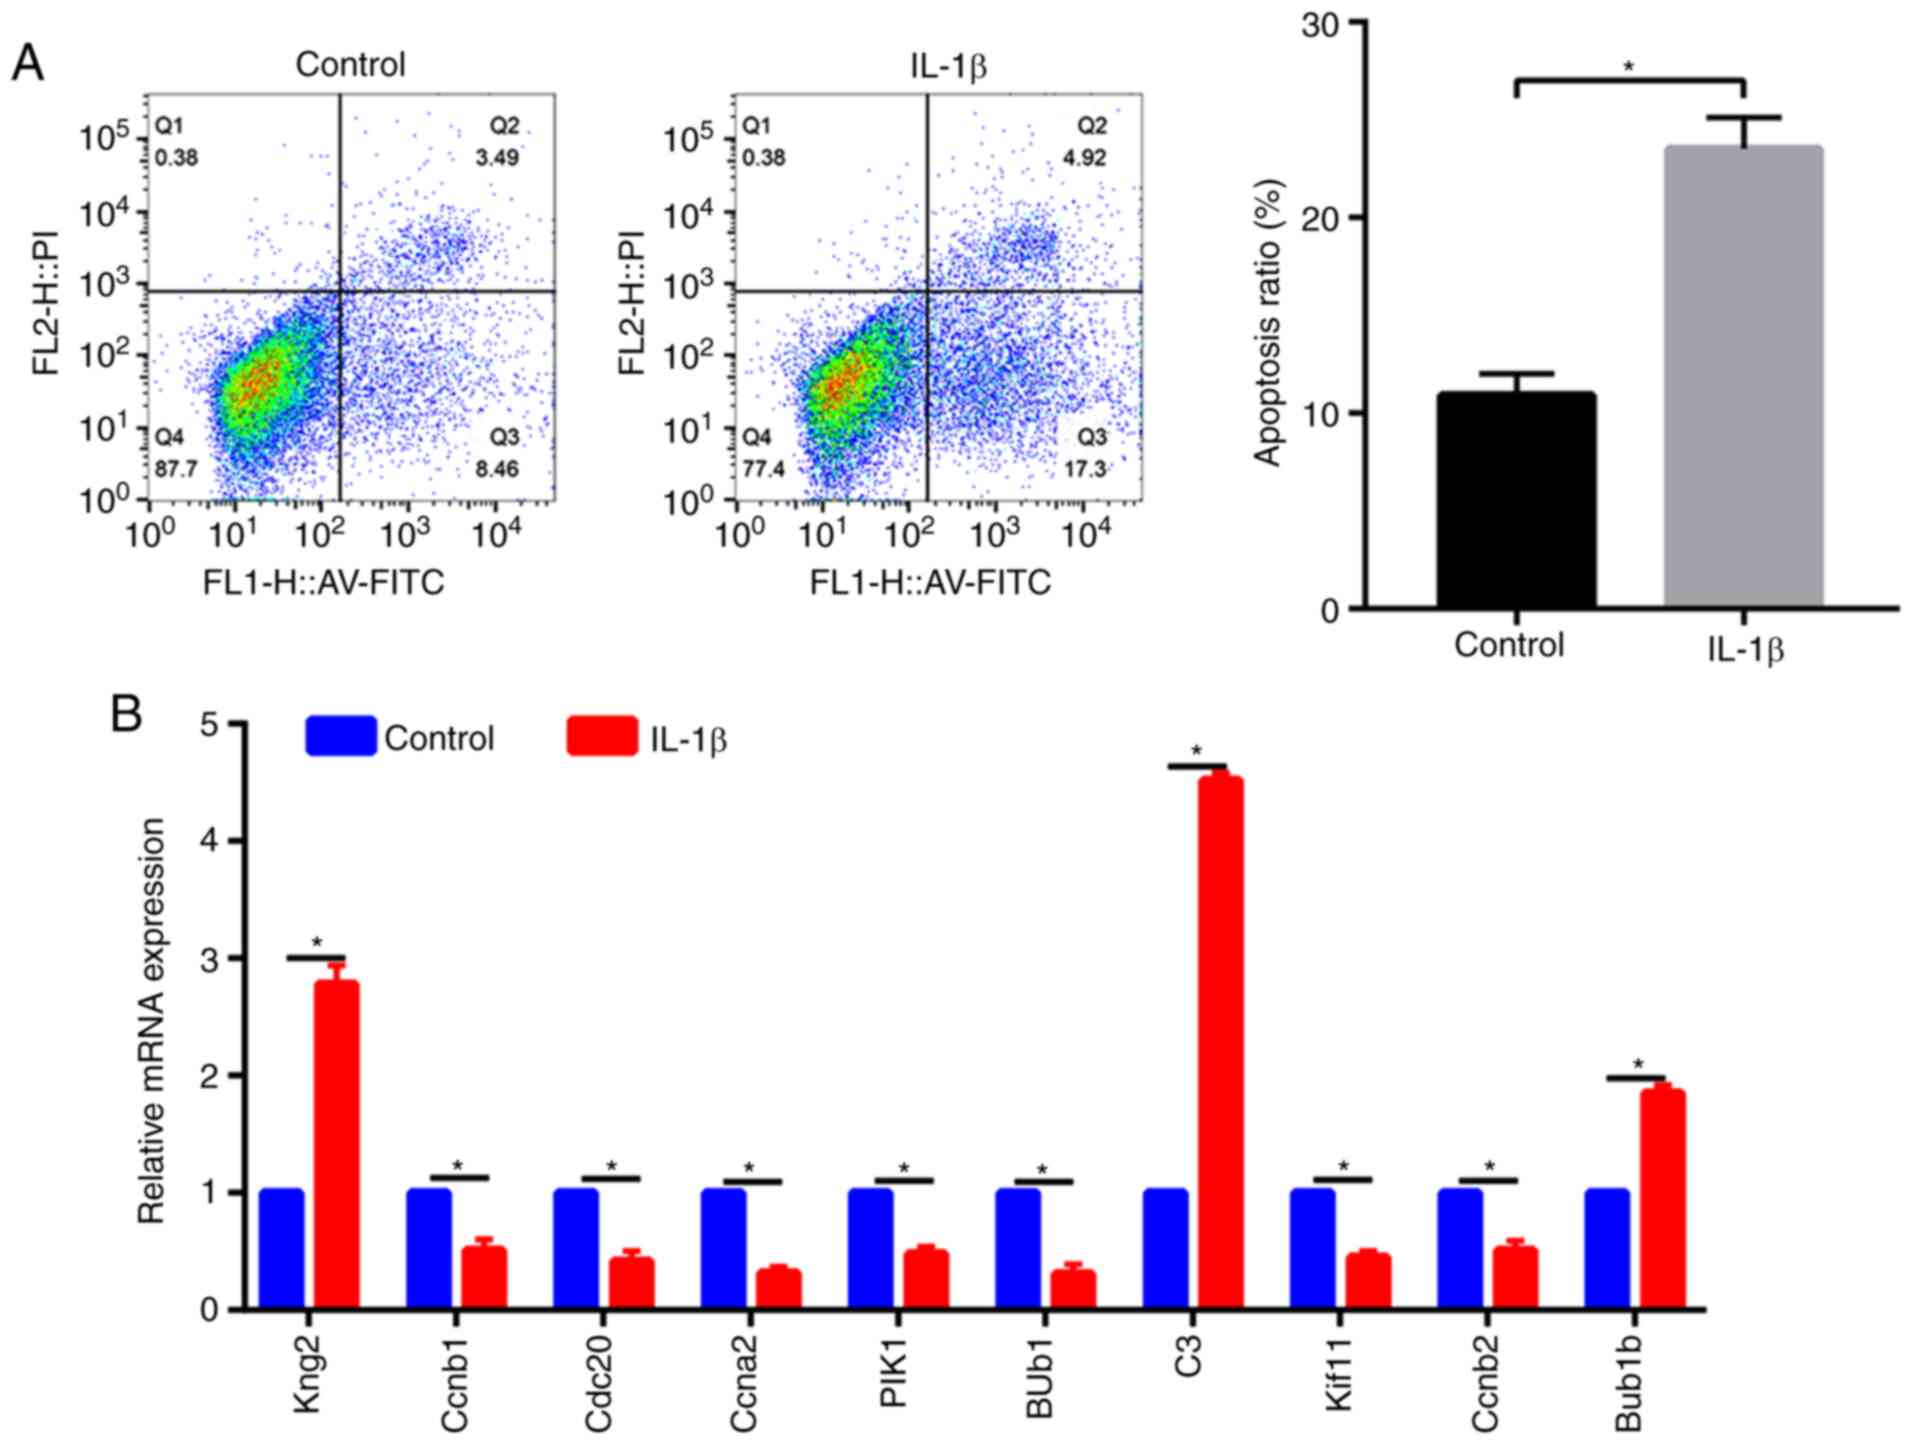 | Figure 6(A) Effects of IL-1β on the induction
of early apoptosis (AV-FITC staining) and late apoptosis (PI
staining) as measured by flow cytometry. (B) Reverse transcription
PCR analysis of the expression of the top 10 hub genes in
IL-1β-treated chondrocytes. *P<0.05. PI, propidium
iodide; IL, interleukin; AV, Annexin V; Q, quadrant. Kng2,
kininogen 2, Ccnb2, cyclin B2; Cdc20, cell division cycle 20;
Ccna2, cyclin A2; Plk1, polo like kinase 1; Bub, BUB mitotic
checkpoint serine/threonine kinase; C3, complement C3; Kif11,
kinesin family member 11. |
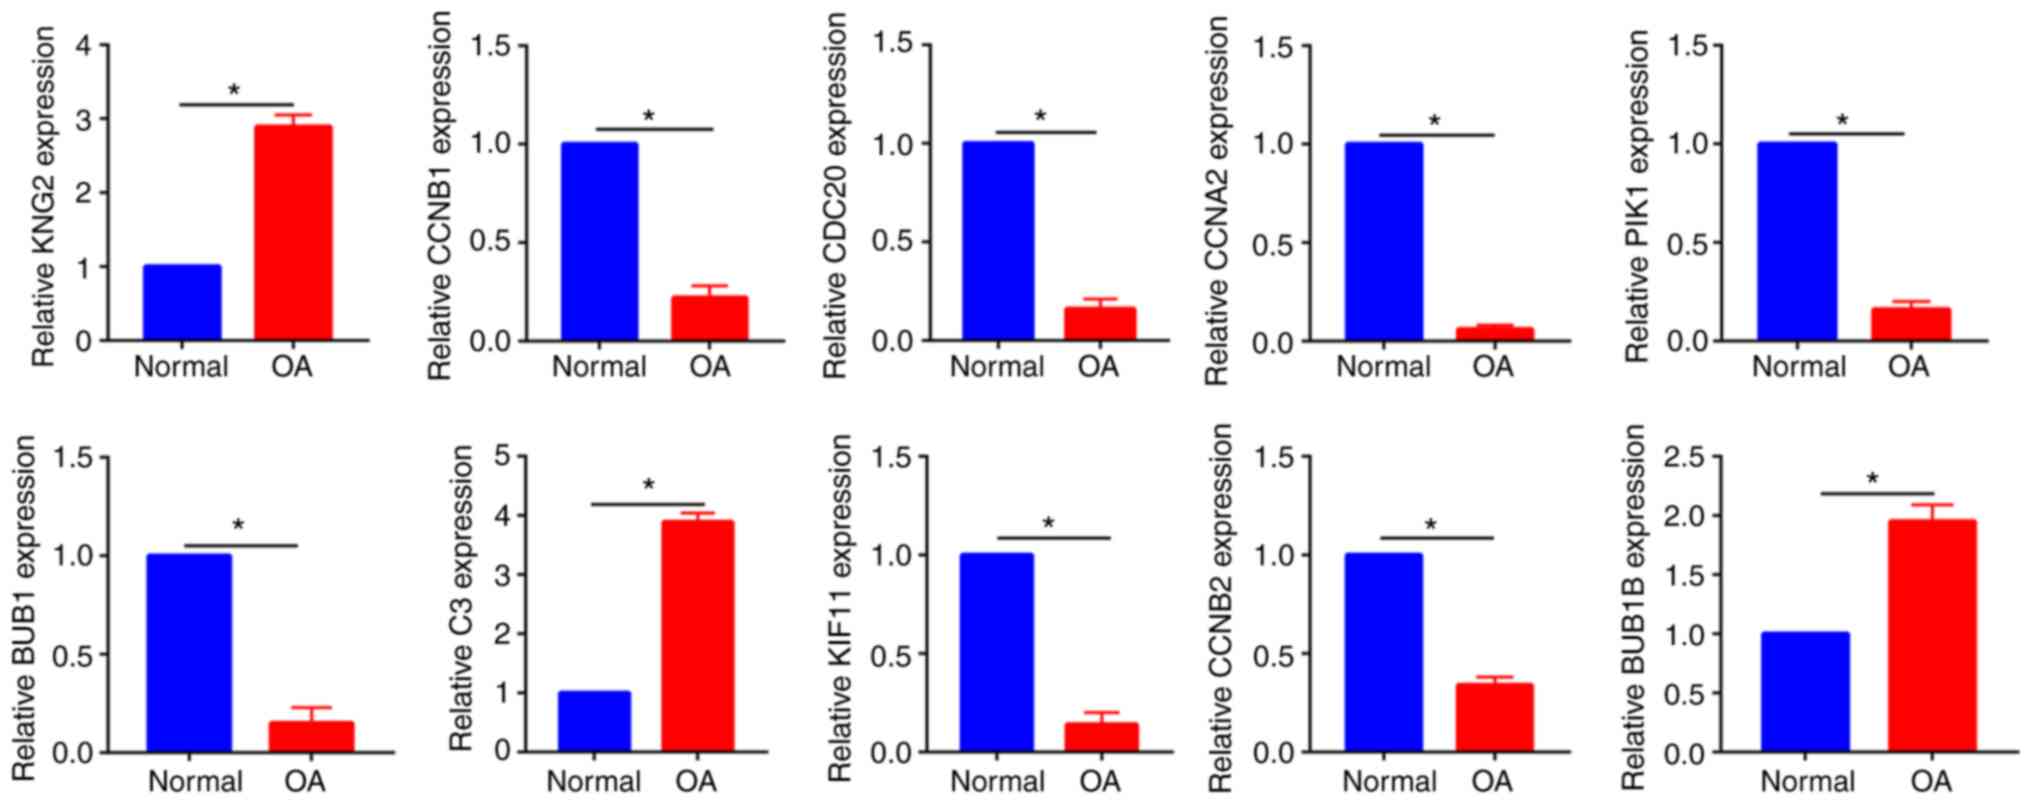
The top 10 hub genes were also measured in cartilage
samples from patients with OA and patients with normal cartilage.
The in vivo PCR results were in accordance with the in
vitro results, as the three upregulated genes (KNG2, C3 and
BUB1B) and seven downregulated genes (CCNB1, CDC20, CCNA2, PIK1,
BUB1, KIF11 and CCNB2) were identified from OA cartilage and normal
cartilage (Fig. 7).
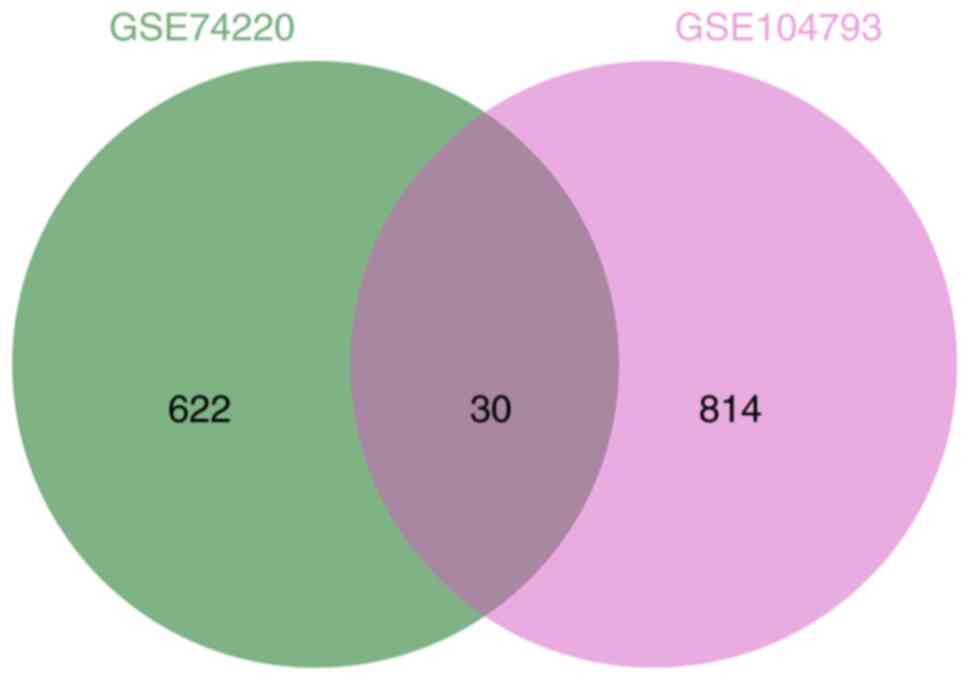
A Venn diagram was then created to identify the
overlapping genes between the GSE104793 and GSE74200 datasets. The
10 hub genes from the dataset GSE104793 were all identified from
the dataset GSE74200 also (Fig.
8).
Discussion
OA is a disease with a high incidence rate
worldwide, which eventually leads to joint dysfunction.
Inflammatory factor-induced chondrocyte apoptosis leads to
cartilage degradation and is considered to be key in the
pathological development of OA. Among these inflammatory factors,
cells challenged with IL-1β have been widely used to mimic
arthritis in in vitro studies. Previous studies have
indicated that apoptosis is significantly increased in IL-1β (10
ng/ml)-induced chondrocytes (22,23).
Bai et al (22) used
different concentrations of IL-1β (0.5, 1.0, 2.5, 5.0, 10.0 and
20.0 ng/ml) to injure chondrocytes and their results suggested that
the optimal dose of IL-1β was 10 ng/ml. Therefore, in the present
study, an IL-1β concentration of (10 ng/ml) was selected for
subsequent experiments.
Of note, the downstream genes induced following
IL-1β stimulation to promote chondrocyte apoptosis have remained
largely elusive, and their investigation was the purpose of the
present study.
First, the mRNA expression profile data for
IL-1β-treated chondrocytes were obtained. By using the Limma
package, a total of 844 DEGs were identified and the function of
these DEGs was further analyzed. A major result was that DEGs
following stimulation with IL-1β were mainly enriched in
‘inflammatory response’ (GO:0006954) and ‘negative regulation of
cell proliferation’ (GO:0008285). IL-1β, a member of the IL-1
family of cytokines, has a vital role in modulating the
inflammatory response and is also involved in the proliferation,
differentiation and apoptosis of multiple cell types, including
chondrocytes (11), macrophages
(24) and neuronal cells (25).
Another important finding was that IL-1β-stimulated
DEGs in chondrocytes were enriched in ‘ossification’. It is already
well known that endochondral ossification and OA are closely
associated (26). Furthermore,
anti-osteogenic reagents decrease the cartilage degeneration rate
(27). Considering the GO functions
of IL-1β-stimulated DEGs in chondrocytes, further studies should
focus on the association between ossification and chondrocyte
apoptosis.
Considering the results of the KEGG pathway
analysis, the present study linked the DEGs mainly with the TNF
signaling pathway. Hamasaki et al (28) performed a study that focused on
macrophages and cartilage fragments. The most significantly
enriched terms were ‘scavenger receptor activity’ and ‘TNF
signaling’. TNF-α is a member of TNF signaling and is able to
activate NF-κB signaling to induce cartilage damage (29). Ren et al (30) performed a bioinformatics analysis
that focused on the DEGs in knee OA in a rat model. The TNF
signaling pathway was also investigated in an in vivo model.
Thus, the detailed mechanisms underlying how the TNF signaling
pathway induces OA progression are worthy of in-depth
investigation.
The apoptotic signaling pathway was enriched by the
DEGs. Tew et al (31)
revealed that apoptosis and proliferation were two common
biological processes during OA progression. Treatment with IL-1β
also activated the apoptotic signaling pathway and thus, the
inhibition of IL-1β-induced chondrocyte apoptosis may delay OA
progression.
In the present study, RT-qPCR analysis was performed
in order to validate the results of the bioinformatics analysis.
Treatment with IL-1β at 10 ng/ml for 24 h was used to induce an
OA-like cell model. Apoptosis analysis was used to validate the
effects of IL-1β on chondrocyte apoptosis. The top 10 hub genes
were selected for further analysis. It was revealed that BUB1 was
significantly downregulated in IL-1β-treated chondrocytes. BUB1,
BUB1B, CCNB1, CCNB2 and CCNA2 are known to participate in the
mitotic cell cycle process (32).
The most significant hub gene was KNG2, which is preferentially
expressed in brown adipose tissue (33). Furthermore, KNG2 was regulated by
cold stress, which suggested a role in thermoregulation (34). KNG2 mainly participates in the
negative regulation of endopeptidase activity, signaling binding
and positive regulation of cytosolic calcium ion concentration.
These biological processes are all associated with cell apoptosis
and signaling transduction (35).
Another upregulated gene among the hub genes was C3. C3 was
reported to inhibit RhoA GTPase activity and finally regulate
Yes1-associated transcriptional regulator protein expression and
its downstream target gene connective tissue growth factor to
downregulate chondrocyte migration (36). Cyclin-dependent kinase (CDK)1 and
BUB1B are two inflammation-associated critical signaling molecules.
A previous study indicated that CDK1 and BUB1B were mainly involved
in cell cycle regulation and cell movement (37). CCNB1 and CDC20 were identified as
crucial genes associated with the pathogenesis and prognosis of
pancreatic adenocarcinoma (38) and
hepatocellular carcinoma (39,40).
CCNB1 and CDC20 were indicated to be associated with cell cycle and
cell proliferation and thus have an important role in tumor
progression (41). However, the
effects of these genes on OA progression have remained elusive. In
future studies, small interfering RNAs for KNG2 should be designed
in order to investigate the role of the KNG2 gene in OA
development.
The integrated bioinformatics analysis and
experimental validation of the present study had several
limitations that are worth mentioning. First, the results of the
bioinformatics analysis were based on pre-set criteria; changing
the cut-off criteria would ultimately affect the final results.
Furthermore, the protein expression levels of these hub genes in
each group were not assessed. Future studies should consider
performing gene-modification-based therapy to treat OA in
vivo and investigate the specific mechanisms of action.
In conclusion, in the present study, microarray data
analysis for OA was first performed and 844 DEGs were identified,
among which 498 DEGs were upregulated and 346 DEGs were
downregulated. The identified DEGs may be involved in the
inflammatory response, negative regulation of cell proliferation,
ossification and TNF signaling. BUB1, BUB1B, CCNB1, CCNB2 andCCNA2
were hub genes, which were further validated by RT-qPCR. The
functions of these DEGs require further verification using more
in vivo and in vitro experiments.
Supplementary Material
MCODE model of the differentially
expressed genes.
Detailed information about GO and KEGG
terms.
Acknowledgements
Not applicable.
Funding
No funding was received.
Availability of data and materials
The datasets used and/or analyzed during the current
study are available from the corresponding author on reasonable
request.
Authors' contributions
FL and LP designed the study. YGM and WH performed
the bioinformatic analysis. WBZ, MD and YML supervised the
experiments. WBZ, MD and YML supervised the experiments and
performed the in vitro experiments, including apoptotic
analysis and real-time PCR. All authors read and approved the final
version of the manuscript. FL and YML confirm the authenticity of
all the raw data.
Ethics approval and consent to
participate
The animal and human studies were approved by The
Ethics Committee of Renmin Hospital of Wuhan University (animal
approval no. 2019-YLS-0125) Wuhan, China. Written informed consent
was obtained from all human subjects.
Patient consent for publication
Not applicable.
Competing interests
The authors declare that they have no competing
interests.
References
|
1
|
Driban JB, Harkey MS, Barbe MF, Ward RJ,
MacKay JW, Davis JE, Lu B, Price LL, Eaton CB, Lo GH and McAlindon
TE: Risk factors and the natural history of accelerated knee
osteoarthritis: Anarrative review. BMC Musculoskelet Disord.
21(332)2020.PubMed/NCBI View Article : Google Scholar
|
|
2
|
Kraus VB and Karsdal MA: Osteoarthritis:
Current molecular biomarkers and the way forward. Calcif Tissue
Int: May 4, 2020 (Epub ahead of print).
|
|
3
|
Huang W, Ong TY, Fu SC and Yung SH:
Prevalence of patellofemoral joint osteoarthritis after anterior
cruciate ligament injury and associated risk factors: A systematic
review. J Orthop Translat. 22:14–25. 2019.PubMed/NCBI View Article : Google Scholar
|
|
4
|
Chen AT, Shrestha S, Collins JE, Sullivan
JK, Losina E and Katz JN: Estimating contextual effect in
nonpharmacological therapies for pain in knee osteoarthritis: A
systematic analytic review. Osteoarthritis Cartilage. 28:1154–1169.
2020.PubMed/NCBI View Article : Google Scholar
|
|
5
|
Luo P, Xiong Z, Sun W, Shi L, Gao F and Li
Z: How to Choose platelet-rich plasma or hyaluronic acid for the
treatment of knee osteoarthritis in overweight or obese patients: A
Meta-Analysis. Pain Res Manag. 2020(7587936)2020.PubMed/NCBI View Article : Google Scholar
|
|
6
|
Zhao Z, Ma JX and Ma XL: Different
Intra-articular injections as therapy for hip osteoarthritis: A
systematic review and network meta-analysis. Arthroscopy.
36:1452–1464.e2. 2020.PubMed/NCBI View Article : Google Scholar
|
|
7
|
Honvo G, Leclercq V, Geerinck A, Thomas T,
Veronese N, Charles A, Rabenda V, Beaudart C, Cooper C, Reginster
JY and Bruyère O: Safety of topical non-steroidal anti-inflammatory
drugs in osteoarthritis: Outcomes of a systematic review and
meta-analysis. Pharmacol Rep. 36 (Suppl 1):S45–S64. 2019.PubMed/NCBI View Article : Google Scholar
|
|
8
|
Gregori D, Giacovelli G, Minto C, Barbetta
B, Gualtieri F, Azzolina D, Vaghi P and Rovati LC: Association of
pharmacological treatments with long-term pain control in patients
with knee osteoarthritis: A systematic review and Meta-analysis.
JAMA. 320:2564–2579. 2018.PubMed/NCBI View Article : Google Scholar
|
|
9
|
Ahmad N, Ansari MY, Bano S and Haqqi TM:
Imperatorin suppresses IL-1β-induced iNOS expression via inhibiting
ERK-MAPK/AP1 signaling in primary human OA chondrocytes. Int
Immunopharmacol. 85(106612)2020.PubMed/NCBI View Article : Google Scholar
|
|
10
|
Dinarello CA: Blocking IL-1 in systemic
inflammation. J Exp Med. 201:1355–1359. 2005.PubMed/NCBI View Article : Google Scholar
|
|
11
|
Shen XF, Cheng Y, Dong QR and Zheng MQ:
MicroRNA-675-3p regulates IL-1β-stimulated human chondrocyte
apoptosis and cartilage degradation by targeting GNG5. Biochem
Biophys Res Commun. 527:458–465. 2020.PubMed/NCBI View Article : Google Scholar
|
|
12
|
Shao J, Ding Z, Peng J, Zhou R, Li L, Qian
Q and Chen Y: MiR-146a-5p promotes IL-1β-induced chondrocyte
apoptosis through the TRAF6-mediated NF-kB pathway. Inflamm Res.
69:619–630. 2020.PubMed/NCBI View Article : Google Scholar
|
|
13
|
Jia Y, He W, Zhang H, He L, Wang Y, Zhang
T, Peng J, Sun P and Qian Y: Morusin Ameliorates IL-1β-Induced
chondrocyte inflammation and osteoarthritis via NF-κB signal
pathway. Drug Des Devel Ther. 14:1227–1240. 2020.PubMed/NCBI View Article : Google Scholar
|
|
14
|
Wu Z, Irizarry RA, Gentleman R,
Martinez-Murillo F and Spencer F: A model-based background
adjustment for oligonucleotide expression arrays. J Am Statistical
Association. 99:909–917. 2004.
|
|
15
|
R Core Team: R: A Language and Environment
for Statistical Computing. R Foundation for Statistical Computing,
Vienna, 2013. http://www.R-project.org/.
|
|
16
|
Zhou Y, Zhou B, Pache L, Chang M,
Khodabakhshi AH, Tanaseichuk O, Benner C and Chanda SK: Metascape
provides a biologist-oriented resource for the analysis of
systems-level datasets. Nat Commun. 10(1523)2019.PubMed/NCBI View Article : Google Scholar
|
|
17
|
Kohl M, Wiese S and Warscheid B:
Cytoscape: Software for visualization and analysis of biological
networks. Methods Mol Biol. 696:291–303. 2011.PubMed/NCBI View Article : Google Scholar
|
|
18
|
Bi W, Huang W, Whitworth DJ, Deng JM,
Zhang Z, Behringer RR and de Crombrugghe B: Haploinsufficiency of
Sox9 results in defective cartilage primordia and premature
skeletal mineralization. Proc Natl Acad Sci USA. 98:6698–6703.
2001.PubMed/NCBI View Article : Google Scholar
|
|
19
|
Johnson CI, Argyle DJ and Clements DN: In
vitro models for the study of osteoarthritis. Vet J. 209:40–49.
2016.PubMed/NCBI View Article : Google Scholar
|
|
20
|
Chen X, Wang R, Chen W, Lai L and Li Z:
Decoy receptor-3 regulates inflammation and apoptosis via PI3K/AKT
signaling pathway in coronary heart disease. Exp Ther Med.
17:2614–2622. 2019.PubMed/NCBI View Article : Google Scholar
|
|
21
|
Zhao Z, Ma X, Ma J, Sun X, Li F and Lv J:
Naringin enhances endothelial progenitor cell (EPC) proliferation
and tube formation capacity through the CXCL12/CXCR4/PI3K/Akt
signaling pathway. Chem Biol Interact. 286:45–51. 2018.PubMed/NCBI View Article : Google Scholar
|
|
22
|
Bai M, Ge L, Chen H and Jin Q: Calcitonin
protects rat chondrocytes from IL-1β injury via the Wnt/β-catenin
pathway. Exp Ther Med. 18:2079–2085. 2019.PubMed/NCBI View Article : Google Scholar
|
|
23
|
Li Z, Cheng J and Liu J: Baicalin protects
human OA chondrocytes against IL-1β-induced apoptosis and ECM
degradation by activating autophagy via MiR-766-3p/AIFM1 axis. Drug
Des Devel Ther. 14:2645–2655. 2020.PubMed/NCBI View Article : Google Scholar
|
|
24
|
Fei Q, Ma H, Zou J, Wang W, Zhu L, Deng H,
Meng M, Tan S, Zhang H, Xiao X, et al: Metformin protects against
ischaemic myocardial injury by alleviating
autophagy-ROS-NLRP3-mediated inflammatory response in macrophages.
J Mol Cell Cardiol. 145:1–13. 2020.PubMed/NCBI View Article : Google Scholar
|
|
25
|
Liu X, Chen Y, Wang H, Wei Y, Yuan Ye,
Zhou Q, Fang F, Shi S, Jiang X, Dong Y and Li X: Microglia-derived
IL-1β promoted neuronal apoptosis through ER stress-mediated
signaling pathway PERK/eIF2α/ATF4/CHOP upon arsenic exposure. J
Hazard Mater,. 417(125997)2021.PubMed/NCBI View Article : Google Scholar
|
|
26
|
Hosaka Y, Saito T, Sugita S, Hikata T,
Kobayashi H, Fukai A, Taniguchi Y, Hirata M, Akiyama H, Chung UI
and Kawaguchi H: Notch signaling in chondrocytes modulates
endochondral ossification and osteoarthritis development. Proc Natl
Acad Sci USA. 110:1875–1880. 2013.PubMed/NCBI View Article : Google Scholar
|
|
27
|
Hsiao HY, Cheng CM, Kao SW, Liu JW, Chang
CS, Harhaus L and Huang JJ: The effect of bone inhibitors on
periosteum-guided cartilage regeneration. Sci Rep.
10(8372)2020.PubMed/NCBI View Article : Google Scholar
|
|
28
|
Hamasaki M, Terkawi MA, Onodera T, Tian Y,
Ebata T, Matsumae G, Alhasan H, Takahashi D and Iwasaki N:
Transcriptional profiling of murine macrophages stimulated with
cartilage fragments revealed a strategy for treatment of
progressive osteoarthritis. Sci Rep. 10(7558)2020.PubMed/NCBI View Article : Google Scholar
|
|
29
|
Gao Y, Wang S, He L, Wang C and Yang L:
Alpinetin protects chondrocytes and exhibits anti-inflammatory
effects via the NF-κB/ERK pathway for alleviating osteoarthritis.
Inflammation. 43:1742–1750. 2020.PubMed/NCBI View Article : Google Scholar
|
|
30
|
Ren YM, Zhao X, Yang T, Duan YH, Sun YB,
Zhao WJ and Tian MQ: Exploring the key genes and pathways of
osteoarthritis in knee cartilage in a rat model using gene
expression profiling. Yonsei Med J. 59:760–768. 2018.PubMed/NCBI View Article : Google Scholar
|
|
31
|
Tew SR, Kwan AP, Hann A, Thomson BM and
Archer CW: The reactions of articular cartilage to experimental
wounding: Role of apoptosis. Arthritis Rheum. 43:215–225.
2000.PubMed/NCBI View Article : Google Scholar
|
|
32
|
Sun J, Yan B, Yin W and Zhang X:
Identification of genes associated with osteoarthritis by
microarray analysis. Mol Med Rep. 12:5211–5216. 2015.PubMed/NCBI View Article : Google Scholar
|
|
33
|
Peyrou M, Cereijo R, Quesada-López T,
Campderrós L, Gavaldà-Navarro A, Liñares-Pose L, Kaschina E, Unger
T, López M, Giralt M and Villarroya F: The kallikrein-kinin pathway
as a mechanism for auto-control of brown adipose tissue activity.
Nat Commun. 11(2132)2020.PubMed/NCBI View Article : Google Scholar
|
|
34
|
Rouhiainen A, Kulesskaya N, Mennesson M,
Misiewicz Z, Sipilä T, Sokolowska E, Trontti K, Urpa L, McEntegart
W, Saarnio S, et al: The bradykinin system in stress and anxiety in
humans and mice. Sci Rep. 9(19437)2019.PubMed/NCBI View Article : Google Scholar
|
|
35
|
Sharma SK and Singh BR: Enhancement of the
endopeptidase activity of purified botulinum neurotoxins A and E by
an isolated component of the native neurotoxin associated proteins.
Biochemistry. 43:4791–4798. 2004.PubMed/NCBI View Article : Google Scholar
|
|
36
|
Jing X, Ye Y, Bao Y, Zhang J, Huang J,
Wang R, Guo J and Guo F: Mechano-growth factor protects against
mechanical overload induced damage and promotes migration of growth
plate chondrocytes through RhoA/YAP pathway. Exp Cell Res.
366:81–91. 2018.PubMed/NCBI View Article : Google Scholar
|
|
37
|
Kim EJ, Oh HY, Heo HS, Hong JE, Jung SJ,
Lee KW and Park JH, Hur CG and Park JH: Biological features of core
networks that result from a high-fat diet in hepatic and pulmonary
tissues in mammary tumour-bearing, obesity-resistant mice. Br J
Nutr. 110:241–255. 2013.PubMed/NCBI View Article : Google Scholar
|
|
38
|
Shi LE, Shang X, Nie KC, Xu Q, Chen NB and
Zhu ZZ: Identification of potential crucial genes associated with
the pathogenesis and prognosis of pancreatic adenocarcinoma. Oncol
Lett. 20(60)2020.PubMed/NCBI View Article : Google Scholar
|
|
39
|
Mi N, Cao J, Zhang J, Fu W, Huang C, Gao
L, Yue P, Bai B, Lin Y, Meng W and Li X: Identification of hub
genes involved in the occurrence and development of hepatocellular
carcinoma via bioinformatics analysis. Oncol Lett. 20:1695–1708.
2020.PubMed/NCBI View Article : Google Scholar
|
|
40
|
Meng Z, Wu J, Liu X, Zhou W, Ni M, Liu S,
Guo S, Jia S and Zhang J: Identification of potential hub genes
associated with the pathogenesis and prognosis of hepatocellular
carcinoma via integrated bioinformatics analysis. J Int Med Res.
48(300060520910019)2020.PubMed/NCBI View Article : Google Scholar
|
|
41
|
Chen C, Guo Q, Song Y, Xu G and Liu L:
SKA1/2/3 serves as a biomarker for poor prognosis in human lung
adenocarcinoma. Transl Lung Cancer Res. 9:218–231. 2020.PubMed/NCBI View Article : Google Scholar
|