Introduction
Osteosarcoma is the most common tumor of bone and
derives from primitive bone-forming mesenchymal cells (1,2).
Patients with advanced osteosarcoma fail to respond to conventional
treatments, such as surgical resection, chemoradiation followed by
neoadjuvant chemotherapy and local radiotherapy (3,4).
Therefore, the prognosis for the majority of patients with
osteosarcoma is poor (5,6). Notably, researchers have discovered
certain molecular targets associated with osteosarcoma (7-12).
Further promising tumor molecular targets remain to be
investigated.
Gene Expression Omnibus (GEO) (13) is a public functional genomics data
repository of high throughout gene expression data, chips and
microarrays. Microarray and bioinformatics analyses have been
widely used to screen genetic alterations in various types of
tumor, such as breast cancer and follicular lymphoma (14-16).
In addition, gene expression level signatures and biological
processes are identified using microarray and bioinformatics
analyses (17,18). Moreover, promising targets for
tumors have also been distinguished. For example, researchers
identified the role of microRNA (miR)-101-3p and its functional
role in hepatocellular carcinoma using bioinformatics (19); Zhou et al (20) screened 15 hub genes and pathways to
identify potential prognostic markers for hepatocellular carcinoma
treatment using bioinformatics analysis (20). Integrative bioinformatics have
identified links between HNF1 homeobox B with clear cell carcinoma
and tumor-associated thrombosis (21), and long non-coding RNA
HOXA11-antisense RNA has been demonstrated to have clinical
relevance and effects in non-small cell lung cancer (22).
In the present study, bioinformatics analyses were
performed to elucidate new targets to provide novel therapeutic
targets for the treatment of osteosarcoma In order to select
differentially expressed genes (DEGs) in osteosarcoma tissue, gene
expression level profiling data was downloaded from the Gene
Expression Omnibus (GEO) database. Secondly, Gene Ontology (GO)
functional annotation analysis and Kyoto Encyclopedia of Genes and
Genomes (KEGG) pathway enrichment analysis were performed for the
screened DEGs. Subsequently, a protein-protein interaction (PPI)
network was established and Cytoscape software was applied to
select hub genes associated with osteosarcoma. Survival analysis of
these hub genes was performed using the online database
Kaplan-Meier plotter. Oncomine and Gene Expression Profiling
Interactive Analysis (GEPIA) databases were used to further confirm
the expression levels of hub genes. Notably, a series of functional
experiments indicated that knockdown of the core gene centromere
protein F (CENPF) suppressed proliferation, migration and invasion
in osteosarcoma cell lines.
Materials and methods
Microarray data
Using the GEO database (ncbi.nlm.nih.gov/geo/), three gene expression level
profiles [GSE37552(23),
GSE9508(24) and GSE19357] were
selected based on the platforms GPL570 [(HG-U133_Plus_2) Affymetrix
Human Genome U133 Plus 2.0 Array], GPL6076 (Agilent-Whole Human
Genome Oligo Microarray G4112A condensed) and GPL6244
(HuGene-1_0-st) Affymetrix Human Gene 1.0 ST Array [transcript
(gene) version], respectively.
DEGs profiles
Using the GEO2R (25) online analysis tool (ncbi.nlm.nih.gov/geo/geo2r/), DEGs were
identified between osteosarcoma and normal tissue. The DEGs were
calculated with thresholds of P<0.05 and |log fold-change
(FC)|>1.00. Intersections between each dataset were obtained
using the Venn diagram tool (bioinformatics.psb.ugent.be/webtools/Venn/).
Functional and pathway enrichment
analysis
GO (26) annotations
were downloaded from GO. KEGG (27)
pathway enrichment analysis of DEGs was applied to determine
enriched signaling pathways. Metascape tool (metascape.org/gp/index.html) was used for annotation.
P<0.01 and gene count >3 were considered to indicate a
statistically significant result.
Hub genes selection
A PPI network was constructed using STRING (V11.5,
Swiss) database (https:string-db.org/). Visualization
of PPI networks was performed using Cytoscape software (V3.7.2,
BioStar team; https://apps.cytoscape.org/apps/mcode). Hub genes from
DEGs were further defined according to module connectivity in the
PPI network. Highly interconnected nodes indicated greater
essential connectivity. CytoHubba (28) add-on to the aforementioned Cytoscape
was used to determine the connectivity of each node measured by
degree, density of maximum neighborhood component (DMNC), maximal
clique centrality (MCC) and mononuclear cell counts (MNC).
Molecular Complex Detection (MCODE)
analysis
A Cytoscape plugin, MCODE (29), was used to identify significant
molecular complexes in the PPI network. Corresponding networks of
gene modules were annotated using the UniProt database (uniprot.org/).
Survival analysis of hub genes
Clinical and gene expression level data were
analyzed using the Kaplan-Meier plotter (kmplot.com/analysis/) database. The prognostic values
of hub genes were analyzed in patients with osteosarcoma. All cases
were grouped according to the median value of mRNA expression
levels. P<0.05 was considered to indicate a statistically
significant difference.
GEPIA and Oncomine database for data
validation
GEPIA (gepia.cancer-pku.cn/), was applied to analyze RNA
sequencing expression level data. The Oncomine (oncomine.org/resource/main.html)
database was used to confirm the expression levels of the eight hub
genes.
Cell culture
Osteosarcoma cell lines MG-63 and U-2OS were
obtained from Cell Resource Center, Shanghai Institutes for
Biological Sciences at the Chinese Academy of Sciences. The MG-63
cells and U-2OS cells were cultured in minimal essential medium
(MEM) and McCoy's 5A medium (Hyclone; Cytiva), respectively,
supplemented with 10% FBS (Gibco; Thermo Fisher Scientific, Inc.),
1% penicillin and streptomycin (Hyclone; Cytiva) under a controlled
atmosphere with 5% CO2 at 37˚C and relative humidity of
85-95%.
Reverse transcription-quantitative PCR
(RT-qPCR)
Total RNA in cells was extracted using
TRIzol® reagent (Invitrogen; Thermo Fisher Scientific,
Inc.). The concentration of RNA samples was then measured using a
spectrophotometer. Total RNA was reverse-transcribed into
first-strand complementary DNA using a Primescript RT reagent kit
according to the manufacturer's protocol (Takara Bio, Inc.). For
qPCR, 2X SYBR Green qPCR Master Mix (Suzhou Yuheng Biological
Technology Co., Ltd.) was used on an ABI 7900 system (Applied
Biosystems; Thermo Fisher Scientific, Inc.). The primer sequences
used were as follows: CENPF forward, 5'-CGTCCCCGAGAGCAAGTTTATT-3',
and reverse, 5'-ACTGCCTTTGCTGCTTTTCC-3'; GAPDH forward,
5'-GCTCTCTGCTCCTCCTGTTC-3', and reverse,
5'-CGACCAAATCCGTTGACTCC-3'. Amplification conditions were as
follows: 95˚C for 30 sec, followed by 40 cycles at 95˚C for 15 sec
and 60˚C for 45 sec. The relative change in mRNA expression levels
was calculated according to the 2-ΔΔCq method (30).
Transfection
Small interfering (si)RNA1 (si-CENPF-1), siRNA2
(si-CENPF-2) and negative control (NC) siRNA (non-targeting
sequence) were purchased from Sangon Biotech Co., Ltd. MG-63 and
U-2OS cells were incubated at 37˚C with 5% CO2 for 24 h,
and subsequently plated and transfected with 3.125 nm of si-NC,
si-CENPF-1 or si-CENPF-2 at a density of 3,000 cells/well for use
in the CCK-8 assay. Moreover, a total of 1x10⁵
cells/well were plated and transfected with 50 nm si-NC, si-CENPF-1
or si-CENPF-2 for the wound healing and Transwell assays. All
transfections were carried out using LipoHigh transfection reagent
(Sangon Biotech Co., Ltd.) for 4 h after plated for 16-24 h. The
cells were collected after 48 h for use in subsequent experiments.
The sequences were as follows: siRNA NC,
5'-TTCTCCGAACGTGTCACGTdTdT-3'; si-CENPF-1 (Sense),
5'-GCAGAATCTTAGTAGTCAA-3'; and si-CENPF-2 (sense),
5'-GCAACCATCTACTTGAAGA-3'. The level of transfection efficiency was
higher for si-CENPF-2 compared with that of si-CENPF-1, and it was
therefore selected for subsequent assays.
Western blotting
The protein expression levels of CENPF were detected
by western blotting. The transfected MG-63 and U-2OS cells were
washed with pre-cooled PBS on ice and then boiled for 10 min in
SDS-sample buffer (Beyotime Institute of Biotechnology). The
concentration of protein was determined using a BCA assay according
to the manufacturer's instructions (Sangon Biotech Co., Ltd.), and
the absorbance was read at 570 nm using Thermo Multiskan FC
(version, US6111636; Thermo Fisher Scientific, Inc.). A total of 30
µg protein lysates/per lane were separated by electrophoresis with
10% SDS-PAGE. Afterwards, the samples were transferred to PVDF
membranes. Membranes were blocked for 1 h with 5% skimmed milk at
room temperature, and then incubated at 4˚C overnight with the
following primary antibodies from ABclonal Biotech Co., Ltd.: GAPDH
(1:1,000; cat. no. AC002) and CENPF (1:1,000; cat. no. A18644).
Subsequently, membranes were incubated at 37˚C for 1 h with the
GAPDH HRP goat anti-mouse IgG (1:10,000; cat. no. AS003) and CENPF
goat anti-rabbit IgG (1:10,000; cat. no. AS014) secondary
antibodies from ABclonal Biotech Co., Ltd. Bands were visualized
using chemiluminescence HRP Substatet (MilliporeSigma). The Bio-Rad
gel Doc XR + system (Bio-Rad Laboratories, Inc.) was used to scan
the gel images. ImageJ (version, 1.53e; National Institutes of
Health) was used for grayscale analysis. GAPDH was used as an
internal control.
Cell proliferation assay
Cell Counting Kit-8 (CCK-8) assays (Beyotime
Institute of Biotechnology) were performed according to the
manufacturer's protocol. MG-63 and U-2OS cells were seeded in
96-well plates at a density of 3,000 cells/well and transfected at
16-24 h, and subsequently cultured at 37˚C in a 5% CO2
incubator. CCK-8 was added to each well at 0, 24, 48 and 72 h after
transfection. Following incubation for 1 h at 37˚C, the absorbance
at 450 nm was read using Thermo Multiskan FC (version, US6111636;
Thermo Fisher Scientific, Inc.). A total of three independent
repeats were performed.
Wound healing assay
MG-63 and U-2OS cells were seeded in 6-well plates
at a density of 1x10⁵ cells/well, cultured for ~16-24 h
and transfected. Cells were used at ~80-90% confluence on the day
of transfection. LipoHigh transfection reagent (5 µl/well; Sangon
Biotech Co., Ltd.) and corresponding RNA (100 pmol/well) were
added. After transfection for 4-6 h, cells were uniformly scratched
using a sterile pipette, washed with PBS and then respectively
cultured in MEM and McCoy's 5A medium (Hyclone; Cytiva) with 2% FBS
for 72 h at 37˚C in a 5% CO2 incubator. The wound images
were observed and captured using an optical microscope at
(magnification, x40; version, CKX41; Olympus Corporation) at 0, 24,
48 and 72 h. The quantification data for wound closure assay was
calculated using the following formula: Distance wound
closed=initial wound width-final wound width; wound closure
rate=distance wound closed/initial wound width.
Transwell assays
Transwell migration assays were performed, and a
total of 1x10⁴ MG-63 and U-2OS cells were seeded into
the top chamber in serum-free medium, and medium containing 10% FBS
was placed in the bottom chamber. Migrated cells were fixed in 4%
polyformaldehyde for 30 min at room temperature, and subsequently
stained with 0.1% crystal violet for 20 min at room temperature.
Five views per group were selected and images were captured at x100
magnification using a light microscope. A total of three
independent repeats was performed.
Transwell invasion assays were also performed using
Millipore Transwell chambers. Transfected cells were resuspended in
serum-free MEM or McCoy's 5A medium and placed in the upper
chamber, previously coated with Matrigel (BD Biosciences) at 37˚C
for 6 h, while MEM or McCoy's 5A medium containing 10% FBS was
added to the lower chamber. Following incubation for 24 h at 37˚C
in a 5% CO2 incubator, cells in the upper membrane were
removed with cotton swabs, whereas invaded cells were fixed in 4%
polyformaldehyde for 30 min at room temperature and stained with
0.1% crystal violet for 20 min at room temperature. Five views per
group were selected and images were captured at x100 magnification
using an optical microscope. A total of three independent repeats
was performed.
Statistical analysis
All data were analyzed with GraphPad Prism 7.0
software (GraphPad Software, Inc.) and are expressed as the mean ±
standard deviation. Paired student's t-test was used to analyze
differences between two groups. One-way ANOVA followed by Dunnett's
post hoc multiple comparisons test were used to analyze differences
between >2 groups. All experiments were performed in triplicate.
P<0.05 was considered to indicate a statistically significant
difference.
Results
Selection of three gene expression
level profiles and identification of DEGs
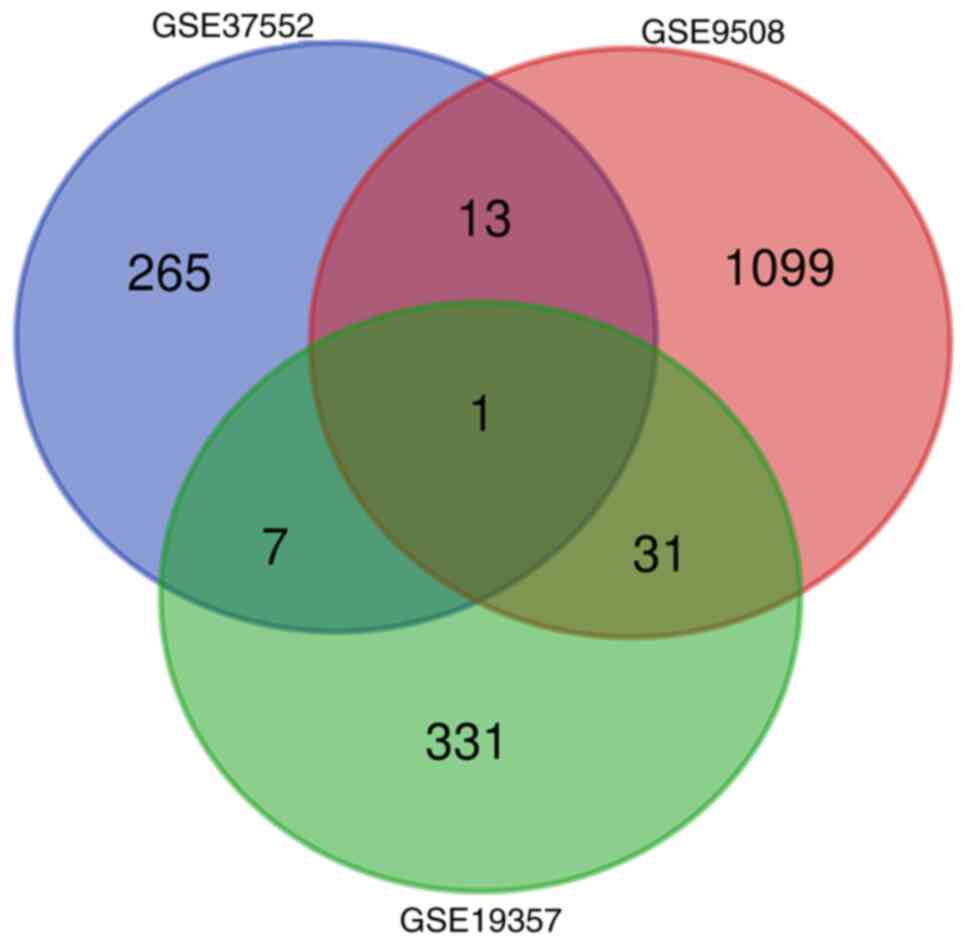
A total of three gene expression level profiles were
selected. GSE37552 consisted of two metastatic samples and two
non-metastatic samples; GSE9508 included 13 samples from
non-metastatic patients and 21 samples from metastatic patients;
GSE19357 contained five frozen bone tumor biopsies (two
osteochondromas, two cases of unusual parosteal osteochondromatous
proliferation and one subungual exostosis). In total, 52 DEGs were
identified in accordance with the criteria of P<0.05 and
|logFC|>1: Seven overlapping genes in GSE37552 and GSE19357; 13
overlapping genes in GSE37552 and GSE9508; 31 overlapping genes in
GSE19357 and GSE9508; and one overlapping gene in GSE37552, GSE9508
and GSE19357. Venn diagram analysis presents the intersection of
DEGs (Fig. 1). Subsequently, seven
overlapping DEGs were selected from three gene expression
profiles.
GO term and KEGG enrichment analyses
of DEGs
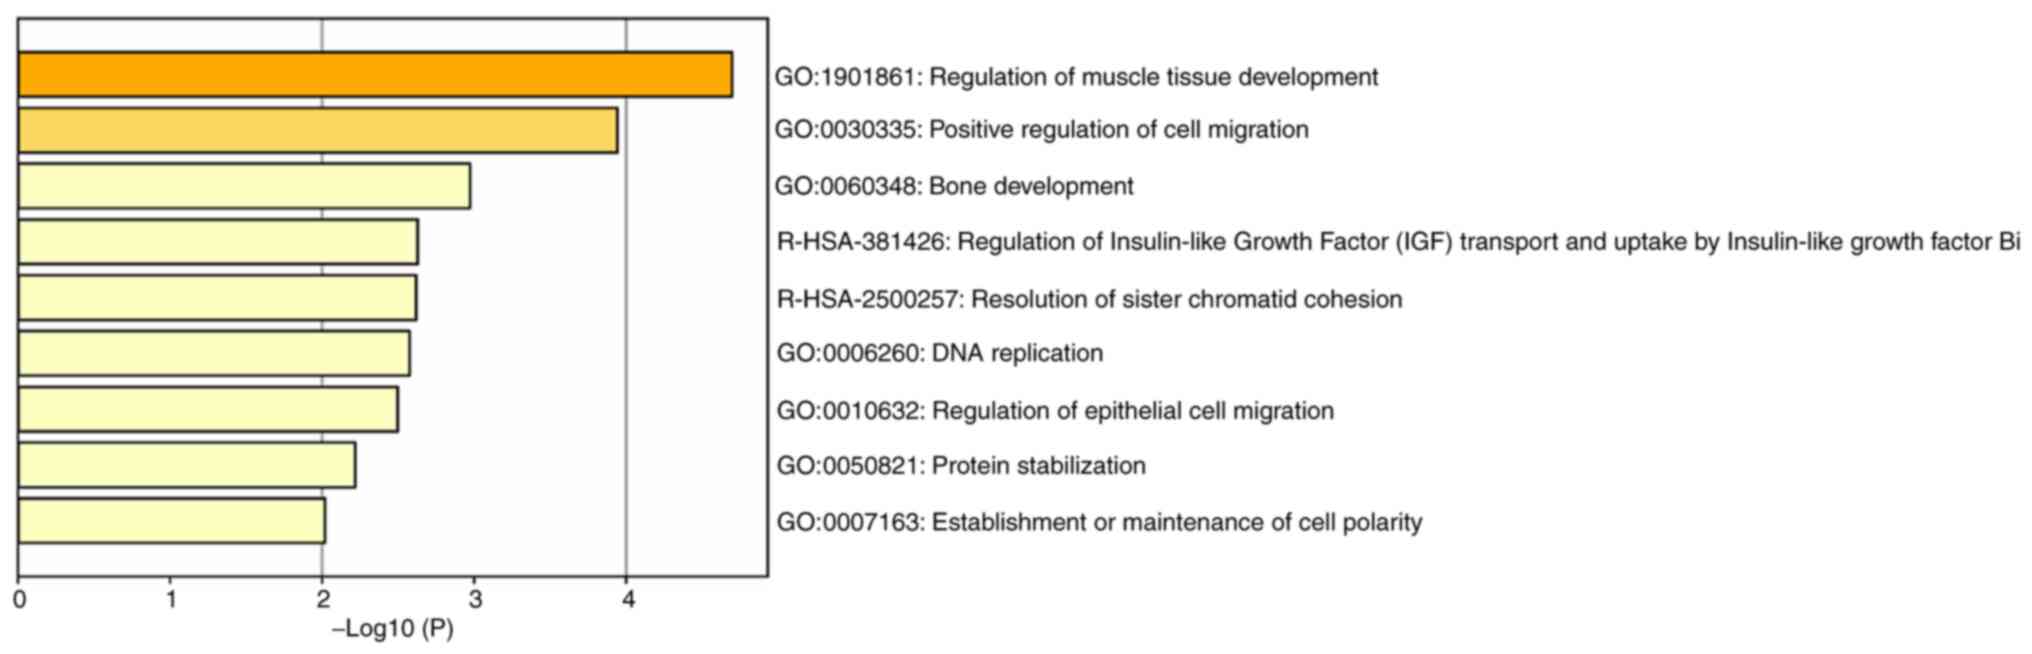
The online analysis tool Metascape was applied to
identify GO categories and KEGG pathways for DEGs. The results
indicated that the terms ‘regulation of muscle tissue development’,
‘positive regulation of cell migration’, ‘bone development’ and
‘resolution of sister chromatid cohesion’ were primarily enriched
with DEGs (Fig. 2).
Identification of hub genes
Protein interactions between DEGs were determined
using STRING in the PPI network. A total of 52 nodes and 80 edges
were included (Fig. 3A). Hub genes
were identified based on the connectivity of degree, DMNC, MCC and
MNC in the PPI network (Fig. 3B).
Venn analysis was performed to determine the intersection of the
DEG profiles, which indicated that five genes were overlapping in
those four analysis methods (degree, DMNC, MCC and MNC; Fig. 3C). Additionally, three module
networks were analyzed by MCODE. The most important module with six
genes was selected (Fig. 3D).
Collectively, the results of the union of set were calculated
according to the methods of hub genes selection and eight genes
[DEP domain containing 1 (DEPDC1), TIMELESS interacting protein
(TIPIN), shugoshin 1 (SGOL1), origin recognition complex subunit 6
(ORC6), IGF-binding protein 5 (IGFBP5), minichromosome maintenance
10 replication initiation factor (MCM10), MET proto-oncogene,
receptor tyrosine kinase (MET) and CENPF] were identified. Thus,
eight hub genes were obtained using Cytohubba and MCODE
analysis.
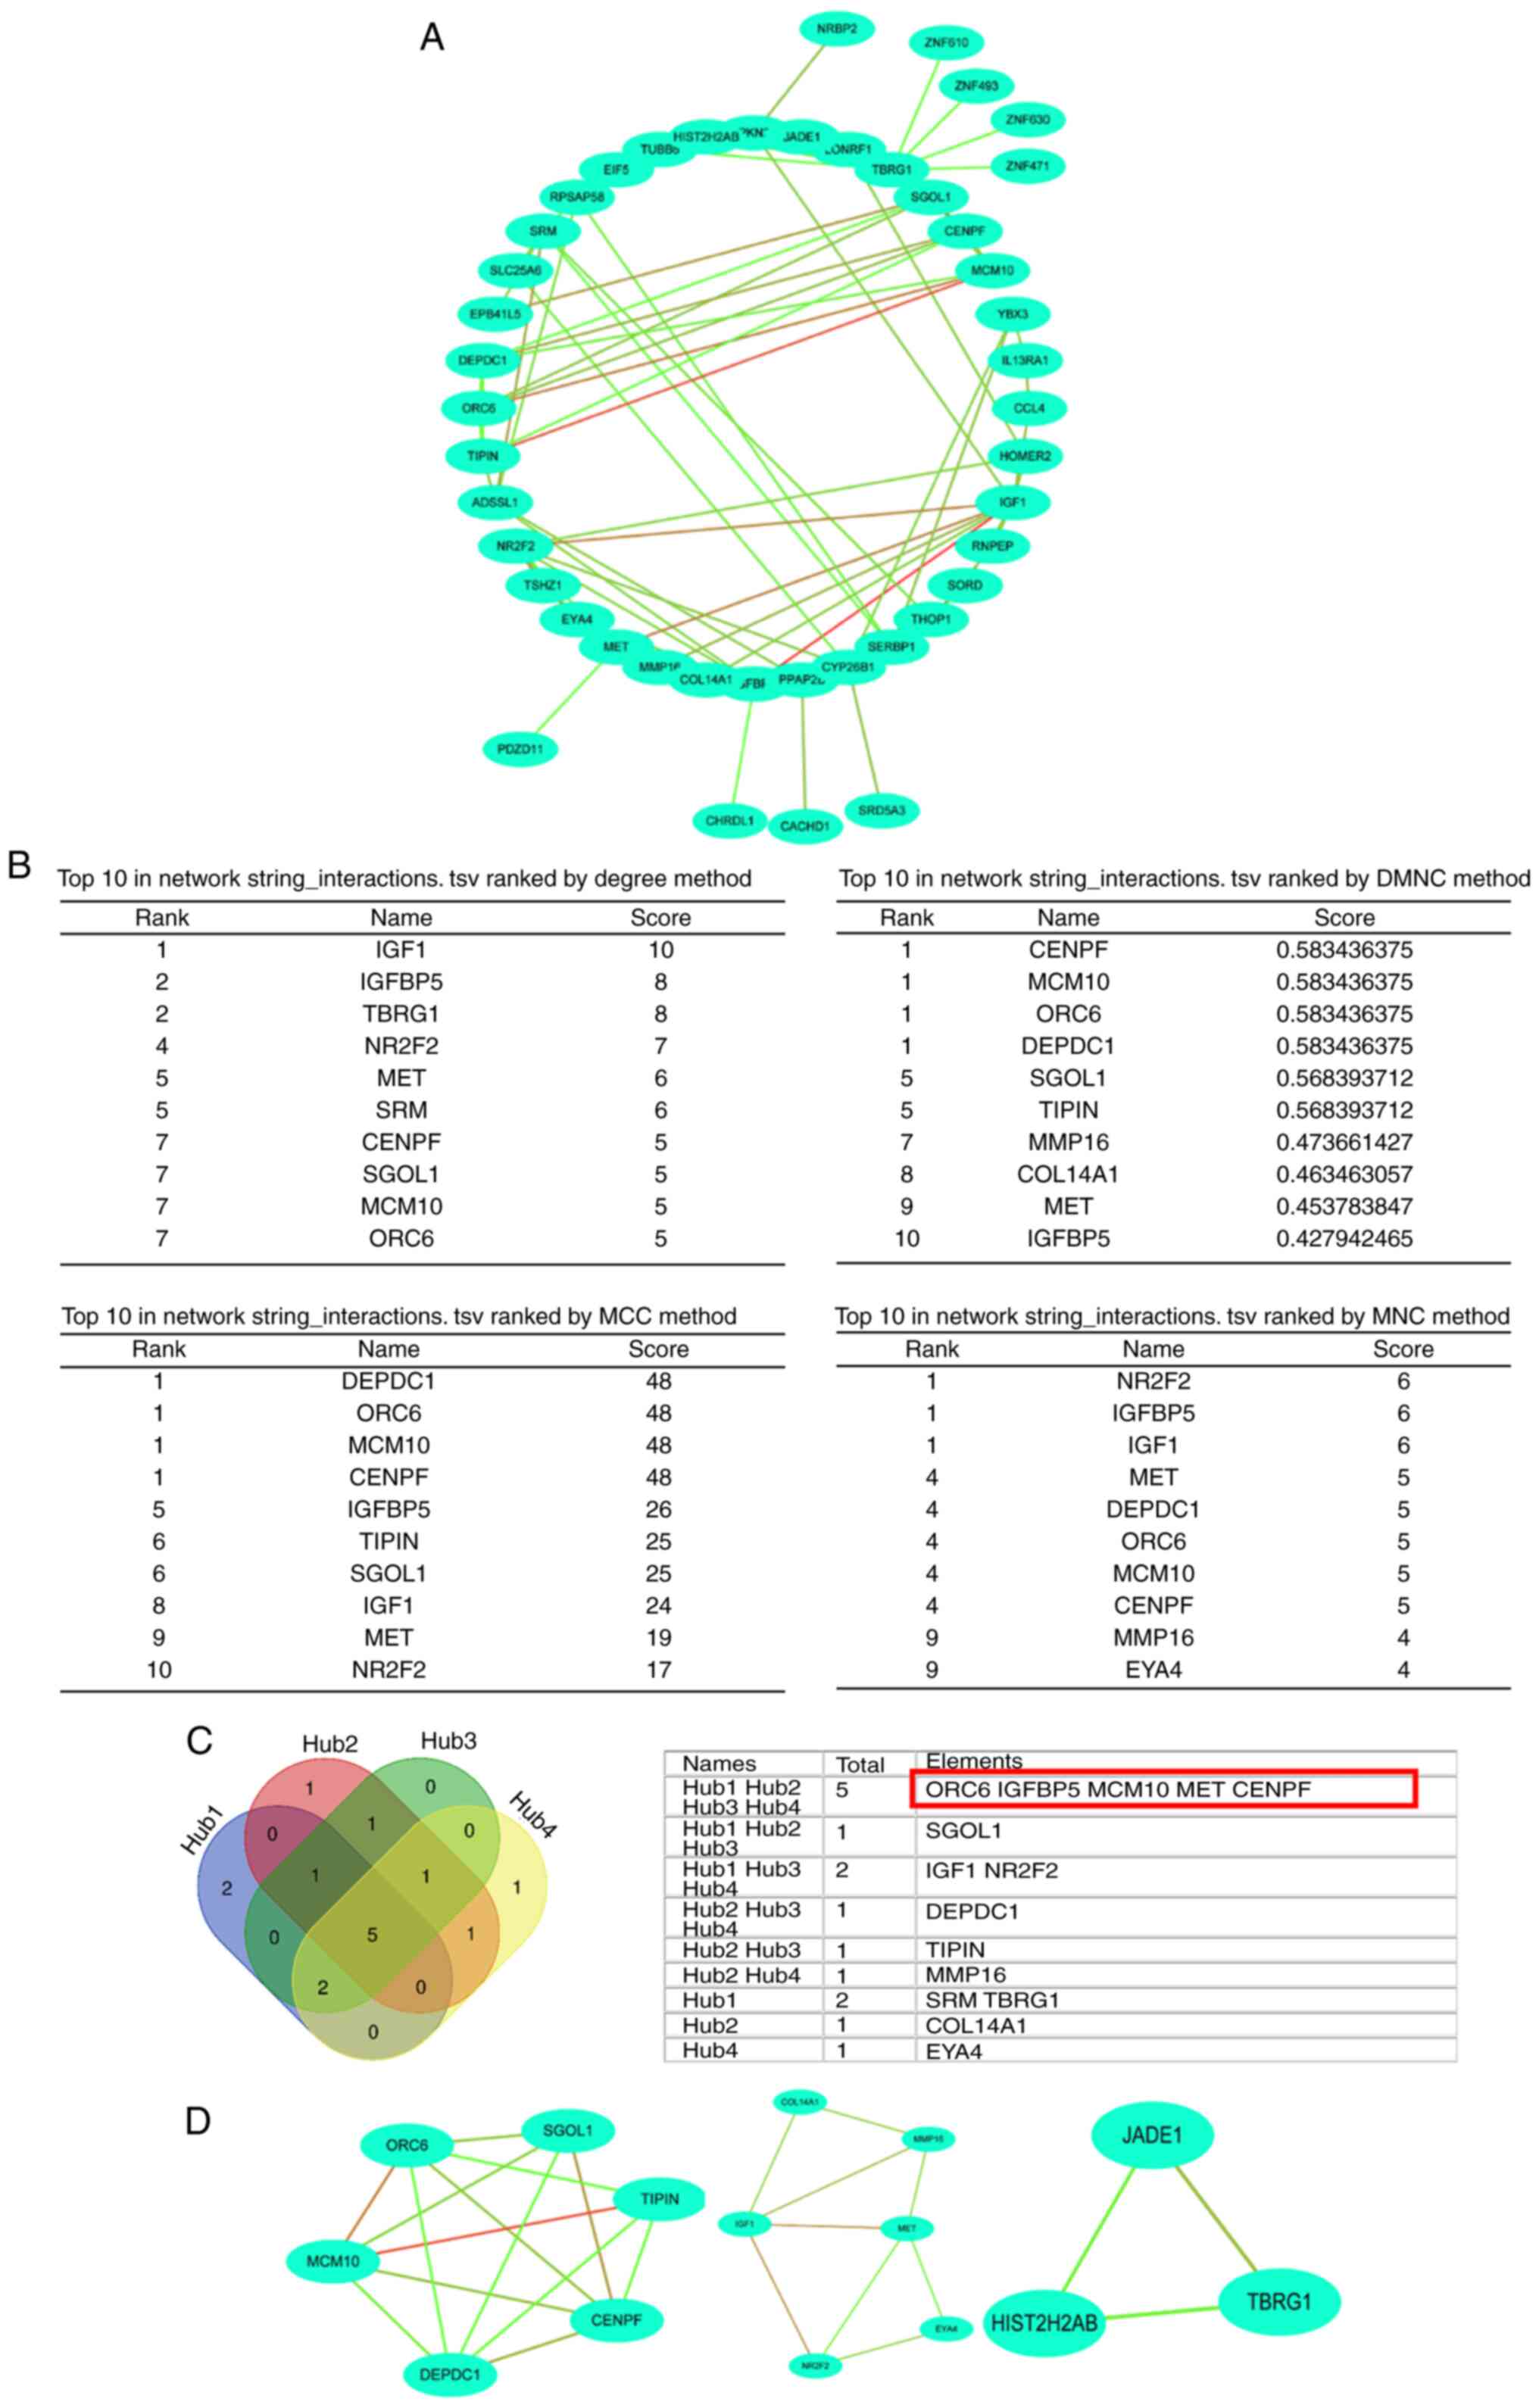 | Figure 3Identification of hub genes. (A)
Protein interactions between DEGs were determined using Search Tool
for the Retrieval of Interacting Genes in the PPI network. The
results demonstrated that 52 nodes and 80 edges were included. (B)
Hub genes were identified based on the connectivity of degree,
DMNC, MCC and MNC in the PPI network. (C) Venn analysis was
performed to identify intersection of DEG profiles, which
demonstrated that five genes were overlapping in those four
analysis methods. (D) A total of three module networks were
analyzed by MCODE, and the most important module with six genes was
selected. PPI, protein-protein interaction; DEG, differentially
expressed gene; MCODE, Molecular Complex Detection; DMNC, density
of maximum neighborhood component; MCC, maximal clique centrality;
MNC, mononuclear cell counts. |
Survival analysis of hub genes
Kaplan-Meier plotter online database provided the
prognostic values of eight hub genes. Overall survival analysis of
259 cases indicated that with the exception of IGFBP5, high
expression levels of the hub genes (DEPDC1, TIPIN, SGOL1, ORC6,
MCM10, MET and CENPF) were significantly associated with
unfavorable overall survival in patients with osteosarcoma
(Fig. 4). The survival curve of
eight hub genes exhibited significant differences between low and
high expression levels.
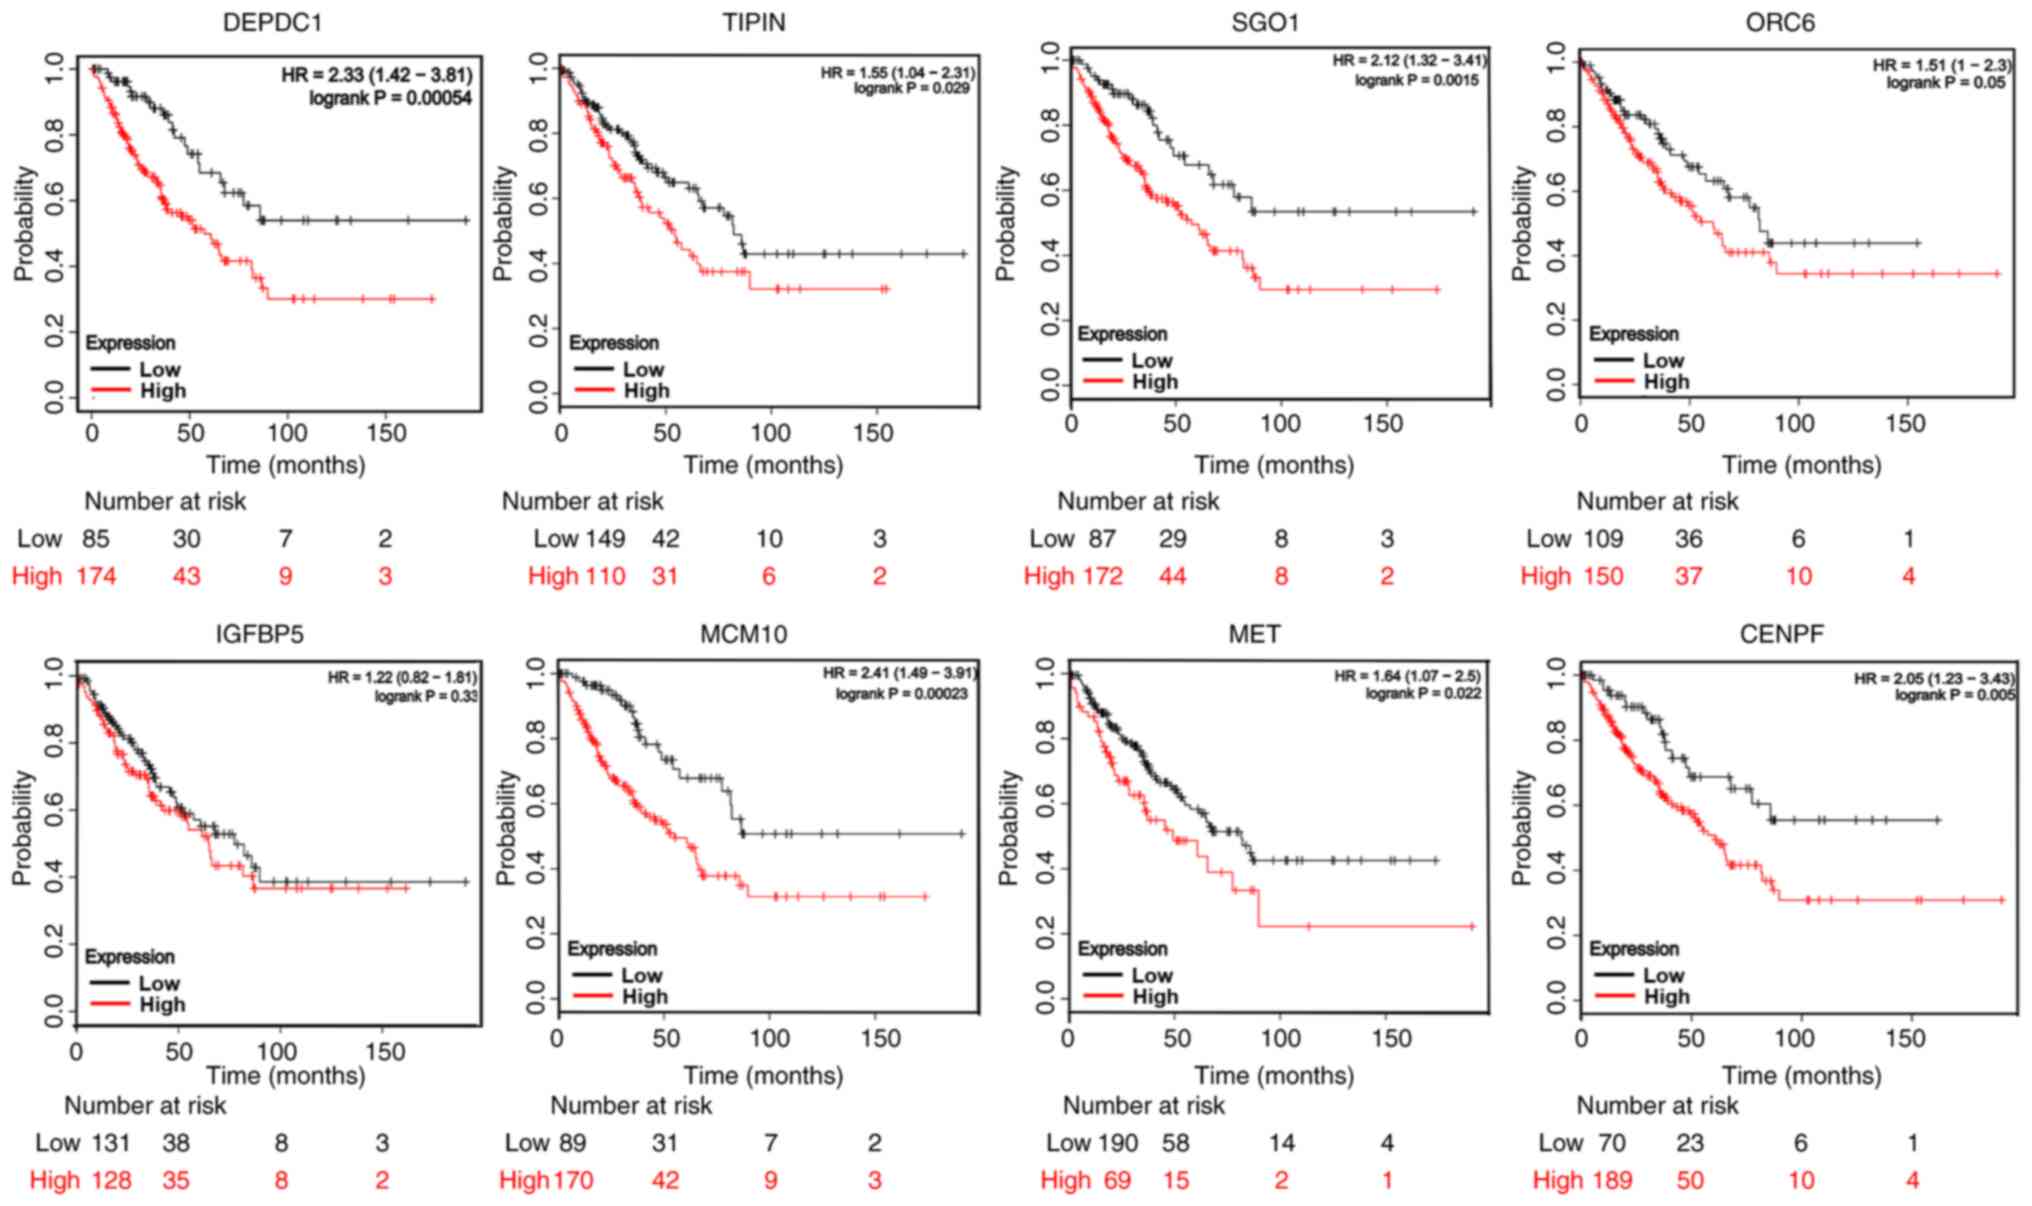 | Figure 4Survival analysis of hub genes.
Kaplan-Meier plotter online database revealed the prognostic values
of eight hub genes. Overall survival analysis of 259 cases
demonstrated that, with the exception of IGFBP5, high expression
levels of hub genes (DEPDC1, TIPIN, SGOL1, ORC6, MCM10, MET and
CENPF) were associated with an unfavorable overall survival of
patients with osteosarcoma. IGFBP5, IGF-binding protein 5; DEPDC1,
DEP domain-containing 1; TIPIN, TIMELESS interacting protein;
SGOL1, shugoshin 1; ORC6, origin recognition complex subunit 6;
MCM10, minichromosome maintenance 10 replication initiation factor;
MET, MET proto-oncogene, receptor tyrosine kinase; CENPF,
centromere protein F. |
Confirmation of differential
expression level hub genes
In order to confirm the differential hub gene
expression levels, expression level profiles were constructed based
on GEPIA, which demonstrated that the hub genes ORC6 and CENPF were
significantly upregulated in osteosarcoma (Fig. 5A). In order to verify the results,
the expression levels of hub genes were collected in Oncomine
database, which indicated that IGFBP5 and MET were downregulated in
tumor tissues, whereas the other hub genes [DEPDC1, TIPIN,
SGOL1(SGO1), ORC6, MCM10 and CENPF] were upregulated in tumor
tissues, compared with the adjacent non-tumorous tissues (Fig. 5B). The expression of eight hub genes
exhibited a significant difference between tumors and adjacent
tissues.
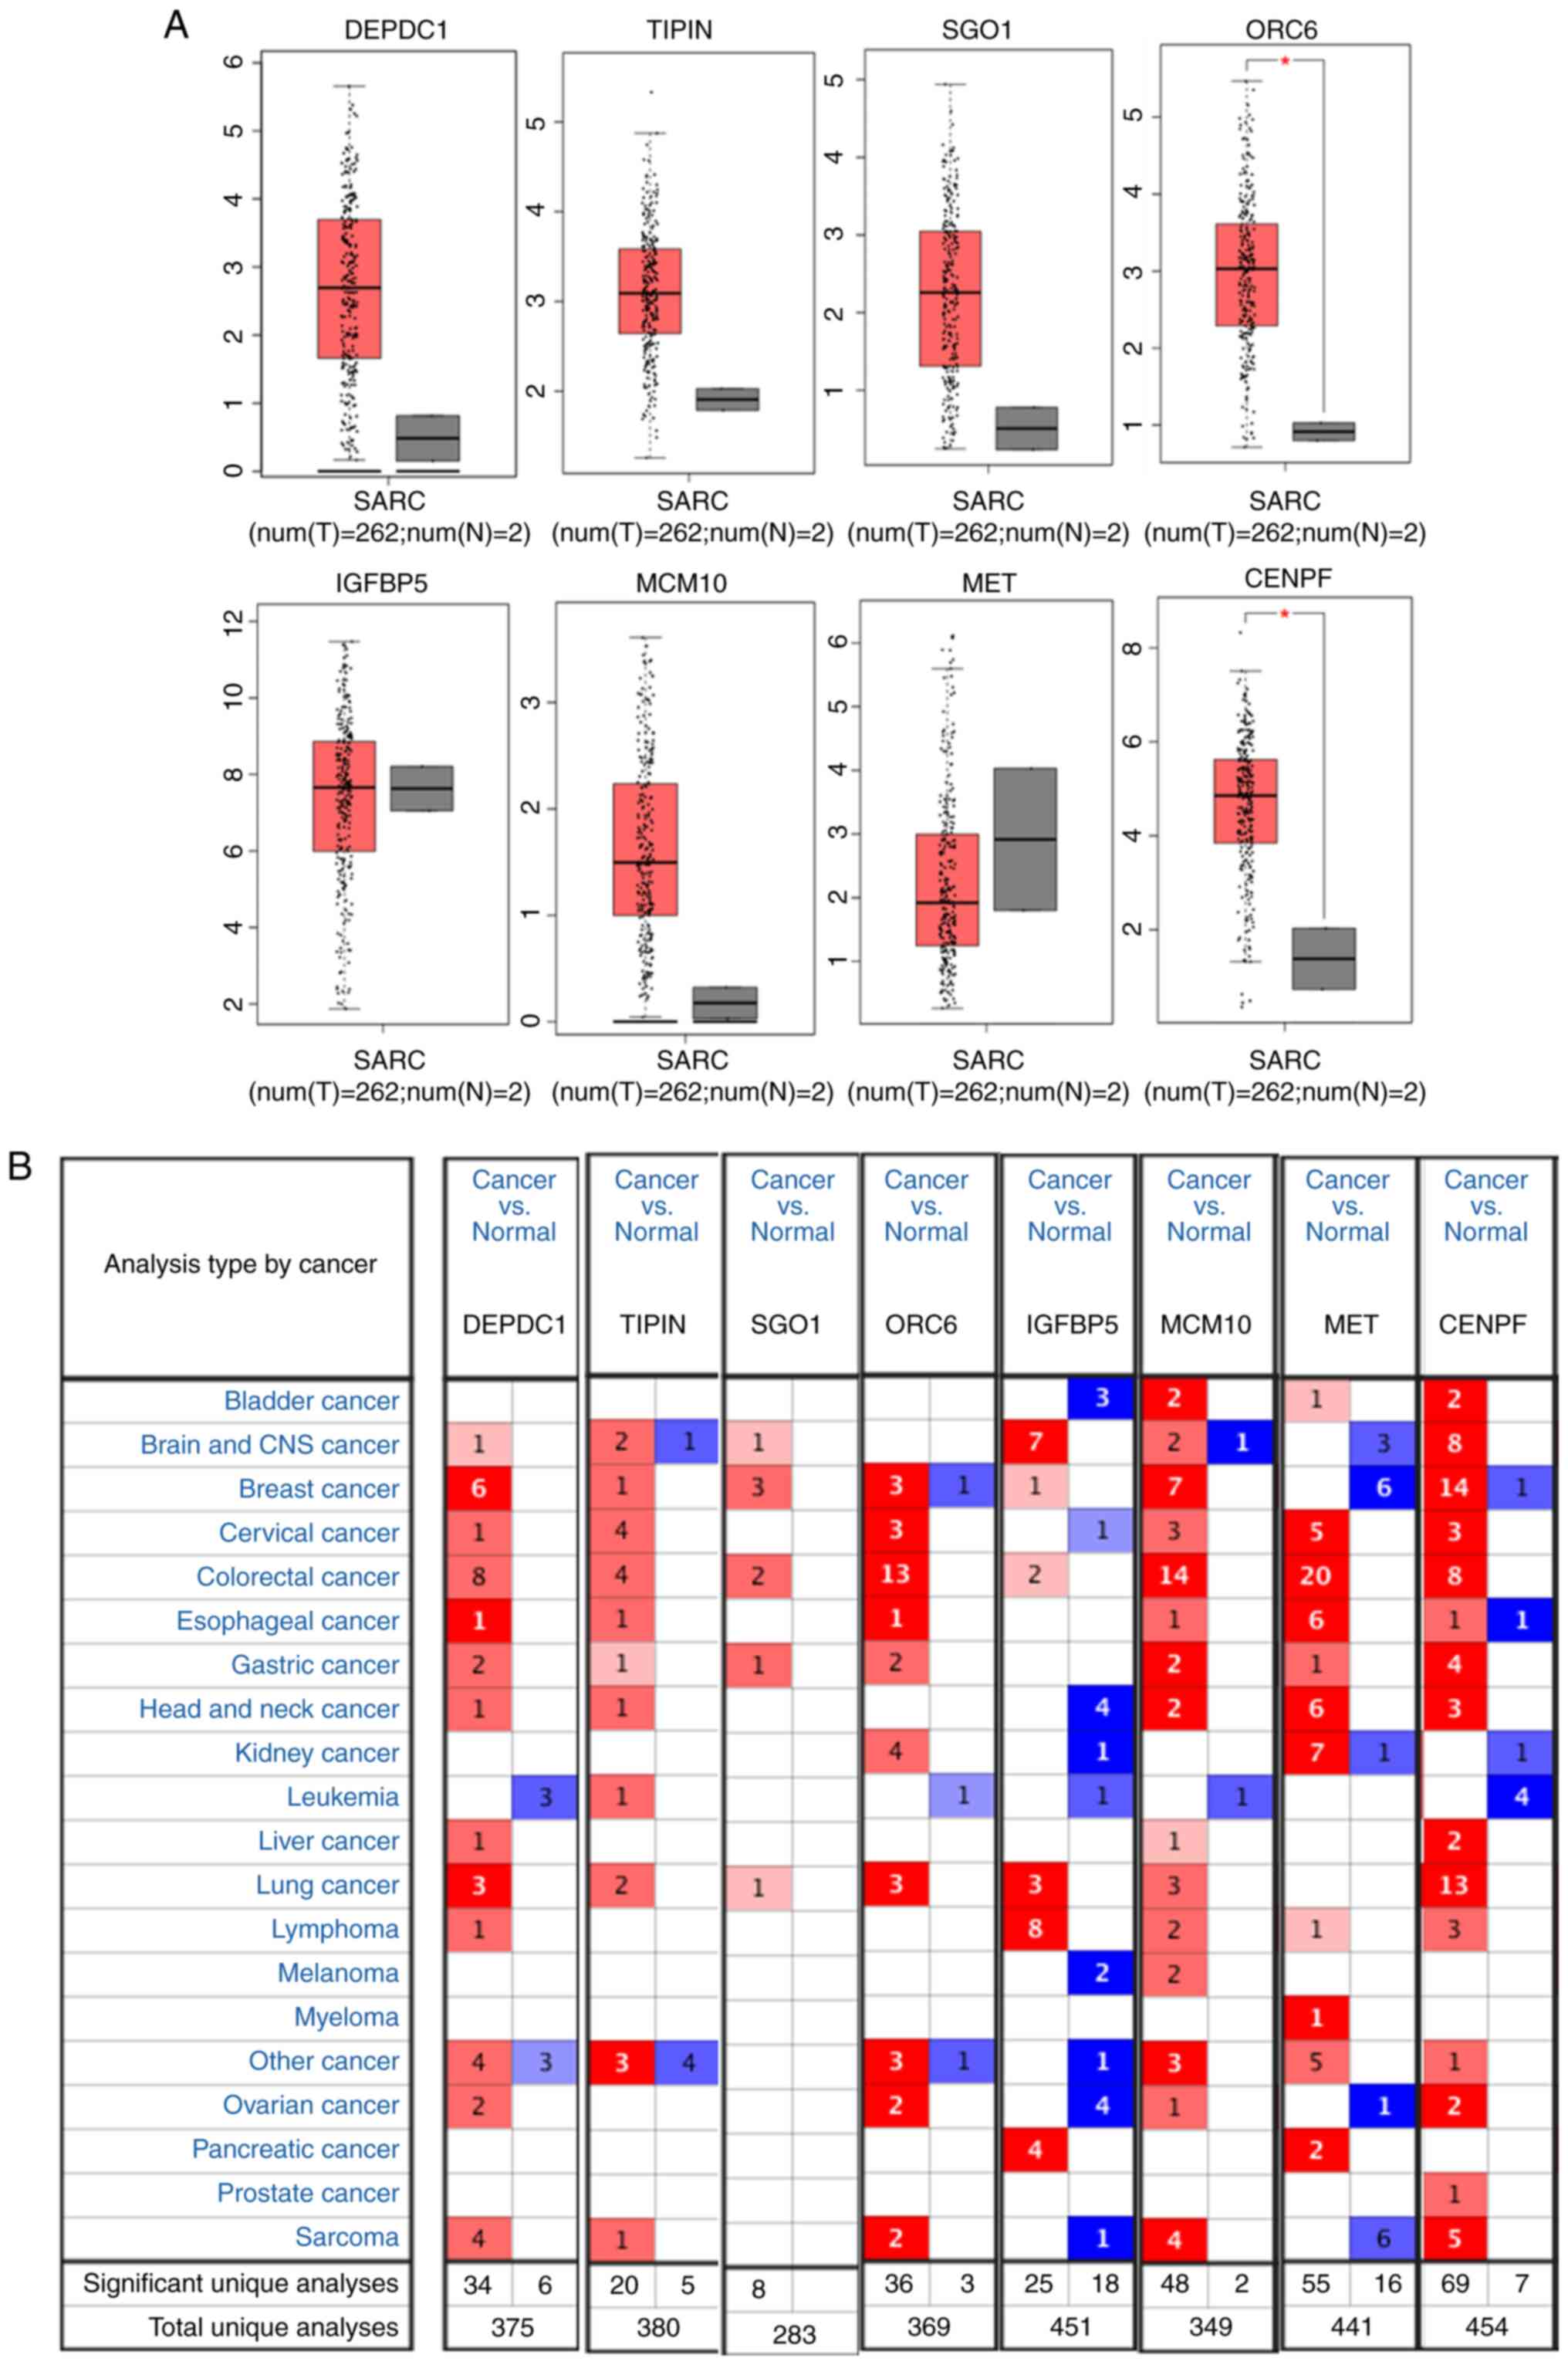 | Figure 5Confirmation of differential
expression hub genes. (A) Gene Expression Profiling Interactive
Analysis demonstrated that the hub genes ORC6 and CENPF were
upregulated in osteosarcoma (tumor=262; normal=2).
*P<0.05. (B) Oncomine database verified that IGFBP5
and MET were downregulated, but the other hub genes (DEPDC1, TIPIN,
SGOL1, ORC6, MCM10 and CENPF) were upregulated. SARC, osteosarcoma;
T, tumor; N, normal; IGFBP5, IGF-binding protein 5; DEPDC1, DEP
domain-containing 1; TIPIN, TIMELESS interacting protein; SGOL1,
shugoshin 1; ORC6, origin recognition complex subunit 6; MCM10,
minichromosome maintenance 10 replication initiation factor; MET,
MET proto-oncogene, receptor tyrosine kinase; CENPF, centromere
protein F. |
Identification of CENPF transfection
efficiency in osteosarcoma cell lines
As aforementioned, ORC6 and CENPF were upregulated
in osteosarcoma. Furthermore, Kaplan-Meier plotter indicated that
the P-value of CENPF was smaller compared with that of ORC6.
Therefore, CENPF was selected for further experiments analyses.
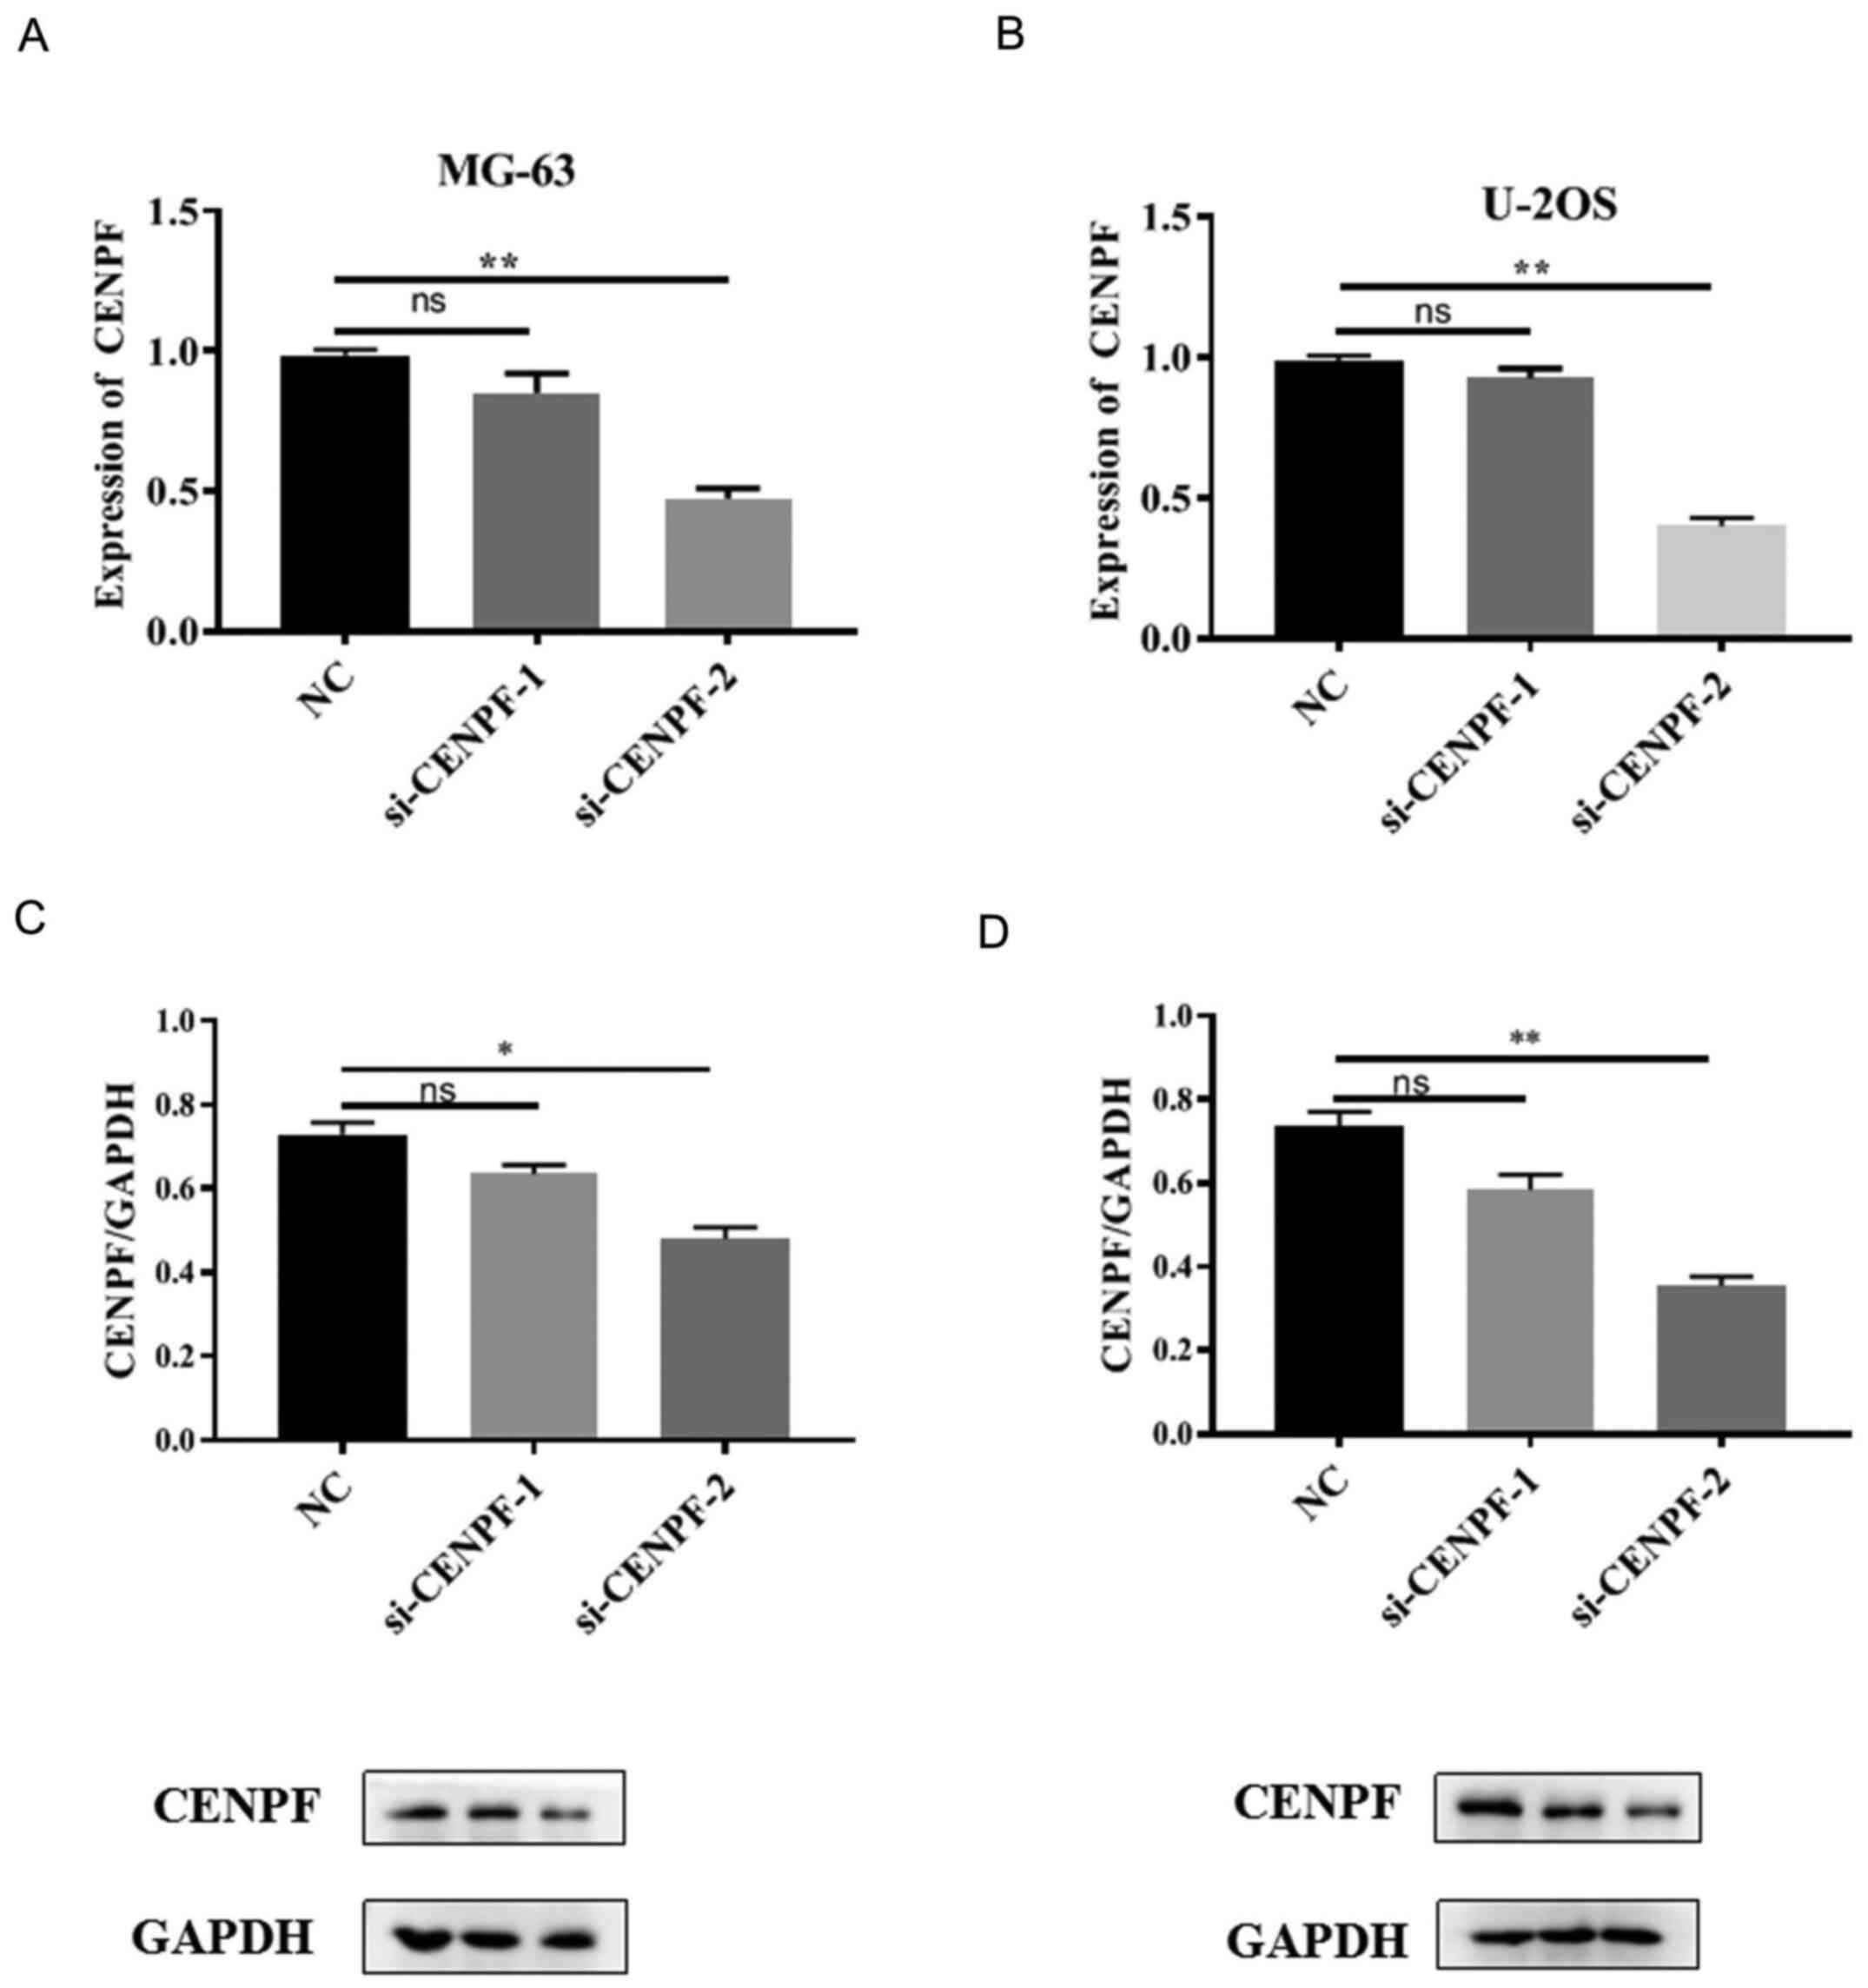
In order to select the most effective siRNA for
CENPF, transfection efficiency was assessed using RT-qPCR and
western blotting. MG-63 and U-2OS cells were transfected with NC,
si-CENPF-1 or si-CENPF-2. The results demonstrated that CENPF
expression at both the mRNA and protein levels were significantly
downregulated in both cell lines transfected with si-CENPF-2
compared with the NC (*P<0.05,
**P<0.01; Fig. 6A-D).
Thus, si-CENPF-2 was selected for the following functional
experiments.
Knockdown of CENPF suppresses
proliferation in osteosarcoma cell lines
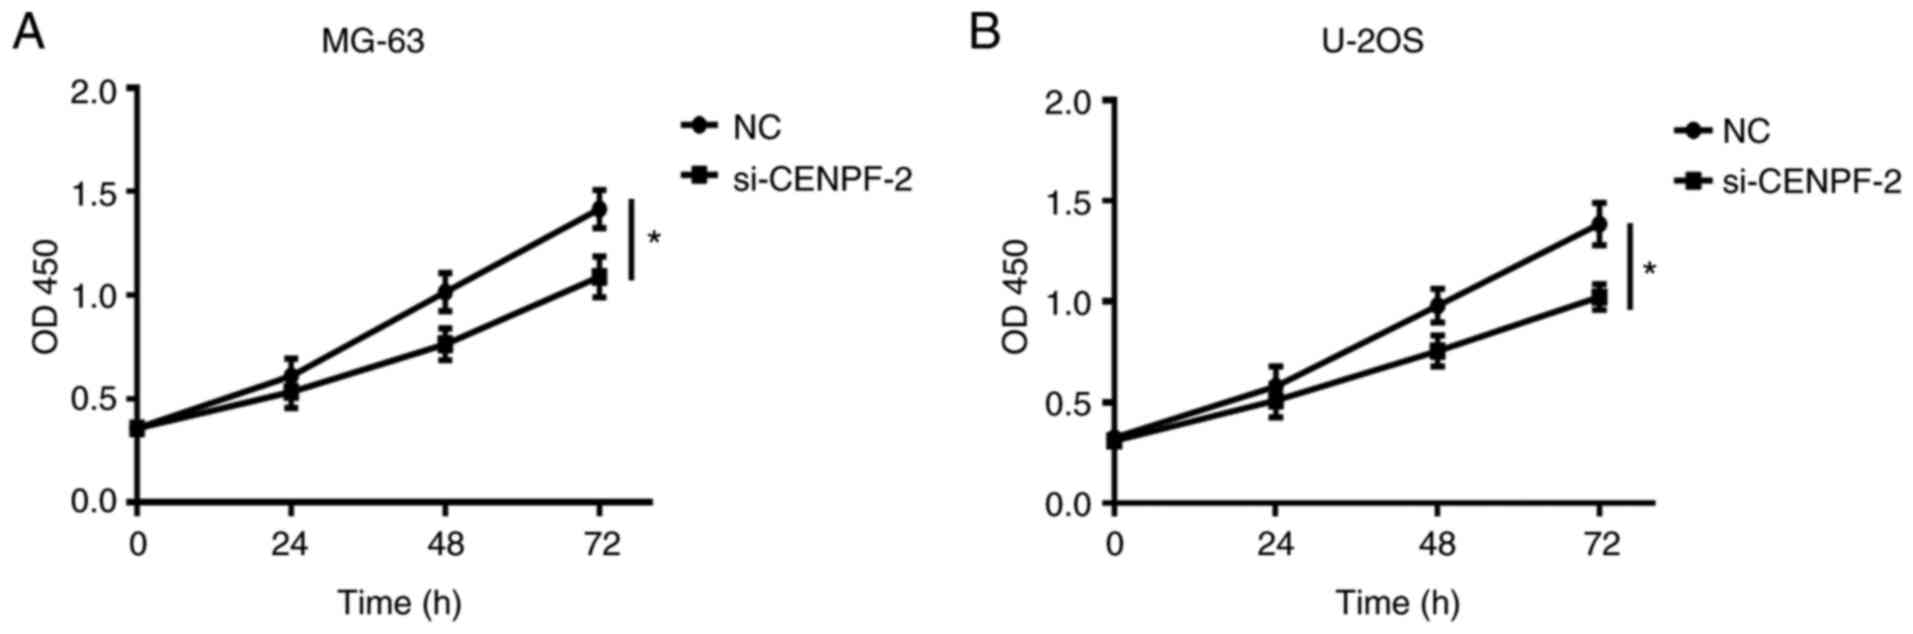
In order to analyze the functional role of CENPF in
osteosarcoma, CCK-8 assays were performed in MG-63 and U-2OS cell
lines. NC and si-CENPF-2 were separately transfected into
osteosarcoma cell lines. Proliferation ability was significantly
decreased in the si-CENPF-2 group compared with the corresponding
NC group (*P<0.05; Fig.
7A and B). This indicated that
CENPF knockdown inhibited the proliferation ability of osteosarcoma
cell lines.
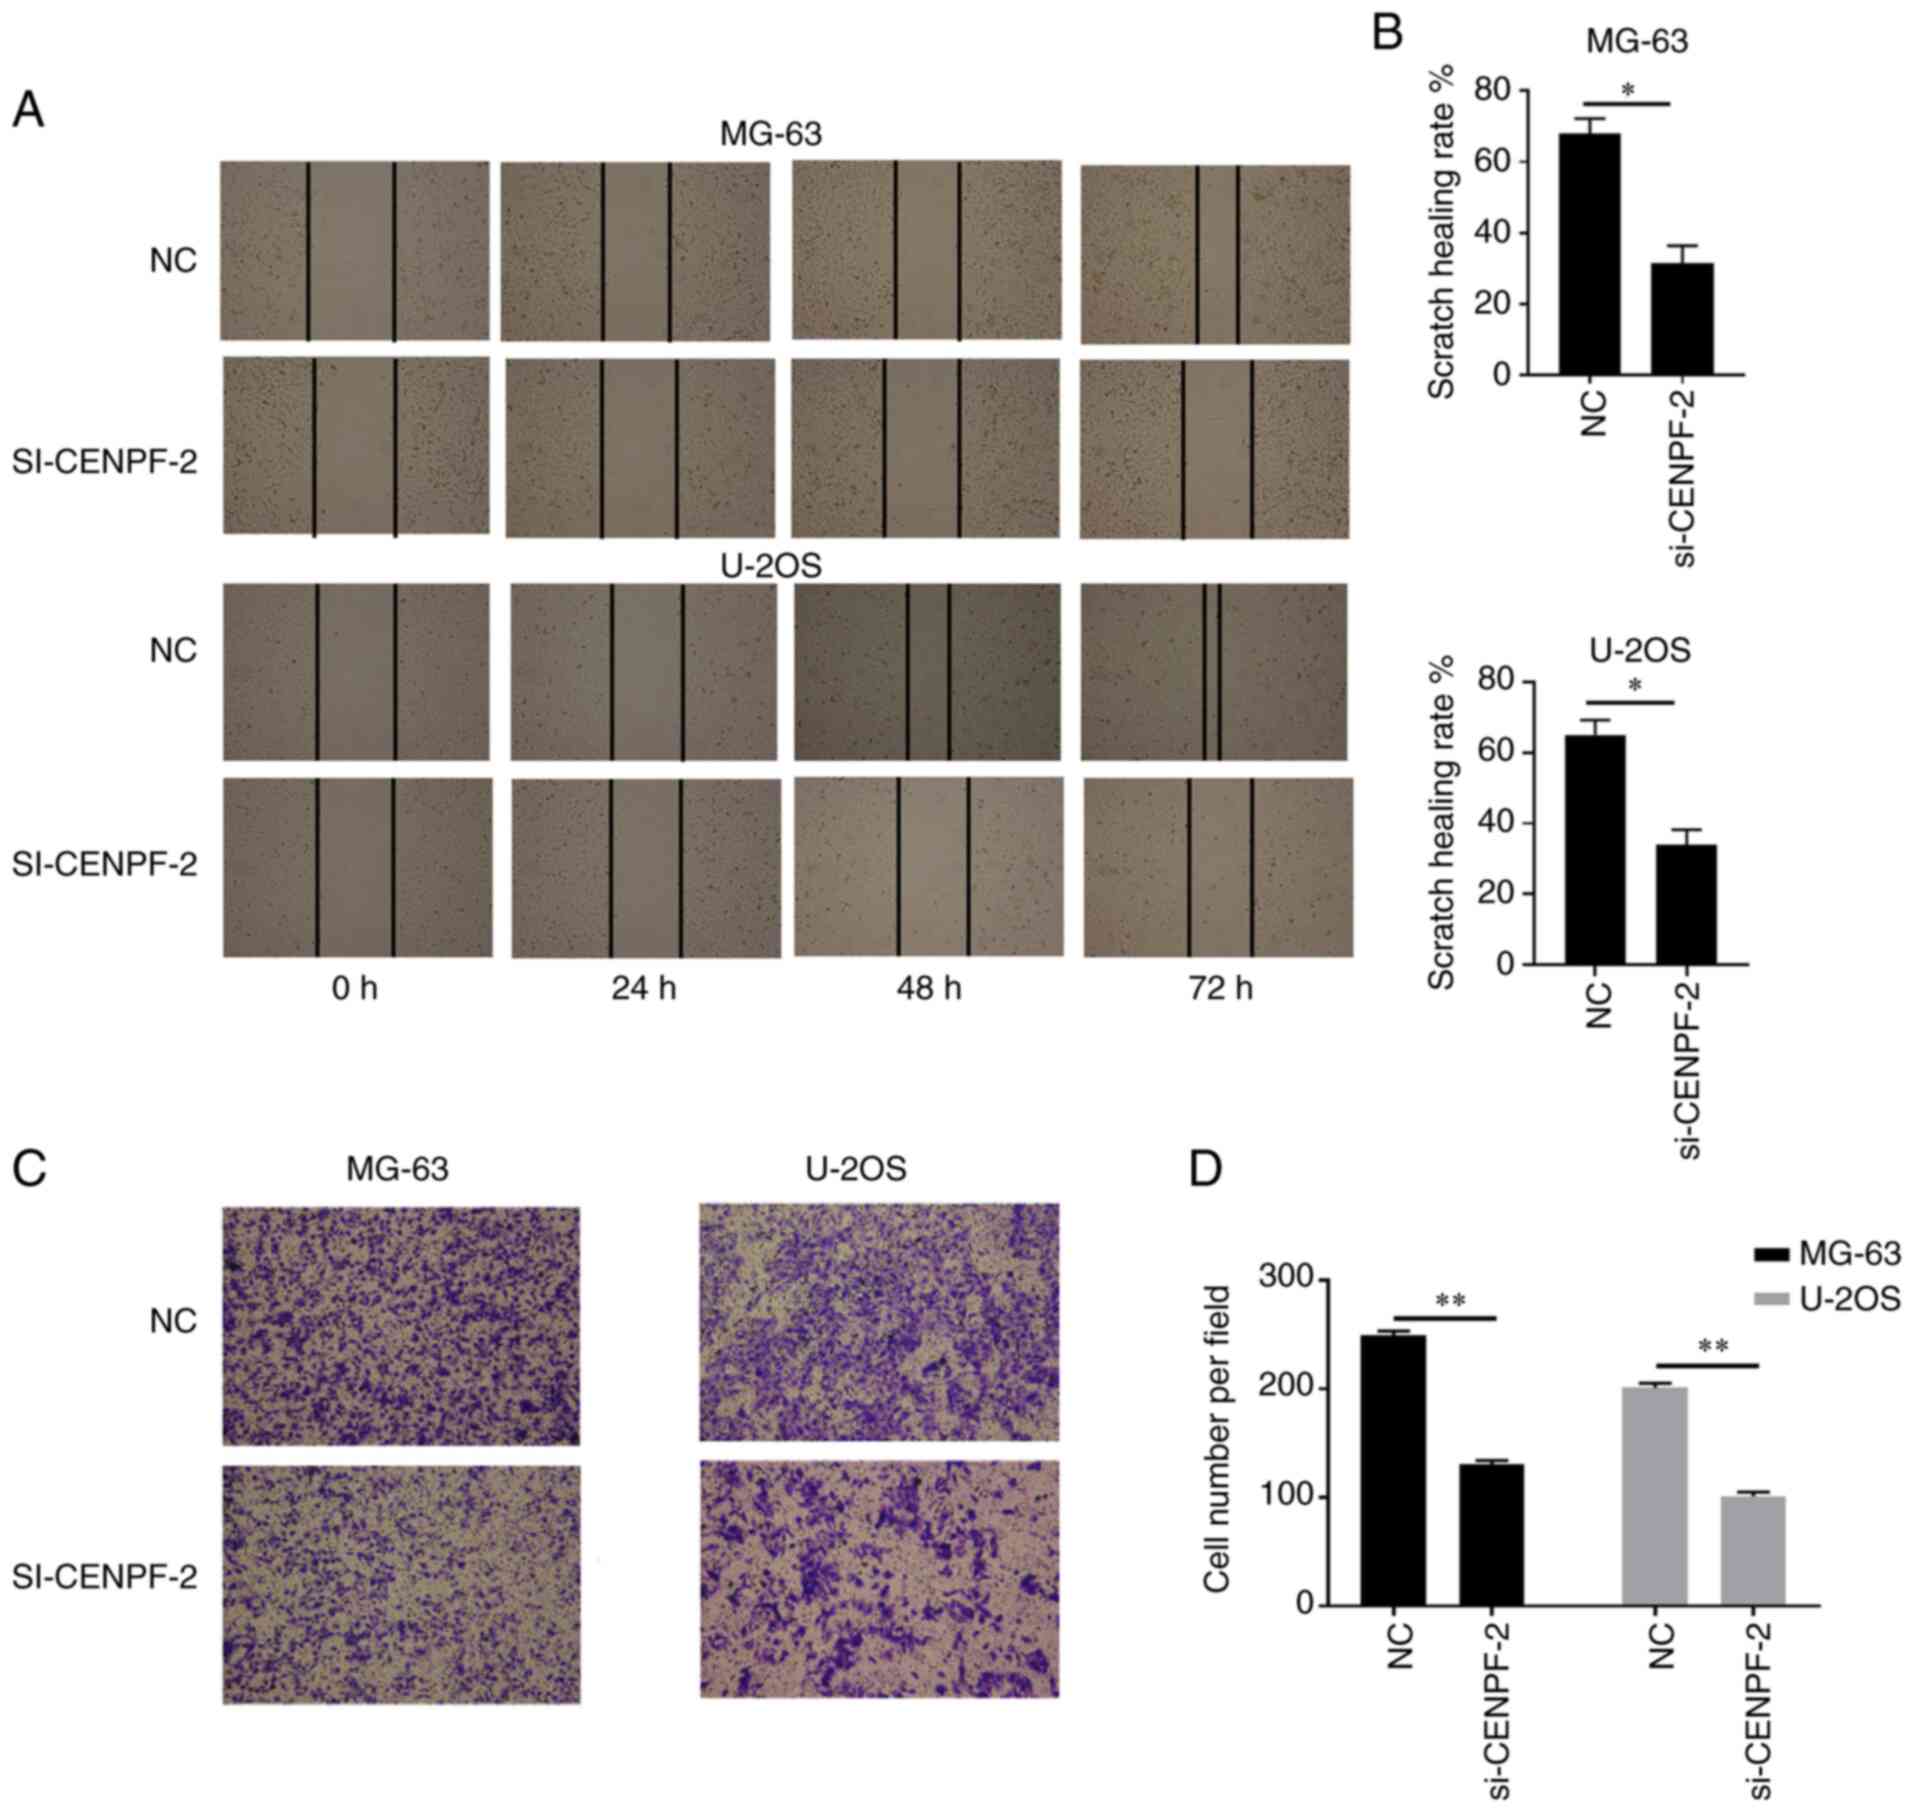
Knockdown of CENPF decreases migration
ability in osteosarcoma cell lines
Wound healing and Transwell migration assays were
performed to investigate the effect of CENPF on migration in
osteosarcoma cell lines. Cells were transfected with NC and
si-CENPF-2 and migration ability was then investigated. In
osteosarcoma cell lines, the wound healing rate was significantly
decreased in the si-CENPF-2 groups compared with the corresponding
NC groups (*P<0.05, **P<0.01; Fig. 8B and D). The results demonstrated that CENPF
knockdown decreased migration ability in osteosarcoma cell
lines.
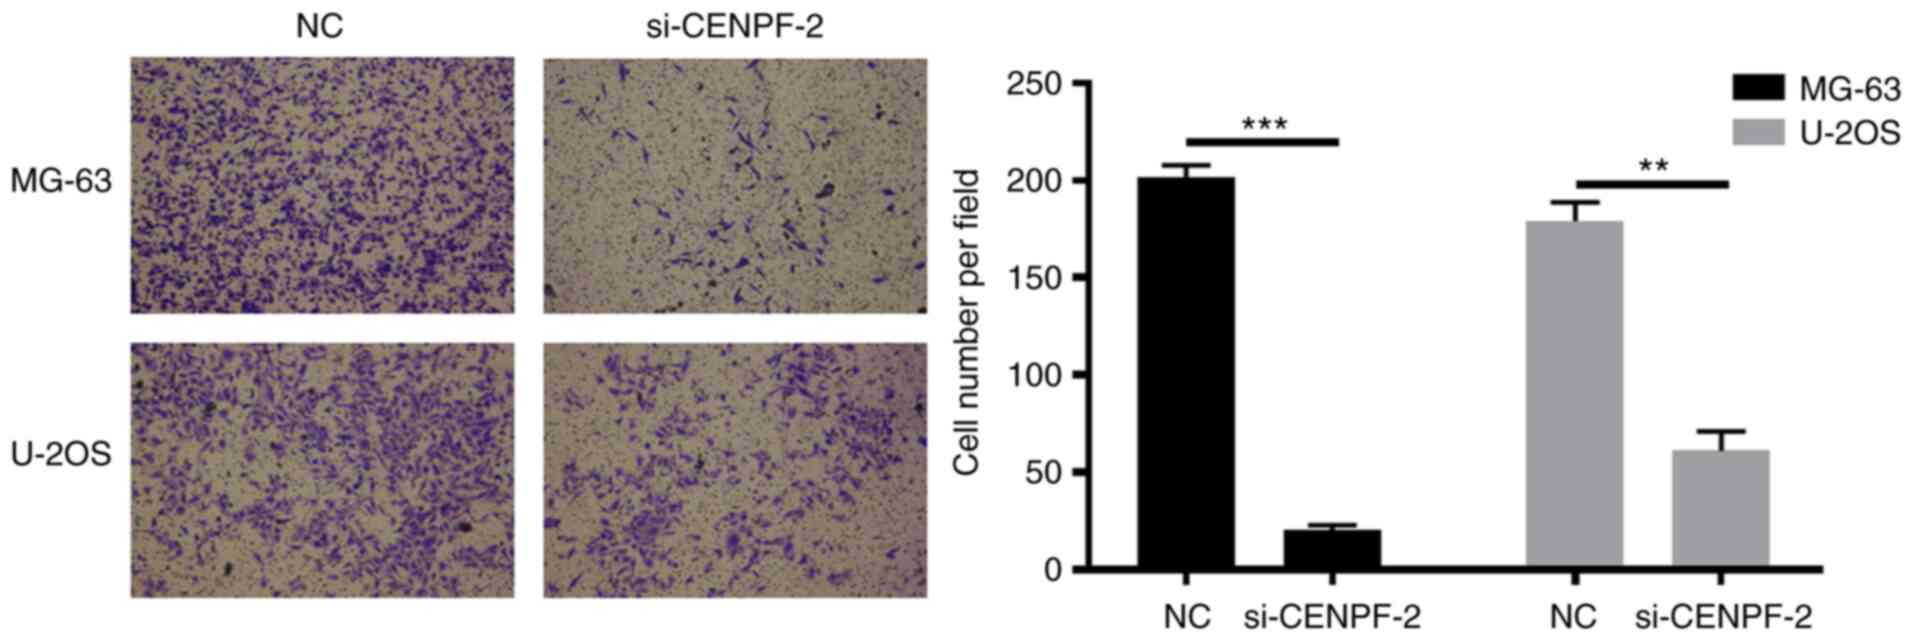
Knockdown of CENPF decreases invasion
ability in osteosarcoma cell lines
In order to measure invasion ability, Transwell
invasion assays were performed in osteosarcoma cell lines using
Matrigel-coated Transwell inserts. Cell lines were transfected with
NC or si-CENPF-2. The results demonstrated that cells transfected
with si-CENPF-2 exhibited significantly lower invasion abilities
compared with the corresponding NC groups (**P<0.01,
***P<0.001; Fig. 9).
This indicated that downregulated CENPF significantly decreased
invasion ability in osteosarcoma cell lines.
Discussion
The collection of genomic and clinical information
has been commonly used to investigate disease progression and
improve medical treatment (31,32).
Genomic profiling enables more specific diagnosis and targeted
treatment of a number of diseases, including numerous types of
cancer (33,34). One method is to obtain
bioinformatics information from microarray datasets (35-37).
As microarray provides high-throughput experimental data, it can be
difficult to elucidate meaningful biological implications from
large datasets (38,39). Therefore, the majority of data
generated by microarrays are collected in public archives such as
GEO (40), Oncomine (41) and The Cancer Genome Atlas (TCGA)
(42).
The aforementioned powerful bioinformatics analysis
online tools have been widely used for the identification of
biomarkers to provide potential therapeutic targets in numerous
types of cancer (43): Zhang et
al (44) investigated
miR-146a-5p and its potential targets in hepatocellular carcinoma
using TCGA and GEO databases; a study combining data from TCGA, GEO
and RT-qPCR determined the clinical value of miR-182-5p in lung
squamous cell carcinoma (45); and
GEO and TCGA data have been used to investigate the clinical value
of the underlying mechanism of ovarian cancer (46). Therefore, it is important to
understand how knowledge of genomics can be translated from
research into clinical practice, particularly in cancer treatment
(47,48).
Osteosarcoma is one of the most common types of
primary bone tumor (49) but its
etiology is largely unknown (50),
which limits understanding and treatment of different cases of
osteosarcoma. A growing number of researchers are attempting to
capitalize on microarray technology to identify disease-specific
molecular signatures and biomarkers for diagnosis, classification
and prognosis prediction (51-53).
For example, research based on microarray analysis has reported
distinct gene expression level profiles associated with
histological subtype in human osteosarcoma (54). Zou et al (55) identified the frequent expression
levels of melanoma antigen protein A and other cancer-testis
antigens in osteosarcoma using microarray analysis. Furthermore,
microarray analysis has also revealed 48 common genes that are
differentially expressed in metastatic cell lines compared with
parental cells in metastatic osteosarcoma (56).
The present study used the GEO database to search
for potential datasets in order to identify key genes and pathways
associated with osteosarcoma. As presented in gene expression level
profiles, GSE37552, GSE9508 and GSE19357 were identified. In order
to further investigate the statistical significance of DEGs, GO and
KEGG analysis indicated that the terms ‘regulation of muscle tissue
development’, ‘positive regulation of cell migration’, ‘bone
development’ and ‘resolution of sister chromatid cohesion’ were
primarily enriched with DEGs. Subsequently, the PPI network was
constructed using the online software STRING. In order to predict
the critical genes in osteosarcoma, the top ten genes were
identified based on the connectivity of degree, DMNC, MCC and MNC
in the PPI network. Venn analysis was performed to determine the
intersection of the DEG profiles, which demonstrated that five
genes were overlapping in those four analysis methods. In addition,
MCODE analysis indicated that six key genes exhibited strong
interactions. Combined with the results of PPI network construction
and MCODE analyses, eight hub genes were obtained (DEPDC1, TIPIN,
SGOL1, ORC6, IGFBP5, MCM10, MET and CENPF). Furthermore,
Kaplan-Meier survival analysis was performed to identify the
prognostic value of these eight hub genes. The results indicated
that overexpression of seven hub genes (DEPDC1, TIPIN, SGOL1, ORC6,
MCM10, CENPF and MET) was associated with less favorable overall
survival in patients with osteosarcoma. GEPIA and Oncomine
databases were used to confirm differential hub gene expression
levels in tissue. The hub gene CENPF was selected for further
experiments to determine its effects on the proliferative,
migratory and invasive abilities of osteosarcoma cells. CCK-8,
wound healing and Transwell migration and invasion assays results
indicated that CENPF knockdown inhibited the proliferation,
migration and invasion of osteosarcoma cell lines. However, further
investigation is required to identify potential causes.
The present study screened three gene expression
level profiles to select DEGs, and then performed functional
enrichment analyses of DEGs using GO and KEGG. Potential associated
factors involved in osteosarcoma were identified. Moreover, PPI
network construction and MCODE analyses were conducted, and seven
novel genes associated with osteosarcoma were identified. In order
to determine the prognostic value of these genes, the Kaplan-Meier
method was used for overall survival analysis. GEPIA and Oncomine
further confirmed expression levels of hub genes. The functional
experiments demonstrated that knockdown of the hub gene CENPF
inhibited proliferation, migration and invasion in osteosarcoma
cell lines. These results may indicate targets for novel
therapeutic strategies for osteosarcoma.
Acknowledgements
Not applicable.
Funding
Funding: The present study was supported by Wuhan Young and
Middle-aged Medical Backbone Talents.
Availability of data and materials
The datasets used and/or analyzed during the current
study are available from the corresponding author on reasonable
request.
Authors' contributions
YM contributed to the conception and design of the
present study. YM and JG analyzed and interpreted the results, and
wrote the manuscript. DL and XC performed the experiments. DL and
XC confirm the authenticity of all the raw data. All authors have
read and approved the final manuscript.
Ethics approval and consent to
participate
Not applicable.
Patient consent for publication
Not applicable.
Competing interests
The authors declare that they have no competing
interests.
References
|
1
|
Kong C and Hansen MF: Biomarkers in
osteosarcoma. Expert Opin Med Diagn. 3:13–23. 2009.PubMed/NCBI View Article : Google Scholar
|
|
2
|
Ottaviani G and Jaffe N: The epidemiology
of osteosarcoma. Cancer Treat Res. 152:3–13. 2009.PubMed/NCBI View Article : Google Scholar
|
|
3
|
Neyssa M, Mark G, Lisa T and Richard G:
Biology and therapeutic advances for pediatric osteosarcoma.
Oncologist. 9:422–421. 2004.PubMed/NCBI View Article : Google Scholar
|
|
4
|
Machak GN, Tkachev SI, Solovyev YN,
Sinyukov PA, Ivanov SM, Kochergina NV, Ryjkov AD, Tepliakov VV,
Bokhian BY and Glebovskaya VV: Neoadjuvant chemotherapy and local
radiotherapy for high-grade osteosarcoma of the extremities. Mayo
Clin Proc. 78:147–155. 2003.PubMed/NCBI View
Article : Google Scholar
|
|
5
|
Kaya M, Wada T, Akatsuka T, Kawaguchi S,
Nagoya S, Shindoh M, Higashino F, Mezawa F, Okada F and Ishii S:
Vascular endothelial growth factor expression in untreated
osteosarcoma is predictive of pulmonary metastasis and poor
prognosis. Clin Cancer Res. 6:572–577. 2000.PubMed/NCBI
|
|
6
|
Picci P, Vanel D, Briccoli A, Talle K,
Haakenaasen U, Malaguti C, Monti C, Ferrari C, Bacci G, Saeter G
and Alvegard TA: Computed tomography of pulmonary metastases from
osteosarcoma: The less poor technique. A study of 51 patients with
histological correlation. Ann Oncol. 12:1601–1604. 2001.PubMed/NCBI View Article : Google Scholar
|
|
7
|
Li W, Xie P and Ruan WH: Overexpression of
lncRNA UCA1 promotes osteosarcoma progression and correlates with
poor prognosis. J Bone Oncol. 5:80–85. 2016.PubMed/NCBI View Article : Google Scholar
|
|
8
|
Wei L, Peng X and Wen-Hui R:
Overexpression of lncRNA UCA1 promotes osteosarcoma progression and
correlates with poor prognosis. J Bone Oncol. 5:80–85.
2016.PubMed/NCBI View Article : Google Scholar
|
|
9
|
Zhao H, Hou W, Tao J, Zhao Y, Wan G, Ma C
and Xu H: Upregulation of lncRNA HNF1A-AS1 promotes cell
proliferation and metastasis in osteosarcoma through activation of
the Wnt/β-catenin signaling pathway. Am J Transl Res. 8:3503–3512.
2016.PubMed/NCBI
|
|
10
|
Zhang CL, Zhu KP and Ma XL: Antisense
lncRNA FOXC2-AS1 promotes doxorubicin resistance in osteosarcoma by
increasing the expression of FOXC2. Cancer Lett. 396:66–75.
2017.PubMed/NCBI View Article : Google Scholar
|
|
11
|
Zhang F and Peng H: LncRNA-ANCR regulates
the cell growth of osteosarcoma by interacting with EZH2 and
affecting the expression of p21 and p27. J Orthop Surg Res.
12(103)2017.PubMed/NCBI View Article : Google Scholar
|
|
12
|
Peng ZQ, Lu RB, Xiao DM and Xiao ZM:
Increased expression of the lncRNA BANCR and its prognostic
significance in human osteosarcoma. Genetics Mol Res: doi:
10.4238/gmr.15017480, 2016.
|
|
13
|
Edgar R, Domrachev M and Lash EA: Gene
expression omnibus: NCBI gene expression and hybridization array
data repository. Nucleic Acids Res. 30:207–210. 2002.PubMed/NCBI View Article : Google Scholar
|
|
14
|
Tan Q, Thomassen M, Jochumsen KM, Zhao JH,
Christensen K and Kruse TA: Evolutionary algorithm for feature
subset selection in predicting tumor outcomes using microarray
data. In: Bioinformatics Research and Applications. ISBRA 2008.
Lecture Notes in Computer Science. Vol 4983. Măndoiu I, Sunderraman
R and Zelikovsky A (eds). Springer, Berlin, Heidelberg, 2008.
|
|
15
|
Shen R, Ghosh D, Chinnaiyan A and Meng Z:
Eigengene-based linear discriminant model for tumor classification
using gene expression microarray data. Bioinformatics.
22:2635–2642. 2006.PubMed/NCBI View Article : Google Scholar
|
|
16
|
Kannan S and Neelapu S: Abstract #1434:
Meta-analysis of multiple Follicular Lymphoma GEO datasets reveals
the significance of tumor microenvironment in disease progression.
Cancer Res. 69(1434)2009.
|
|
17
|
Li Q, Smith AJ, Schacker TW, Carlis JV,
Duan L, Reilly CS and Haase AT: Microarray analysis of lymphatic
tissue reveals stage-specific, gene expression signatures in HIV-1
infection. J Immunol. 183:1975–1982. 2015.PubMed/NCBI View Article : Google Scholar
|
|
18
|
Kampas D, Soulitzis N, Neofytou E and
Siafakas NM: Microarray cluster analysis reveals individual genes
and biological processes associated with COPD. Eur Respir J.
44(P3821)2014.
|
|
19
|
Li CY, Pang YY, Yang H, Li J, Lu HX, Wang
HL, Mo WJ, Huang LS, Feng ZB and Chen G: Identification of
miR-101-3p targets and functional features based on bioinformatics,
meta-analysis and experimental verification in hepatocellular
carcinoma. Am J Transl Res. 9:2088–2105. 2017.PubMed/NCBI
|
|
20
|
Zhou Z, Li Y, Hao H, Wang Y, Zhou Z, Wang
Z and Chu X: Screening hub genes as prognostic biomarkers of
hepatocellular carcinoma by bioinformatics analysis. Cell
Transplant. 28 (1_Suppl):76S–86S. 2019.PubMed/NCBI View Article : Google Scholar
|
|
21
|
Cuff J, Salari K, Clarke N, Esheba GE,
Forster AD, Huang S, West RB, Higgins JP, Longacre TA and Pollack
JR: Integrative bioinformatics links HNF1B with clear cell
carcinoma and tumor-associated thrombosis. PLoS One.
8(e74562)2013.PubMed/NCBI View Article : Google Scholar
|
|
22
|
Yu Z, Chen WJ, Gan TQ, Zhang XL, Xie ZC,
Ye ZH, Deng Y, Wang ZF, Cai KT, Li SK, et al: Clinical significance
and effect of lncRNA HOXA11-AS in NSCLC: A study based on
bioinformatics, in vitro and in vivo verification.
Sci Rep. 7(5567)2017.PubMed/NCBI View Article : Google Scholar
|
|
23
|
Flores RJ, Li Y, Yu A, Shen J, Rao PH, Lau
SS, Vannucci M, Lau CC and Man TK: A systems biology approach
reveals common metastatic pathways in osteosarcoma. BMC Syst Biol.
6(50)2012.PubMed/NCBI View Article : Google Scholar
|
|
24
|
Endo-Munoz L, Cumming A, Rickwood D,
Wilson D, Cueva C, Ng C, Strutton G, Cassady AI, Evdokiou A,
Sommerville S, et al: Loss of osteoclasts contributes to
development of osteosarcoma pulmonary metastases. Cancer Res.
70:7063–7072. 2010.PubMed/NCBI View Article : Google Scholar
|
|
25
|
Sun C, Yuan Q, Wu D, Meng X and Wang B:
Identification of core genes and outcome in gastric cancer using
bioinformatics analysis. Oncotarget. 8:70271–70280. 2017.PubMed/NCBI View Article : Google Scholar
|
|
26
|
Gene Ontology Consortium. The gene
ontology (GO) project in 2006. Nucleic Acids Res. 34:D322–D326.
2006.PubMed/NCBI View Article : Google Scholar
|
|
27
|
Kanehisa M and Goto S: KEGG: Kyoto
encyclopedia of genes and genomes. Nucleic Acids Res. 28:27–30.
2000.PubMed/NCBI View Article : Google Scholar
|
|
28
|
Chin CH, Chen SH, Wu HH, Ho CW, Ko MT and
Lin CY: CytoHubba: Identifying hub objects and sub-networks from
complex interactome. BMC Syst Biol 8 Suppl. 4 (Suppl
4)(S11)2014.PubMed/NCBI View Article : Google Scholar
|
|
29
|
Bader GD and Hogue CW: An automated method
for finding molecular complexes in large protein interaction
networks. BMC Bioinformatics. 4(2)2003.PubMed/NCBI View Article : Google Scholar
|
|
30
|
Livak KJ and Schmittgen TD: Analysis of
relative gene expression data using real-time quantitative PCR and
the 2(-Delta Delta C(T)) method. Methods. 25:402–408.
2001.PubMed/NCBI View Article : Google Scholar
|
|
31
|
Jiang X, Barmada MM and Visweswaran S:
Identifying genetic interactions in genome-wide data using Bayesian
networks. Genet Epidemiol. 34:575–581. 2010.PubMed/NCBI View Article : Google Scholar
|
|
32
|
De Backer MD, Ilyina T, Ma XJ, Vandoninck
S, Luyten WH and Bossche HV: Genomic profiling of the response of
candida albicans to itraconazole treatment using a DNA microarray.
Antimicrob Agents Chemother. 45:1660–1670. 2001.PubMed/NCBI View Article : Google Scholar
|
|
33
|
Mirshahidi HR and Abraham J: Genomic
profiling in clinical oncology. The predictive value of genomic
information in cancer management. Postgrad Med. 119:56–61.
2006.PubMed/NCBI View Article : Google Scholar
|
|
34
|
Wulfkuhle J, Espina V, Liotta L and
Petricoin E: Genomic and proteomic technologies for
individualisation and improvement of cancer treatment. Eur J
Cancer. 40:2623–2632. 2004.PubMed/NCBI View Article : Google Scholar
|
|
35
|
Stuart JM, Eran S, Daphne K and Kim SK: A
gene-coexpression network for global discovery of conserved genetic
modules. Science. 302:249–255. 2003.PubMed/NCBI View Article : Google Scholar
|
|
36
|
Tsuyuzaki K, Tominaga D, Kwon Y and
Miyazaki S: Two-way AIC: Detection of differentially expressed
genes from large scale microarray meta-dataset. BMC Genomics. 14
(Suppl 2)(S9)2013.PubMed/NCBI View Article : Google Scholar
|
|
37
|
Jeyachidra J and Punithavalli M (eds): A
comparative analysis of feature selection algorithms on
classification of gene microarray dataset. In: 2013 International
Conference on Information Communication and Embedded Systems
(ICICES), pp1088-1093, 2013. doi: 10.1109/ICICES.2013.6508165.
|
|
38
|
Magnan CN, Zeller M, Kayala MA, Vigil A,
Randall A, Felgner PL and Baldi P: High-throughput prediction of
protein antigenicity using protein microarray data. Bioinformatics.
26:2936–2943. 2010.PubMed/NCBI View Article : Google Scholar
|
|
39
|
Alonso-Betanzos A and Herrera F: A review
of microarray datasets and applied feature selection methods. Inf
Sci. 282:111–135. 2014.
|
|
40
|
Barrett T, Wilhite SE, Ledoux P,
Evangelista C, Kim IF, Tomashevsky M, Marshall KA, Phillippy KH,
Sherman PM, Holko M, et al: NCBI GEO: Archive for functional
genomics data sets-update. Nucleic Acids Res. 41:D991–D995.
2013.PubMed/NCBI View Article : Google Scholar
|
|
41
|
Rhodes DR, Yu J, Shanker K, Deshpande N,
Varambally R, Ghosh D, Barrette T, Pandey A and Chinnaiyan AM:
ONCOMINE: A cancer microarray database and integrated data-mining
platform. Neoplasia. 6:1–6. 2004.PubMed/NCBI View Article : Google Scholar
|
|
42
|
Tomczak K, Czerwińska P and Wiznerowicz M:
The cancer genome atlas (TCGA): An immeasurable source of
knowledge. Contemp Oncol (Pozn). 19:A68–A77. 2015.PubMed/NCBI View Article : Google Scholar
|
|
43
|
Tao Z, Shi A, Li R, Wang Y, Wang X and
Zhao J: Microarray bioinformatics in cancer- a review. J BUON.
22:838–843. 2017.PubMed/NCBI
|
|
44
|
Zhang X, Ye ZH, Liang HW, Ren FH, Li P,
Dang YW and Chen G: Down-regulation of miR-146a-5p and its
potential targets in hepatocellular carcinoma validated by a TCGA-
and GEO-based study. FEBS Open Bio. 7:504–521. 2017.PubMed/NCBI View Article : Google Scholar
|
|
45
|
Luo J, Shi K, Yin SY, Tang RX, Chen WJ,
Huang LZ, Gan TQ, Cai ZW and Chen G: Clinical value of miR-182-5p
in lung squamous cell carcinoma: A study combining data from TCGA,
GEO, and RT-qPCR validation. World J Surg Oncol.
16(76)2018.PubMed/NCBI View Article : Google Scholar
|
|
46
|
Li XJ, Pang JS, Li YM, Ahmed FA, He RQ, Ma
J, Ma FC and Chen G: Clinical value of survivin and its underlying
mechanism in ovarian cancer: A bioinformatics study based on GEO
and TCGA data mining. Pathol Res Pract. 214:385–401.
2018.PubMed/NCBI View Article : Google Scholar
|
|
47
|
Phillips KA, Liang SY and Bebber SV:
Canpers Research Group. Challenges to the translation of genomic
information into clinical practice and health policy: Utilization,
preferences, and economic value. Curr Opin Mol Ther. 10:260–266.
2008.PubMed/NCBI
|
|
48
|
Arao T, Matsumoto K, Maegawa M and Nishio
K: What can and cannot be done using a microarray analysis?
Treatment stratification and clinical applications in oncology.
Biol Pharm Bull. 34:1789–1793. 2011.PubMed/NCBI View Article : Google Scholar
|
|
49
|
Alleyne CH, Theodore N, Spetzler RF and
Coons SW: Osteosarcoma of the temporal fossa with hemorrhagic
presentation: Case report. Neurosurgery. 47:450–451.
2000.PubMed/NCBI View Article : Google Scholar
|
|
50
|
Fuchs B and Pritchard DJ: Etiology of
osteosarcoma. Clin Orthop Relat Res. 397:40–52. 2002.PubMed/NCBI View Article : Google Scholar
|
|
51
|
Heller MJ: DNA microarray technology:
Devices, systems, and applications. Annu Rev Biomed Eng. 4:129–153.
2002.PubMed/NCBI View Article : Google Scholar
|
|
52
|
Statnikov A, Aliferis CF, Tsamardinos I,
Hardin D and Levy S: A comprehensive evaluation of multicategory
classification methods for microarray gene expression cancer
diagnosis. Bioinformatics. 21:631–643. 2005.PubMed/NCBI View Article : Google Scholar
|
|
53
|
Gevaert O and Moor BD: Prediction of
cancer outcome using DNA microarray technology: Past, present and
future. Expert Opin Med Diagn. 3:157–165. 2009.PubMed/NCBI View Article : Google Scholar
|
|
54
|
Kubista B, Klinglmueller F, Bilban M,
Pfeiffer M, Lass R, Giurea A, Funovics PT, Toma C, Dominkus M, Kotz
R, et al: Microarray analysis identifies distinct gene expression
profiles associated with histological subtype in human
osteosarcoma. Int Orthop. 35:401–411. 2011.PubMed/NCBI View Article : Google Scholar
|
|
55
|
Zou C, Shen J, Tang Q, Yang Z, Yin J, Li
Z, Xie X, Huang G, Lev D and Wang J: Cancer-testis antigens
expressed in osteosarcoma identified by gene microarray correlate
with a poor patient prognosis. Cancer. 118:1845–1855.
2012.PubMed/NCBI View Article : Google Scholar
|
|
56
|
Muff R, Kumar RMR, Botter SM, Born W and
Fuchs B: Genes regulated in metastatic osteosarcoma: Evaluation by
microarray analysis in four human and two mouse cell line systems.
Sarcoma. 2012(937506)2012.PubMed/NCBI View Article : Google Scholar
|