Introduction
Cyclosporine A (CsA) is a potent immunosuppressant
that has been widely used as a first-line therapeutic to prevent
solid organ rejection after transplantation (1). However, determining the appropriate
dose of CsA is complicated by narrow therapeutic indices and
variability in intra- and inter-individual pharmacokinetics and
pharmacodynamics (2,3). Therefore, therapeutic drug monitoring
(TDM) is highly recommended. During therapy, CsA levels are
maintained within a narrow therapeutic window (4). Consequently, it is vital that the
concentrations of CsA are measured in blood samples in an accurate
and precise manner.
For several decades, semi-automated and automated
immunoassays were the most widely used methodology for determining
the levels of CsA in the blood. These methods included
chemiluminescent immunoassay (CMIA), ELISA, enzyme multiplied
immunoassay and fluorescence polarization immunoassay. However,
these methods lack specificity, as they cannot clearly distinguish
CsA from its metabolites (5-7);
this is a significant problem, particularly because the
concentration of CsA metabolites increases over the course of
treatment.
Ultra-performance liquid chromatography coupled to
high-resolution mass spectrometry (UPLC-HRMS) has already been
proven as an important analytical tool for the quantification of
drugs (8-11).
Although triple quadrupole mass spectrometers are commonly present
in clinical laboratories (12,13),
there are major advantages to the application of UPLC-HRMS. For
instance, UPLC-HRMS has a high mass accuracy (2-5 ppm), a resolving
power of 150,000 full width at half maximum (FWHM), provides full
scan data and the method is simple to develop. Collectively, these
factors make UPLC-HRMS a highly useful and powerful tool for
high-performance analyses of drugs and their metabolites (9,10).
However, only a small number of studies have
reported on the application of UPLC-HRMS for the detection of CsA
concentrations from a clinical viewpoint (5,6). In
the present study, an HRMS-based method for the determination of
CsA was developed and validated. The novel method was then compared
with a commercial CMIA assay by analyzing 127 samples from renal
transplant patients.
Materials and methods
Sample collection
In total, 127 blood samples were collected from
patients who had undergone kidney transplantation at the
China-Japan Friendship Hospital (Beijing, China) for TDM of CsA
from March 2019 to September 2019. All samples were collected using
EDTA as an anti-coagulant. Frozen blood samples were supplied in
routine blood collection tubes and stored at -80˚C prior to
analysis.
Materials and reagents
CsA (99% purity) was purchased from The European
Directorate for the Quality of Medicines & Healthcare and
CsA-d4 (95% purity) was purchased from Toronto Research Chemicals.
Chromatographic grade acetonitrile, methanol, ammonium acetate and
formic acid, were obtained from Thermo Fisher Scientific, Inc. Zinc
sulfate heptahydrate (analytical grade) was obtained from Sinopharm
Chemical Reagent Co., Ltd. Deionized water was purified with a
Milli-Q Plus Ultrapure water system (Millipore Corp.). The CMIA
method was performed on an Abbott ARCHITECT i1000SR system (Abbott
Laboratories) and required a calibrator and CsA kit (cat. no.
1L75-25); these were also obtained from Abbott Laboratories. The
acceptable ranges of CMIA quality control samples were defined as
per the manufacturer's instructions.
Instrumentation and UPLC-HRMS
conditions
Experiments were performed on an Ultimate 3000
system combined with a Q Exactive mass spectrometer (Thermo Fisher
Scientific, Inc.) that was used in full scan mode and positive
electrospray ionization. CsA, hydroxylated (H)CsA as the major
metabolite and internal standard CsA-d4 [internal standard (ISTD)
for CsA] in whole blood samples were separated on an Acquity UPLC
BEH C18 column (50x2.1 mm, 1.7 µm particle size; Waters) maintained
at 40˚C. Mobile phase A consisted of 2 mM ammonium acetate with
0.1% formic acid (v/v) in water. Mobile phase B consisted of 0.1%
formic acid (v/v) in acetonitrile. The gradient program started
with 45% B, increasing to 50% B at 1.0 min; this changed to 80% B
at 2.5 min. At 3.0 min, the mobile phase increased to 100% B then,
hold at 100% B for 2 min. The total instrumental analysis time was
6 min, including re-equilibration of the column. The flow rate was
set at 0.3 ml/min and the temperature of the auto-sampler was set
to 10˚C.
The optimized parameters of the HRMS system were as
follows: Electron spray ionization positive mode; full MS scan;
sheath gas and auxiliary gas flow rates of 28 arbitrary units (AU)
and 8 AU, respectively; a spray voltage of 3.70 kV; a capillary gas
heater temperature of 320˚C; a mass to charge ratio (m/z) range of
1,200-1,220; and a resolution of 70,000 (FWHM). The maximum
injection time was 50 msec and the mass tolerance was set to 5 ppm.
Analytes and internal standards with respective m/z were as
follows: m/z 1,202.8485 for CsA [M+H]+, m/z 1,218.8420
for HCsA [M+H]+ and m/z 1,206.8727 for ISTD
[M+H]+.
Preparation of stock solutions,
calibration curves and quality control samples
A stock solution of CsA and a working standard of
ISTD were prepared in methanol at concentrations of 200 µg/ml and
400 ng/ml at room temperature (RT), respectively. Further
calibration standards and quality controls (QCs) were prepared by
serial dilutions using methanol. A calibration curve for blood CsA
was established by diluting the compound in drug-free human blood
from different healthy donors to final concentrations of 5, 12.5,
25, 50, 100, 200, 400 and 800 ng/ml, and by preparing QC samples at
15, 350 and 700 ng/ml. These solutions were stored in 200-µl
aliquots at -80˚C prior to use.
Sample preparation
Prior to analysis, zinc sulfate heptahydrate
solution (200 µl, 400 mM) was added to each blood sample, followed
by gentle mixing. Subsequently, ISTD working solution (50 µl) was
added and the mixture was vortexed for 1 min. Afterwards, 400 µl of
acetonitrile was added and the mixture was vortexed again for 5 min
and then centrifuged at 11,290 x g for 5 min at 4˚C. Next, 800 µl
of supernatant was transferred to a clean polypropylene tube and
then evaporated to dryness at 40˚C in a vacuum centrifugal
concentrator. The residues were finally reconstituted with 200 µl
of the mobile phase A/B (55:45, v/v); 5-µl aliquots were injected
into the UPLC system for analysis.
Validation of the LC-HRMS assay.
General
The experimental method was validated in strict
accordance with the current guidelines from the Food and Drug
Administration (FDA) (14). The
validation of the method involved specificity, linearity, the lower
limit of quantification (LLOQ), carryover effect, between- and
within-run accuracy and precision, matrix effect, recovery and
storage stability.
Specificity
Six drug- and internal standard (ISTD)-free blood
samples were individually analyzed to detect interference from
endogenous components. The specificity was acceptable when the
interfering peak area was <20% of the peak area of CsA for the
LLOQ and 5% for the ISTD.
Linearity and LLOQ
Linearity was assessed by measuring the seven
calibration standard concentrations in the blood. A calibration
curve was then created by plotting the peak area ratios of CsA to
the ISTD against the concentration. The linearity of the
calibration curve was assessed using the weighted least-squares
method with the reciprocal of the concentration squared
(1/x2) serving as a weighting factor. The LLOQ was
evaluated by analyzing five replicates of mixed whole blood samples
at a concentration of 5.0 ng/ml. The concentration of HCsA was then
calculated using the CsA calibration curve.
Carryover
Carryover was investigated by injecting five blank
samples from different donors after the highest calibration
standard (800 ng/ml). The peak area in the first blank sample was
required to be <20% of the LLOQ for CsA and 5% for ISTD.
Accuracy and precision
The accuracy and precision of the method were
repeatedly assessed using four concentrations of QC samples (LLOQ,
15, 350 and 700 ng/ml) five times within a single run (intra-day)
and in a single series per day on three consecutive days
(inter-day). For the accuracy assay, the mean value was required to
be within 15% (20% for LLOQ) of the nominal values for the QC
samples. The precision was not supposed to exceed 15% (20% for the
LLOQ) of the coefficient of variation.
Dilution integrity
To test dilution integrity, five blank matrix
samples were spiked with a CsA concentration that was ~50% above
the highest calibration standard and then diluted 5-fold with blank
matrix after sample preparation. The measured concentration was
then back-calculated and compared to the nominal concentration. The
accuracy were required to be within 85 and 115%, the precision
should not exceed ±15%, respectively.
Recovery
To evaluate the recovery of CsA, three
concentrations of CsA (15, 350 and 700 ng/ml) were tested using six
different blank blood samples. Recovery was then calculated as the
mean ratio between the peak area of spiked samples after extraction
and prior to extraction (CsA spiked in post-protein precipitated
drug-free whole blood). The variation in recovery across all
concentrations was required to be consistent and <15%.
Matrix effect
The matrix factor (MF) was calculated by comparing
the peak areas of CsA in blank matrix from six individual donors
after sample processing, with the peak areas of CsA in the absence
of a matrix composed of methanol and water (50:50, v/v) for three
different concentrations of CsA (15, 350 and 700 ng/ml). The
ISTD-normalized MF (the MF of CsA divided by the MF of CsA-d4) was
required to have a variation of <15%.
Stability
Stability was tested in triplicate using QC samples
(15, 350 and 700 ng/ml) under different conditions (in whole blood:
RT for 12 h, three consecutive freeze-thaw cycles from -80˚C to RT,
4˚C for 3 days and -80˚C for 60 days; post-treatment: 10˚C for 24
h). A fresh calibration curve was used for each quantification. CsA
was assumed to be stable if the mean concentration changes varied
within an acceptable range of ±15% (%bias) from the nominal
concentration.
CMIA assay
The CMIA assay was performed in accordance with the
manufacturer's guidelines for the CsA assay kit and was carried out
with an automatic ARCHITECT i1000SR analyzer (Abbott
Park) that was approved by the FDA. For automated analysis, 200-µl
aliquots of the samples, calibrator and QCs were introduced into
the system. For calibration, a blank calibrator and five
multi-level whole-blood calibrators containing concentrations of
CsA of 40-1,500 ng/ml, were provided by the manufacturer.
Comparative analyses between UPLC-HRMS
and CMIA
In total, 127 CsA samples were analyzed by the
UPLC-HRMS method and the CMIA. Normal distributions were evaluated
using the Shapiro-Francia test. The correlation coefficients and
regression equations of the measurements for the two methods were
evaluated by Spearman's test and Passing-Bablok regression
(15) using MedCalc version 15
(MedCalc Software bvba) and SPSS version 22 (IBM Corp.). The level
of agreement between the two methods was evaluated by Bland-Altman
plots (16). The Wilcoxon test in
MedCalc was applied to compare the medians obtained from HRMS and
CMIA. P<0.05 was considered to indicate a statistically
significant difference.
Results
Validation of the LC-HRMS assay.
General
Representative chromatograms of the LC-HRMS method
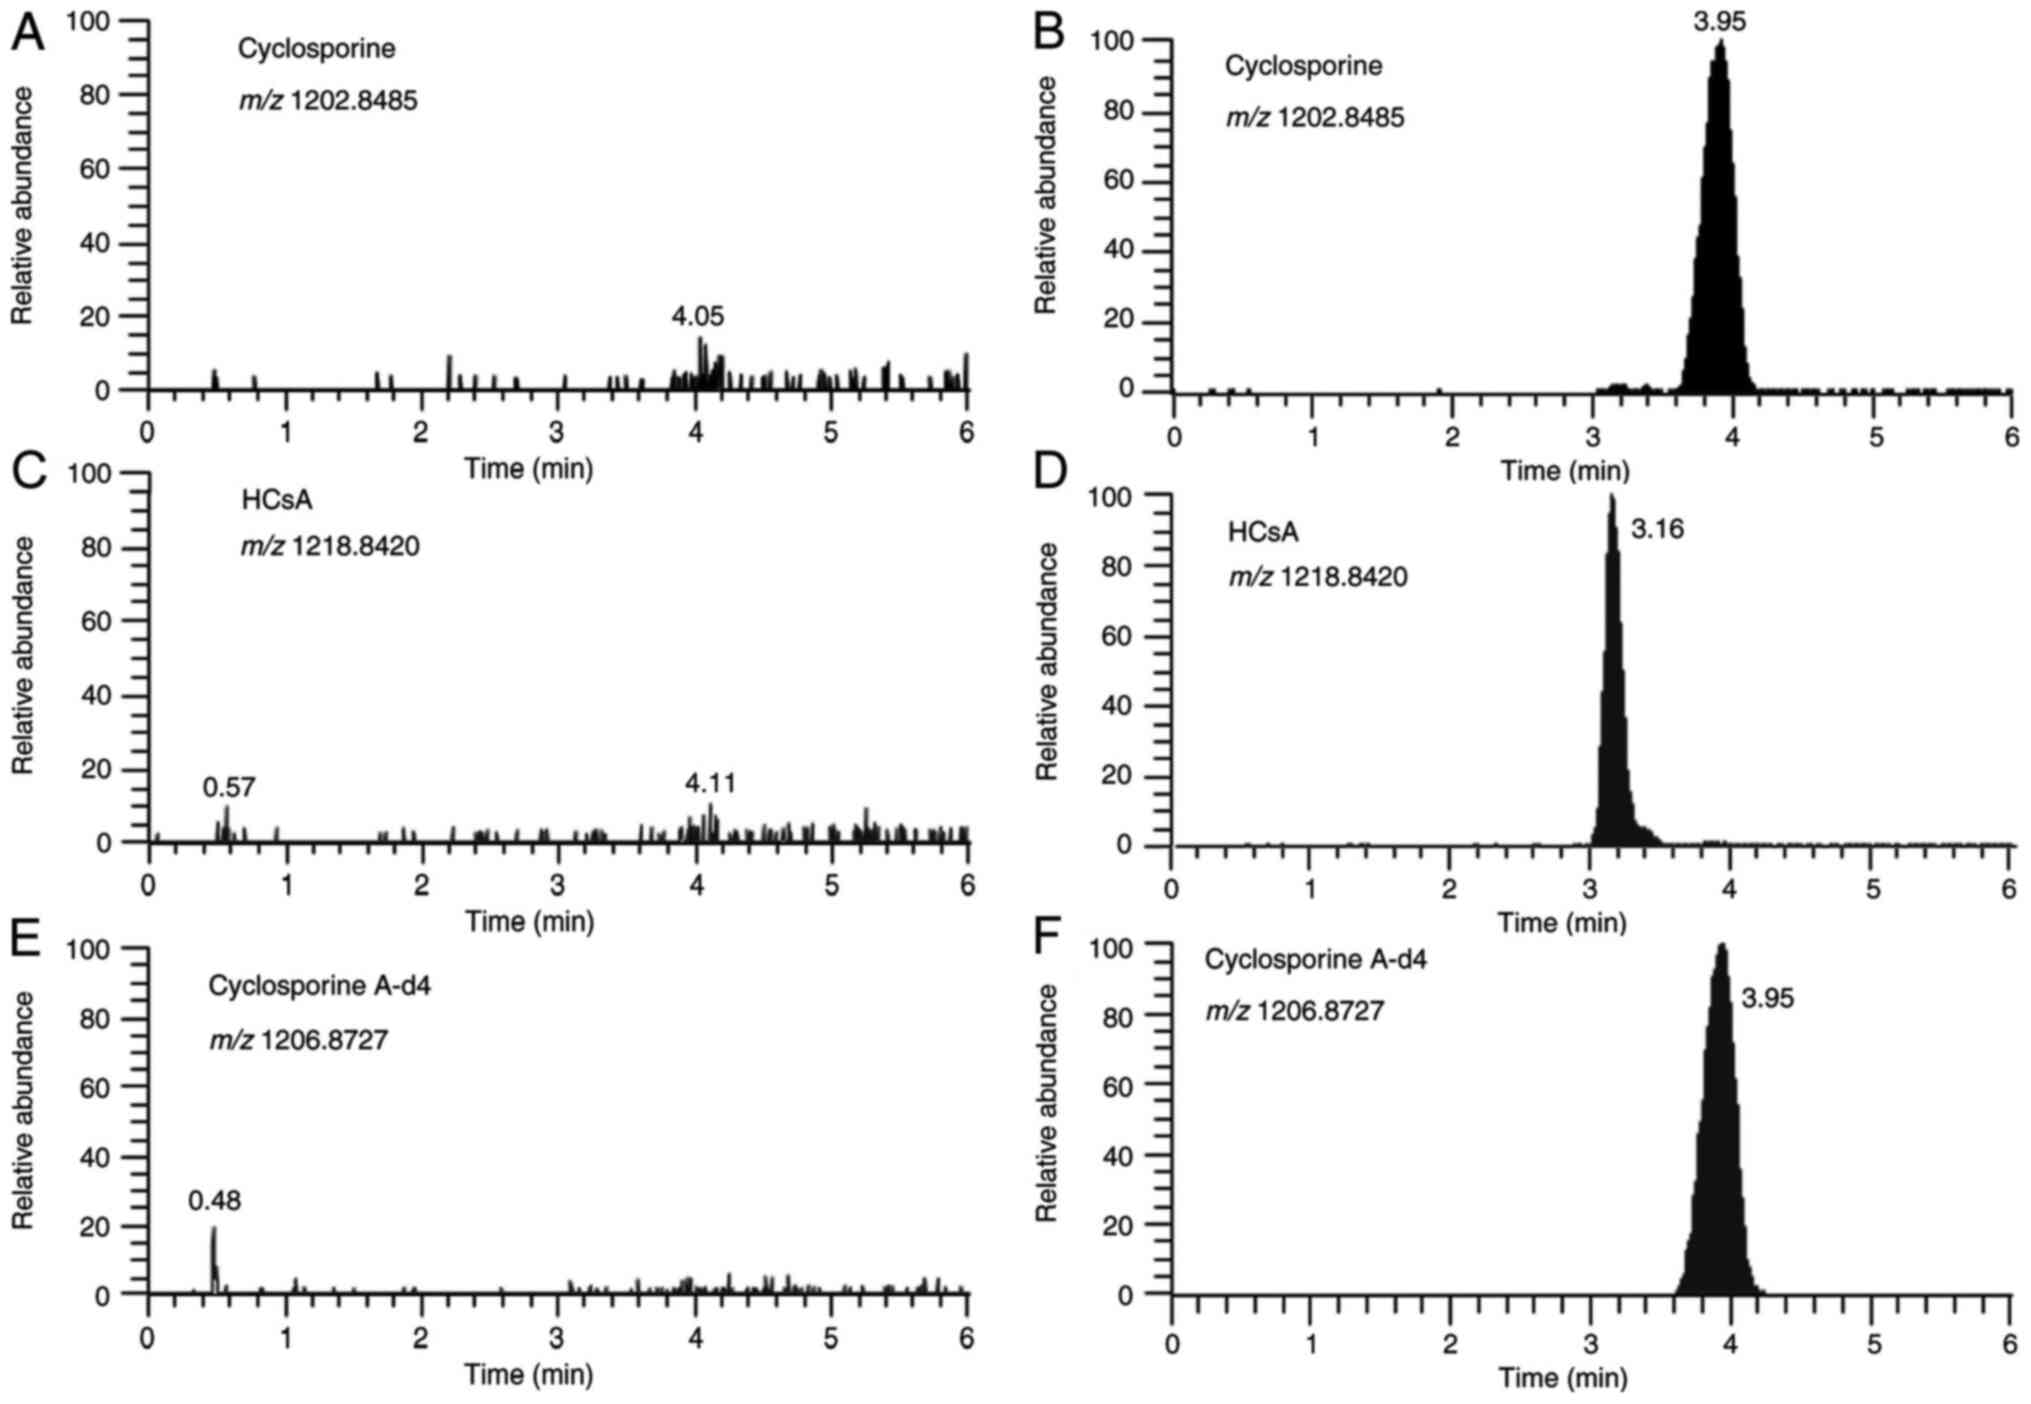
for CsA, the ISTD and HCsA, are presented in Fig. 1. The analytical run time was 6 min,
including the time required to equilibrate the column to baseline
conditions prior to the next injection.
Specificity
The LC-HRMS assay had excellent specificity. For the
endogenous compounds in the six individual donors of the blank
matrix, no evidence of interference was observed.
Linearity and LLOQ
The calibration curve was calculated using 8
calibrators with a linear regression model and weighting factor
(1/x2). Results were linear (r2>0.993)
within a detection range of 5-800 ng/ml (r2>0.993).
For LLOQ samples, the signal-to-noise ratio was at least
≥103.9.
Carryover
Peak areas for five different drug-free blood
samples, as measured after the highest calibrator sample, were
consistently below 5.3% of the LLOQ and below 0.4% for the ISTD,
respectively.
Accuracy and precision
For CsA, the within-run accuracy ranged from 98.6 to
114.9% (mean, 105.4%), the within-run precision ranged from 2.3 to
5.6%, the between-run accuracy ranged from 95.3 to 114.3% (mean,
103.2%) and the between-run precision ranged from 4.7 to 9.2% at
all QC levels. The results for accuracy and precision are
summarized in Table I.
 | Table ISummary of accuracy, precision and
stability of cyclosporine A in human blood using ultra-performance
liquid chromatography high-resolution mass spectrometry. |
Table I
Summary of accuracy, precision and
stability of cyclosporine A in human blood using ultra-performance
liquid chromatography high-resolution mass spectrometry.
| | Intraday | Interday | Storage
timea |
|---|
| Compound
(concentration) | Accuracy (%) | Precision (RSD,
%) | Accuracy (%) | Precision (RSD,
%) | RT/12 h | -80˚C/1 freeze-thaw
cycle | -80˚C/2 freeze-thaw
cycles | 4˚C/3 days | -80˚C/60 days | 10˚C/24 h
(extracted samples) |
|---|
| LLOQ (5 ng/ml) | 102.7 | 2.4 | 114.3 | 5.4 | | | | | | |
| QC1 (15 ng/ml) | 114.9 | 5.6 | 110.4 | 9.2 | 3.5 | -3.8 | -4.2 | -6.4 | -4.0 | 0.1 |
| QC2 (350
ng/ml) | 105.3 | 3.1 | 97.8 | 4.7 | -5.1 | 2.9 | 2.6 | -8.2 | -3.3 | -5.7 |
| QC3 (700
ng/ml) | 98.6 | 2.3 | 95.3 | 6.2 | -2.7 | -4.9 | 3.2 | -7.1 | 5.8 | -7.5 |
Dilution integrity
For diluted samples, the accuracy ranged from 90.4
to 113.1% and the precision ranged from 1.1 to 4.1% (Table SI). These data indicated that the
mean dilution did not affect the accuracy and precision of the
method.
Recovery
The recovery at three QC levels (15, 350 and 700
ng/ml) after preparation varied between 86.8 and 92.5%.
Matrix effect
The MFs across all QC levels ranged from 108.3 to
125.4%, and the variation of the ISTD-normalized MF was <5.5%.
These data indicated that when used as the ISTD, CsA-d4
fully compensated for the matrix effect.
Stability
CsA was stable under all of the conditions tested at
three QC levels with an inaccuracy range of -8.2 to 5.8%. These
results are presented in Table
I.
CMIA assay
The CMIA assay was based on a fully automated method
and was performed in accordance with the manufacturer's
instructions. The assay was validated at six levels with a range of
calibrators at concentrations of 0, 40.0, 150.0, 400.0, 800.0 and
1,500.0 ng/ml. To control the quality of the analyses, three levels
of QC concentrations were tested with acceptable results. The
results were 70.3 ng/ml (target, 79.7 ng/ml; acceptable range,
44.4-115 ng/ml), 261.9 ng/ml (target, 283 ng/ml; acceptable range,
227-340 ng/ml) and 812 ng/ml (target, 830 ng/ml; acceptable range,
556-1,105 ng/ml).
Comparison between UPLC-HRMS and
CMIA
A total of 127 blood samples were acquired from
Chinese renal transplant patients (72 males and 55 females); median
age, 51 years (range, 24-76 years). The median number of years
post-transplantation was 11 (range, 0.85-24). None of the data were
distributed normally (P<0.001, Shapiro-Francia test). The
concentration measured by UPLC-HRMS was 67.06 ng/ml (interquartile
range, 50.54-90.41 ng/ml); this was significantly lower than that
measured by CMIA [85.70 ng/ml (interquartile range, 61.98-115.70
ng/ml)]. According to a paired-samples Wilcoxon test, the mean
values of these measurements were significantly different
(P<0.0001). Passing-Bablok regression analysis revealed a poor
linear correlation between UPLC-HRMS and CMIA (Fig. 2). The regression equation for the
assay according to the two methods was CCMIA = -2.54 +
1.34 CUPLC-HRMS with r=0.818; the 95% confidence
interval for the intercept was -10.29-5.52 (including zero) and the
slope was 1.22-1.47 (not including 1). As MS is more specific than
immunoassay, it is recommended as a gold standard for CsA analysis
(4,17,18);
thus, UPLC-HRMS was used as the reference method. Considering
UPLC-HRMS as the reference method, these results indicated the
presence of proportional bias in the CMIA. According to
Bland-Altman plots (Fig. 2), a
median bias of 25.46% (range, -25.25 to 76.17%) was detected. The
highest discrepancy was observed at moderate concentrations.
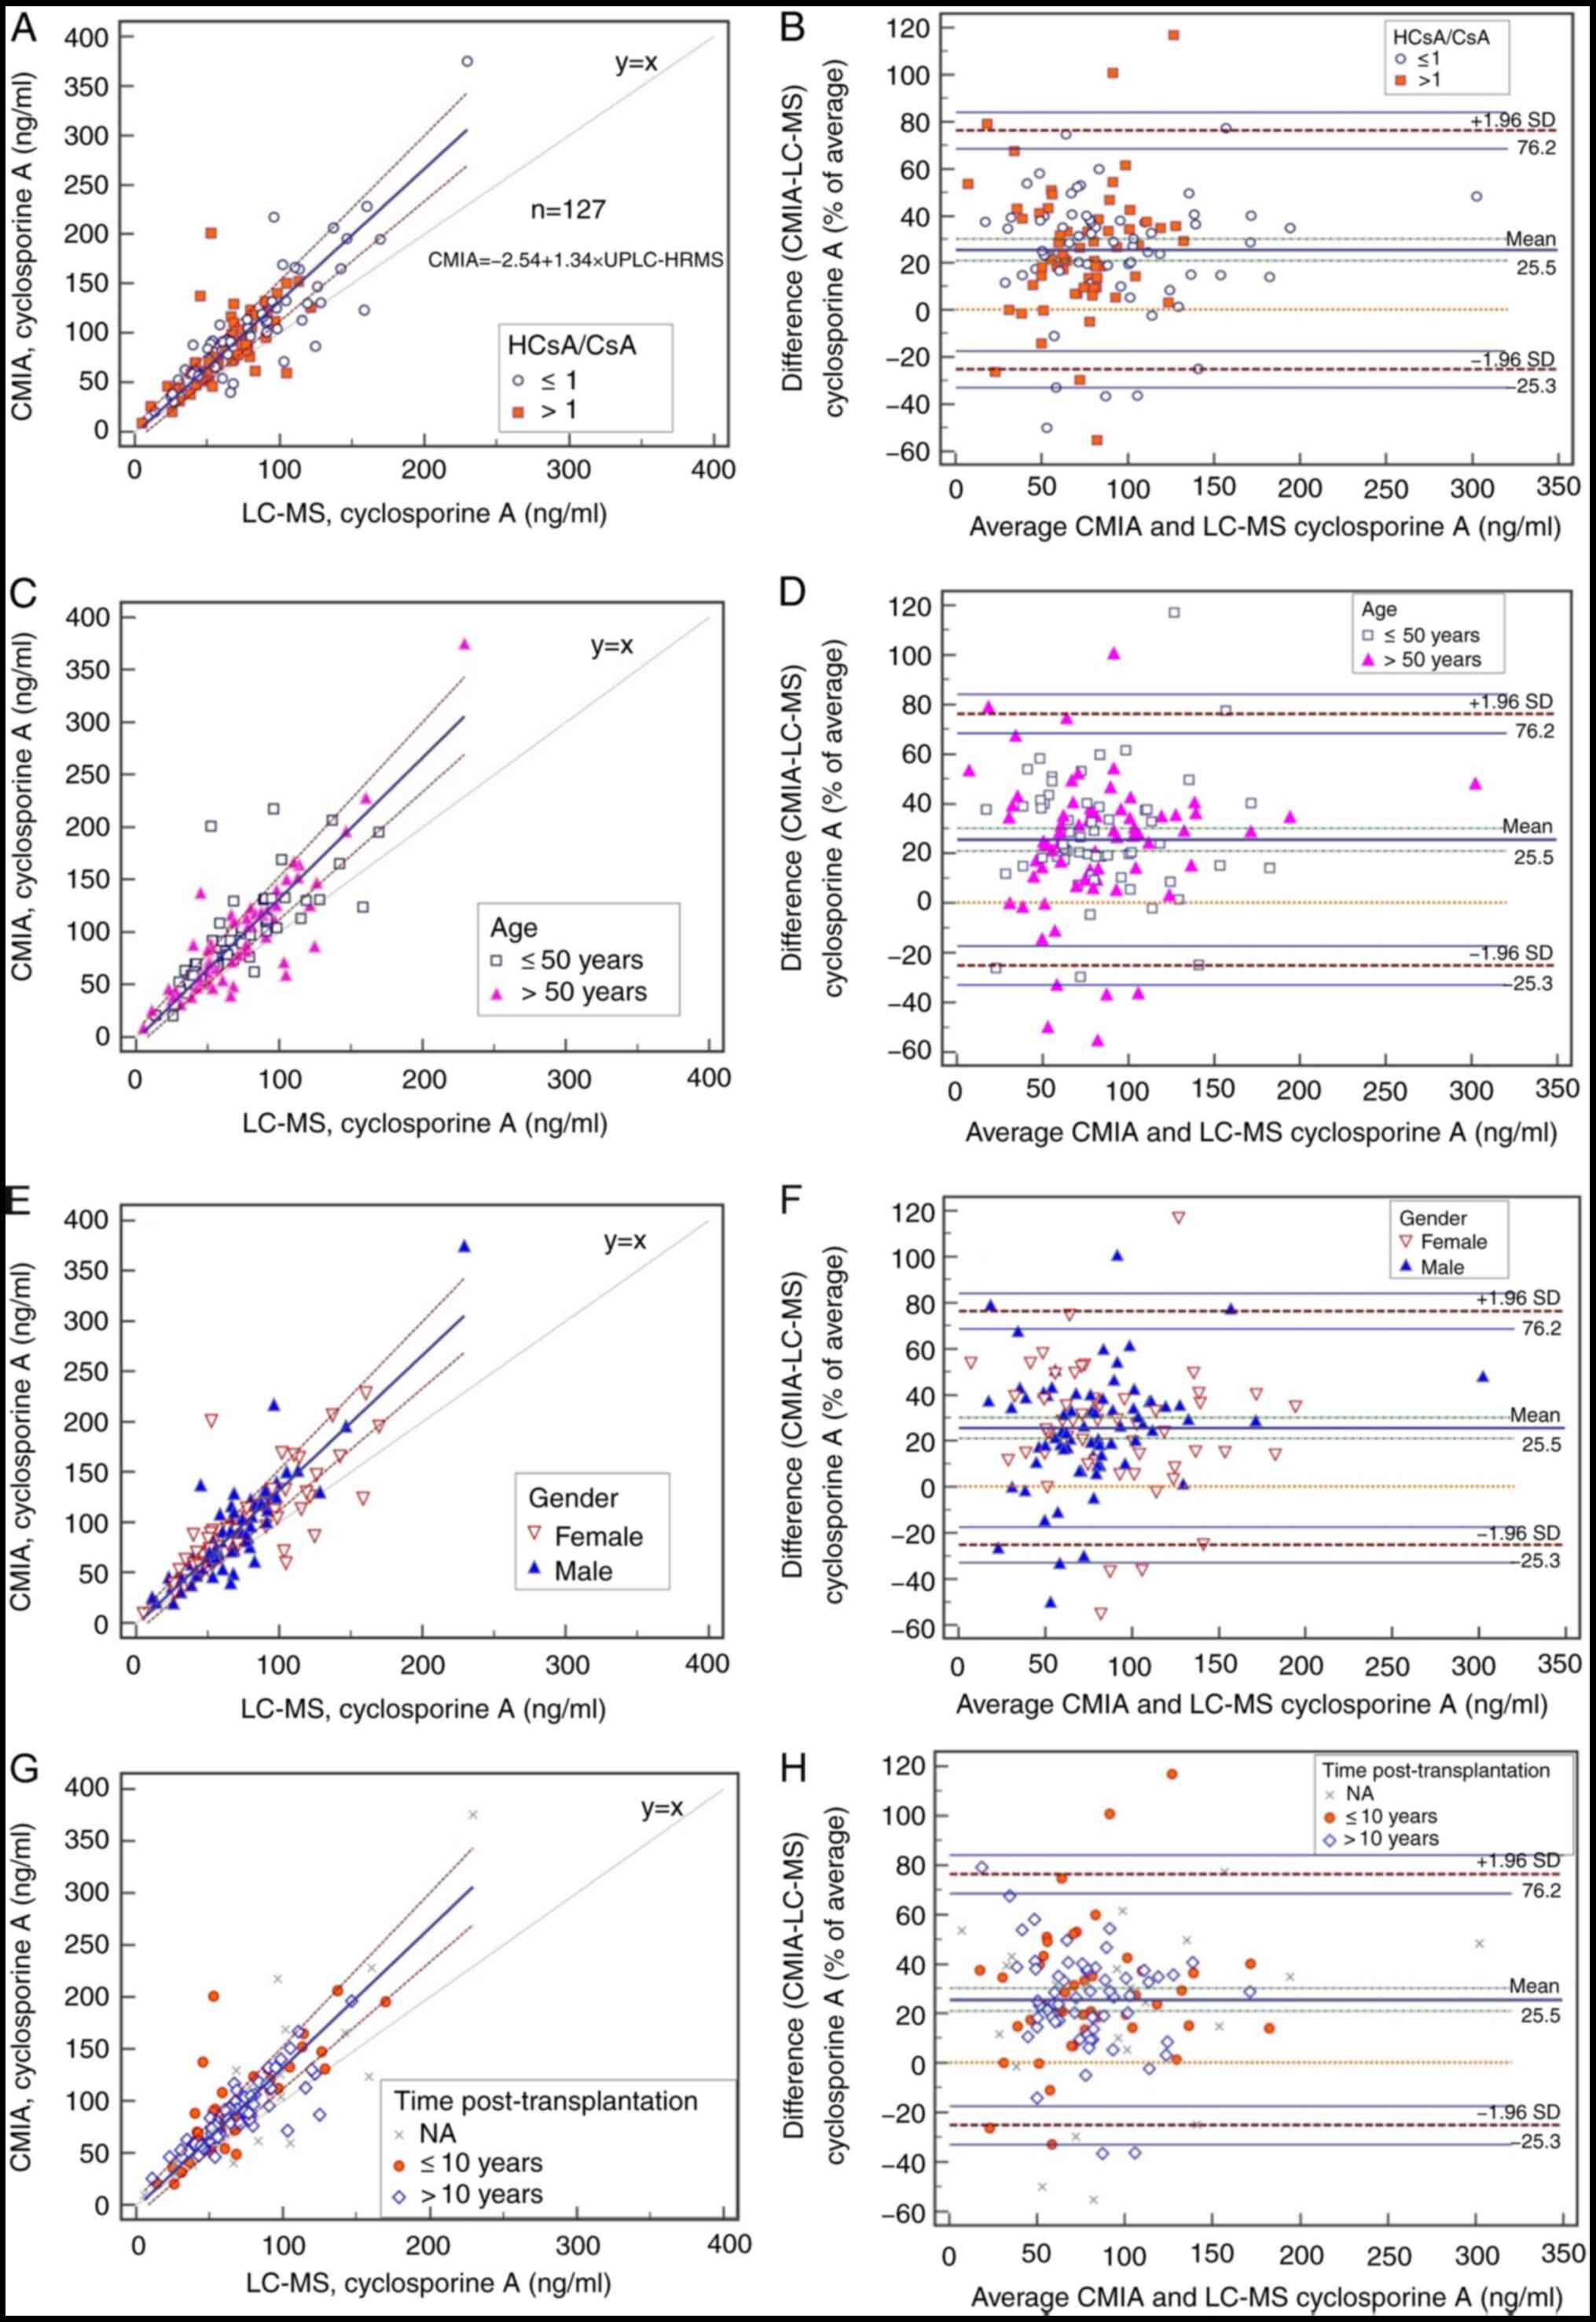 | Figure 2Method comparison using Passing-Bablok
regression (left: A, C, E and G) and relative (%) Bland-Altman
analysis (right: B, D, F and H) of the new Ultra-Performance LC
High-Resolution MS method vs. the CMIA assay. Sample points for
each subgroup include (A and B) metabolic ratio, (C and D) age, (E
and F) gender and (G and H) the length of time after
transplantation. The lines of correlation are represented by solid
blue lines, and the 95% limits of agreement are represented by
dashed lines. NA, information not available; HCsA, hydroxylated
cyclosporine A; SD, standard deviation; LC-MS, liquid
chromatography tandem mass spectrometry; CMIA, chemiluminescent
microparticle immunoassay. |
The International Association for Therapeutic Drug
Monitoring and Clinical Toxicology (IATDMCT) has advised that a
comparison between two methods should include samples from a wide
variety of pathologic conditions (4) and certain reports have indicated that
the type of organ transplanted, time after transplantation and time
of blood testing (peak or trough levels) may influence the
metabolite-to-CsA ratio (19-21).
Thus, the patients were separated into several groups to explore
the effect of the metabolic ratio for CsA (HCsA/CsA) (3), age, gender, and the length of time
post-transplantation, on the bias between CMIA and HRMS. In the
present study, the sub-groups were designed according to the median
in each group (except gender), in order to meet the statistical
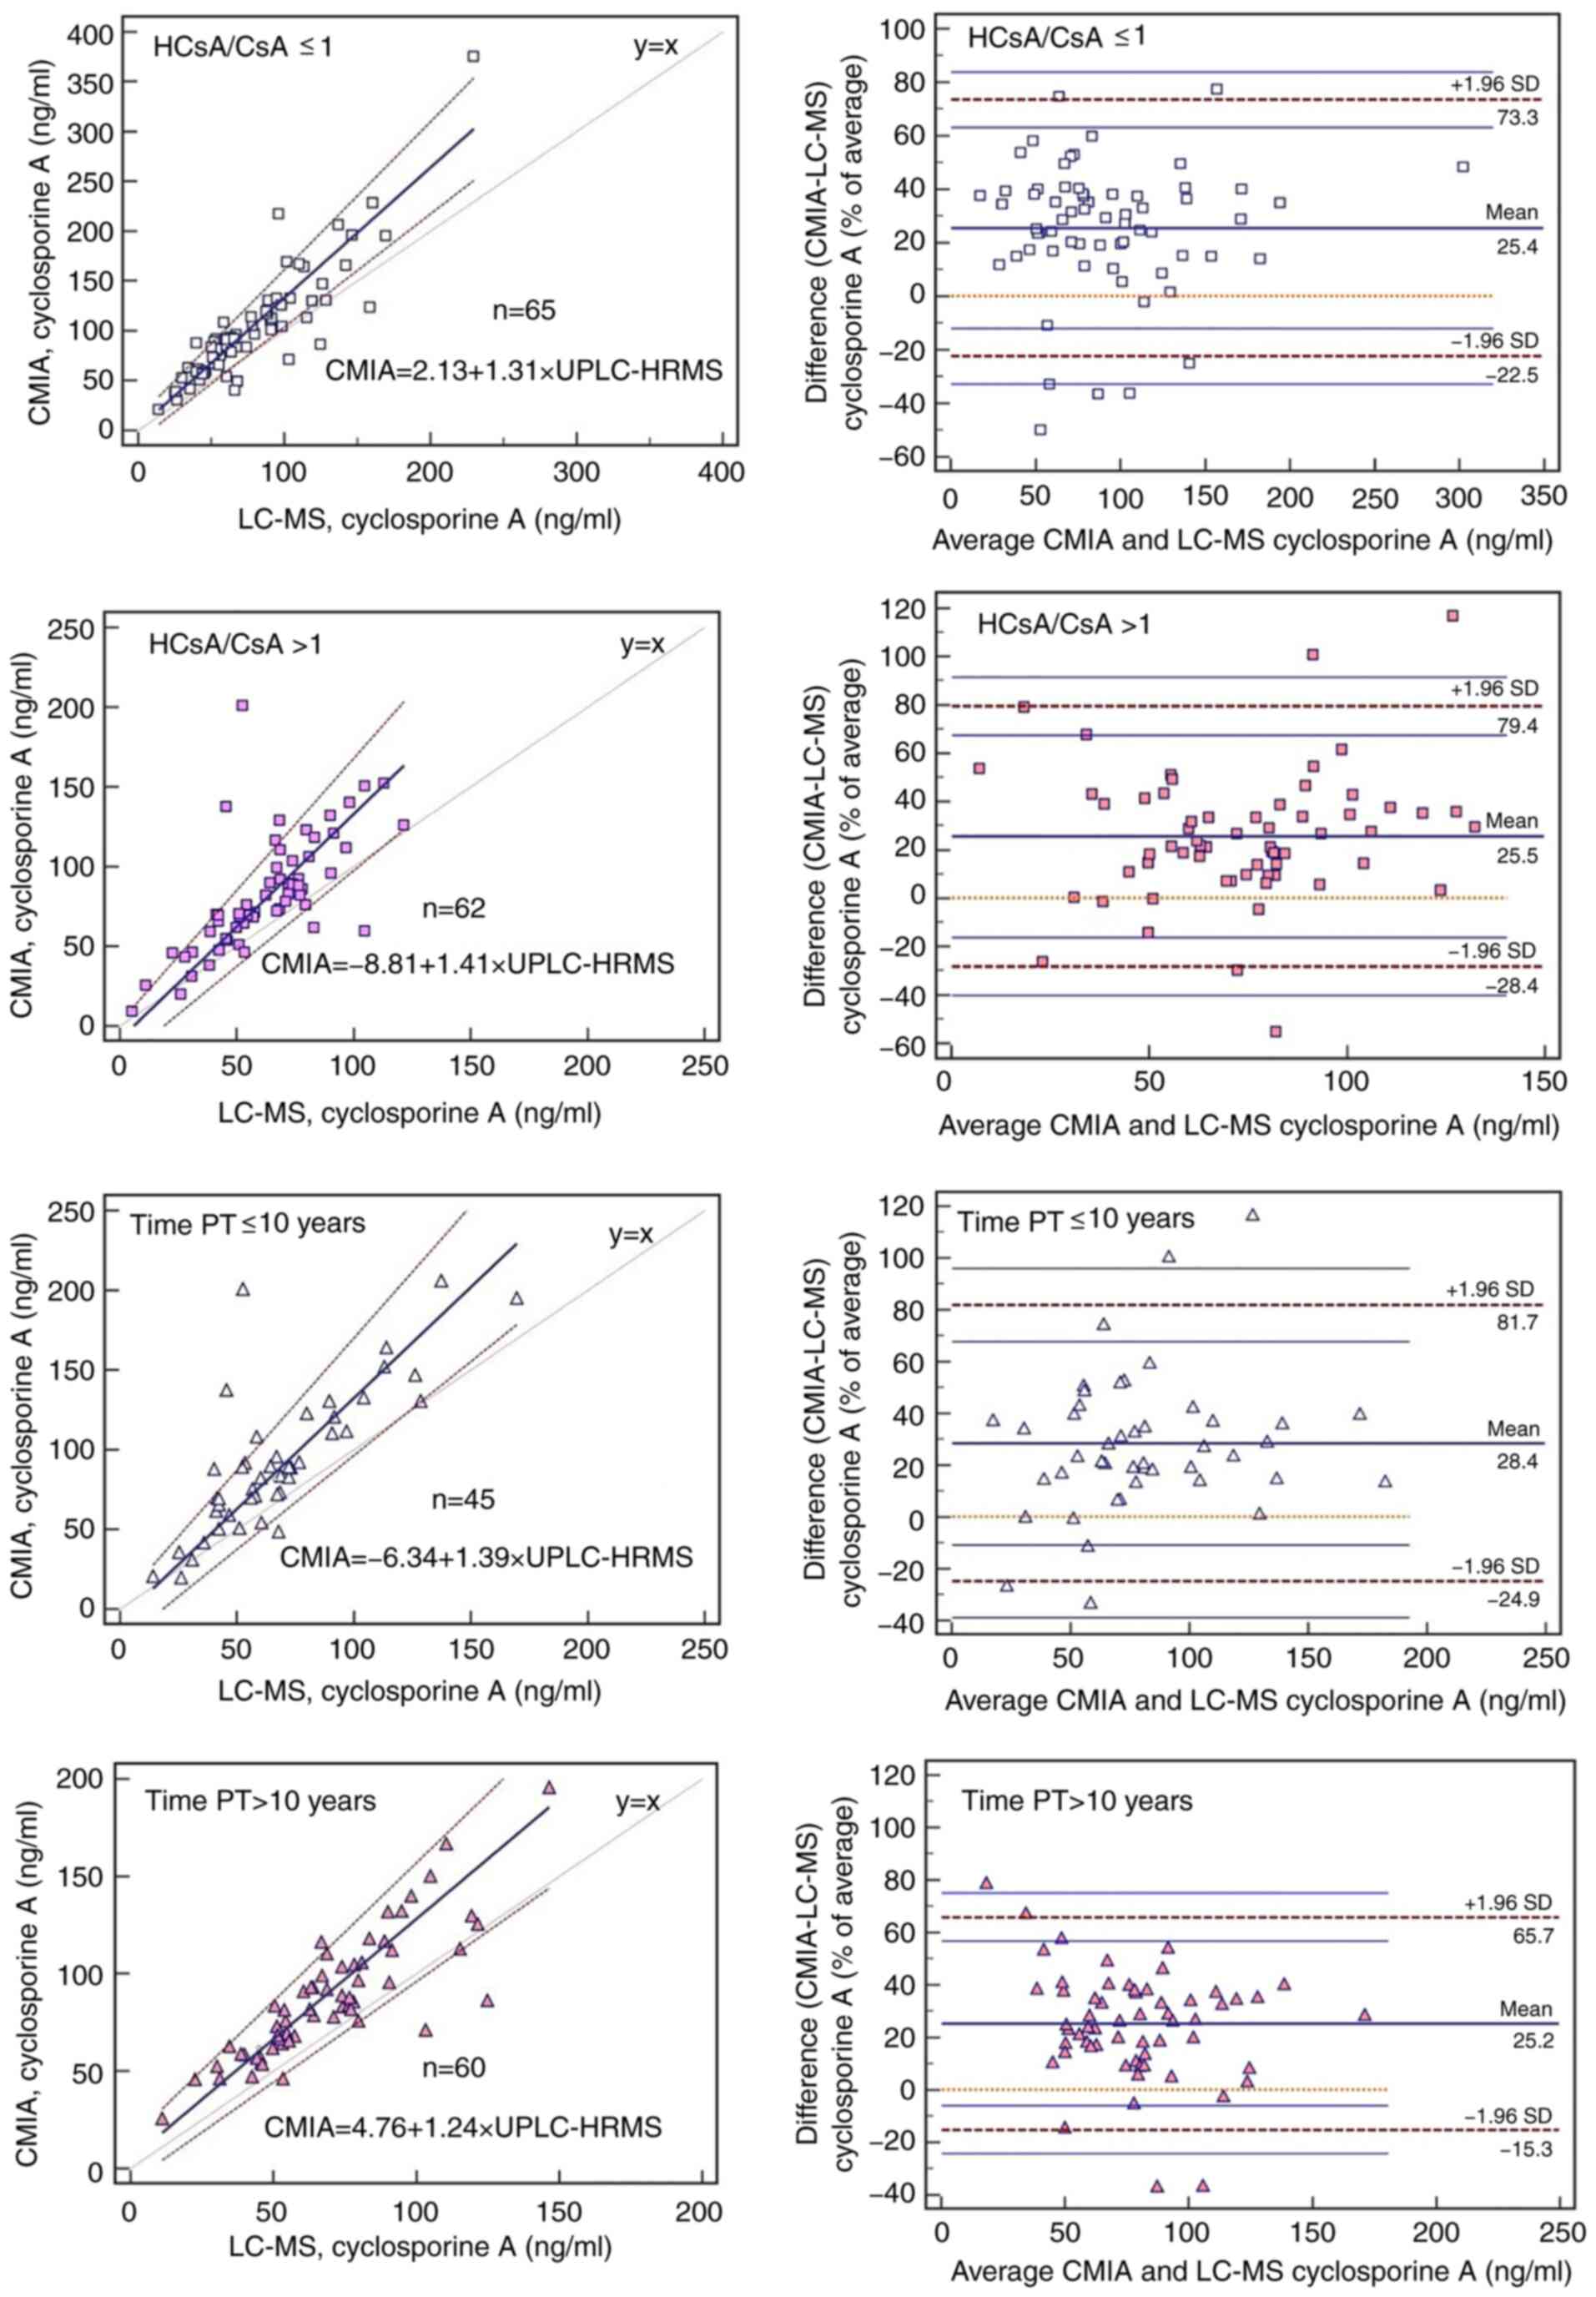
requirements. As presented in Figs.
2A and 3, when the data were
divided according to the ratio of HCsA to CsA, the highest
discrepancy was observed at high ratios (HCsA/CsA>1). Table II presents data relating to the
detection of CsA by UPLC-HRMS vs. CMIA for the blood samples
analyzed and provides detailed results for the Passing-Bablok
correlation, Spearman correlation coefficient, a comparison of the
correlation coefficients and Bland-Altman mean bias. The
concentrations obtained with the two methods differed significantly
among all subgroups (P<0.0001) and higher median values were
obtained with CMIA. Although there were no significant differences
between subgroups, the HCsA/CsA groups had the lowest correlation
coefficients (P=0.059) (Table II).
When data were grouped according to the length of time after
transplantation, the narrowest limits of agreement for mean bias
(from -15.32 to 65.69%) were observed for the longest
post-transplantation time (>10 years), as determined by
Bland-Altman analysis (Fig. 3).
| Table IIComparison between UPLC-HRMS and CMIA
for the determinations of CsA in human blood. |
Table II
Comparison between UPLC-HRMS and CMIA
for the determinations of CsA in human blood.
| Item | No. of samples | Concentration
according to UPLC-HRMS, ng/ml | Concentration
according to CMIA, ng/ml | Passing-Bablok
regression equation | 95% CI of the
intercept | 95% CI of the
slope | Spearman
correlation coefficient (P-value) | P-value for
comparison of correlation coefficients | Bland-Altman Mean
bias (lower-upper limit) |
|---|
| HCsA/CsA | | | | | | | | 0.059 | |
|
≤1 | 65 | 67.9a (14.0-229.5) | 91.9
(69-375.2) | y=2.13+1.31x | -9.68-13.34 | 1.14-1.48 | 0.860
(<0.0001) | | 25.41
(-22.52-73.34) |
|
>1 | 62 | 66.9a (5.3-121.6) | 77.0
(9.1-200.8) | y=-8.81+1.41x | -22.95-2.51 | 1.20-1.65 | 0.740
(<0.0001) | | 25.52
(-28.36-79.39) |
| Age, years | | | | | | | | 0.539 | |
|
≤50 | 59 | 68.3a (14.0-169.7) | 88.8
(20.0-217.5) | y=3.67+1.20x | -7.56-16.32 | 1.04-1.40 | 0.841
(<0.0001) | | 27.10
(-20.01-74.23) |
|
>50 | 68 | 66.8a (5.3-229.5) | 84.7
(9.1-375.2) | y=-7.29+1.42x | -17.68-2.65 | 1.28-1.60 | 0.805
(<0.0001) | | 24.03
(-29.80-77.86) |
| Sex | | | | | | | | 0.840 | |
|
Female | 55 | 68.7a (5.3-169.7) | 91.9
(9.1-228.2) | y=8.25+1.17x | -4.77-17.87 | 1.02-1.39 | 0.817
(<0.0001) | | 25.34
(-27.78-78.47) |
|
Male | 72 | 66.9a (11.1-229.5) | 82.4
(20.0-375.2) | y=-12.45+1.49x | -24.68-1.25 | 1.32-1.70 | 0.829
(<0.0001) | | 25.55
(-23.62-74.72) |
|
Timepost-transplantation (years) | | | | | | | 0.155 | | |
|
≤10 | 45 | 60.3a (14.0-169.7) | 87.9
(20.0-206.1) | y=-6.34+1.39x | -21.62-4.13 | 1.18-1.66 | 0.768
(<0.0001) | | 28.38
(-24.93-81.69) |
|
>10 | 60 | 66.9a (11.1-146.5) | 83.4
(25.6-195.9) | y=4.76+1.23x | -7.34-14.91 | 1.03-1.42 | 0.863
(<0.0001) | | 25.18
(-15.32-65.69) |
Discussion
In the present study, the successful development of
an UPLC-HRMS-orbitrap-based method for the determination of CsA in
blood samples was described. This novel method was validated and
compared with the commercial CMIA in blood samples from 127
patients. To the best of our knowledge, there is only one other
published application of the orbitrap mass spectrometer related to
TDM of CsA (5).
Although most published MS methods for
immunosuppressants are relying on ammonium adducts of those drugs
(5,6). In the present study, the ammonium
adduct of CsA had almost the same intensity as the protonated
adduct. Furthermore, when the ammonium adduct was chosen as the
monitoring ion, the interference peak, i.e. the isotopic peak of
[HCsA+H]+, in patients' whole blood appeared at a
retention time of 3.16 min. As the major CsA metabolites are the
monohydroxylated AM1 and AM9 and the demethylated AM4N (3), the amount of hydroxylated and
methylated metabolite of CsA in-source fragmentation ions
(m/z=1,218.8) is too small to interfere with the protonated adduct
of HCsA. Thus, the present MS method was relying on protonated
adduct.
HRMS has numerous advantages over existing methods,
including high mass accuracy, high resolution and the ability to
analyze data retrospectively (22).
Perhaps the only disadvantage of HRMS when compared to the tandem
mass spectrometer is the low sensitivity of the quantitative
performance. To improve the sensitivity of this method, sample
condensation was chosen instead of single organic solvent
precipitation. Furthermore, the LLOQ was 5 ng/ml; this was lower
than that reported by other HRMS studies (24.2-28 ng/ml) (5,6),
meaning higher sensitivity. The recoveries were 86.8 to 92.5%;
these values were similar to those published in other studies (75.7
to 112.0%) using the one-step preparation procedure (23-26).
The variation of ISTD-normalized MF was <5.5%; this was lower
than the values estimated by previous studies (6.3 to 10.3%)
(23,24). CsA was stable in human whole blood
under the tested conditions, which were similar to the conditions
used in previous studies (23-26).
The comparison of UPLC-HRMS with CMIA was performed
using a large number of samples (n=127), thus allowing for
meaningful statistical analysis (40 ≤n ≤100), as recommended by
IATDMCT. In addition, the two methods were compared by an unbiased
procedure as Passing Bablok regression and Bland-Altman plot
according to the recommendations of the IATDMCT (4). A significant discrepancy was observed
between the measurements provided by the two assays. The mean
concentration measured by CMIA was higher than that determined by
the novel UPLC-Orbitrap-MS based method. On average, the
overestimation by CMIA was ~25.5%, but in certain cases, it was as
high as 120%.
A well-known problem when quantifying the
concentration of CsA with CMIA is interference from CsA
metabolites; HCsA (including AM1, AM1c, AM9 and AM99N) may result
in 6.9% cross-reactivity relative to the parent drug. AM1, AM1c and
AM9 possess partial immunosuppressive activity; on the other hand,
AM1 and AM9 are related to renal transplantation rejection and
exhibit nephrotoxic effects (27,28).
Although numerous researchers have reported the overestimation of
immunoassays with regards to CsA analysis when compared with MS
(23-26,29-32),
the potential influence of drug-to-metabolite ratios on positive
bias has remained to be determined. In the present study,
semiquantitative determination of the metabolites HCsA was
performed by comparing the integration of the peaks, from HCsA to
the area of CsA according to the calculation method of a previous
study (11), as standards for the
metabolites were not available. Furthermore, AM1, AM1c, AM9 and
AM99N were not quantified due to the lack of purified metabolites.
The data were then divided into two subgroups by HCsA/CsA. Although
the measurements of UPLC-HRMS and CMIA were weakly correlated in
the HCsA/CsA >1 group, overestimation was high in both of the
HCsA/CsA groups. As the cross-reactivity of the metabolites HCsA
alone was not able to fully explain the overestimation,
between-patient variables were considered in the further
analysis.
Therefore, a number of between-patient variables,
including age, gender and the length of time after transplantation,
were analyzed by appropriate statistical methods. The CsA
concentration in patients with long post-transplantation times
(>10 years) determined by CMIA exhibited the lowest deviation
from the UPLC-HRMS results among the parameters in the different
patient groups. Higher age did not significantly influence the
deviation between the two methods, nor did gender. It appeared that
the overestimation of the CMIA when compared to the UPLC-HRMS
method may be due to the CsA metabolic ratio and the length of time
post-transplantation. The higher levels determined by CMIA are
certainly due to the extensive metabolism of CsA and
cross-reactivity of the metabolites that cannot be separated from
CsA (6,7). However, the influence of the factor of
time post-transplantation on the metabolic ratio of CsA remains to
be determined. In the present cohort, no further details were
available to better investigate this point. It is essential to be
able to determine the true value of CsA when managing patients as
this result may influence clinical decisions, such as the
adjustment of dosage that may lead to viral infection or rejection.
Clearly, the use of UPLC-HRMS procedures for TDM of cyclosporine
provides a more sensitive means of detection in samples from
patients receiving low-dose cyclosporine. This method allows for
more selective quantification of samples from new transplant
recipients and significantly reduces any errors in dosing that may
occur due to metabolite cross-reactivity when combined with varying
degrees of overestimation by CMIA.
There are certain deficiencies of the present study:
i) Sample preparation was time-consuming; thus, a more convenient
method, such as a dephospholipid precipitation plate, will be used
in the next study to improve the procedure; ii) the mass range
should be assigned as m/z 1,200-1,241 to check the intensity of
sodium adducts and rule out a decrease in sensitivity; iii) the
influence of co-medicated drugs on CsA analysis were not
evaluated.
Ongoing research is now investigating the potential
influence of a wide variety of pathological conditions on the
observed bias between these two methods, including different
transplant types, ethnic backgrounds and drug interactions.
In conclusion, in the present study, a novel
UPLC-HRMS procedure for the measurement of CsA in human whole blood
was successfully developed and validated. The positive bias of the
CMIA for renal transplant patients when compared to the novel
UPLC-HRMS application should be further evaluated by incorporating
more clinical information.
Supplementary Material
Accuracy and precision of diluted
samples of cyclosporine A in the whole blood.
Acknowledgements
The authors would like to thank Professor Fei Shang
(Analyst and Test Center, Beijing University of Chemical
Technology, Beijing, China) for helping to establish the UPLC-HRMS
method.
Funding
This work was supported by Natural Science
Foundation of Beijing Municipality (grant no. 7192190), Wu Jieping
Medical Foundation (grant no. 320.6750.2020-04-3), the National
Natural Science Foundation of China (grant no. 81503175) and the
National key R&D plan (grant no. 2020YFC2005504).
Availability of data and materials
The datasets used and/or analyzed during the current
study are available from the corresponding author on reasonable
request.
Authors' contributions
XW and WQ was responsible for the study conception
and performed the statistical analysis, manuscript preparation and
editing. WC performed data acquisition. HL performed the
experiments. DZ and XZ performed the data analysis. PL designed the
study and revised the manuscript. All authors read and approved the
final manuscript.
Ethics approval and consent to
participate
The study was approved by China-Japan Friendship
Hospital (Beijing, China; no. 2019-143-K99). Written informed
consent was obtained from all patients.
Patient consent for publication
Not applicable.
Competing interests
The authors declare that they have no competing
interests.
References
|
1
|
Hajkova M, Jaburek F, Porubska B, Bohacova
P, Holan V and Krulova M: Cyclosporine a promotes the therapeutic
effect of mesenchymal stem cells on transplantation reaction. Clin
Sci (Lond). 133:2143–2157. 2019.PubMed/NCBI View Article : Google Scholar
|
|
2
|
Kurata Y, Kuzuya T, Miwa Y, Iwasaki K,
Haneda M, Amioka K, Yamada K, Watarai Y, Katayama A, Uchida K and
Kobayashi T: Clinical relevance of post-transplant pharmacodynamic
analysis of cyclosporine in renal transplantation. Int
Immunopharmacol. 22:384–391. 2014.PubMed/NCBI View Article : Google Scholar
|
|
3
|
Hryniewiecka E, Żegarska J, Żochowska D,
Jaźwiec R, Borowiec A, Samborowska E, Tszyrsznic W, Dadlez M and
Pączek L: Hydroxylated, hydroxymethylated, dihydroxylated, and
trihydroxylated cyclosporine metabolites can be nephrotoxic in
kidney transplant recipients. Transplant Proc. 48:1551–1555.
2016.PubMed/NCBI View Article : Google Scholar
|
|
4
|
Seger C, Shipkova M, Christians U, Billaud
EM, Wang P, Holt DW, Brunet M, Kunicki PK, Pawiński T, Langman LJ,
et al: Assuring the proper analytical performance of measurement
procedures for immunosuppressive drug concentrations in clinical
practice: Recommendations of the international association of
therapeutic drug monitoring and clinical toxicology
immunosuppressive drug scientific committee. Ther Drug Monit.
38:170–189. 2016.PubMed/NCBI View Article : Google Scholar
|
|
5
|
Mika A and Stepnowski P: Current methods
of the analysis of immunosuppressive agents in clinical materials:
A review. J Pharm Biomed Anal. 127:207–231. 2016.PubMed/NCBI View Article : Google Scholar
|
|
6
|
Brate EM, Finley DM, Grote J,
Holets-McCormack S, Ozaeta PF, Pacenti D, Peart JE, Piktel RE,
Ramsay CS, Rupprecht KR, et al: Development of an abbott ARCHITECT
cyclosporine immunoassay without metabolite cross-reactivity. Clin
Biochem. 43:1152–1157. 2010.PubMed/NCBI View Article : Google Scholar
|
|
7
|
Stettin M, Halwachs-Baumann G, Genser B,
Frühwirth F, März W and Khoschsorur GA: Determination of
cyclosporine a in whole blood: Comparison of a chromatographic
method with three different immunological methods. Talanta.
69:1100–1105. 2006.PubMed/NCBI View Article : Google Scholar
|
|
8
|
Henry H, Sobhi HR, Scheibner O, Bromirski
M, Nimkar SB and Rochat B: Comparison between a high-resolution
single-stage orbitrap and a triple quadrupole mass spectrometer for
quantitative analyses of drugs. Rapid Commun Mass Spectrom.
26:499–509. 2012.PubMed/NCBI View
Article : Google Scholar
|
|
9
|
Bruns K, Mönnikes R and Lackner KJ:
Quantitative determination of four immunosuppressants by high
resolution mass spectrometry (HRMS). Clin Chem Lab Med.
54:1193–1200. 2016.PubMed/NCBI View Article : Google Scholar
|
|
10
|
Wagmann L, Hemmer S, Caspar AT and Meyer
MR: Method development for quantitative determination of seven
statins including four active metabolites by means of
high-resolution tandem mass spectrometry applicable for adherence
testing and therapeutic drug monitoring. Clin Chem Lab Med.
58:664–672. 2020.PubMed/NCBI View Article : Google Scholar
|
|
11
|
Du F, Liu T, Shen T, Zhu F and Xing J:
Qualitative-(semi)quantitative data acquisition of artemisinin and
its metabolites in rat plasma using an LTQ/Orbitrap mass
spectrometer. J Mass Spectrom. 47:246–252. 2012.PubMed/NCBI View
Article : Google Scholar
|
|
12
|
Shipkova M and Svinarov D: LC-MS/MS as a
tool for TDM services: Where are we? Clin Biochem. 49:1009–1023.
2016.PubMed/NCBI View Article : Google Scholar
|
|
13
|
Jannetto PJ and Fitzgerald RL: Effective
use of mass spectrometry in the clinical laboratory. Clin Chem.
62:92–98. 2016.PubMed/NCBI View Article : Google Scholar
|
|
14
|
Food and Drug Administration (FDA):
Bioanalytical Method Validation Guidance for Industry, 2018.
https://www.fda.gov/files/drugs/published/Bioanalytical-Method-Validation-Guidance-for-Industry.pdf.
|
|
15
|
Passing H and Bablok W: A new biometrical
procedure for testing the equality of measurements from two
different analytical methods. Application of linear regression
procedures for method comparison studies in clinical chemistry.
Part I J Clin Chem Clin Biochem. 21:709–720. 1983.PubMed/NCBI View Article : Google Scholar
|
|
16
|
Bland JM and Altman DG: Statistical
methods for assessin agreement between two methods of clinical
measurement. Lancet. 1:307–310. 1986.PubMed/NCBI
|
|
17
|
Oellerich M, Armstrong VW, Kahan B, Shaw
L, Holt DW, Yatscoff R, Lindholm A, Halloran P, Gallicano K,
Wonigeit K, et al: Lake louise consensus conference on cyclosporin
monitoring in organ transplantation: Report of the consensus panel.
Ther Drug Monit. 17:642–654. 1995.PubMed/NCBI View Article : Google Scholar
|
|
18
|
Oellerich M, Armstrong VW, Schütz E and
Shaw LM: Therapeutic drug monitoring of cyclosporine and
tacrolimus. Update on lake louise consensus conference on
cyclosporin and tacrolimus. Clin Biochem. 31:309–316.
1998.PubMed/NCBI View Article : Google Scholar
|
|
19
|
Hamwi A, Salomon A, Steinbrugger R,
Fritzer-Szekeres M, Jäger W and Szekeres T: Cyclosporine metabolism
in patients after kidney, bone marrow, heart-lung, and liver
transplantation in the early and late posttransplant periods. Am J
Clin Pathol. 114:536–543. 2000.PubMed/NCBI View Article : Google Scholar
|
|
20
|
Wang CP, Burckart GJ, Ptachcinski RJ,
Venkataramanan R, Schwinghammer T, Hakala T, Griffith B, Hardesty
R, Shadduck R, Knapp J, et al: Cyclosporine metabolite
concentrations in the blood of liver, heart, kidney, and bone
marrow transplant patients. Transplant Proc. 20 (Suppl 2):591–596.
1988.PubMed/NCBI
|
|
21
|
Vyzantiadis T, Belechri AM, Memmos D,
Axiotou M, Vyzantiadis A and Papadimitriou M: Cyclosporine and its
metabolites before and 2 h post-dose: Comparative measurements of a
monoclonal and a polyclonal immunoassay. Clin Transplant.
17:231–233. 2003.PubMed/NCBI View Article : Google Scholar
|
|
22
|
Perry RH, Cooks RG and Noll RJ: Orbitrap
mass spectrometry: Instrumentation, ion motion and applications.
Mass Spectrom Rev. 27:661–699. 2008.PubMed/NCBI View Article : Google Scholar
|
|
23
|
Mei S, Wang J, Chen D, Zhu L, Zhao M, Hu
X, Yang L and Zhao Z: Ultra-high performance liquid chromatography
tandem mass spectrometry for cyclosporine analysis in human whole
blood and comparison with an antibody-conjugated magnetic
immunoassay. Ther Drug Monit. 40:69–75. 2018.PubMed/NCBI View Article : Google Scholar
|
|
24
|
Mei S, Wang J, Chen D, Zhu L, Zhao M, Tian
X, Hu X and Zhao Z: Simultaneous determination of cyclosporine and
tacrolimus in human whole blood by ultra-high performance liquid
chromatography tandem mass spectrometry and comparison with a
chemiluminescence microparticle immunoassay. J Chromatogr B Analyt
Technol Biomed Life Sci. 1087-1088:36–42. 2018.PubMed/NCBI View Article : Google Scholar
|
|
25
|
Li W, Li R, Liu H, Guo X, Shaikh AS, Li P,
Wang B, Guo R and Zhang R: A comparison of liquid
chromatography-tandem mass spectrometry (LC-MS/MS) and
enzyme-multiplied immunoassay technique (EMIT) for the
determination of the cyclosporin A concentration in whole blood
from Chinese patients. Biosci Trend. 11:475–482. 2017.PubMed/NCBI View Article : Google Scholar
|
|
26
|
Tszyrsznic W, Borowiec A, Pawlowska E,
Jazwiec R, Zochowska D, Bartlomiejczyk I, Zegarska J, Paczek L and
Dadlez M: Two rapid ultra performance liquid chromatography/tandem
mass spectrometry (UPLC/MS/MS) methods with common sample
pretreatment for therapeutic drug monitoring of immunosuppressants
compared to immunoassay. J Chromatogr B Analyt Technol Biomed Life
Sci. 928:9–15. 2013.PubMed/NCBI View Article : Google Scholar
|
|
27
|
Sadeg N, Pham-Huy C, Rucay P, Righenzi S,
Halle-Pannenko O, Claude JR, Bismuth H and Duc HT: In vitro and in
vivo comparative studies on immunosuppressive properties of
cyclosporines A, C, D and metabolites M1, M17 and M21.
Immunopharmacol Immunotoxicol. 15:163–177. 1993.PubMed/NCBI View Article : Google Scholar
|
|
28
|
Yatscoff RW, Rosano TG and Bowers LD: The
clinical significance of cyclosporine metabolites. Clin Biochem.
24:23–35. 1991.PubMed/NCBI View Article : Google Scholar
|
|
29
|
Ansermot N, Fathi M, Veuthey JL, Desmeules
J, Rudaz S and Hochstrasser D: Quantification of cyclosporine and
tacrolimus in whole blood. Comparison of liquid
chromatography-electrospray mass spectrometry with the enzyme
multiplied immunoassay technique. Clin Biochem. 41:910–913.
2008.PubMed/NCBI View Article : Google Scholar
|
|
30
|
Ko DH, Cho EJ, Lee W, Chun S and Min WK:
Accuracy evaluation of Roche and Siemens tacrolimus and
cyclosporine assays in comparison with liquid chromatography-tandem
mass spectrometry. Scand J Clin Lab Invest. 78:431–438.
2018.PubMed/NCBI View Article : Google Scholar
|
|
31
|
Cangemi G, Barco S, Bonifazio P, Maffia A,
Agazzi A and Melioli G: Comparison of antibody-conjugated magnetic
immunoassay and liquid chromatography-tandem mass spectrometry for
the measurement of cyclosporine and tacrolimus in whole blood. Int
J Immunopathol Pharmacol. 26:419–426. 2013.PubMed/NCBI View Article : Google Scholar
|
|
32
|
Lee Y: Comparison between
ultra-performance liquid chromatography with tandem mass
spectrometry and a chemiluminescence immunoassay in the
determination of cyclosporin A and tacrolimus levels in whole
blood. Exp Ther Med. 6:1535–1539. 2013.PubMed/NCBI View Article : Google Scholar
|