Introduction
Chronic liver disease refers to chronic inflammation
and fibrosis, representing major pathological changes induced by
various etiologies lasting >6 months. Liver fibrosis is a
wound-healing response generated against a wide range of underlying
injuries. It can progress to liver cirrhosis, causing portal
hypertension, hepatocellular carcinoma and liver failure. Liver
fibrosis is a reversible process (1). If liver fibrosis is detected early,
recovery is close to normal, but complete recovery from cirrhosis
is not possible (2).
Early diagnosis of liver fibrosis is a critical step
for early intervention, detection of disease course, and prognosis
of various chronic liver diseases (3,4).
Diagnosis of chronic liver diseases is mainly based on patients'
signs and symptoms, laboratory serological markers of liver
function and histopathological examination. Currently, liver biopsy
remains the gold standard for the assessment of liver fibrosis.
However, biopsy is limited primarily by its inherent invasiveness
and inconsistency due to blind puncture and sampling errors
(5,6).
Noninvasive diagnostic tests facilitate the
assessment of the severity of chronic liver disease. However,
relatively few diagnostic tests are noninvasive. In various chronic
liver diseases, liver cell degeneration, necrosis, fibrosis and
steatosis result in inhomogeneity of liver magnetic field and
influence the quantized value of magnetic resonance imaging (MRI).
Currently, several studies are focused on the role of quantitative
MR in the staging of chronic hepatitis, including T1 mapping
(5,7) and multiecho gradient recalled echo T2
star weighted imaging (T2*WI) (7),
diffusion-weighted imaging (8,9),
magnetic resonance elastography (10,11),
magnetic resonance spectroscopy (12), and dynamic contrast-enhanced MRI
with gadolinium ethoxybenzyl diethylenetriamine penta-acetic acid
(13,14).
The T2 value can be used to evaluate the
histological staging of liver fibrosis in animal models and humans
with chronic liver disease (15,16),
but cannot distinguish between inflammation and fibrosis (17). The T2 value increases with
increasing tissue water content and is decreased with increasing
liver iron content, while the R2 value is increased with increasing
liver iron content (T2=1/R2) (18-20).
The R2 value can be used to quantify liver iron overload
noninvasively and effectively, and liver fibrosis and iron
concentration affect the measurement of R2 relaxation rate
(21). T2 mapping not only reveals
the changes in liver morphology but also partially reflects the
liver metabolism biochemically. Therefore, the purpose of the
present study was to explore the diagnostic role of T2 mapping in
hepatic fibrosis (F), necroinflammatory activity (A), and steatosis
(S) in a rat model of chronic hepatitis by injecting carbon
tetrachloride (CCl4), based on pathological findings as
the reference standard.
Materials and methods
Liver fibrosis model
One-hundred male adult Sprague-Dawley rats (210±5.2
g; n=100; age, 6-8 weeks) were randomly divided into two groups: A
chronic hepatitis model group (n=88) and a normal control group
(n=12). Before the experiment started, the rats were raised for a
week. Forty-four rats were injected intraperitoneally with a
mixture of CCl4 in olive oil (2:3) at a dose of 0.3
ml/100 g for 5-12 weeks, twice a week. Another 44 rats were treated
via subcutaneous injection abdominally to induce chronic hepatitis.
The model simulated the evolution mechanism of chronic viral
hepatitis. Six rats were induced by intraperitoneal injection with
the same dose of normal saline (NS), and another six rats were
induced via abdominal subcutaneous injection. All animals were fed
under the same conditions of the facility at a temperature of
27±1˚C, at a humidity of 40-60%, with free access to food and
water.
MRI experiments
Imaging was performed using a 3.0 T MRI scanner
(Achieva 3.0 T, Philips Healthcare) with an eight-channel knee
joint coil. The scanning range extended from the top of the
diaphragm to the lower edge of the liver. After 5-12 weeks
post-injection, three to six rats injected abdominally to develop
models of chronic hepatitis, four to six rat models of chronic
hepatitis injected subcutaneously and two normal rats from the
control group were randomly selected for T2-weighted/spectral
adiabatic inversion recovery (T2WI-SPAIR) and multiple gradient-
and spin-echo (M-GRASE) scan every week. Before scanning, rats were
anesthetized by intraperitoneal injection of 1% pentobarbital (50
mg/kg). When the anesthetic effect was poor, a small amount of
additional dose was appropriate. The parameters of T2WI-SPAIR
included echo time (TE), 70 msec; repetition time (TR), 544 ms;
field of view (FOV), 90x67 mm2; slice thickness, 2.5 mm;
slice gap, 0.3 mm; number of excitations (NEXs), 1; flip angle, 90
degrees; and scan time, 2'10.6''. The parameters of M-GRASE
included TEs, 19, 38, 57, 76 and 95 msec; TR, 1660 msec; FOV,
120x120 mm2; slice thickness, 2.5 mm; slice gap, 0.6 mm;
NEX, 1; flip angle, 90 degrees; and scan time, 2' 26''. The T2
values were measured on the T2 map obtained from images of
different TE and reconstructed automatically.
Histology studies
After scanning, the aforementioned anesthetized rats
were sacrificed immediately by cervical dislocation and the livers
removed were stained with H&E and Masson's trichrome. The
specimens were fixed in 10% formalin solution for 18-24 h under the
room temperature. After washing, dehydrating and decalcifying, the
specimens were embedded in paraffin wax and then sectioned at the
thickness of 5 µm. H&E was performed following the instructions
of the Hematoxylin and Eosin Staining kit (Beyotime Institute of
Biotechnology). Masson trichromatic staining was carried out
according to the instructions of the Masson trichromatic Staining
kit (Beijing Solarbio Science & Technology Co., Ltd.). All dyed
slices were assessed by two pathologists, who worked for more than
10 years in a double-blind method. The stages of hepatic fibrosis
(F) and necroinflammatory activity (A) were assessed pathologically
according to the METAVIR scoring system (22). F was staged on a scale of 0 to 4:
F0, no fibrosis; F1, portal fibrosis without septa; F2, portal
fibrosis with rare septa; F3, numerous septa without cirrhosis; and
F4, cirrhosis. A was determined according to the severity of
portal, periportal and lobular inflammation and was classified as
follows: A0, no activity; A1, mild activity; and A3, severe
activity. Hepatic steatosis (S) was measured by determining the
percentage of fatty infiltration, which was graded as S0 (0-5%), S1
(6-30%), S2 (31-50%), S3 (51-75%) and S4 (>75%). If the
diagnoses of the two doctors were inconsistent, the final
pathological result was obtained based on subsequent discussion.
The normal control rats with hepatitis, liver fibrosis or fatty
liver were not included in the statistical analysis.
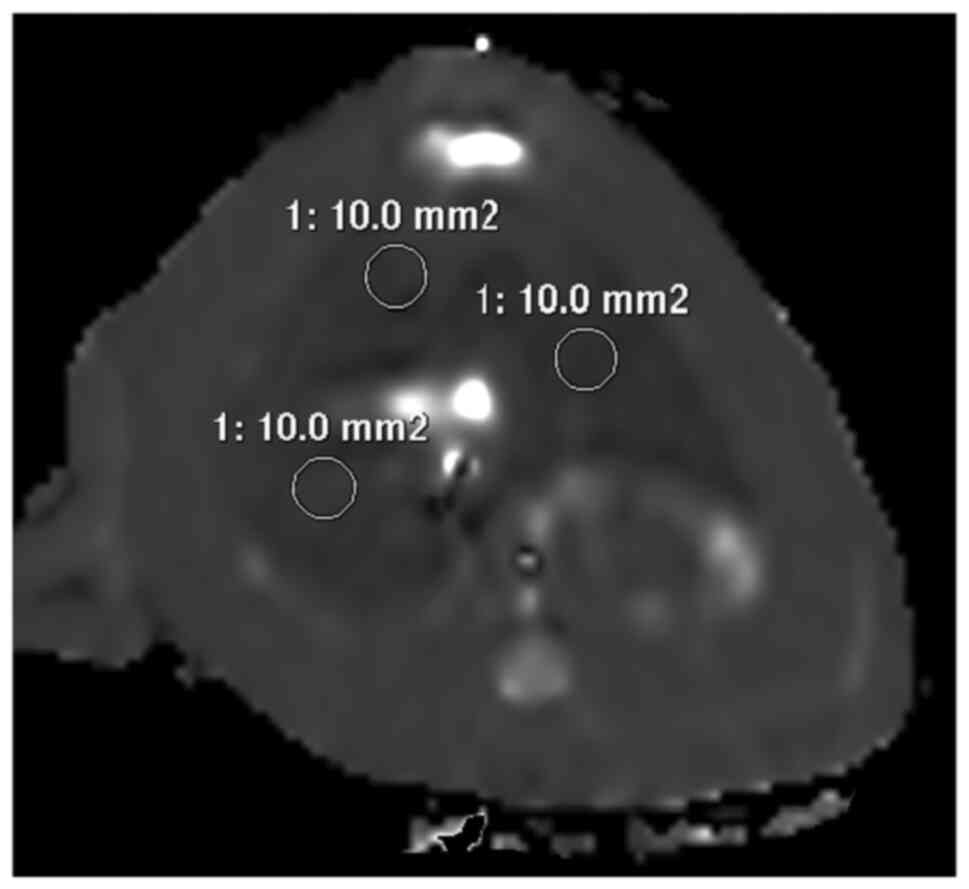
Image analysis
All images were processed in the Philips Extended MR
WorkSpace 2.6.3.4. The images with abnormal signal and artifact
interference on the liver were deleted. The T2 values were measured
by an experienced radiologist in cases lacking pathological
results. Three ROIs (region of interest) of 10-mm2 area
were placed on T2 map that showed the maximum liver area (Fig. 1).
Data analysis
Multiple linear regression analysis (the enter
method) was performed to determine the T2 values that associated
with stages of hepatic fibrosis, necroinflammatory activity and
steatosis. The correlation between T2 value and hepatic fibrosis
and steatosis were analyzed independently via partial correlation
analysis to determine the correlation coefficient (r value).
Based on the results of multiple linear regression analysis, the
differences in T2 value between the stages of liver fibrosis were
tested by one-way analysis of variance, and the differences between
the groups were analyzed using the Tukey's test. The accuracy of
the T2 values for the assessment of fibrosis stage was evaluated
using the receiver operating characteristic (ROC) curves. All
statistical analyses were performed using SPSS software (version
17.0; SPSS, Inc.). P<0.05 was considered to indicate a
statistically significant difference.
Results
Pathology results
Twenty-five rats from the chronic hepatitis group
died of systemic failure caused by acute hepatic necrosis,
abdominal infection or intestinal obstruction. The mortality rate
was 28.41%. One rat was not included in the statistical analysis
because of hepatitis in the normal control group. The F0A0S0
results were available for 11 normal control rats. The pathology
results of 63 rats with chronic hepatitis were as follows: F1
(n=19), F2 (n=16), F3 (n=13), F4 (n=15), A1 (n=31), A2 (n=22), A3
(n=10); S1 (n=12), S2 (n=12), S3 (n=19), and S4 (n=20) (Table I). The pathology results and T2 maps
at different stages of hepatic fibrosis are shown in Figs.
2-4.
 | Table IDistribution of T2 values in liver
pathogenesis (mean ± SD). |
Table I
Distribution of T2 values in liver
pathogenesis (mean ± SD).
| Pathologic staging
(n) | T2 value, ms |
|---|
| A0F0S0(11) | 34.68±1.59 |
| A1F1S1(5) | 34.98±2.76 |
| A1F1S2(2) | 39.13±6.43 |
| A1F1S4(3) | 38.07±4.96 |
| A1F2S1(2) | 44.96±2.78 |
| A1F2S2(4) | 39.38±2.08 |
| A1F2S3(3) | 44.45±3.99 |
| A1F2S4(4) | 44.26±4.31 |
| A1F3S3(2) | 44.91±2.65 |
| A1F3S4(2) | 48.51±1.38 |
| A1F4S2(2) | 50.38±1.66 |
| A1F4S3(1) | 47.43±0 |
| A1F4S4(1) | 49.77±0 |
| A2F1S3(2) | 41.34±6.17 |
| A2F1S4(3) | 39.82±1.26 |
| A2F2S1(1) | 40.47±0 |
| A2F2S3(1) | 45.15±0 |
| A2F3S1(1) | 47.45±0 |
| A2F3S2(1) | 45.03±0 |
| A2F3S3(1) | 40.23±0 |
| A2F3S4(2) | 49.80±4.67 |
| A2F4S1(2) | 51.00±3.92 |
| A2F4S2(3) | 52.29±3.13 |
| A2F4S3(4) | 52.41±4.09 |
| A2F4S4(1) | 55.55±0 |
| A3F1S3(2) | 41.27±0.29 |
| A3F1S4(2) | 40.47±0.14 |
| A3F2S4(1) | 45.13±0 |
| A3F3S1(1) | 49.40±0 |
| A3F3S3(2) | 51.04±3.73 |
| A3F3S4(1) | 50.45±0 |
| A3F4S3(1) | 55.80±0 |
Statistical analysis
Based on the results of multiple linear regression
analysis (Table II), the T2 value
was closely associated with F (P=0.000), but not with A (P=0.052)
or S (P=0.409). According to the partial correlation analysis, a
significant positive correlation was detected between the T2 value
and the staging of liver fibrosis (r=0.820; P<0.05;
Table II). As shown in Table III, the average T2 value of
different stages of liver fibrosis increased with progressive
hepatic fibrosis. The difference between T2 value and the stages of
liver fibrosis were statistically significant (F=55.61;
P=0.000). There were statistical differences between each stage of
T2 value as follows: F0 and F1 (P=0.029), F0 and F2 (P=0.000), F0
and F3 (P=0.000), F0 and F4 (P=0.000), F1 and F2 (P=0.002), F1 and
F3 (P=0.000), F1 and F4 (P=0.000), F2 and F3 (P=0.004), F2 and F4
(P=0.000), F3 and F4 (P=0.020). Fig.
5 shows the ROC curves based on different thresholds of
fibrosis stages. The area under the ROC curve (AUC), optimal cutoff
values, as well as the corresponding sensitivity and specificity,
are presented in Table IV.
| Table IIResults of regression analysis
correlating T2 values and pathology. |
Table II
Results of regression analysis
correlating T2 values and pathology.
| | T2 value |
|---|
| Pathologic
staging | B | P-value | r |
|---|
| F | 3.904 | 0.000 | 0.820 |
| A | 1.061 | 0.052 | 0.230 |
| S | 0.270 | 0.409 | 0.099 |
| Table IIIDistribution of the T2 value in the
different stages of liver fibrosis. |
Table III
Distribution of the T2 value in the
different stages of liver fibrosis.
| Stages of liver
fibrosis (n) | T2 value, mean ±
SD |
|---|
| F0 (n=11) | 34.68±1.58 |
| F1 (n=19) | 38.58±3.87 |
| F2 (n=16) | 43.04±3.62 |
| F3 (n=13) | 47.77±3.72 |
| F4 (n=15) | 51.85±3.26 |
| Table IVDiagnostic performance of T2 value in
the staging of liver fibrosis. |
Table IV
Diagnostic performance of T2 value in
the staging of liver fibrosis.
| Statistic | F0 vs. F1-4 | F0,1 vs. F2-4 | F0-2 vs. F3,4 | F0-3 vs. F4 |
|---|
| AUC | 0.944 | 0.942 | 0.956 | 0.948 |
| P-value | 0.000 | 0.000 | 0.000 | 0.000 |
| Cut-off value | 37.315 | 42.55 | 46.10 | 46.83 |
| Sensitivity, % | 88.89 | 81.82 | 89.29 | 100.00 |
| Specificity, % | 100.00 | 93.33 | 91.30 | 81.36 |
| Positive predictive
value, % | 100.00 | 94.74 | 86.21 | 57.69 |
| Negative predictive
value, % | 61.10 | 77.78 | 93.30 | 100.00 |
Discussion
The present study analyzed the association between
the T2 value of hepatic parenchyma and the histological grade of
liver fibrosis, steatosis and hepatitis activity in a toxic model
of chronic hepatitis, in which rats were injected with a suspension
of CCl4. The results show that the T2 value was
associated with hepatic fibrosis, but not with steatosis or
hepatitis. The T2 value increases with advanced fibrosis. The AUC
obtained using T2 values was 0.944 for the prediction of stage F1
or greater, 0.942 for stage F2 or greater, 0.958 for stage F3 or
greater, and 0.948 for F4.
Inflammatory necrosis and fibrosis of liver tissue,
the most fundamental pathological basis of chronic hepatitis, are
characterized by liver cell degeneration, necrosis and apoptosis to
varying degrees. With the infiltration of inflammatory cells in the
portal area, the activation of hepatic stellate cells, excessive
extracellular matrix (ECM) hyperplasia and deposition result in
fibrous scar formation eventually (23-25).
A close topographical association exists between inflamed areas of
the liver and areas that develop fibrosis. The presence of these
inflammatory cells may increase the T2 value (16). In addition, hepatocyte necrosis and
rupture result in a large and abnormal accumulation of ferritin.
Iron deposition further damages the liver by inducing oxidative
stress in the liver cells (14).
All these processes alter the T2 value. In our study group, the
hepatic T2 value was not associated with hepatitis or
steatosis.
In recent years, MRI has been increasingly used for
the diagnosis and staging of chronic liver diseases. A few studies
reported T2 mapping techniques to grade liver fibrosis. Zhang et
al (26) reported that T2 value
correlated positively with stages of liver fibrosis, and increased
T2 value was observed in severe liver fibrosis. Spearman's
correlation test showed that the mean T2 value correlated
positively (r=0.73; P<0.001) with fibrosis stages. Guimaraes
et al (16) demonstrated an
increased T2 value with increasing stage of liver fibrosis in a
diethylnitrosamine rat model of liver fibrosis, without evidence of
hemochromatosis or fatty infiltration within the liver. The T2
relaxation time can potentially separate patients with mild disease
from patients with severe liver fibrosis, based on a statistically
significant difference between degrees of mild vs. severe fibrosis
(P=0.03). Luetkens et al (27) used two different models of chronic
liver disease in rats, including the cholestatic model of liver
fibrosis, induced by bile duct ligation, and a toxic model of liver
fibrosis, in which rats were exposed to periodic CCl4
inhalation. The results demonstrated that the quantitative values
of hepatic T2 can be used to differentiate between the stages of
liver fibrosis based on histology.
The present study yielded similar results. The T2
value of hepatic parenchyma was closely related to hepatic fibrosis
(P<0.05), but not to hepatitis or steatosis, and the difference
in T2 value was statistically significant between the different
stages of hepatic fibrosis. However, it is inconsistent with the
results of Chow et al (15),
who reported that the degree of fibrosis and inflammation in
fibrotic livers remained relatively stable after week 4 and T2
value showed a higher sensitivity for the detection of early liver
fibrosis rather than each stage of hepatic fibrosis. It may be
attributed to different rat species and the effect of
CCL4 doses on the degree of liver damage. The studies
(15,26,27)
did not indicate the effects of liver inflammation on the T2 value.
However, as mentioned earlier, inflammatory activity and steatosis
affect the T2 value. Therefore, a comprehensive analysis of factors
that affect the T2 value in patients with liver disease is
needed.
Limitations
The study limitations are as follows: In this study,
a single-animal model was used, and liver fibrosis was not analyzed
using multiple modeling methods. The maximum image level without
artifact was not rejected. Any artifacts associated with smaller
images may be attributed to the low weight of the rats, respiratory
movement, heartbeat, gastrointestinal peristalsis and intestinal
gas. Hepatic iron deposition in liver fibers affects the T2 value.
However, the classification and measurements were not corrected for
hepatic iron overload in the present study. The association between
liver iron overload and liver fibrosis was also not analyzed, nor
the effect of liver iron overload on liver T2 value. Further
studies are needed to address these limitations.
Conclusions
The experiments showed that the T2 value was mainly
affected by liver fibrosis, but was not associated with hepatitis
or fatty liver. It was positively correlated with the T2 value and
staging of liver fibrosis. The T2 value is one of the indices of
quantitative image analysis and reflects the stage of liver
fibrosis.
Acknowledgements
Not applicable.
Funding
This research was funded by the Science and
Technology program of Luzhou (grant no. 2015LZYD-S04).
Availability of data and materials
The datasets used and/or analyzed during the current
study are available from the corresponding author on reasonable
request.
Authors' contributions
JS designed the experiments. XW and XL collected
samples and performed experiments. XW, YH, XL, YC and JS collected
and assembled data. XW, YH and JS analyzed and interpreted the
data. XW, YH and JS were involved in drafting the manuscript and
revising it critically for important intellectual content. All the
authors read and approved the final manuscript. JS and XW confirm
the authenticity of all the raw data.
Ethics approval and consent to
participate
Experiments were carried out in accordance with the
International Guidelines for Animal Studies regarding the care and
use of animals for experimental purposes. All animal experiments
followed a protocol approved by the local Institutional Animal
Ethics Committee: The Southwest Medical University (Luzhou, China)
and the Laboratory animal production licenses were SCXK (Chuan)
2013-17, SCXK (Chuan) 2013-181 and SCXK (Chuan) 2013-065.
Patient consent for publication
Not applicable.
Competing interests
The authors declare that they have no competing
interests.
References
|
1
|
Fowell AJ and Iredale JP: Emerging
therapies for liver fibrosis. Dig Dis. 24:174–183. 2006.PubMed/NCBI View Article : Google Scholar
|
|
2
|
Issa R, Zhou X, Constandinou CM,
Fallowfield J, Millward-Sadler H, Gaca MD, Sands E, Suliman I, Trim
N, Knorr A, et al: Spontaneous recovery from micronodular
cirrhosis: Evidence for incomplete resolution associated with
matrix cross-linking. Gastroenterology. 126:1795–1808.
2004.PubMed/NCBI View Article : Google Scholar
|
|
3
|
Venkatesh SK, Yin M and Ehman RL: Magnetic
resonance elastography of liver: Technique, analysis, and clinical
applications. J Magn Reson Imaging. 37:544–555. 2013.PubMed/NCBI View Article : Google Scholar
|
|
4
|
Li BB, Li DL, Chen C, Liu BH, Xia CY, Wu
HJ, Wu CQ, Ji GQ, Liu S, Ni W, et al: Potentials of the elevated
circulating miR-185 level as a biomarker for early diagnosis of
HBV-related liver fibrosis. Sci Rep. 6(34157)2016.PubMed/NCBI View Article : Google Scholar
|
|
5
|
Manning DS and Afdhal NH: Diagnosis and
quantitation of fibrosis. Gastroenterology. 134:1670–1681.
2008.PubMed/NCBI View Article : Google Scholar
|
|
6
|
Sporea I, Popescu A and Sirli R: Why, who
and how should perform liver biopsy in chronic liver diseases.
World J Gastroenterol. 14:3396–3402. 2008.PubMed/NCBI View Article : Google Scholar
|
|
7
|
Banerjee R, Pavlides M, Tunnicliffe EM,
Piechnik SK, Sarania N, Philips R, Collier JD, Booth JC, Schneider
JE, Wang LM, et al: Multiparametric magnetic resonance for the
non-invasive diagnosis of liver disease. J Hepatol. 60:69–77.
2014.PubMed/NCBI View Article : Google Scholar
|
|
8
|
Zhou IY, Gao DS, Chow AM, Fan S, Cheung
MM, Ling C, Liu X, Cao P, Guo H, Man K and Wu EX: Effect of
diffusion time on liver DWI: An experimental study of normal and
fibrotic livers. Magn Reson Med. 72:1389–1396. 2014.PubMed/NCBI View Article : Google Scholar
|
|
9
|
Hu XR, Cui XN, Hu QT and Chen J: Value of
MR diffusion imaging in hepatic fibrosis and its correlations with
serum indices. World J Gastroenterol. 20:7964–7970. 2014.PubMed/NCBI View Article : Google Scholar
|
|
10
|
Reiter R, Wetzel M, Hamesch K, Strnad P,
Asbach P, Haas M, Siegmund B, Trautwein C, Hamm B, Klatt D, et al:
Comparison of non-invasive assessment of liver fibrosis in patients
with alpha1-antitrypsin deficiency using magnetic resonance
elastography (MRE), acoustic radiation force impulse (ARFI)
Quantification, and 2D-shear wave elastography (2D-SWE). PLoS One.
13(e0196486)2018.PubMed/NCBI View Article : Google Scholar
|
|
11
|
Kim YS, Jang YN and Song JS: Comparison of
gradient-recalled echo and spin-echo echo-planar imaging MR
elastography in staging liver fibrosis: A meta-analysis. Eur
Radiol. 28:1709–1718. 2018.PubMed/NCBI View Article : Google Scholar
|
|
12
|
Wang XM, Zhang XJ and Ma L: Diagnostic
performance of magnetic resonance technology in detecting steatosis
or fibrosis in patients with nonalcoholic fatty liver disease: A
meta-analysis. Medicine (Baltimore). 97(e10605)2018.PubMed/NCBI View Article : Google Scholar
|
|
13
|
Chen BB, Hsu CY, Yu CW, Wei SY, Kao JH,
Lee HS and Shih TT: Dynamic contrast-enhanced magnetic resonance
imaging with Gd-EOB-DTPA for the evaluation of liver fibrosis in
chronic hepatitis patients. Eur Radiol. 22:171–180. 2012.PubMed/NCBI View Article : Google Scholar
|
|
14
|
Zhang W, Kong X, Wang ZJ, Luo S, Huang W
and Zhang LJ: Dynamic contrast-enhanced magnetic resonance imaging
with Gd-EOB-DTPA for the evaluation of liver fibrosis induced by
carbon tetrachloride in rats. PLoS One. 10(e0129621)2015.PubMed/NCBI View Article : Google Scholar
|
|
15
|
Chow AM, Gao DS, Fan SJ, Qiao Z, Lee FY,
Yang J, Man K and Wu EX: Measurement of liver T1 and T2 relaxation
times in an experimental mouse model of liver fibrosis. J Magn
Reson Imaging. 36:152–158. 2012.PubMed/NCBI View Article : Google Scholar
|
|
16
|
Guimaraes AR, Siqueira L, Uppal R, Alford
J, Fuchs BC, Yamada S, Tanabe K, Chung RT, Lauwers G, Chew ML, et
al: T2 relaxation time is related to liver fibrosis severity. Quant
Imaging Med Surg. 6:103–114. 2016.PubMed/NCBI View Article : Google Scholar
|
|
17
|
Jacob RE, Amidan BG, Soelberg J and Minard
KR: In vivo MRI of altered proton signal intensity and T2
relaxation in a bleomycin model of pulmonary inflammation and
fibrosis. J Magn Reson Imaging. 31:1091–1099. 2010.PubMed/NCBI View Article : Google Scholar
|
|
18
|
Giri S, Chung YC, Merchant A, Mihai G,
Rajagopalan S, Raman SV and Simonetti OP: T2 quantification for
improved detection of myocardial edema. J Cardiovasc Magn Reson.
11(56)2009.PubMed/NCBI View Article : Google Scholar
|
|
19
|
Naßenstein K, Nensa F, Schlosser T, Bruder
O, Umutlu L, Lauenstein T, Maderwald S and Ladd ME: Cardiac MRI:
T2-mapping versus T2-weighted dark-blood TSE imaging for myocardial
edema visualization in acute myocardial infarction. Rofo.
186:166–172. 2014.PubMed/NCBI View Article : Google Scholar
|
|
20
|
St Pierre TG, Clark PR and Chua-Anusorn W:
Measurement and mapping of liver iron concentrations using magnetic
resonance imaging. Ann N Y Acad Sci. 1054:379–385. 2005.PubMed/NCBI View Article : Google Scholar
|
|
21
|
Alexopoulou E, Stripeli F, Baras P,
Seimenis I, Kattamis A, Ladis V, Efstathopoulos E, Brountzos EN,
Kelekis AD and Kelekis NL: R2 relaxometry with MRI for the
quantification of tissue iron overload in beta-thalassemic
patients. J Magn Reson Imaging. 23:163–170. 2006.PubMed/NCBI View Article : Google Scholar
|
|
22
|
Bedossa P and Poynard T: An algorithm for
the grading of activity in chronic hepatitis C. The METAVIR
Cooperative Study Group. Hepatology. 24:289–293. 1996.PubMed/NCBI View Article : Google Scholar
|
|
23
|
Kisseleva T and Brenner DA: Mechanisms of
fibrogenesis. Exp Biol Med (Maywood). 233:109–122. 2008.PubMed/NCBI View Article : Google Scholar
|
|
24
|
Yanguas SC, Cogliati B, Willebrords J,
Maes M, Colle I, van den Bossche B, de Oliveira CPMS, Andraus W,
Alves VAF, Leclercq I and Vinken M: Experimental models of liver
fibrosis. Arch Toxicol. 90:1025–1048. 2016.PubMed/NCBI View Article : Google Scholar
|
|
25
|
Aydın MM and Akçalı KC: Liver fibrosis.
Turk J Gastroenterol. 29:14–21. 2018.PubMed/NCBI View Article : Google Scholar
|
|
26
|
Zhang H, Yang Q, Yu T, Chen X, Huang J,
Tan C, Liang B and Guo H: Comparison of T2, T1rho, and diffusion
metrics in assessment of liver fibrosis in rats. J Magn Reson
Imaging. 45:741–750. 2017.PubMed/NCBI View Article : Google Scholar
|
|
27
|
Luetkens JA, Klein S, Träber F, Schmeel
FC, Sprinkart AM, DLR K, Block W, Uschner FE, Schierwagen R,
Hittatiya K, et al: Quantification of liver fibrosis at T1 and T2
mapping with extracellular volume fraction MRI: Preclinical
results. Radiology. 288:748–754. 2018.PubMed/NCBI View Article : Google Scholar
|