Introduction
Gastric cancer (GC) is a common malignant tumor type
of the digestive tract with high morbidity and mortality (1). The 5-year survival probability of a
patient with GC is <20% (2). The
risk factors for this cancer type are diverse, including genetics,
gastroesophageal reflux disease, Helicobacter pylori
infection, dietary factors and obesity (3). Although research on GC, particularly
molecular research, has been increasing in recent years, the major
methods of treatment are still conventional surgery, radiotherapy
and chemotherapy (4). In addition,
GC remains the fifth most frequently diagnosed neoplasm and the
third most deadly tumor in the world (5). Due to in-depth research and rapid
development of molecular biology to implement the use of novel
treatments, including immunotherapy and targeted drugs, the current
survival rate of patients with GC has improved (6), but these methods still have certain
limitations, such as heterogeneity as well as poor sensitivity and
specificity. Therefore, it is important to discover and optimize
novel biomarkers for GC with high specificity and sensitivity.
The P53-induced gene 11 (PIG11), also known as tumor
protein p53 induced protein 11 (TP53I11), is a target gene
downstream of p53 located at human chromosome 11p11.2 (7,8). In
1997, Polyak et al (9) first
identified that high expression of p53 significantly induced PIGs
when studying the mechanism of p53-dependent apoptosis in human
colon cancer cells using Serial Analysis of Gene Expression
technology. The genes were named as PIG1-13 and PIG11 is one of
them (9). In the PIG11 protein, a
p53 DNA-binding site was detected, but no homologous proteins and
conserved domains were evident, indicating that the protein may be
novel (10,11). In addition, the PIG11 gene, as a
downstream target gene of p53, is closely related to p53-mediated
apoptosis. In the human hepatic stellate cell line LX-1, the T
antigen may cause p53 inactivation and reduce the expression of
PIG11, which indicates that the expression of PIG11 protein is
related to the p53 gene (12).
Relevant studies suggested that the PIG11 protein is primarily
distributed in the mammary gland, liver, gastrointestinal and other
epithelial tissues and expressed in the corresponding cancer
tissues (13,14). Furthermore, PIG11 has a certain
relationship with the occurrence and development of tumors,
including non-small cell lung (15), breast (16) and liver cancer (14). However, the function of PIG11 in the
process of GC and its impact on prognosis still require to be
explored. In the present retrospective study reverse
transcription-quantitative PCR (RT-qPCR) and tissue
microarray-immunohistochemistry (TMA-IHC) were used to analyze
PIG11 expression in GC tissues and determine the roles and clinical
utility of PIG11 protein in patients with GC. Furthermore, online
databases were used for bioinformatic analysis on PIG11 in GC.
Materials and methods
Patients
Freshly frozen GC tissues (n=60) and matched
adjacent normal tissues (n=60) were obtained from the Department of
Pathology of the Affiliated Hospital of Nantong University
(Nantong, China). Clinicopathological data are presented in
Table SI. They were randomly
selected and from patients (41 males and 19 females; age range,
32-76 years; median age, 59.42 years) who had undergone GC
resection at the Affiliated Hospital of Nantong University
(Nantong, China) from January 2016 to June 2016. Furthermore, a
total of 790 formalin-fixed (~24 h after isolation) and
paraffin-embedded samples from patients with GC (age range, 19-84
years; median age, 60.39 years) obtained between January 2004 and
June 2009 stored at the Department of Pathology of the Affiliated
Hospital of Nantong University (Nantong, China) were randomly
collected. These samples included GC samples (n=480) and
non-cancerous samples (corresponding normal surgical margin samples
selected from the 480 paraffin-embedded samples from patients with
GC, n=60; 42 males and 18 females, 35-82 years, median age, 63.15
years, high-grade intraepithelial neoplasia samples, n=72; 51 males
and 21 females, 41-81 years, median age, 60.76 years, low-grade
intraepithelial neoplasia samples, n=56, 46 males and 10 females,
38-79 years, median age, 59.84 years; chronic gastritis samples,
n=42, 28 males and 14 females, 29-74 years, median age, 52.48
years; intestinal metaplasia samples, n=80, 60 males and 20
females, 25-82 years, median age, 56.43 years) that were used as
control groups. Clinicopathological data are presented in Table SII. The cases included in the
present study had a follow-up rate of 100% and clinicopathological
information, including sex, age, body mass index (BMI),
histological type, differentiation, invasive depth (T-stage), lymph
node metastasis (N-stage), distant metastasis (M-stage), TNM stage,
carcinoembryonic antigen (CEA), carbohydrate antigen 19-9 (CA19-9),
human epidermal growth factor receptor 2 (HER-2) and Laurén
classification. All diagnoses were confirmed by two independent
pathologists at the Department of Pathology of the Affiliated
Hospital of Nantong University (Nantong, China) according to the
most recent World Health Organization classification criteria
(17) and the 8th edition of the
TNM Classification of Malignant Tumors (18). Overall survival (OS) was assessed,
with survival defined as the duration from the time of surgical
resection to death or the end of the follow-up period. None of the
patients enrolled received any radiation, chemotherapy or
immunotherapy prior to surgery. A written informed consent form was
signed by each patient prior to the use of their sample for
scientific research. The present study was approved by the Human
Research Ethics Committee at the Affiliated Hospital of Nantong
University (Nantong, China). All experimental methods and related
protocols were performed according to the regulations of the
Affiliated Hospital of Nantong University (Nantong, China).
Gene expression profiling interactive
analysis (GEPIA) and oncomine database online analysis
GEPIA and Oncomine were used to analyze the
expression of PIG11 mRNA in GC. GEPIA (http://gepia.cancer-pku.cn/) is able to analyze the
RNA sequencing expression data of 9,736 tumors and 8,587 normal
samples with a standard processing pipeline (19), in addition to providing differential
expression models for tumors and normal tissues. In this database,
the expression of PIG11 in GC was analyzed. The terms ‘PIG11’,
‘mRNA’, ‘GC’ and ‘Cancer vs. Normal Analysis’ were selected to
query the Oncomine database (http://www.oncomine.org) and obtain the mRNA
expression data for PIG11 in GC. The Oncomine database is a large
tumor gene chip database, covering 65 gene chip data sets, 4,700
chips and 480 million gene expression data. In this database, gene
expression differences may be analyzed, co-expressed genes may be
predicted and possible molecular markers and therapeutic targets
may be determined in analyses based on known gene-drug
interactions.
RT-qPCR analysis
Total RNA from the 60 pairs of fresh GC tissues and
matched adjacent normal tissues was extracted with TRIzol (cat. no.
79306; Gibco; Thermo Fisher Scientific, Inc.). cDNA was synthesized
using commercial kits (PrimeScript RT Reagent Kit with gDNA Eraser;
cat. no. RR047A; Takara Biotechnology Co., Ltd.) according to the
manufacturer's protocol. RT-qPCR analysis was performed using an
ABI 7500 system (Applied Biosystems; Thermo Fisher Scientific,
Inc.) with the SYBRR® Premix ExTaqkit (Takara Bio, Inc.)
in 96-well plates. The total reaction volume was 20 µl. The
specific primer sequences for PIG11 were as follows: Upstream
primer, 5'-GCGAATTCCAACACCGATGCACACA-3' and downstream,
5'-CGCGGATCCTAGGCAGCTCTTTAGG-3'. β-actin was used as an internal
control in this analysis, for which the upstream primer was
5'-TAATCTTCGCCTTAATACTT-3' and the downstream primer was
5'-AGCCTTCATACATCTCAA-3'. The reaction conditions were as follows:
10 min at 95˚C, followed by 40 cycles of 95˚C for 10 sec and 45 sec
at 60˚C. Relative expression levels were calculated using the
2-ΔΔCq method (20). All
experiments were repeated in triplicate.
TMA-IHC analysis
TMAs were constructed as previously described
(21). Samples (2 mm in diameter)
were sliced into 4-µm sections for IHC analysis. The sections were
deparaffinized with xylene and rehydrated in an ethanol gradient,
followed by washing with PBS (0.01 M, pH 7.0), boiling under
pressure in citrate buffer (0.01 M, pH 6.0) for antigen retrieval
and incubation in PBS with 5% goat serum (cat. no. SL039; Beijing
Solarbio Science & Technology Co., Ltd.) for 30 min at 37˚C to
block non-specific binding. Next, the sections were stained with
polyclonal rabbit anti-PIG11 antibody (dilution, 1:200; cat. no.
PA5-51336; Invitrogen; Thermo Fisher Scientific, Inc.) at 4˚C
overnight and then with HRP-labeled goat anti-rabbit IgG (1:2,500;
cat. no. ZDR-5306; OriGene Technologies, Inc.) secondary antibody
for 30 min at room temperature. The sections were subsequently
incubated with diaminobenzidine (grant no. DA1010; Beijing Solarbio
Science & Technology Co., Ltd.) for 8 min at room temperature
and finally counterstained with hematoxylin. A total of two
pathologists (SZ and YW) under blinded experimental conditions
assessed the expression of PIG11 across the entire surface of the
slide on every chip. The rating standard for the staining intensity
was as follows: 0, negative; 1, weakly positive; 2, medium
positive; and 3, strongly positive. The positive rate score was
assigned as follows: 0, lowest; to 100, highest. The final score
was the product of the two above-mentioned scores, which ranged
from 0 to 300. X-tile (Rimm laboratory at Yale University;
http://www.tissuearray.org/rimmlab)
(22) software, a new
bioinformatics tool for biomarker assessment and outcome-based
cut-point optimization, was used to set the final cutoff value for
the PIG11 expression data. The cutoff value was determined based on
the maximum χ2 value and estimated by log-rank
χ2 statistics according to OS. Finally, 140 was selected
as the cut-off point to stratify samples: 0-140, low or no
expression; and 141-300, high expression.
Bioinformatics analysis
Kaplan-Meier plotter and GEPIA were used for
bioinformatics analysis of PIG11 in GC. Kaplan-Meier plotter
(http://kmplot.com/analysis/) (23) was utilized to assess the prognostic
role of PIG11 expression in patients with GC. The Kaplan-Meier
plotter is able to assess the effect of 54,000 genes (mRNAs,
miRNAs, proteins) on survival in 21 cancer types, including breast
(n=6,234), ovarian (n=2,190) and lung cancer (n=3,452), as well as
GC (n=1,440), which is used for meta-analysis-based discovery and
validation of survival biomarkers. In the GEPIA database, the
relationships between PIG11 expression in tumors and the OS of
patients were analyzed. In addition, the correlations of
PIG11/TP53I11 with TNF, CEA-related cell adhesion molecule 5
(CEACAM5), phosphatidylinositol-4,5-bisphosphate 3-kinase catalytic
subunit alpha (PIK3CA), VEGFA and kinase insert domain receptor
(KDR; also known as VEGF receptor-2) which may be related to the
development of GC and molecular typing (24) in GC were further assessed in this
database. ‘Pearson’ was selected for ‘Correlation Coefficient’ and
‘Stomach adenocarcinoma (STAD) Tumor’ was selected as ‘Used
Expression Datasets’.
Statistical analysis
SPSS 22.0 (IBM Corp.) and GraphPad 5.0 (GraphPad
Software, Inc.) were used for statistical analysis. Wilcoxon's
signed-rank non-parametric test was utilized to analyze the results
obtained by RT-qPCR. The diagnostic value of PIG11 expression in GC
was estimated using receiver operating characteristic (ROC) curve
analysis. MedCalc software was used for ROC curve analysis. The
χ2 test was used to determine the relationship between
PIG11 expression and clinicopathological parameters. The
Kaplan-Meier method and the log-rank test were utilized to generate
survival curves. The factors of prognostic significance in the
univariate analysis were further assessed using the multivariate
Cox regression model. For all of the above-mentioned tests,
P<0.05 was considered to indicate statistical significance.
Results
Expression of PIG11mRNA in GC tissues
from online databases
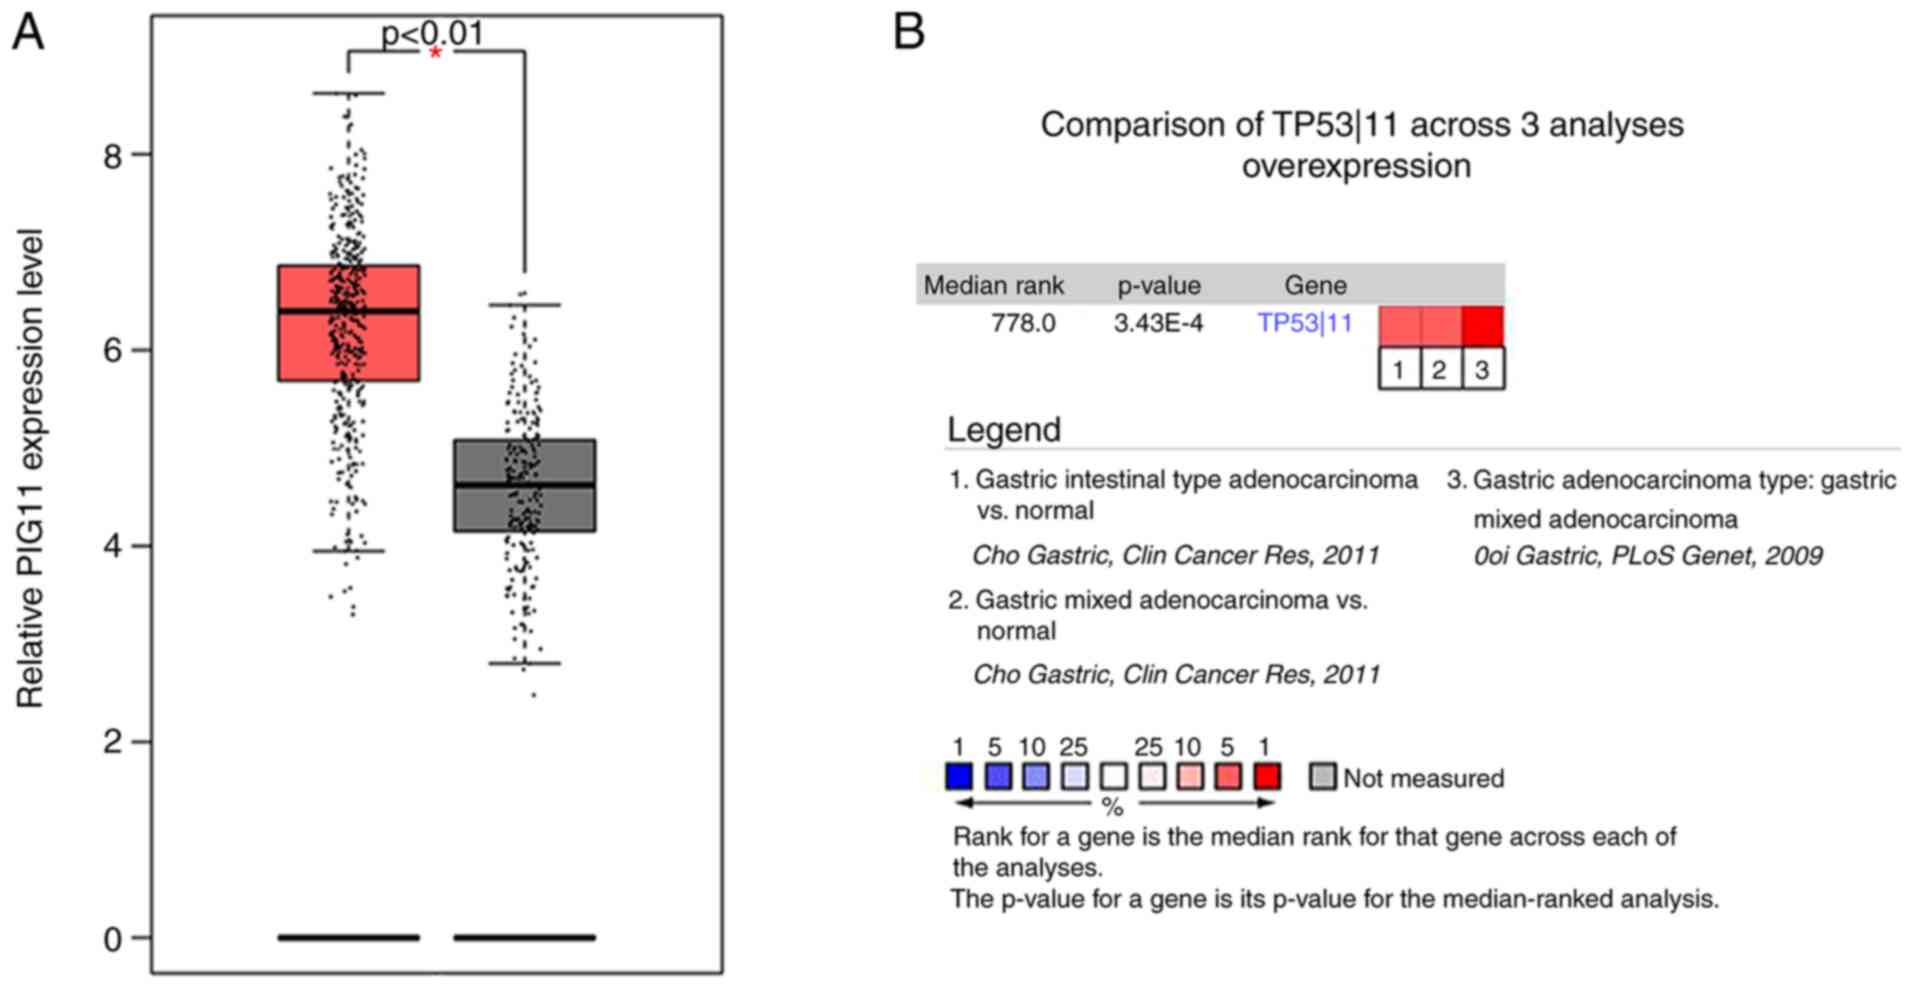
The results obtained from GEPIA (GC tissues, n=408;
normal tissues, n=211), together with analyses of data from Cho
et al (25) (gastric
adenocarcinoma, n=65; surrounding normal tissues, n=19;
gastrointestinal stromal tumor samples, n=6) and Ooi et al
(26) (GCs, n=31) provided by
Oncomine both indicated that PIG11 mRNA expression in cancerous
tissues was higher than that in normal tissues (both P<0.05;
Fig. 1A and B).
Expression and diagnostic value of
PIG11mRNA in GC
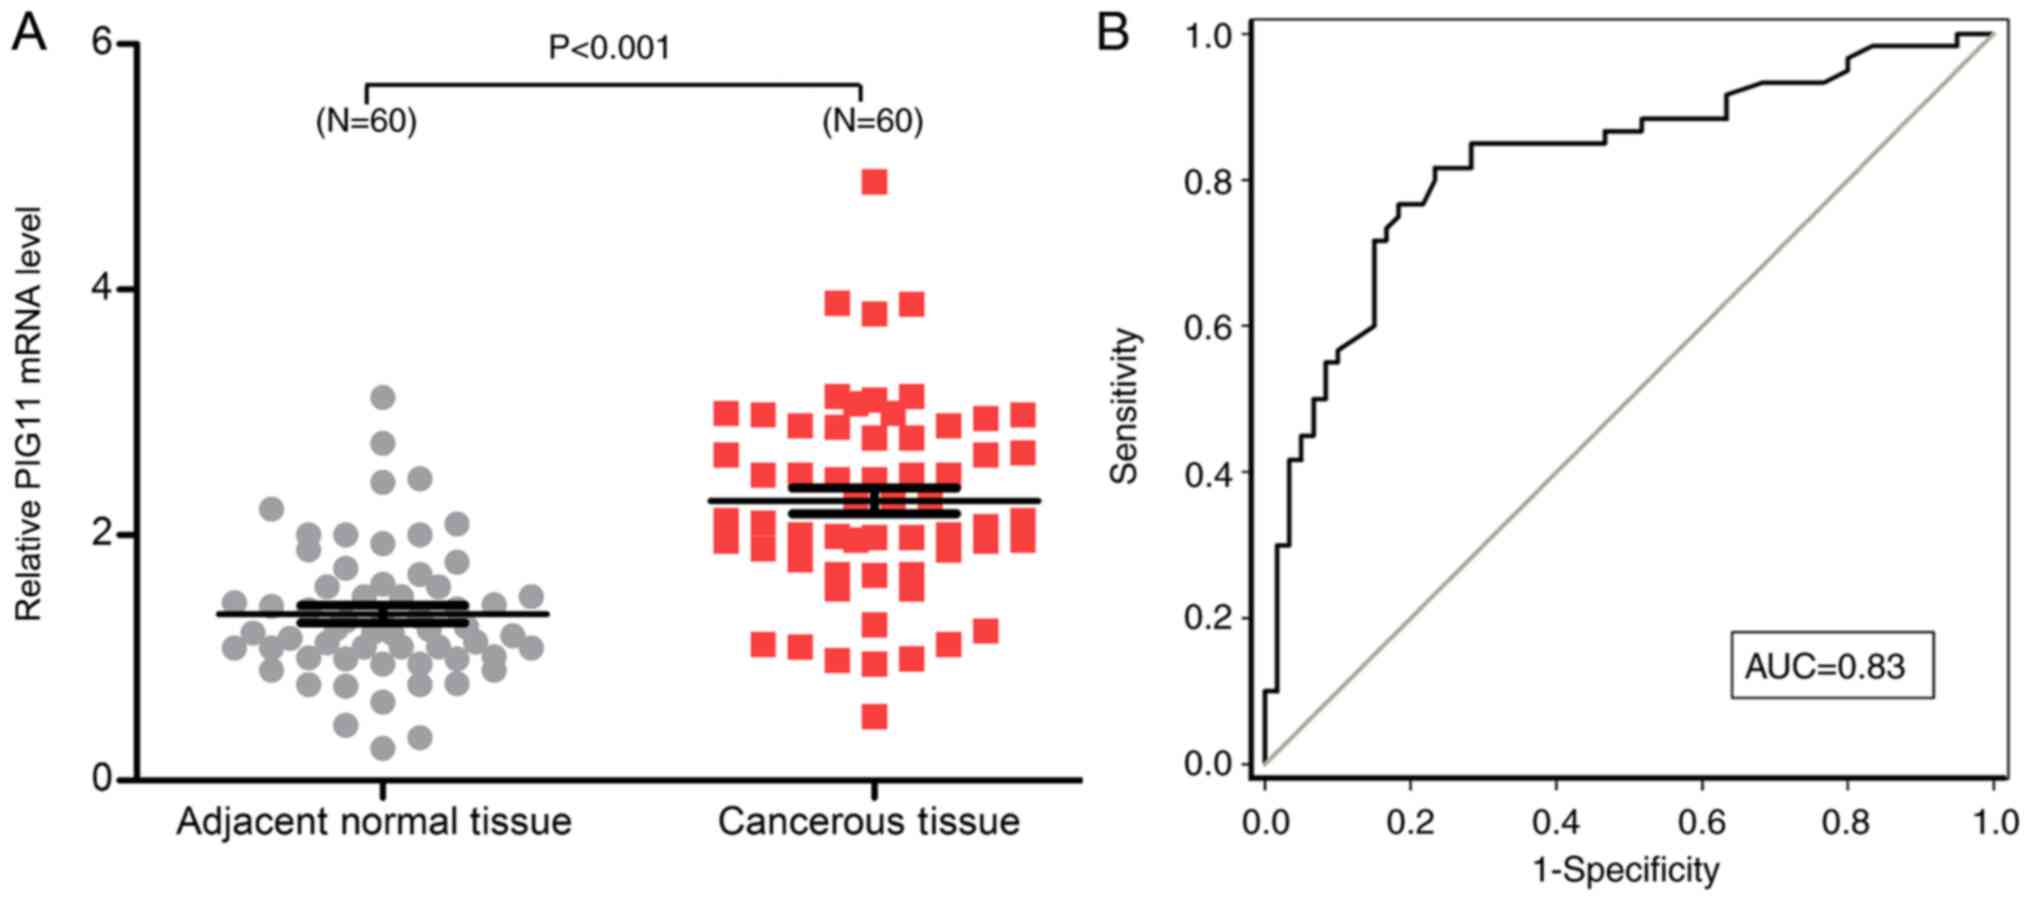
RT-qPCR analysis of the freshly frozen tissues from
the 60 patients with GC indicated that the relative mRNA expression
of PIG11 in cancerous tissues was higher (2.28±0.82) than that in
adjacent normal tissues (1.36±0.55; P<0.05; Fig. 2A). ROC curve analysis was adopted to
estimate the diagnostic value of PIG11 in GC. As presented in
Fig. 2B, PIG11 expression was able
to distinguish GC tissues from adjacent normal tissues, with an
area under the curve of 0.83 (95% CI, 0.7504-0.9023) at a cut-off
value of 1.635. The corresponding sensitivity and specificity were
81.67 and 76.67%, respectively.
PIG11 protein expression in GC and
correlation with the clinical characteristics of GC
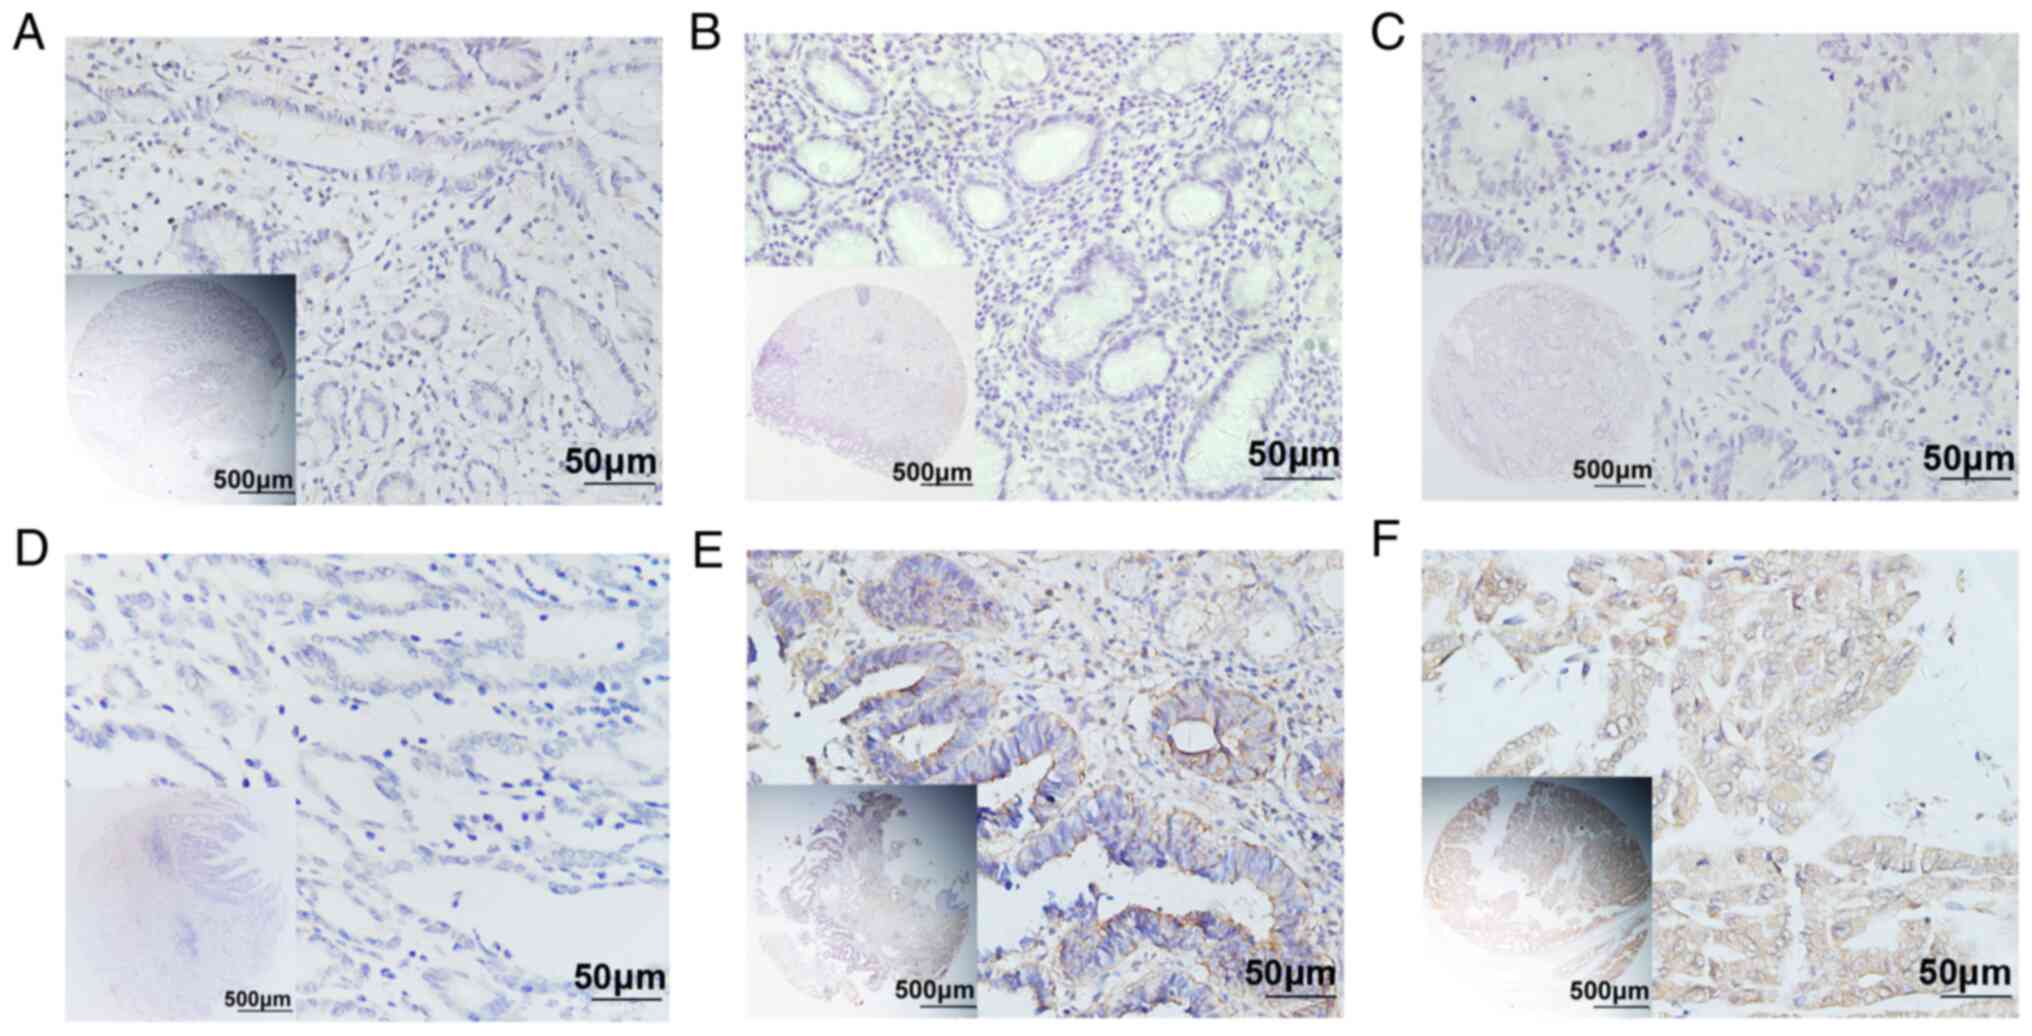
According to the TMA-IHC analysis (representative
images provide in Fig. 3), the
percentage of samples with PIG11 expression observed in the
cytoplasm was greater among GC tissues (340/480, 70.8%) compared
with that among chronic gastritis (11/42, 26.2%), intestinal
metaplasia (22/80, 27.5%), low-grade intraepithelial neoplasia
(18/56, 32.1%), high-grade intraepithelial neoplasia (36/72, 50%)
and surgical margin tissues (16/60, 26.7%), indicating that PIG11
expression in GC was elevated(Pearson χ2=119.363,
P<0.001; Table I). As presented
in Table II, PIG11 expression was
positively correlated with infiltration depth (T-stage,
P<0.001), lymph node involvement (N-stage, P<0.001),
metastasis (M-stage, P=0.019), TNM stage (P<0.001) and CEA in
bloodserum (P<0.001), but not with sex, age, BMI, histological
type, tumor differentiation, CA19-9 levels in blood serum, HER-2
and Laurén classification.
 | Table IExpression of P53-induced gene 11
determined by immunohistochemistry in GC and gastric non-cancerous
tissues a cohort of the present study (n=790). |
Table I
Expression of P53-induced gene 11
determined by immunohistochemistry in GC and gastric non-cancerous
tissues a cohort of the present study (n=790).
| Tissue type | N | Low or no
expression | High
expression | Pearson
χ2 | P-value |
|---|
| Chronic
gastritis | 42 | 31 (73.8) | 11 (26.2) | 119.363 | <0.001 |
| Intestinal
metaplasia | 80 | 58 (72.5) | 22 (27.5) | | |
| Low-grade
intraepithelial neoplasia | 56 | 38 (67.9) | 18 (32.1) | | |
| High-grade
intraepithelial neoplasia | 72 | 36 (50.0) | 36 (50.0) | | |
| GC | 480 | 140 (29.2) | 340 (70.8) | | |
| Surgical margin (GC
patients) | 60 | 44 (73.3) | 16 (26.7) | | |
| Table IIAssociation of P53-induced gene 11
expression determined by tissue microarray-immunohistochemistry
with clinical characteristics in patients with gastric cancer in a
cohort of the present study. |
Table II
Association of P53-induced gene 11
expression determined by tissue microarray-immunohistochemistry
with clinical characteristics in patients with gastric cancer in a
cohort of the present study.
|
Characteristics | n | Low or no
expression | High
expression | Pearson
χ2 | P-value |
|---|
| Total | 480 | 140 (29.2) | 340 (70.8) | | |
| Sex | | | | 0.454 | 0.501 |
|
Male | 353 | 100 (28.3) | 253 (71.7) | | |
|
Female | 127 | 40 (31.5) | 87 (68.5) | | |
| Age (years) | | | | 0.819 | 0.366 |
|
≤60 | 228 | 71 (31.1) | 157 (68.9) | | |
|
>60 | 252 | 69 (27.4) | 183 (72.6) | | |
| BMI
(kg/m2) | | | | 0.063 | 0.082 |
|
≤24 | 181 | 54 (29.8) | 127 (70.2) | | |
|
>24 | 299 | 86 (28.8) | 213 (71.2) | | |
| Histological
type | | | | 5.131 | 0.162 |
|
Tubular | 409 | 125 (30.6) | 284 (69.4) | | |
|
Mucinous | 21 | 2 (9.5) | 19 (90.5) | | |
|
Mixed
(tubular and mucinous) | 20 | 4 (20.0) | 16 (80.0) | | |
|
Signet ring
cell | 30 | 9 (30.0) | 21 (70.0) | | |
|
Differentiation | | | | 4.471 | 0.107 |
|
Well | 62 | 22 (35.5) | 40 (64.5) | | |
|
Intermediate | 281 | 87 (31.0) | 194 (69.0) | | |
|
Poor | 137 | 31 (22.6) | 106 (77.4) | | |
| T-stage | | | | 71.189 | <0.001 |
|
1
(Tis+T1) | 86 | 55 (64.0) | 31 (36.0) | | |
|
2 | 86 | 28 (32.6) | 58 (67.4) | | |
|
3 | 264 | 54 (20.5) | 210 (79.5) | | |
|
4 | 44 | 3 (6.8) | 41 (93.2) | | |
| N-stage | | | | 31.838 | <0.001 |
|
0 | 201 | 84 (41.8) | 117 (58.2) | | |
|
1 | 70 | 21 (30.0) | 49 (70.0) | | |
|
2 | 115 | 22 (19.1) | 93 (80.9) | | |
|
3 | 94 | 13 (13.8) | 81 (86.2) | | |
| M-stage | | | | 5.471 | 0.019 |
|
0 | 461 | 139 (30.2) | 322 (69.8) | | |
|
1 | 19 | 1 (5.3) | 18 (94.7) | | |
| TNM stage | | | | 65.348 | <0.001 |
|
0+1 | 123 | 68 (55.3) | 55 (44.7) | | |
|
2 | 154 | 45 (29.2) | 109 (70.8) | | |
|
3+4 | 203 | 27 (13.3) | 176 (86.7) | | |
| CEA (ng/ml) | | | | 21.404 | <0.001 |
|
≤5 | 241 | 83 (34.4) | 158 (65.6) | | |
|
>5 | 198 | 37 (18.7) | 161 (81.3) | | |
|
Unknown | 41 | 20 (48.8) | 21 (51.2) | | |
| CA19-9 (U/ml) | | | | 1.179 | 0.555 |
|
≤37 | 197 | 62 (31.5) | 135 (68.5) | | |
|
>37 | 245 | 69 (28.2) | 176 (71.8) | | |
|
Unknown | 38 | 9 (23.7) | 29 (76.3) | | |
| HER-2 | | | | 0.008 | 0.931 |
|
0-2 | 388 | 113 (29.1) | 275 (70.9) | | |
|
3 | 92 | 27 (29.3) | 65 (70.7) | | |
| Laurén
classification | | | | 4.465 | 0.107 |
|
Intestinal
type | 263 | 87 (33.1) | 176 (66.9) | | |
|
Mixed
type | 83 | 19 (22.9) | 64 (77.1) | | |
|
Diffuse
type | 134 | 34 (25.4) | 100 (74.6) | | |
Association between high PIG11
expression and prognosis of patients with GC
The results of the univariate analyses suggested
that high PIG11 expression [hazard ratio (HR)=3.919; P<0.001],
tumor differentiation (HR=1.421; P<0.001), T-stage (HR=1.675;
P<0.001), N-stage (HR=1.470; P<0.001), M-stage (HR=1.944;
P=0.007) and TNM stage (HR=2.115; P<0.001) were associated with
poor OS of patients with GC (Table
III). Further multivariate analysis indicated that high PIG11
expression (HR=2.926; P<0.001) and TNM stage (HR=1.578; P=0.021)
were independent prognostic factors for GC (Table III).
| Table IIIUnivariate and multivariate analysis
of prognostic factors influencing 5-year survival of patients with
gastric cancer who donated IHC samples in a cohort of the present
study. |
Table III
Univariate and multivariate analysis
of prognostic factors influencing 5-year survival of patients with
gastric cancer who donated IHC samples in a cohort of the present
study.
| | Univariate
analysis | Multivariate
analysis |
|---|
| Factor | HR | P-value | 95% CI | HR | P-value | 95% CI |
|---|
| PIG11 expression
(high vs. low and none) | 3.919 | <0.001 | 2.633-5.833 | 2.926 | <0.001 | 1.941-4.410 |
| Age (≤60 vs. >60
years) | 1.193 | 0.150 | 0.938-1.516 | | | |
| Sex (male vs.
female) | 1.104 | 0.472 | 0.843-1.446 | | | |
| BMI (≤24 vs. >24
kg/m2) | 1.213 | 0.133 | 0.943-1.560 | | | |
| Histological type
[tubular vs. mucinous vs. mixed (tubular and mucinous) vs. signet
ring cells] | 1.038 | 0.621 | 0.894-1.206 | | | |
| Differentiation
(well vs. intermediate vs. poor) | 1.421 | <0.001 | 1.178-1.714 | 1.065 | 0.680 | 0.791-1.434 |
| TNM stage (0 +1 vs.
2 vs. 3+4) | 2.115 | <0.001 | 1.771-2.526 | 1.578 | 0.021 | 1.071-2.327 |
| T-stage (1 vs. 2
vs. 3 vs. 4) | 1.675 | <0.001 | 1.433-1.956 | 1.014 | 0.913 | 0.794-1.294 |
| N-stage (0 vs. 1
vs. 2 vs. 3) | 1.470 | <0.001 | 1.329-1.626 | 1.121 | 0.197 | 0.942-1.335 |
| M-stage (0 vs.
1) | 1.944 | 0.007 | 1.204-3.139 | 1.163 | 0.559 | 0.701-1.926 |
| CEA level (ng/ml)
(≤5 vs. >5) | 0.962 | 0.686 | 0.800-1.159 | | | |
| CA19-9 level (U/ml)
(≤37 vs. >37) | 1.051 | 0.603 | 0.872-1.266 | | | |
| HER-2 level (0-2
vs. 3) | 1.081 | 0.612 | 0.800-1.461 | | | |
| Laurén
classification (intestinal type vs. mixed type vs. diffuse
type) | 1.275 | <0.001 | 1.112-1.462 | 1.179 | 0.155 | 0.940-1.479 |
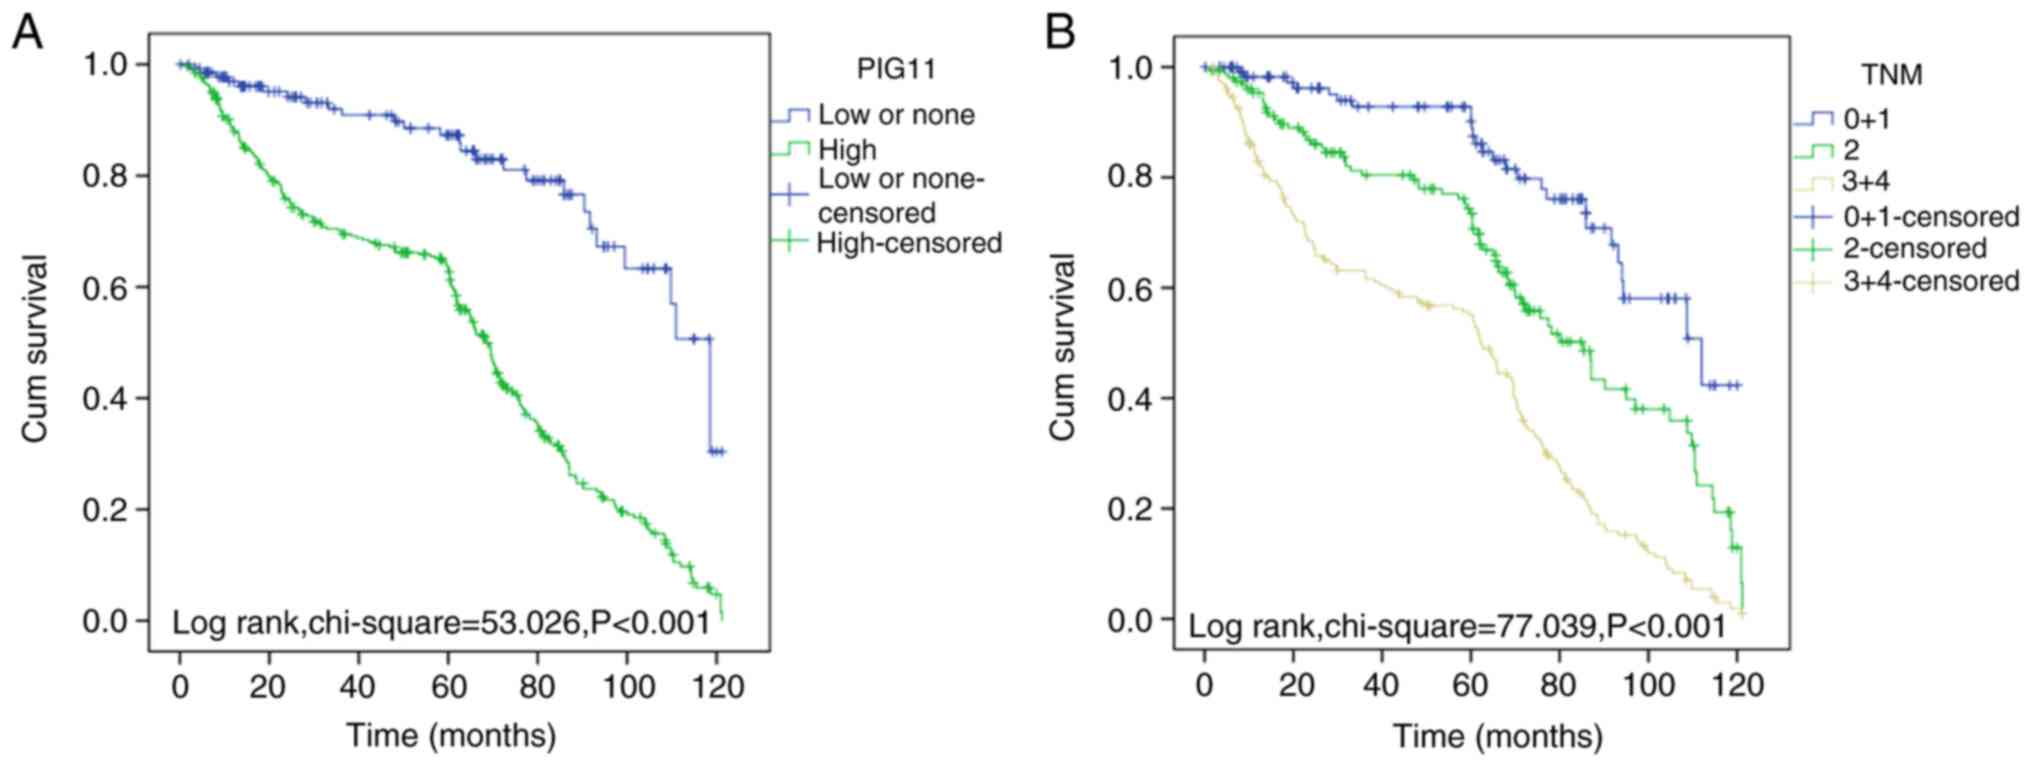
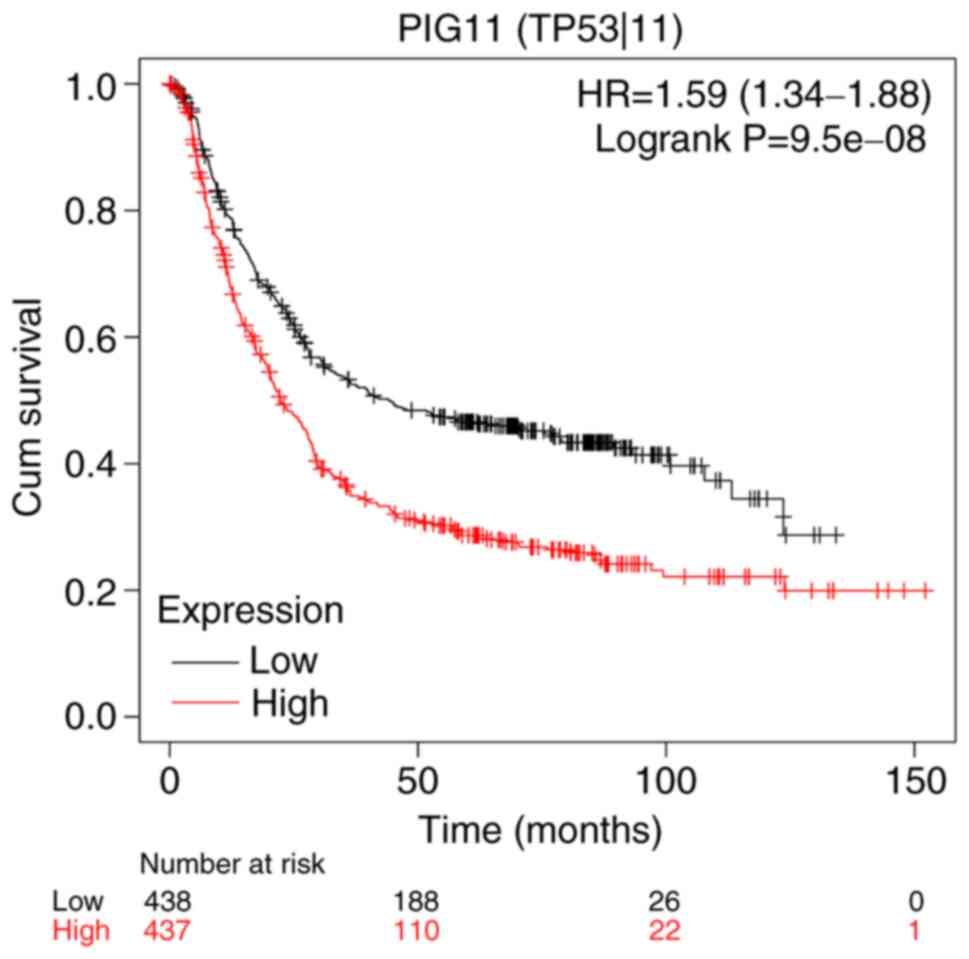
Kaplan-Meier curve analysis for the present cohort
(patients with GC whose samples were subjected to IHC analysis,
cutoff value=140) suggested that high PIG11 expression and advanced
TNM stage were associated with poor prognosis of GC (both
P<0.001; Fig. 4). Furthermore,
the results obtained from the Kaplan-Meier plotter database (n=875)
indicated that high PIG11 expression was associated with poor
prognosis of GC (P<0.001; Fig.
5), using the median as the cutoff value to divide patients
into a low- and a high-expression group.
Survival analysis for PIG11 in
different tumor types
Based on the data analyzed on GEPIA, high PIG11
expression was associated with an unfavorable survival prognosis of
patients with breast invasive carcinoma [n=1,070, log-rank
P=0.00017, HR (high)=1.90], kidney renal papillary cell carcinoma
[n=282, log rank P=0.031, HR (high)=2.00], mesothelioma [n=82,
log-rank P=0.04, HR (high)=1.70], uveal melanoma [n=78, log-rank
P=0.014, HR (high)=3.10], adopting the ‘median’ as the cutoff value
to divide patients into a low- and a high-expression group
(Fig. 6). Correlation analysis of
PIG11 with TNF, CEACAM5, PIK3CA, VEGFA and KDR demonstrated that in
GC tissues (n=408), PIG11 expression was significantly correlated
with TNF (P=0.0011, R=0.16), CEACAM5
(P=7.9x10⁻⁵, R=0.19), PIK3CA (P=0.028,
R=0.11), VEGFA (P=0.004, R=0.14) and KDR
(P=1.7x10⁻⁵, R=0.21), as presented in Fig. 7.
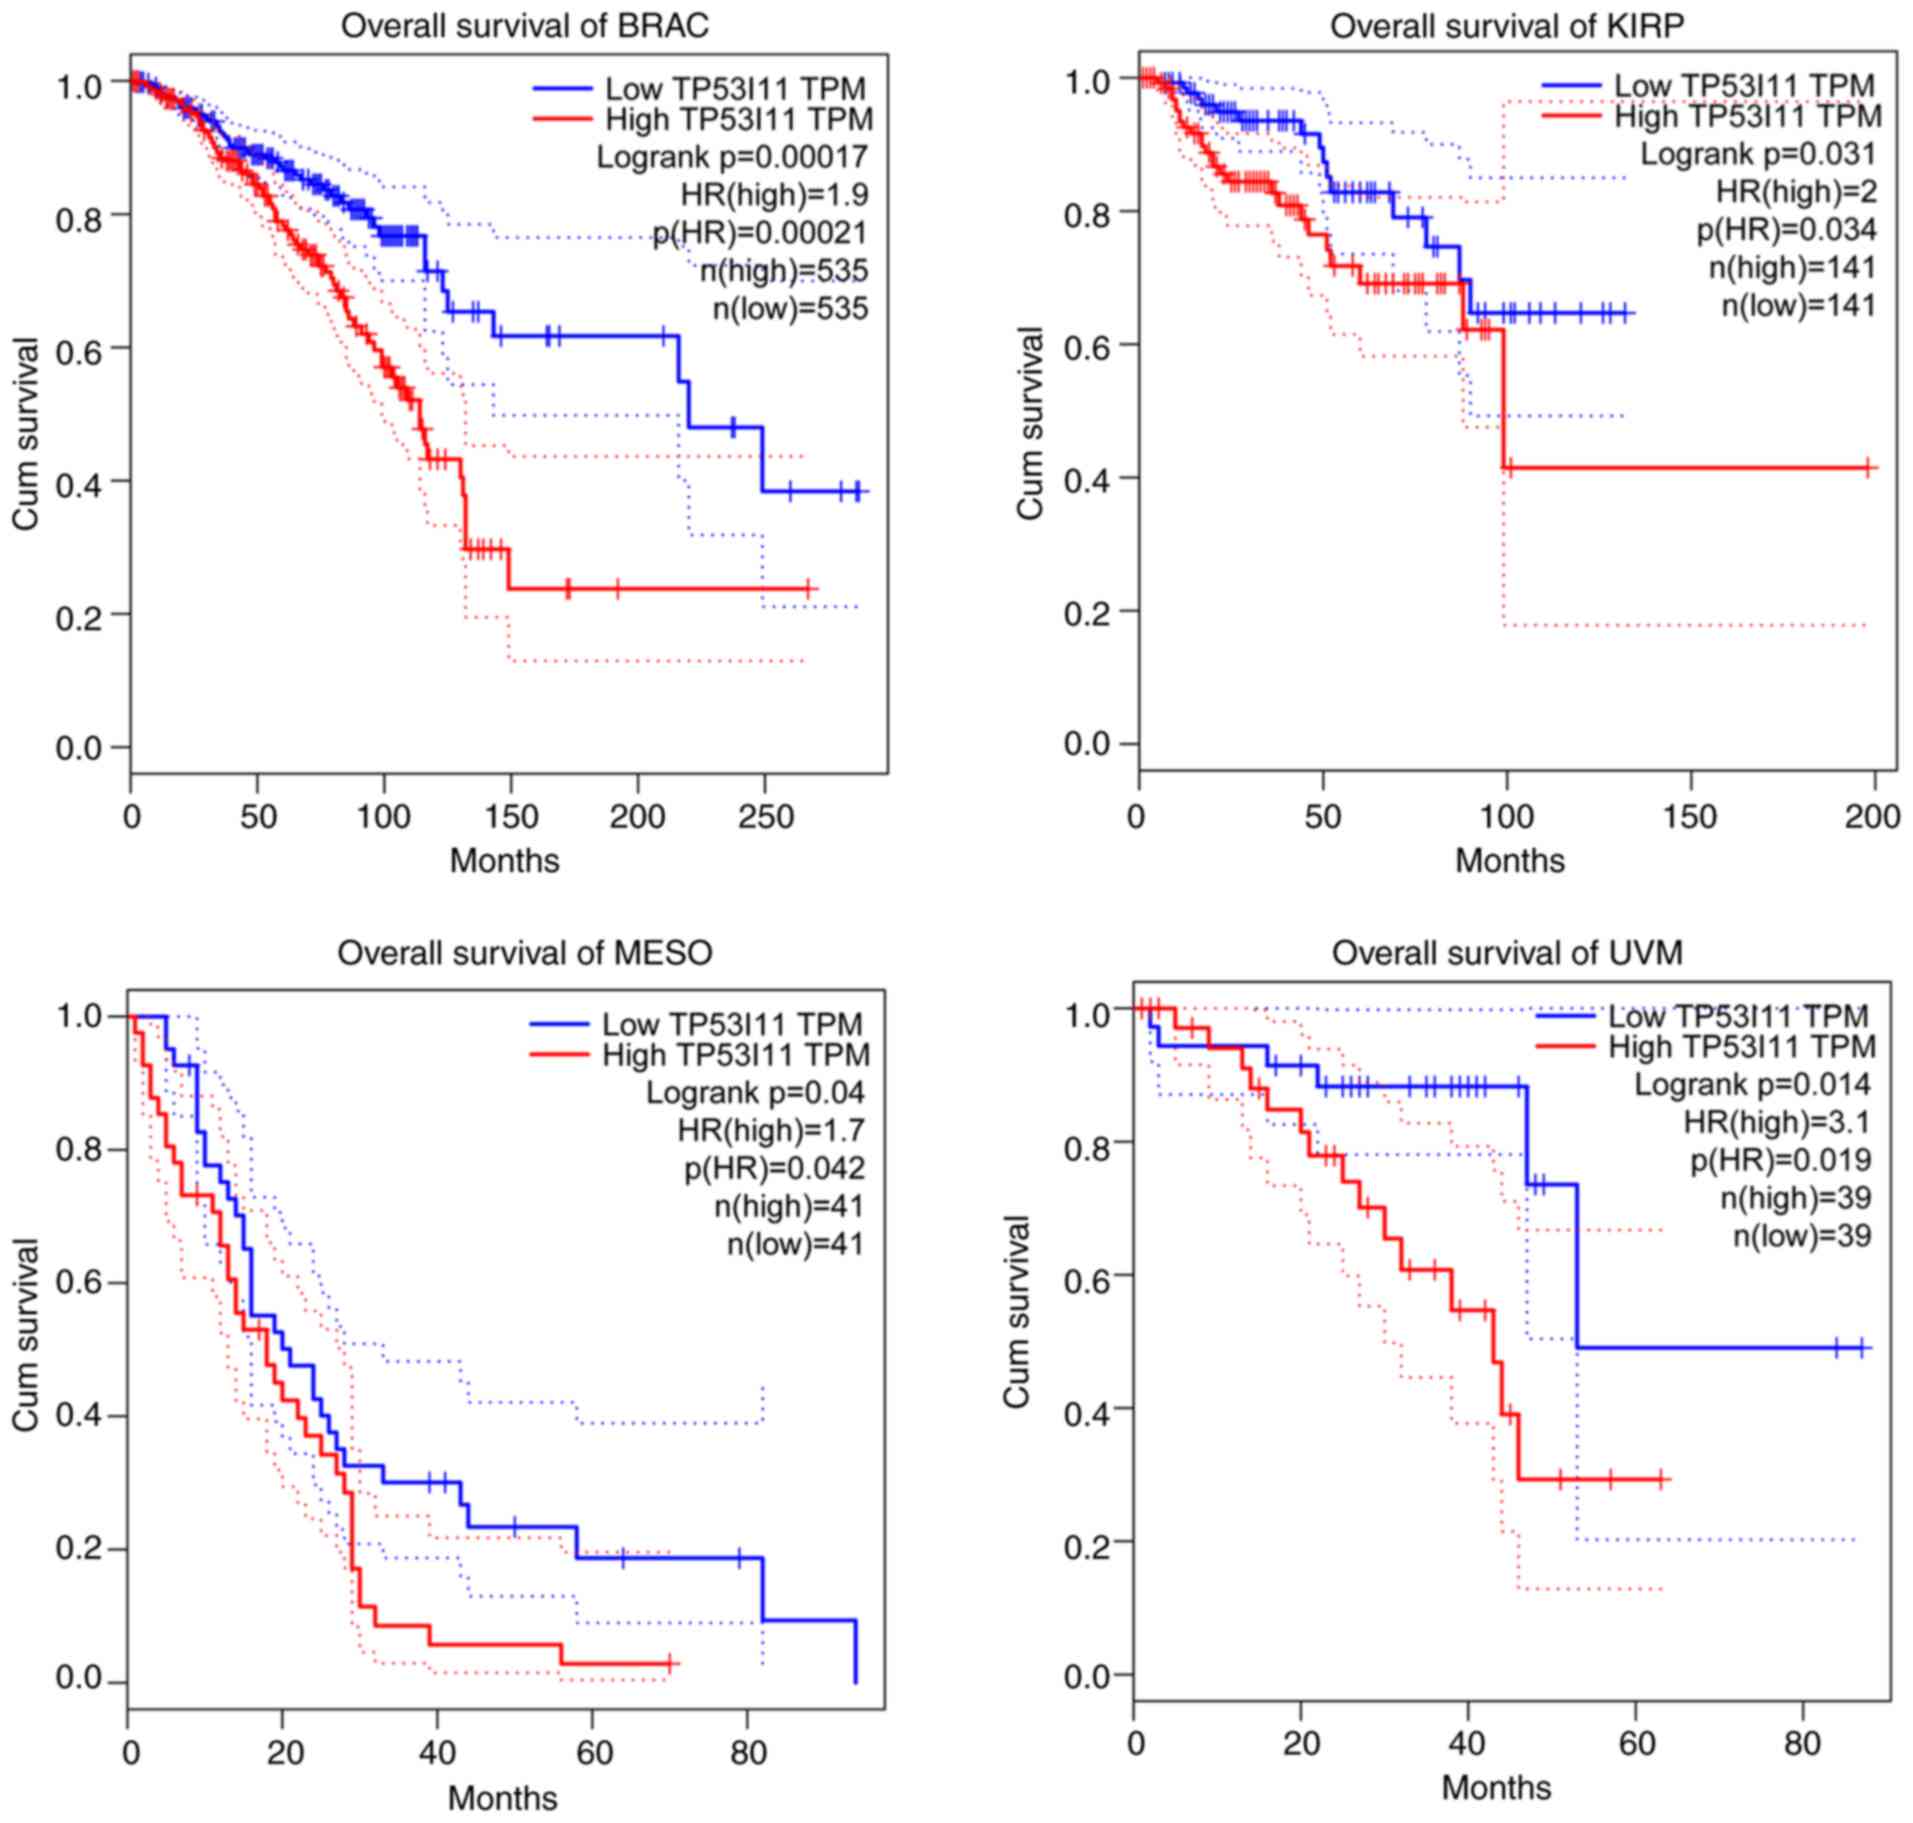 | Figure 6Association between the expression of
PIG11 and prognosis of patients with different tumor types obtained
from the Gene Expression Profiling Interactive Analysis online
database. The overall survival of patients with BRAC (n=1,070),
KIRP (n=282), MESO (n=82) and UVM (n=78) with high PIG11 expression
(red line) was significantly lower than that of patients with low
PIG11 expression (blue line). Censored datapoints indicate patients
who were still alive until the end of follow-up, patients who did
not show up to follow up appointments and patients who died of
other causes before the end of follow-up. Dotted lines indicate the
95% CI. BRAC, breast invasive carcinoma; KIRP, kidney renal
papillary cell carcinoma; MESO, mesothelioma; UVM, uveal melanoma;
PIG11, P53-induced gene 11; HR, hazard ratio; Cum, cumulative. |
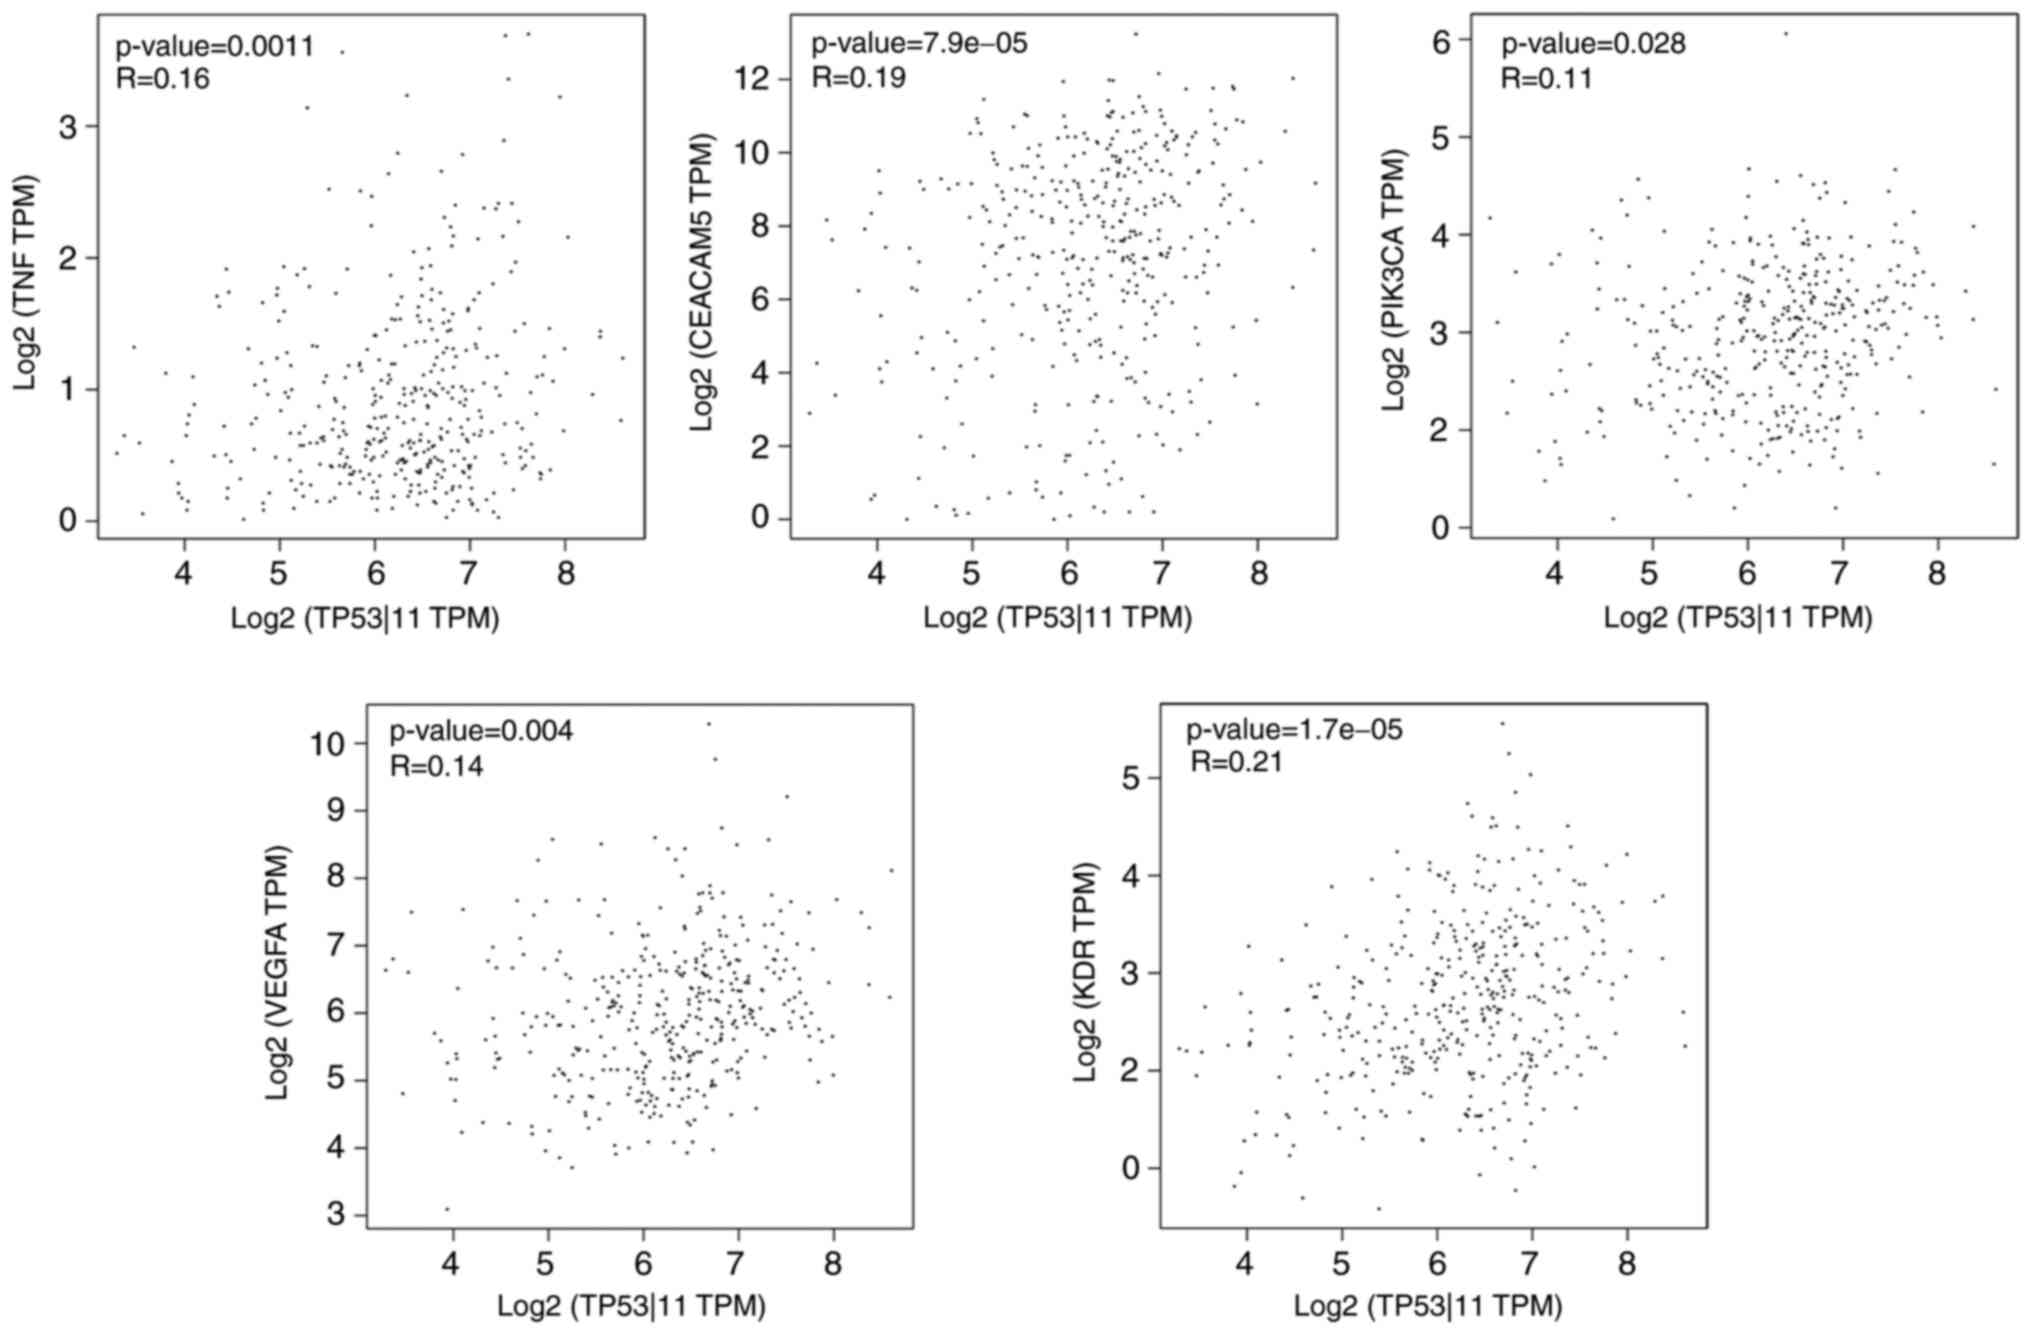 | Figure 7Correlationsamong PIG11, TNF,
CEACAM5, PIK3CA, VEGFA and KDR in GC tissues obtained from the Gene
Expression Profiling Interactive Analysis online database. In GC
tissues (n=408), the expression of PIG11 was significantly
correlated with that of TNF, CEACAM5, PIK3CA, VEGFA and KDR. TPM,
transcripts per kilo base of the exon model per million mapped
reads; PIG11/TP53I11, P53-induced gene 11; CEACAM5,
carcinoembryonic antigen related cell adhesion molecule 5; PIK3CA,
phosphatidylinositol-4,5-bisphosphate 3-kinase catalytic subunit
alpha; KDR, kinase insert domain receptor; GC, gastric cancer. |
Discussion
GC is a common upper gastrointestinal tumor type
(27). Given the atypicality of
clinical symptoms, numerous patients are already in the stage of
advanced metastasis at the time of clear diagnosis and metastatic
GC is closely related to poor prognosis (28). An effective treatment plan for GC is
necessary. At present, with the emergence of various biomarkers for
GC, such as VEGFR2(29), VEGF
(30,31), EGFR (32), MET (33), PIK3CA (34) and mTOR (35), the corresponding targeted drugs have
brought new hope regarding the OS of patients. Successful
biomarkers require to be cost-effective and reproducible, but to
date, challenges in identifying suitable predictive biomarkers have
hampered the success of numerous targeted therapies for GC
(28). Therefore, it is necessary
to discover novel biomarkers that may accurately predict patient
outcomes and allow for better treatment and follow-up
decisions.
PIG11 is a downstream target gene in the
p53-mediated apoptotic pathway. The expression of PIG11 is closely
related to the high expression of p53 in colon cancer and cell
apoptosis is involved (9). The
PIG11 gene is located on the human chromosome 11p11.2(7) and the encoded protein is located in
the cytoplasm, which contains 121 amino acids. Its isoelectric
point is PI 8.24 and its molecular weight is 12.904 kDa. As
indicated in a PATCH software analysis, PIG11 exists in the
DNA-binding sites of the gene p53, while a Basic Local Alignment
Search Tool (https://blast.ncbi.nlm.nih.gov/Blast.cgi) search
indicated that there are no records for PIG11 protein in this
database. It has been illustrated in studies that PIG11 is mainly
expressed in normal and tumor epithelial cells and may be involved
in the occurrence and development of tumors because of its role in
apoptosis (15).
GC is divided into four molecular subgroups, namely
Epstein-Barr virus-positive, microsatellite instability,
chromosomal instability (CIN) and genomic stable, according to The
Cancer Genome Atlas (TCGA) (36).
At present, the latter two subgroups cannot be identified in the
presence or absence of extensive somatic copy number changes in
TCGA (37). CIN, as the driving
force of intratumoral heterogeneity, is closely related to cancer
drug resistance (38). Therefore,
GC with CIN must be identified. According to TCGA, TP53 mutation
and the loss of its protein pathway are among the key features of
CIN GC (37). PIG11, which is
regarded as a TP53-induced protein, may be an important diagnostic
tool for this group.
P53 is associated with high proliferation of tumor
cells (39). Cell apoptosis induced
by p53 is carried out in a complex multi-step process. The
activation of p53 induced by redox-related genes, production of
reactive oxygen species and mitochondrial oxidative damage are
involved in the process (40,41).
Studies have indicated that numerous proteins encoded by PIGs are
able to generateor regulate oxidative stress. PIG1 encodes
galactin-7 and stimulates the production of superoxide (42). PIG6 is involved in the prolongation
of oxidative stress (43). PIG8
induced by p53 is considered to be a tumor-suppressor gene
(44). All of the above-mentioned
PIG species are closely related to the intracellular redox status,
thereby indicating that PIG11 may be related to oxidative reduction
and mitochondrial component damage during apoptosis. As reported in
another study, overexpression of PIG11 may change metabolic
pathways and metabolites of redox processes, such as the changes of
NADPH oxidase in the membrane (45).
Apoptosis of epithelial cells depends on the
attachment of integrin-mediated extracellular matrix (ECM)
(46). Its neoplastic
transformation is associated with loss of neurodegeneration and
increased ECM-dependent survival, which is widely regarded as a
sign of oncogenic epithelial-mesenchymal transition (EMT) necessary
for epithelial cancer stem cells and tumor metastasis (47). Cell death induced by ECM deprivation
involves intrinsic and extrinsic apoptosis and autophagy (48). Furthermore, PIG11 is related to EMT,
cell migration and invasion in MCF10A cells (49).
In the present study, PIG11 expression in GC tissues
was significantly higher than that in the non-cancerous tissues.
Furthermore, the ROC curve was plotted to evaluate the diagnostic
value of PIG11 expression for patients with GC. The results
suggested that PIG11 was able to distinguish GC tissues from
adjacent tissues, indicating that PIG11 expression may act as a
biomarker for GC. In addition, the protein expression of PIG11 in
GC tissues was related to the T-, N-, M- and TNM stage, as well as
CEA in blood serum. Furthermore, high levels of PIG11 protein
expression were related to poor OS of patients with GC. Based on
previous studies, the depth of tumor invasion and metastasis may
affect patients in the early stages of tumor development, which has
been considered to be the primary cause of death in cancer patients
(50). Furthermore, the TNM stage
has an important role in affecting the prognosis of patients with
GC (51). Therefore, high
expression of PIG11 may enhance the invasion and metastasis ability
of GC cells and further lead to poor prognosis of patients with GC.
PIG11 is expected to be an early biomarker for diagnosing GC. A
bioinformatics analysis in the GEPIA database indicated that PIG11
expression is significantly correlated with GC-associated molecular
markers, including TNF, CEACAM5, PIK3CA, VEGFA and KDR, which are
related to the molecular typing and targeted drug therapy of GC,
thereby indicating that highPIG11 expression maybe used as an
independent molecular biomarker of GC.
Of note, the present study had certain limitations,
which primarily include the following aspects: First, the present
study was of a retrospective nature and all of the specimens were
selected randomly, the size of the cohort was small and the quality
of the specimens were limited, and the detection of the protein
expression of PIG11 using IHC may have been affected by tumor
heterogeneity and subjective scoring system analysis. Furthermore,
the significant correlations among TNF, CEACAM5, PIK3CA, VEGFA, KDR
and PIG11 based on the data from the GEPIA database require further
detailed exploration for confirmation in a follow-up study due to
the low R-values. The low R-values among TNF, CEACAM5, PIK3CA,
VEGFA, KDR and PIG11 may be partly due to the low number of cases
included in the GEPIA database. Finally, the biological roles of
PIG11 in GC, particularly its role in apoptosis, remain to be
elucidated. Future research should focus on the biological
mechanisms at the cytological level and animal experiments to
determine the role of PIG11 in GC.
In conclusion, the experimental results of the
present study indicated that PIG11 is closely related to the
invasion and metastasis of GC and prognosis of patients with GC,
which was also confirmed by bioinformatics analysis. IG11 is
expected to become a novel molecular marker for the clinical
diagnosis and treatment of GC and a predictive indicator for the
prognosis of GC patients.
Supplementary Material
The clinicopathological data of the 60
freshly frozen GC and matched adjacent tissues.
The clinicopathological data for the
patients with noncancerous stomach lesions.
Acknowledgements
Not applicable.
Funding
This study was supported by grants from the Nantong
Science and Technology Program (grant no. MS12016031).
Availability of data and materials
The datasets used and/or analyzed during the current
study are available from the corresponding author on reasonable
request.
Authors' contributions
JG performed data analyses and wrote the manuscript.
SZ and XH contributed significantly to data analyses and manuscript
revision. SC and YW conceived and designed the study. JG and XH
performed the experiments. All authors read and approved the final
manuscript.
Ethics approval and consent to
participate
This study was approved by the Human Research Ethics
Committee at the Affiliated Hospital of Nantong University
(Nantong, China). All experimental methods and related protocols
were performed according to the regulations of the Affiliated
Hospital of Nantong University (Nantong, China). Written informed
consent was obtained from the patients or their guardians.
Patient consent for publication
Not applicable.
Competing interests
The authors declare that they have no competing
interests.
References
|
1
|
Li Y, Xu Q, Yang W, Wu T and Lu X:
Oleanolic acid reduces aerobic glycolysis-associated proliferation
by inhibiting yes-associated protein in gastric cancer cells. Gene.
712(143956)2019.PubMed/NCBI View Article : Google Scholar
|
|
2
|
Cavatorta O, Scida S, Miraglia C, Barchi
A, Nouvenne A, Leandro G, Meschi T, De' Angelis GL and Di Mario F:
Epidemiology of gastric cancer and risk factors. Acta Biomed.
89:82–87. 2018.PubMed/NCBI View Article : Google Scholar
|
|
3
|
Laterza L, Scaldaferri F and Gasbarrini A:
Risk factors for gastric cancer: Is it time to discard PPIs? Gut.
68:176–177. 2019.PubMed/NCBI View Article : Google Scholar
|
|
4
|
Venerito M, Vasapolli R, Rokkas T and
Malfertheiner P: Gastric cancer: Epidemiology, prevention, and
therapy. Helicobacter. 23 (Suppl 1)(e12518)2018.PubMed/NCBI View Article : Google Scholar
|
|
5
|
Rawla P and Barsouk A: Epidemiology of
gastric cancer: Global trends, risk factors and prevention. Prz
Gastroenterol. 14:26–38. 2019.PubMed/NCBI View Article : Google Scholar
|
|
6
|
Zang YS, Dai C, Xu X, Cai X, Wang G, Wei
J, Wu A, Sun W, Jiao S and Xu Q: Comprehensive analysis of
potential immunotherapy genomic biomarkers in 1000 Chinese patients
with cancer. Cancer Med. 8:4699–4708. 2019.PubMed/NCBI View Article : Google Scholar
|
|
7
|
Arimoto T, Katagiri T, Oda K, Tsunoda T,
Yasugi T, Osuga Y, Yoshikawa H, Nishii O, Yano T and Nakamura Y:
Genome-wide cDNA microarray analysis of gene-expression profiles
involved in ovarian endometriosis. Int J Oncol. 22:551–560.
2003.PubMed/NCBI
|
|
8
|
Ricketts SL, Carter JC and Coleman WB:
Identification of three 11p11.2 candidate liver tumor suppressors
through analysis of known human genes. Mol Carcinog. 36:90–99.
2003.PubMed/NCBI View
Article : Google Scholar
|
|
9
|
Polyak K, Xia Y, Zweier J, Kinzler K and
Vogelstein B: A model for p53-induced apoptosis. Nature.
389:300–305. 1997.PubMed/NCBI View
Article : Google Scholar
|
|
10
|
Liang XQ, Cao EH, Zhang Y and Qin JF: A
P53 target gene, PIG11, contributes to chemosensitivity of cells to
arsenic trioxide. FEBS Lett. 569:94–98. 2004.PubMed/NCBI View Article : Google Scholar
|
|
11
|
Liang XQ, Cao EH, Zhang Y and Qin JF:
P53-induced gene 11 (PIG11) involved in arsenic trioxide-induced
apoptosis in human gastric cancer MGC-803 cells. Oncol Rep.
10:1265–1269. 2003.PubMed/NCBI
|
|
12
|
Xu L, Hui A, Albanis E, Arthur M, O'Byrne
S, Blaner W, Mukherjee P, Friedman S and Eng F: Human hepatic
stellate cell lines, LX-1 and LX-2: New tools for analysis of
hepatic fibrosis. Gut. 54:142–151. 2005.PubMed/NCBI View Article : Google Scholar
|
|
13
|
Liu XM, Xiong XF, Song Y, Tang RJ, Liang
XQ and Cao EH: Possible roles of a tumor suppressor gene PIG11 in
hepatocarcinogenesis and As2O3-induced
apoptosis in liver cancer cells. J Gastroenterol. 44:460–469.
2009.PubMed/NCBI View Article : Google Scholar
|
|
14
|
Wang Y, Liu X, Liu G, Wang X, Hu R and
Liang X: PIG11 over-expression predicts good prognosis and induces
HepG2 cell apoptosis via reactive oxygen species-dependent
mitochondrial pathway. Biomed Pharmacother. 108:435–442.
2018.PubMed/NCBI View Article : Google Scholar
|
|
15
|
Zhu B, Tian T and Zhao M: MiR-645 promotes
proliferation and migration of non-small cell lung cancer cells by
targeting TP53I11. Eur Rev Med Pharmacol Sci. 24:6150–6156.
2020.PubMed/NCBI View Article : Google Scholar
|
|
16
|
Xiao T, Xu Z, Zhang H, Geng J, Qiao Y,
Liang Y, Yu Y, Dong Q and Suo G: TP53I11 suppresses
epithelial-mesenchymal transition and metastasis of breast cancer
cells. BMB Rep. 52:379–384. 2019.PubMed/NCBI View Article : Google Scholar
|
|
17
|
Li Z and Li Q: The latest 2010 WHO
classification of tumors of digestive system. Zhonghua Bing Li Xue
Za Zhi. 40:351–354. 2011.PubMed/NCBI(In Chinese).
|
|
18
|
He X, Wu W, Lin Z, Ding Y, Si J and Sun L:
Validation of the American Joint Committee on Cancer (AJCC) 8th
edition stage system for gastric cancer patients: A
population-based analysis. Gastric Cancer. 21:391–400.
2018.PubMed/NCBI View Article : Google Scholar
|
|
19
|
Tang Z, Li C, Kang B, Gao G, Li C and
Zhang Z: GEPIA: A web server for cancer and normal gene expression
profiling and interactive analyses. Nucleic Acids Res. 45:W98–W102.
2017.PubMed/NCBI View Article : Google Scholar
|
|
20
|
Livak KJ and Schmittgen TD: Analysis of
relative gene expression data using real-time quantitative PCR and
the 2(-Delta Delta C(T)) method. Methods. 25:402–408.
2001.PubMed/NCBI View Article : Google Scholar
|
|
21
|
Wang Y, Chen S, Tian W, Zhang Q, Jiang C,
Qian L and Liu Y: High-expression HBO1 predicts poor prognosis in
gastric cancer. Am J Clin Pathol. 152:517–526. 2019.PubMed/NCBI View Article : Google Scholar
|
|
22
|
Camp R, Dolled-Filhart M and Rimm D:
X-tile: A new bio-informatics tool for biomarker assessment and
outcome-based cut-point optimization. Clin Cancer Res.
10:7252–7259. 2004.PubMed/NCBI View Article : Google Scholar
|
|
23
|
Szasz AM, Lanczky A, Nagy A, Forster S,
Hark K, Green JE, Boussioutas A, Busuttil R, Szabo A and Gyorffy B:
Cross-validation of survival associated biomarkers in gastric
cancer using transcriptomic data of 1,065 patients. Oncotarget.
7:49322–49333. 2016.PubMed/NCBI View Article : Google Scholar
|
|
24
|
Röcken C: Molecular classification of
gastric cancer. Expert Rev Mol Diagn. 17:293–301. 2017.PubMed/NCBI View Article : Google Scholar
|
|
25
|
Cho JY, Lim JY, Cheong JH, Park YY, Yoon
SL, Kim SM, Kim SB, Kim H, Hong SW, Park YN, et al: Gene expression
signature-based prognostic risk score in gastric cancer. Clin
Cancer Res. 17:1850–1857. 2011.PubMed/NCBI View Article : Google Scholar
|
|
26
|
Ooi CH, Ivanova T, Wu J, Lee M, Tan IB,
Tao J, Ward L, Koo JH, Gopalakrishnan V, Zhu Y, et al: Oncogenic
pathway combinations predict clinical prognosis in gastric cancer.
PLoS Genet. 5(e1000676)2009.PubMed/NCBI View Article : Google Scholar
|
|
27
|
Guo S, Shang M, Dong Z, Zhang J, Wang Y
and Zhao Y: The assessment of the optimal number of examined lymph
nodes and prognostic models based on lymph nodes for predicting
survival outcome in patients with stage N3b gastric cancer. Asia
Pac J Clin Oncol: Aug 6, 2020 doi: 10.1111/ajco.13358 (Epub ahead
of print).
|
|
28
|
Tan AC, Chan DL, Faisal W and Pavlakis N:
New drug developments in metastatic gastric cancer. Therap Adv
Gastroenterol. 11(1756284818808072)2018.PubMed/NCBI View Article : Google Scholar
|
|
29
|
Menard S, Pupa SM, Campiglio M and
Tagliabue E: Biologic and therapeutic role of HER2 in cancer.
Oncogene. 22:6570–6578. 2003.PubMed/NCBI View Article : Google Scholar
|
|
30
|
Vasudev NS and Reynolds AR:
Anti-angiogenic therapy for cancer: Current progress, unresolved
questions and future directions. Angiogenesis. 17:471–494.
2014.PubMed/NCBI View Article : Google Scholar
|
|
31
|
De Vita F, Borg C, Farina G, Geva R,
Carton I, Cuku H, Wei R and Muro K: Ramucirumab and paclitaxel in
patients with gastric cancer and prior trastuzumab: Subgroup
analysis from RAINBOW study. Future Oncol. 15:2723–2731.
2019.PubMed/NCBI View Article : Google Scholar
|
|
32
|
Troiani T, Napolitano S, Della Corte CM,
Martini G, Martinelli E, Morgillo F and Ciardiello F: Therapeutic
value of EGFR inhibition in CRC and NSCLC: 15 years of clinical
evidence. ESMO Open. 1(e000088)2016.PubMed/NCBI View Article : Google Scholar
|
|
33
|
Catenacci DVT, Tebbutt NC, Davidenko I,
Murad AM, Al-Batran SE, Ilson DH, Tjulandin S, Gotovkin E,
Karaszewska B, Bondarenko I, et al: Rilotumumab plus epirubicin,
cisplatin, and capecitabine as first-line therapy in advanced
MET-positive gastric or gastro-oesophageal junction cancer
(RILOMET-1): A randomised, double-blind, placebo-controlled, phase
3 trial. Lancet Oncol. 18:1467–1482. 2017.PubMed/NCBI View Article : Google Scholar
|
|
34
|
Shen X, Zhao Y, Chen X, Sun H, Liu M,
Zhang W, Jiang F and Li P: Associations of PIK3CA mutations with
clinical features and prognosis in gastric cancer. Future Oncol.
15:1873–1894. 2019.PubMed/NCBI View Article : Google Scholar
|
|
35
|
Xu DZ, Geng QR, Tian Y, Cai MY, Fang XJ,
Zhan YQ, Zhou ZW, Li W, Chen YB, Sun XW, et al: Activated mammalian
target of rapamycin is a potential therapeutic target in gastric
cancer. BMC Cancer. 10(536)2010.PubMed/NCBI View Article : Google Scholar
|
|
36
|
Schoop I, Maleki S, Behrens H, Krüger S,
Haag J and Röcken C: p53 immunostaining cannot be used to predict
TP53 mutations in gastric cancer: Results from a large Central
European cohort. Hum Pathol. 105:53–66. 2020.PubMed/NCBI View Article : Google Scholar
|
|
37
|
Cancer Genome Atlas Research Network.
Comprehensive molecular characterization of gastric adenocarcinoma.
Nature. 513:202–209. 2014.PubMed/NCBI View Article : Google Scholar
|
|
38
|
Tannock I and Hickman J: Limits to
personalized cancer medicine. N Engl J Med. 375:1289–1294.
2016.PubMed/NCBI View Article : Google Scholar
|
|
39
|
Goussia AC, Papoudou-Bai A, Charchanti A,
Kitsoulis P, Kanavaros P, Kalef-Ezra J, Stefanou D and Agnantis NJ:
Alterations of p53 and Rb pathways are associated with high
proliferation in bladder urothelial carcinomas. Anticancer Res.
38:3985–3988. 2018.PubMed/NCBI View Article : Google Scholar
|
|
40
|
Ma Z, Yang Y, Di S, Feng X, Liu D, Jiang
S, Hu W, Qin Z, Li Y, Lv J, et al: Pterostilbene exerts anticancer
activity on non-small-cell lung cancer via activating endoplasmic
reticulum stress. Sci Rep. 7(8091)2017.PubMed/NCBI View Article : Google Scholar
|
|
41
|
Navarro-Yepes J, Burns M, Anandhan A,
Khalimonchuk O, del Razo LM, Quintanilla-Vega B, Pappa A,
Panayiotidis MI and Franco R: Oxidative stress, redox signaling,
and autophagy: Cell death versus survival. Antioxid Redox Signal.
21:66–85. 2014.PubMed/NCBI View Article : Google Scholar
|
|
42
|
Yaprak E, Kasap M, Akpinar G, Kayaalti-Y
üksek S, Sinanoğlu A, Guzel N and Demirturk Kocasarac H: The
prominent proteins expressed in healthy gingiva: A pilot
exploratory tissue proteomics study. Odontology. 106:19–28.
2018.PubMed/NCBI View Article : Google Scholar
|
|
43
|
Kung CP, Khaku S, Jennis M, Zhou Y and
Murphy ME: Identification of TRIML2, a novel p53 target, that
enhances p53 SUMOylation and regulates the transactivation of
proapoptotic genes. Mol Cancer Res. 13:250–262. 2015.PubMed/NCBI View Article : Google Scholar
|
|
44
|
van Ginkel PR, Yan MB, Bhattacharya S,
Polans AS and Kenealey JD: Natural products induce a G
protein-mediated calcium pathway activating p53 in cancer cells.
Toxicol Appl Pharmacol. 288:453–462. 2015.PubMed/NCBI View Article : Google Scholar
|
|
45
|
Lin CC, Lee IT, Wu WL, Lin WN and Yang CM:
Adenosine triphosphate regulates NADPH oxidase activity leading to
hydrogen peroxide production and COX-2/PGE2 expression in A549
cells. Am J Physiol Lung Cell Mol Physiol. 303:L401–L412.
2012.PubMed/NCBI View Article : Google Scholar
|
|
46
|
Chiarugi P: From anchorage dependent
proliferation to survival: Lessons from redox signalling. IUBMB
Life. 60:301–307. 2008.PubMed/NCBI View
Article : Google Scholar
|
|
47
|
Au S, Storey B, Moore J, Tang Q, Chen Y,
Javaid S, Sarioglu A, Sullivan R, Madden M, O'Keefe R, et al:
Clusters of circulating tumor cells traverse capillary-sized
vessels. Proc Natl Acad Sci USA. 113:4947–4952. 2016.PubMed/NCBI View Article : Google Scholar
|
|
48
|
Vlahakis A and Debnath J: The
Interconnections between autophagy and integrin-mediated cell
adhesion. J Mol Biol. 429:515–530. 2017.PubMed/NCBI View Article : Google Scholar
|
|
49
|
Xiao T, Xu Z, Zhou Y, Zhang H, Geng J,
Liang Y, Qiao H and Suo G: Loss of TP53I11 enhances the
extracellular Matrix-independent survival by promoting activation
of AMPK. IUBMB Life. 71:183–191. 2019.PubMed/NCBI View Article : Google Scholar
|
|
50
|
Otterbein LR, Graceffa P and Dominguez R:
The crystal structure of uncomplexed actin in the ADP state.
Science. 293:708–711. 2001.PubMed/NCBI View Article : Google Scholar
|
|
51
|
Harrison JD and Fielding JW: Prognostic
factors for gastric cancer influencing clinical practice. World J
Surg. 19:496–500. 1995.PubMed/NCBI View Article : Google Scholar
|