Introduction
Diabetes mellitus type 2 (DM2) is a chronic
metabolic disease characterised by hyperglycaemia caused by an
absolute or relative deficiency of insulin or insulin resistance
(1). Its prevalence is increasing
worldwide, and it is currently considered a worldwide epidemic; 425
million individuals reportedly had diabetes in 2017(2). In patients with DM2, chronic
hyperglycaemia leads to dysfunction of the kidneys, blood vessels,
nerves and heart and the development of bone pathologies, such as
osteoporosis, osteopenia, and osteoarthritis, that increase the
risk of fractures (1,3).
Patients with DM2 have increased bone mineral
density (BMD) compared with individuals without diabetes (4); however, they have bone fragility, a
higher incidence of fractures, changes in the bone
microarchitecture and a decrease in bone mineral quality (5,6).
These bone tissue alterations appear to be due in part to an
alteration in osteoblast function and mineral matrix formation.
Hyperglycaemia is the origin of impaired bone
metabolism, bone formation imbalance and reduced osteoblast
activity (7). For example, we
previously observed that high glucose concentrations increase
mineral matrix deposition but decrease the quality of formed
crystals (8). In addition, chronic
hyperglycaemia alters the specific activity of alkaline phosphatase
(ALP) and increases the expression of interleukin (IL)-6, IL-8 and
monocyte chemoattractant protein 1 mRNA (8). Hyperglycaemia can also stimulate
increased production of reactive oxygen species (ROS), which
inhibit osteoblastgenesis. Consequently, increased ROS production
directly affects BMD, osteoblast metabolism and bone remodelling
(9). Oxidative stress decreases
runt-related transcription factor 2 (RUNX2), ALP and bone
sialoprotein (BSP) expression in MC3T3-E1 osteoblasts (10). Moreover, in rabbit osteoblasts,
elevated ROS inhibits the nuclear translocation of RUNX2 and
osteoblastic differentiation, but increases the nuclear
translocation of nuclear factor κ-light-chain-enhancer of activated
B cells (NF-κB), associated with pro-inflammatory processes and
bone resorption (11).
Docosahexaenoic acid (DHA) is an omega-3 long-chain
polyunsaturated fatty acid with antioxidant effects; it is
speculated to reduce mitochondrial depolarisation and increase
antioxidant mechanisms (12,13).
DHA also exhibits anti-inflammatory effects through a cross-talk
mechanism between the nuclear factor erythroid 2-related factor-2
(NRF2)/haem oxygenase-1 (HO-1) antioxidant pathway and the
inflammatory IκB kinase (IKK)/NF-κB pathway (14). In this regard, it has been
suggested that DHA ameliorates rheumatoid arthritis by inhibiting
IL-1β and IL-6 expression (15).
Besides, the DHA blood concentration is positively associated with
BMD in healthy men (16). A
DHA-rich diet increases bone density and the trabecular number,
decreases trabecular separation, and contributes to peak bone mass
in mice and rats (17,18). Moreover, increased dietary intake
of DHA aids in bone formation, inducing and preserving bone mass
due to an increase in mesenchymal stem cells (19) and their maturation to osteoblasts
(20). DHA diminishes the number
of bone-resorptive cells by suppressing the proliferation and
differentiation of bone marrow-derived macrophages and by enhancing
the apoptosis of mature osteoclasts (21). In vitro studies have shown
that DHA treatment in MC3T3-E1 osteoblast-like cells from mice
increases mineral nodule formation without altering their
distribution (22). Based on the
beneficial effects of DHA on bone tissue, and considering its
anti-inflammatory and antioxidant mechanisms, we decided to
investigate whether DHA could counteract the alterations caused by
a high glucose concentration on the biomineralization process,
mineral quality and ROS production in a human osteoblast cell
line.
Materials and methods
Cell culture
The human osteoblast cell line hFOB 1.19 (American
Type Culture Collection; CRL-11372) was maintained in Dulbecco's
modified Eagle's medium (DMEM; Invitrogen; Thermo Fisher
Scientific, Inc.). It was confirmed that the cell culture was
mycoplasma free by using a DNA staining method (bisBenzimide H
33258; Sigma-Aldrich; Merck KGaA). Osteoblasts were cultured with a
glucose concentration of 5.5 mM. All media were supplemented with
10% foetal bovine serum (FBS; Mediatech, Probiotek SA de CV,
Mexico), 100 IU/ml penicillin and 100 µg/ml streptomycin
(Sigma-Aldrich; Merck KGaA). Incubations were performed at 37˚C in
5% CO2 in humidified air. Cells between the third and
fourth passages were used for all experiments.
Culture conditions and DHA
treatments
A stock solution of DHA
(cis-4,7,10,13,16,19-Docosahexaenoic acid;
C22H32O2; CAS no. 6217-54-5;
Sigma-Aldrich; Merck KGaA) was prepared in dimethyl sulfoxide
(DMSO; Sigma-Aldrich; Merck KGaA) and diluted in complete culture
medium. The final concentration of DMSO was 0.01%, which did not
provoke any toxic effects (23).
This same DMSO concentration was used as the vehicle control.
To analyse the effects of DHA, two concentrations
were used (10 and 20 µM), which have been reported to induce
osteoblastic differentiation and increase mineralisation, and they
have no adverse impact on osteoblast proliferation (24). DHA was added every 48 h when the
medium was changed, and it was prepared fresh to avoid its
oxidation.
Cell differentiation and matrix mineralisation were
induced with osteogenic medium [OM; 2.5 mM ascorbic acid
(Sigma-Aldrich; Merck KGaA) and 10 mM β-glycerophosphate
(Sigma-Aldrich; Merck KGaA)] supplemented with 10% FBS. The cells
were cultured in low-glucose DMEM (DMEM-LG) with 5.5 mM glucose,
which is equivalent to physiological glucose levels (99 mg/dl in
blood), normal glucose (NG). In addition, DMEM containing 24 mM
glucose (Invitrogen; Thermo Fisher Scientific, Inc.), high glucose
(HG), was used. This concentration is equivalent to 432 mg/dl
glucose in the blood and represents chronic hyperglycaemia.
Alterations in osteoblast mineralisation have been observed at this
glucose concentration (8,9). Finally, DMEM-LG (5.5 mM glucose)
supplemented with 18.5 mM mannitol (Man; Sigma-Aldrich; Merck KGaA)
was used as an osmotic control. In each experiment, the cells were
distributed among the following experimental groups: i) NG; ii) NG
+ 10 µM DHA; iii) NG + 20 µM DHA; iv) HG; v) HG + 10 µM DHA; vi) HG
+ 20 µM DHA; and vii) NG + 18.5 mM Man.
Mineralisation analysis
hFOB 1.19 cells were seeded at a density of
8x10⁴ cells/cm2 in 12-well cell culture
plates (Corning, Inc.). When the cells reached semi-confluence, the
conditioning medium was changed to OM containing glucose and DHA at
the concentrations mentioned above and the cells were cultured for
7, 14 or 21 days.
The mineral matrix was fixed with 70% methanol at
4˚C for 1 h, and mineral deposition was identified by using a
saturated solution of 2% Alizarin Red, pH 4.1 (Sigma-Aldrich; Merck
KGaA) for 2 h at room temperature. The stained mineral was observed
with an inverted microscope (Zeiss AG). The dye was extracted with
10% acetic acid, and the supernatants were processed according to
Gregory et al (25).
Briefly, Alizarin Red-stained cell culture plates were stored at
-20˚C for 1 h. Then, 800 µl 10% (v/v) acetic acid solution was
added and incubated for 30 min at room temperature under gentle
agitation. All samples were collected with a cell scraper
(Sigma-Aldrich; Merck KGaA) and then embedded in low-viscosity
mineral oil. After polymerisation with heat for 10 min at 85˚C, the
samples were placed on ice for 5 min, followed by
ultracentrifugation at 4°C, 25,545 x g for 15 min. Then,
samples were transferred and incubated with 200 µl 10% ammonium
hydroxide/10% acetic acid (v/v) for 30 min at room temperature to
neutralise the acidification. Aliquots were read at 405 nm in a
microplate reader (Biotek ELx 800; BioTek Instruments, Inc.).
Scanning electron microscopy
(SEM)
The morphologies and dimensions of the crystals
formed in the experimental and control groups were examined with
SEM at 20 kV. The powder of matrix samples was glued to a
conductive adhesive supported on conventional copper cylinders and
covered with gold particles to observe their morphology and surface
roughness.
Briefly, cells were seeded in 24-well cell culture
plates at a density of 2x10⁵ cells/well. After 24 h, the
medium was changed to OM containing glucose and DHA at the
concentrations mentioned above, and incubation was continued for 21
days. Then, samples were fixed with 2% glutaraldehyde for 24 h at
4˚C, and subsequently washed with wash buffer [0.48 g sodium
phosphate monobasic and 2.84 g sodium phosphate dibasic in 100 ml
double-distilled water (ddH2O)]. Finally, cells were
dehydrated with a graded series of alcohol from 25 to 100% and
allowed to dry completely. Samples were covered with colloidal gold
before observation with SEM. The crystals formed were observed
under the microscope (Leica-Cambridge 440; Leica Microsystems,
Ltd.). The SEM analysis was performed at 20 kV for 300 sec, and
representative micrographs of each treatment were taken.
Protein expression in the mineralised
matrix Staining
The expression of collagen type 1 (Col1) was
determined by staining with Picro-Sirius Red, according to
Tullberg-Reinert and Jundt (26).
Briefly, cells were cultured in 24-well plates at a density of
8x10⁴ cells/ml until semi-confluence was reached. Cells
were distributed among experimental groups as described above and
cultured in OM for 7, 14 or 21 days. As a negative control for
mineralization, osteoblasts were cultured in DMEM-LG without
mineralizing medium. The mineral matrix was fixed with Bouin's
solution (saturated picric acid, formaldehyde, and acetic acid at a
ratio of 15:5:1) for 1 h at room temperature. The matrices were
stained with a 1:1 solution of Direct Red 80 (Sigma-Aldrich; Merck
KGaA) in a saturated solution of picric acid for 1 h at room
temperature. The staining solution was removed, and the cells were
washed three times with 0.1% acetic acid. Micrographs of each of
the treatments were taken with a Zeiss inverted microscope
(magnification, x10).
In-cell western assay
An in-cell western assay was performed to determine
the expression of osteocalcin (OCN). hFOB 1.19 cells were seeded at
a density of 2x10⁴ cells/well in 96-well plates until
semi-confluence was reached. The cells were distributed among
experimental groups as described above and cultured in OM for 7, 14
or 21 days. As a negative control for mineralization, osteoblasts
were cultured in DMEM-LG without mineralizing medium. The mineral
matrix was fixed with 70% ethanol at room temperature until
complete evaporation. Non-specific binding was blocked with 5%
bovine serum albumin (BSA; cat. no. BSA-BAF-100; Cientifica Senna
S.A. de C.V.) at room temperature for 90 min.
The matrices were first incubated with a goat
anti-OCN antibody (1:100; cat. no. sc-18319; Santa Cruz
Biotechnology, Inc.) diluted in Tris-buffered saline with 0.1%
Tween-20 (TBST; pH 7.6) overnight at 4˚C. The matrices were washed
three times for 10 min with TBST, and then incubated with the IRDye
680RD anti-goat IgG secondary antibody (1:500; cat. no. P/N:
926-68074 LI-COR Biosciences) for 1 h at room temperature.
Incubation with only the secondary antibody was used as a negative
control. The binding was visualised with an infrared scanner
(Odyssey CLx; LI-COR Biosciences). The mean fluorescence intensity
was quantified with ImageJ 1.50i software (National Institutes of
Health).
Western blotting
For the analysis of bone sialoprotein type II
(BSP-II) expression, cells were seeded in a 25 cm2
culture flask at 4x10⁵ and cultured until they reached
semi-confluence. The cells were distributed among the experimental
groups as described above and cultured in OM for 7, 14 or 21 days.
Cells and extracellular matrix in the culture flask were lysed with
3 ml lysis buffer (20 mM HEPES, 1 mM EGTA, 210 mM Mannitol and 70
mM sucrose, pH 7.2). The insoluble fraction was separated by
centrifugation at 4°C and 1,618 x g, and the soluble
proteins were quantified by using the Bradford method (27). A total of 2 µg soluble protein of
the mineral matrix was loaded per lane onto 10% acrylamide gels and
subjected to separation via sodium dodecyl sulphate-polyacrylamide
gel electrophoresis. The separated protein was transferred to a
nitrocellulose membrane. Unspecific binding was blocked with fat
free milk at 6% for 1 h at room temperature. The membrane was
incubated with rabbit anti-BSP-II (1:1,000; cat. no. sc-73634;
Santa Cruz Biotechnology, Inc.) overnight at 4˚C, followed by
incubation with the IRDye 800CW anti-rabbit IgG secondary antibody
(1:1,000; cat. no. P/N: 926-32211 LI-COR Biosciences) for 1 h at
room temperature. The binding was visualised with an infrared
scanner (Odyssey CLx; LI-COR Biosciences). BSP-II was detected at
an approximate weight of 80 kDa, and protein expression was
semi-quantified by image densitometry in ImageJ 1.50i software.
Ponceau red staining of an 80 kDa band was used as a loading
control (28).
ALP specific activity
hFOB 1.19 cells were plated at 1.5x10⁵
cells/well in 6-well plates with OM. The cells were distributed
among the experimental groups as described above and cultured for 7
or 14 days as ALP is an early mineralisation marker (29). After the incubation period, the
cell monolayer was lysed with 10 mM Tris-HCl and 0.1% Triton X-100,
pH 7.4. The proteins were separated using ultra-centrifugation
filters with a molecular weight cut-off of 100 kDa (Amicon Ultra;
MilliporeSigma). The enzymatic activity was evaluated in the
>100 kDa protein fraction as human bone-specific ALP has an
approximate weight of 140 kDa (30). The total protein was quantified
according to the modified method of Lowry (31). The enzymatic activity was evaluated
by using 24 µg/ml total protein with the QuantiChrom Alkaline
Phosphatase Assay Kit (DALP-250; cat. no. 75877-954 BioAssay
Systems), using 10 mM p-nitrophenyl phosphate (pNPP) as a substrate
in a solution with 5 mM magnesium acetate at pH 10.5. The samples
were read on a plate reader at 405 nm for three periods of 4 min
each.
Fourier-transform infrared
spectroscopy (FTIR)
The mineralised matrices were characterised by FTIR
(FT-IR Spectrum One; PerkinElmer, Inc.). The FTIR spectrum was
taken in the mid-IR region of 400-4,000 cm-1. The sample
was placed directly on the quartz surface, and the spectrum was
recorded in transmittance mode. The laser output power was ~108 mW,
and the system's spectral resolution was set to 4.0
cm-1. For each sample, three spectra were collected with
a distance of 10 µm between them, using 40 scans, totalling 54
spectra. The calculation of peak areas was performed with FTIR
Toolbox 3.5 (Operant LLC). The peak areas in the intervals of
900-1,200 cm-1 (ν1, ν3
PO43- phosphate, inorganic content),
1,600-1,700 cm-1 (amide I), 1,250-1,370 cm-1
(amide III) and 850-890 cm-1 (ν2
CO32-) as reported in the literature were
analysed to characterise changes in the bone mineral and organic
matrix (32).
To this end, 8x10⁴ cells were seeded in
12-well cell culture plates until they reached semi-confluence.
Cells were distributed among the experimental groups as described
above and cultured in OM for 21 days. The mineral matrix was fixed
with 70% ethanol at room temperature until complete evaporation.
The samples were sprayed and oriented in an infrared spectrometer
(FT-IR Spectrum One; PerkinElmer, Inc.), with 40 scans per sample.
The spectra were obtained as percent transmission and displacement
in cm-1. All histograms obtained were converted to
absorbance, and the double derivative was calculated and normalised
to the baseline with the essential software FTIR Toolbox 3.5
(Operant LLC). An integration analysis of the characteristic
displacement of each functional group was performed. The
substitution of carbonates was determined when calculating the
ratio of the bands ν2
CO32-/ν1, ν3
PO43 (850-890 cm-1/900-1,200
cm-1), and the relative mineralisation of organic matrix
was determined when calculating the radius between the bands of
amide I and III, which is characteristic of Col1, with phosphate
bands (900-1,200 cm-1/1,250-1,370 cm-1 and
900-1,200 cm-1/1,600-1,700 cm-1).
Receptor activator of nuclear factor
κ-Β ligand (RANK-L) detection
hFOB 1.19 cells were cultured at 1x10⁵
cells/well in a 12-well plate and incubated at 37˚C in 5%
CO2 in humidified air with DMEM without phenol red for
24 h. The cells were distributed among the experimental groups as
described above. Each condition was replicated three times. The
RANK-L content of the supernatants was assessed with a RANK-L
(total), soluble (human) ELISA kit (cat. no. ALX-850-019-KI01; Enzo
Life Sciences, Inc.) according to the technical specifications of
the manufacturer.
ROS detection
ROS were detected by using the fluorescent probe
2',7'-Dichlorofluorescein diacetate (H2DCFDA), which is
a ROS-sensitive dye. hFOB 1.19 cells were cultured at
1.5x10⁵ cells/well in a 12-well culture plate. As a
negative control, one of the wells was pre-treated with 30 µM
Trolox (an antioxidant;
(±)-6-Hydroxy-2,5,7,8-tetramethylchromane-2-carboxylic acid;
Sigma-Aldrich; Merck KGaA; cat. no. 238813) for 1 h at 37˚C.
Subsequently, the cells were treated with DMEM without phenol red
with 5.5 or 24 mM glucose, with or without 10 or 20 µM DHA, and
incubated for 24 h at 37˚C. Then, 30 min before the end of the
incubation, 30 mM hydrogen peroxide (H2O2)
was added to the corresponding groups. After incubation for 24 h,
H2DCFDA was added at a concentration of 15 µM and
incubated for 60 min at 37˚C. A flow cytometer (FACSCalibur;
Becton, Dickinson and Company) with the BD Cell Quest Pro v.5.1.1
software (BD Biosciences) was used to capture and quantify the
relative fluorescence intensity of 10,000 events. The obtained data
were analysed by using FlowJo 7.6 (FlowJo LLC).
Reverse transcription-quantitative PCR
(RT-qPCR) for NRF2
hFOB 1.19 cells were seeded at a density of
1.5x10⁵ cells/25 cm2 flask. Subsequently,
cells were cultured in phenol-red-free DMEM with 5.5 or 24 mM
glucose, with or without 10 or 20 µM DHA. Cell cultures were
maintained for a further 24 h or 7 days. Total RNA was extracted by
using the TRIzol® (Invitrogen; Thermo Fisher Scientific,
Inc.) method (33). RT was
performed by using a RevertAid RT Revert transcription kit (cat.
no. K1691; Thermo Fisher Scientific, Inc.), with 2 µg total RNA, 2
µg Oligo (dT)18 (cat. no. SO131; Thermo Fisher Scientific, Inc.), 1
mM dNTP Mix (10 mM each) (cat. no. R0191; Thermo Fisher Scientific,
Inc.), and 200 U RevertAid Reverse Transcriptase (cat. no. EP0441;
Thermo Fisher Scientific, Inc.). RT was performed for 60 min at
42˚C, and terminated at 70˚C for 10 min. To standardize the
alignment temperature, a number of cycles were run for each set of
primers.
qPCR was performed with the Maxima SYBR Green/ROX
qPCR Master Mix (cat. no. K0222; Thermo Fisher Scientific, Inc.)
under the following conditions: One cycle of initial denaturation
at 95˚C for 1 min; 30 cycles of denaturation at 95˚C for 30 sec,
annealing at 58.5˚C for 30 sec for NRF2 or 60˚C for 30 sec for 18S
ribosomal 5 (18S Rib) (Accesolab S.A de C.V, México), and extension
at 72˚C for 1 min; and one cycle of final extension at 72˚C for 10
min. The NRF2 primers (Accesolab S.A de C.V, México) used were as
follows: NRF2 forward (F), 5'-GGCTACGTTTCAGTCACTTG-3' and reverse
(R), 5'-AACTCAGGAATGGATAATAG-3' (Genbank, NM_001313904.1; product
size 180 pb). The 18S Rib was used as a housekeeping gene, the
primers were as follows: 18S Rib F, 5'-GGGAGCCTGAGAAACGGC-3' and R,
5'-GGGTCGGGAGTGGGTAATTT-3' (Genbank, NR_003286.2; product size 93
pb). Gene expression was calculated using the 2-ΔΔCq
method (34).
Statistical analysis
The data are presented as the mean values ± standard
deviation (SD) that were calculated from at least three biological
replicates with at least three internal repeats. The treatment
groups were analysed by using one-way analysis of variance (ANOVA)
followed by Tukey's post hoc test for multiple comparisons. All
analyses were performed in GraphPad Prism 6 software (GraphPad
Software, Inc.). P<0.05 was considered to indicate a
statistically significant difference.
Results
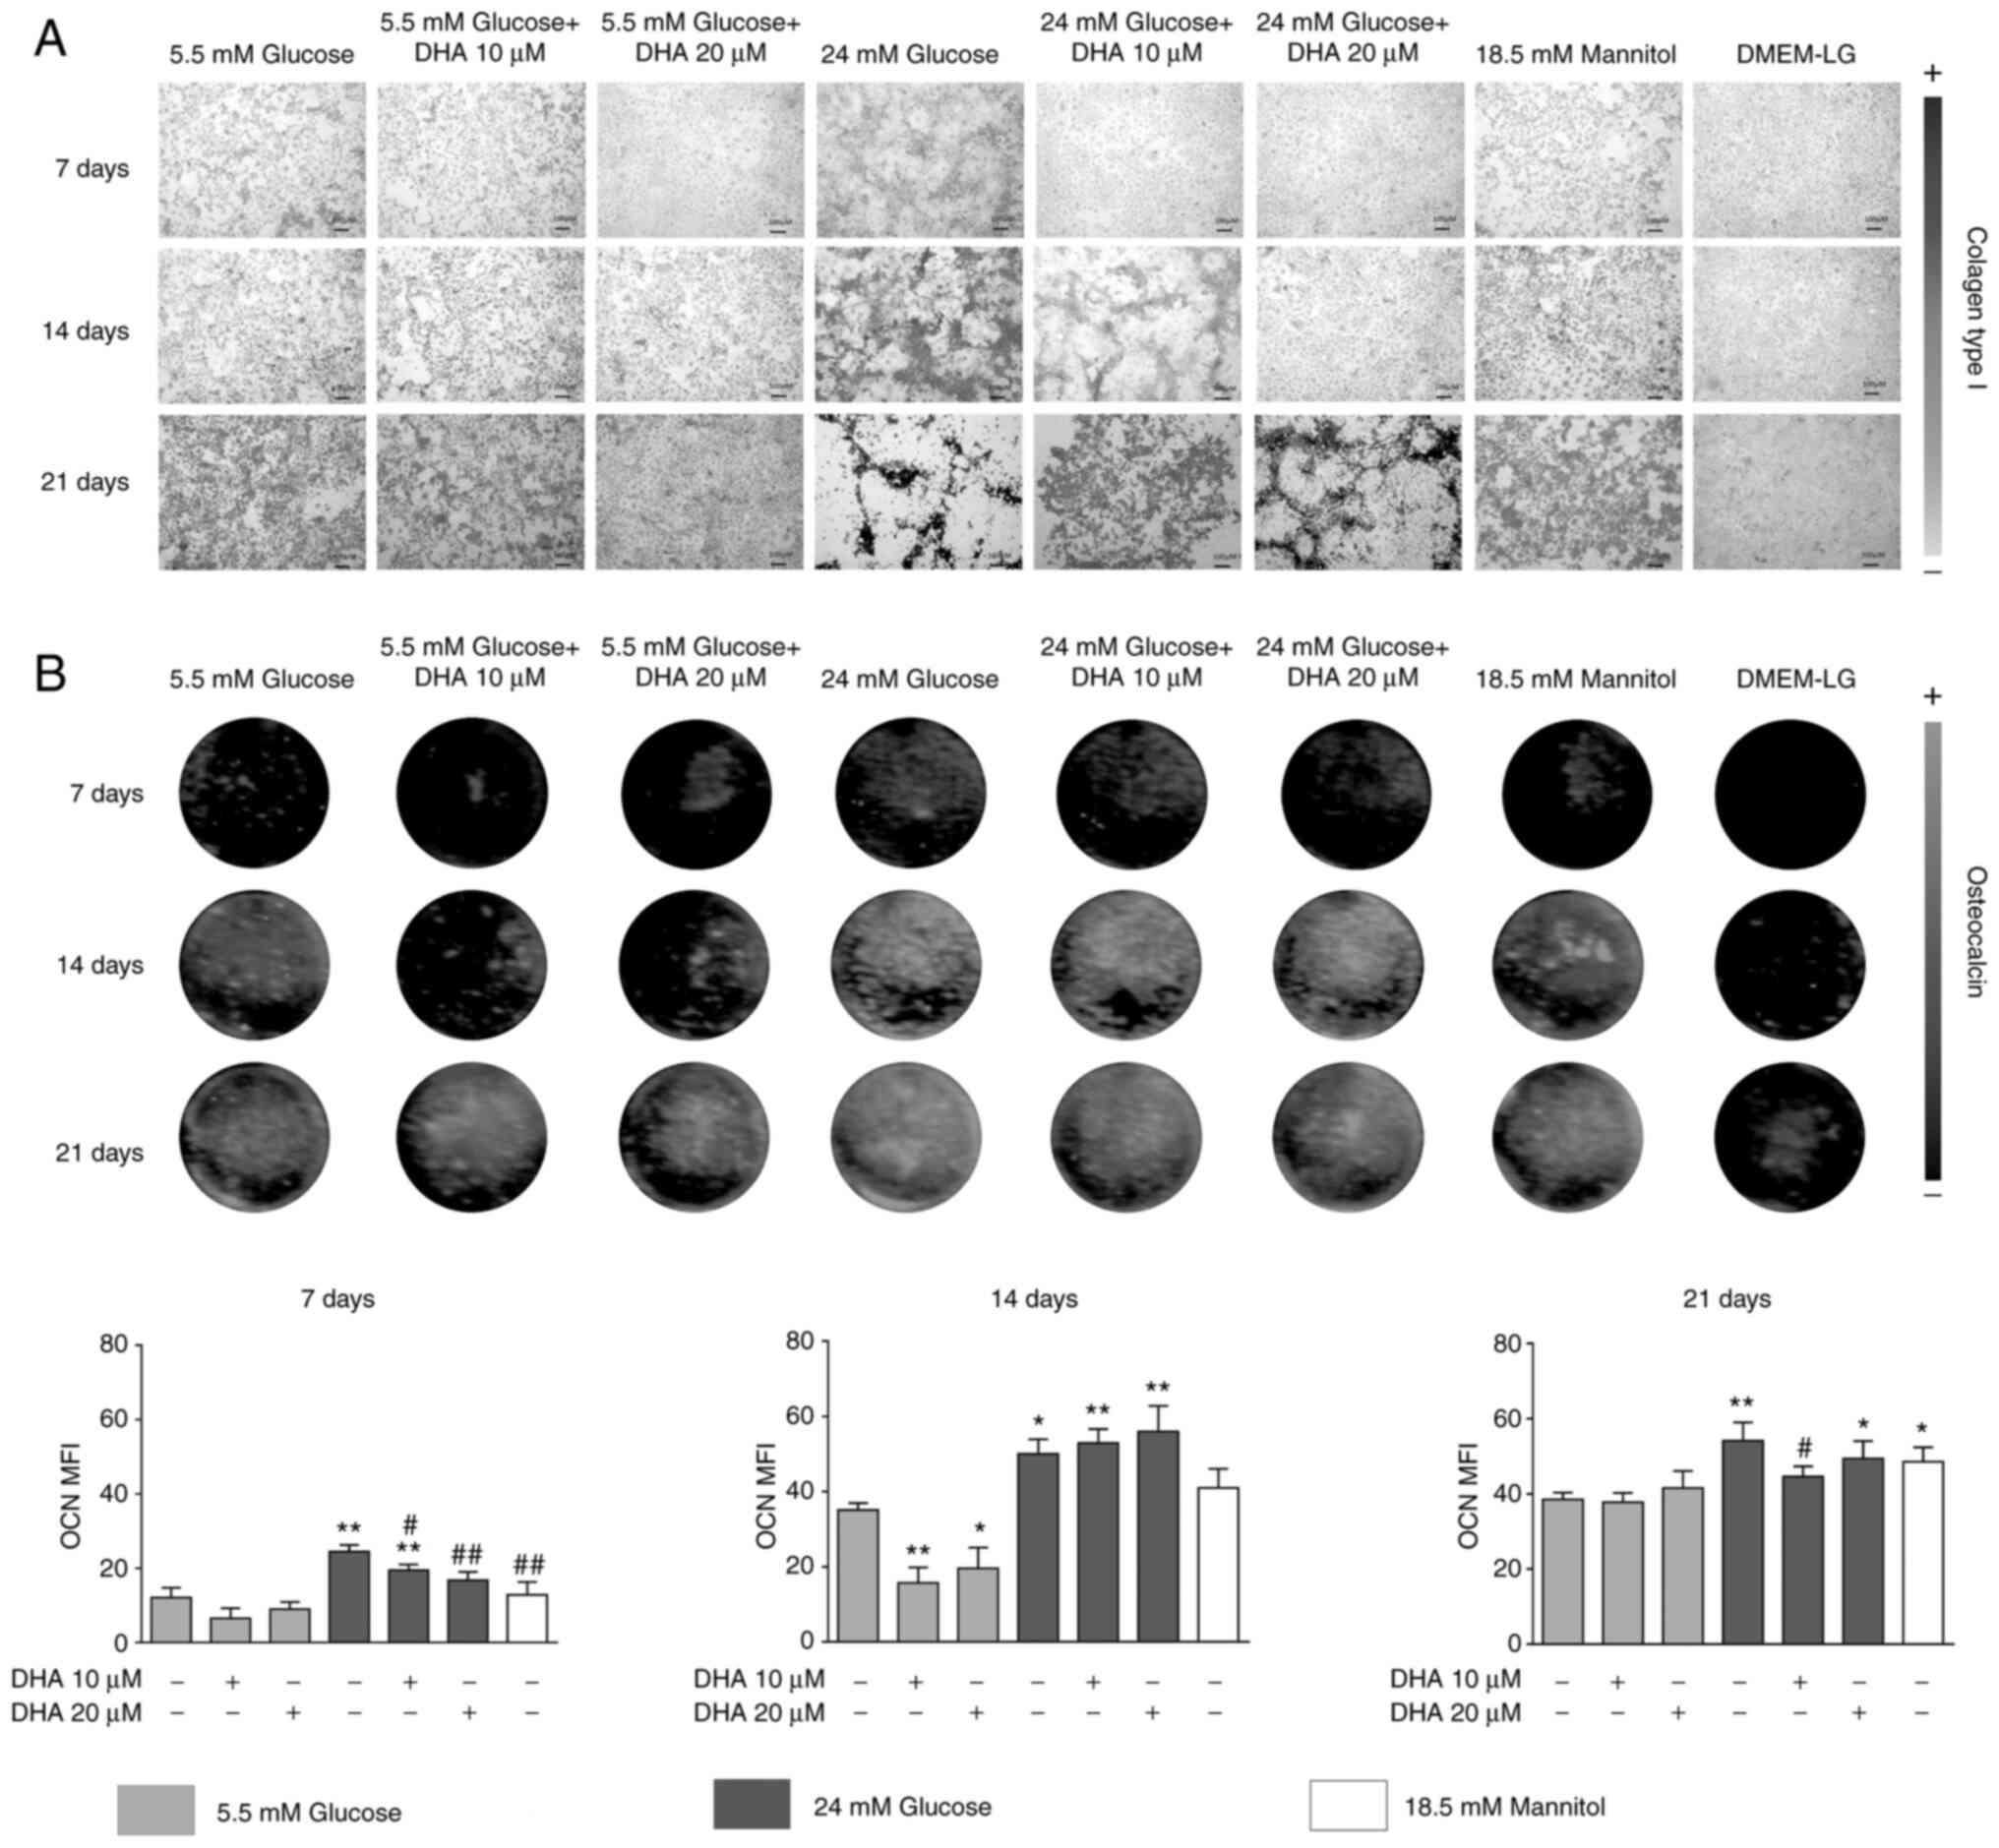
DHA restores the production of Col1,
OCN and BSP-II altered by HG
To determine the effect of DHA on the organic
components of the extracellular matrix under HG, an osteoblast cell
line was cultured in OM with NG or HG, with or without DHA, and the
production and distribution of mineral matrix proteins, Col1, OCN
and BSP-II after 7, 14 and 21 days of culture were evaluated.
In osteoblasts cultured in NG, collagen scaffolds
formed homogeneously, with linked small pores. Cells cultured in NG
and treated with either DHA concentration showed no change in the
production or distribution of Col1. HG increased the production and
altered the distribution of the Col1 scaffold; at day 21 of
culture, the collagen scaffold did not show interconnectivity.
Cells cultured in HG and treated with either DHA concentration
showed improved distribution, homogeneity, and interconnectivity of
the Col1 scaffold compared with HG alone. The iso-osmotic control
had a similar collagen scaffold to the NG control (Fig. 1A).
Osteoblasts cultured in NG presented increased OCN
production in a time-dependent manner. Cells cultured in NG and
treated with either DHA concentration showed significantly
decreased OCN production at day 14 compared with NG alone. Cells
cultured in HG had increased OCN expression. Cells cultured in HG
and treated with either DHA concentration presented significantly
increased OCN expression at days 7 and 14 compared with NG. At day
21 of culture, cells cultured in HG and treated with 20 µM DHA
showed significantly increased OCN expression compared with NG, but
10 µM DHA induced similar expression of OCN compared with NG. The
iso-osmotic control behaved similarly to the NG control regarding
OCN production (Fig. 1B).
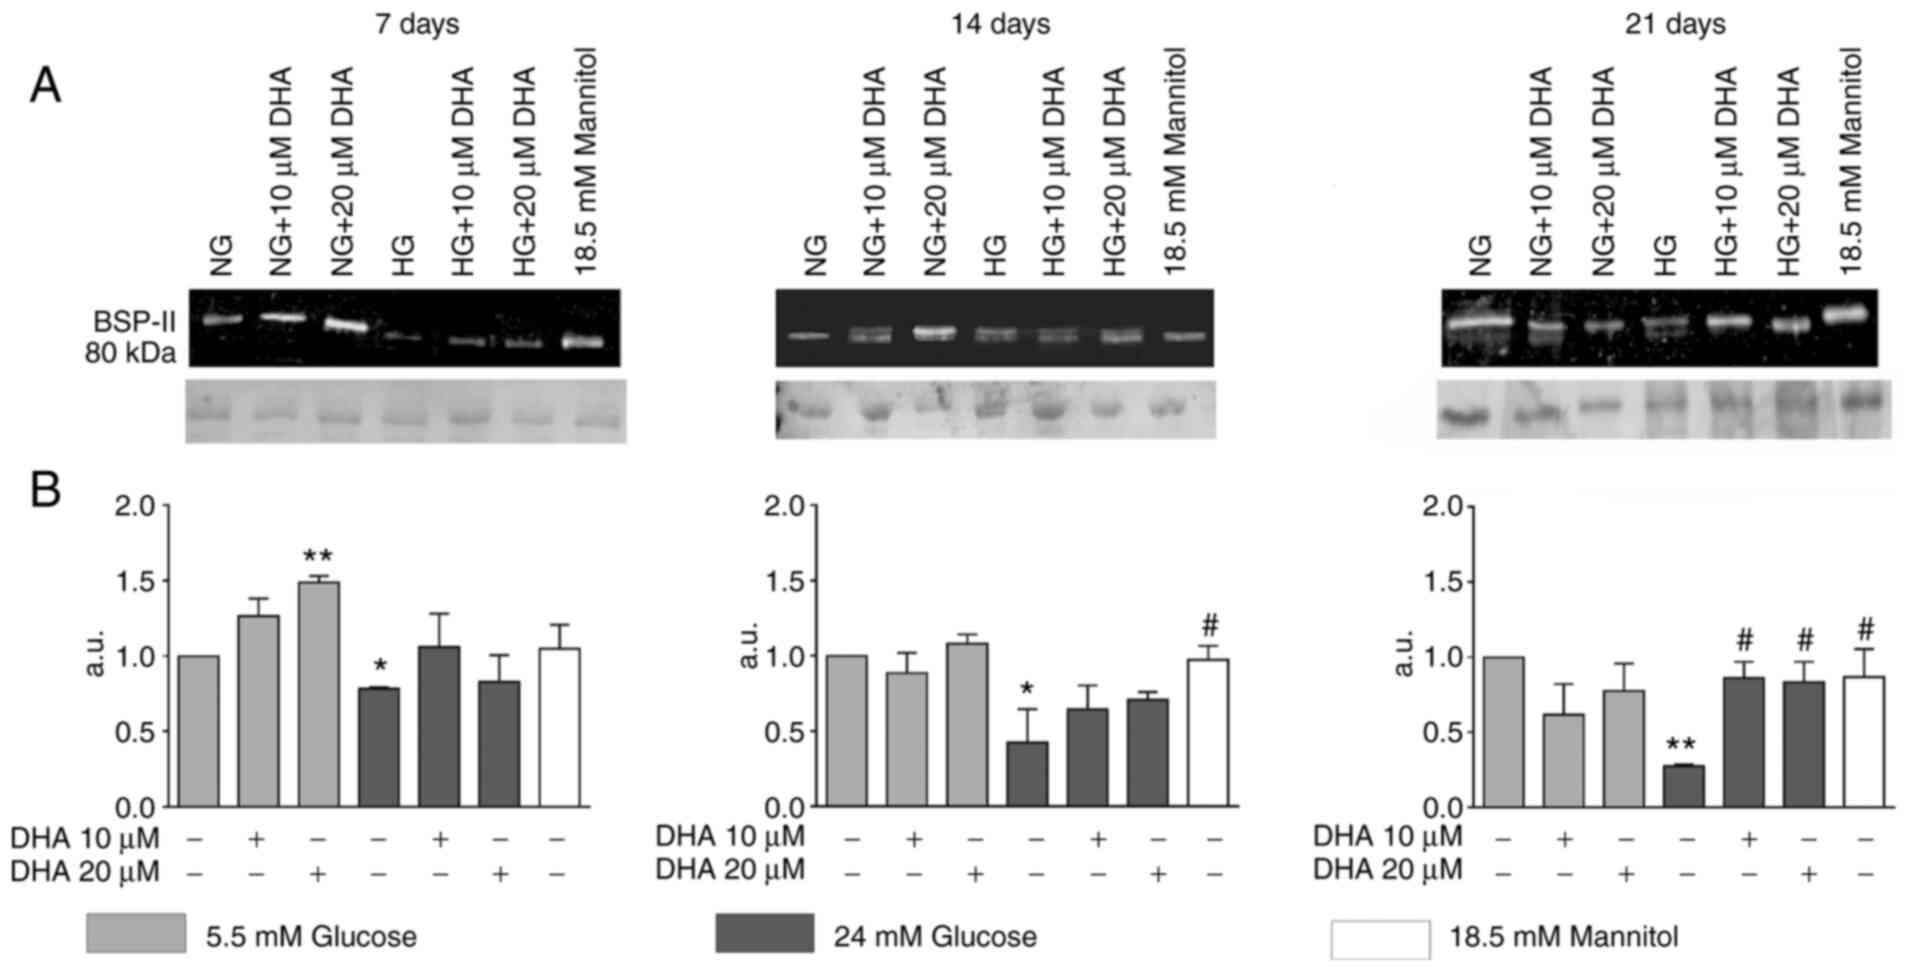
Cells cultured in NG and treated with 20 µM DHA
showed significantly increased BSP-II production at day 7 compared
with cells cultured in NG alone. Osteoblasts cultured in HG
presented significantly decreased BSP-II expression compared with
cells cultured in NG at days 7, 14 and 21. Cells cultured in HG and
treated with either DHA concentration showed BSP-II protein
expression that was like that of the NG control at days 7 and 14.
At day 21 of culture, these treatments increased BSP-II protein
expression compared with HG alone, but to an equivalent level as
NG. The iso-osmotic control behaved similarly to the NG control
(Fig. 2A and B).
DHA attenuates the increase in ALP
specific activity in the presence of HG
Cells cultured in NG with and without DHA treatment
showed similar levels of ALP specific activity at days 7 and 14.
Cells cultured in HG demonstrated a significant increase in ALP
activity compared with cells cultured in NG alone at days 7 and 14.
Osteoblasts cultured in HG and treated with either DNA
concentration exhibited significantly decreased ALP activity
compared with HG alone; the levels were similar to those of cells
cultured in NG at days 7 and 14. The iso-osmotic control behaved
similarly to the NG control (Fig.
3).
DHA decreases elevated mineral
formation and calcium in the presence of HG
Next, the formation and mineralisation of calcium
nodules was evaluated. Osteoblasts cultured in NG and treated with
10 µM DHA demonstrated a similar number and shape of mineralised
nodules as the NG group. Cells cultured in NG and treated with 20
µM DHA showed fewer mineralised nodules (Fig. 4A) and lower calcium concentration
(Fig. 4B) at days 14 and 21 but
increased mineral crystal size (Fig.
4C) at 21 days. The cells cultured in NG and treated with
either DHA concentration showed bone mineral crystals with a
nanoscale, needle-like shape (Fig.
4C). The iso-osmotic control behaved like the NG control
(Fig. 4A-C).
Osteoblasts cultured in HG had more mineralised
nodules (Fig. 4A) and increased
calcium concentration (Fig. 4B) at
days 14 and 21. As shown by SEM, the mineral crystals formed were
amorphous and disorganised in the extracellular matrix (Fig. 4C). Cells cultured in HG and treated
with either DHA concentration showed fewer mineralised nodules
(Fig. 4A) and lower calcium
concentration (Fig. 4B) at day 21
compared with cells cultured in HG alone and similar numbers to the
NG control (Fig. 4A and B). The mineral crystals formed for
cultures in HG with DHA treatment were amorphous and similar to the
cells cultured in HG alone but were more organised in mineralised
nodules (Fig. 4C). The iso-osmotic
control showed similar numbers and sizes of mineralised nodules as
the NG control (Fig. 4A-C).
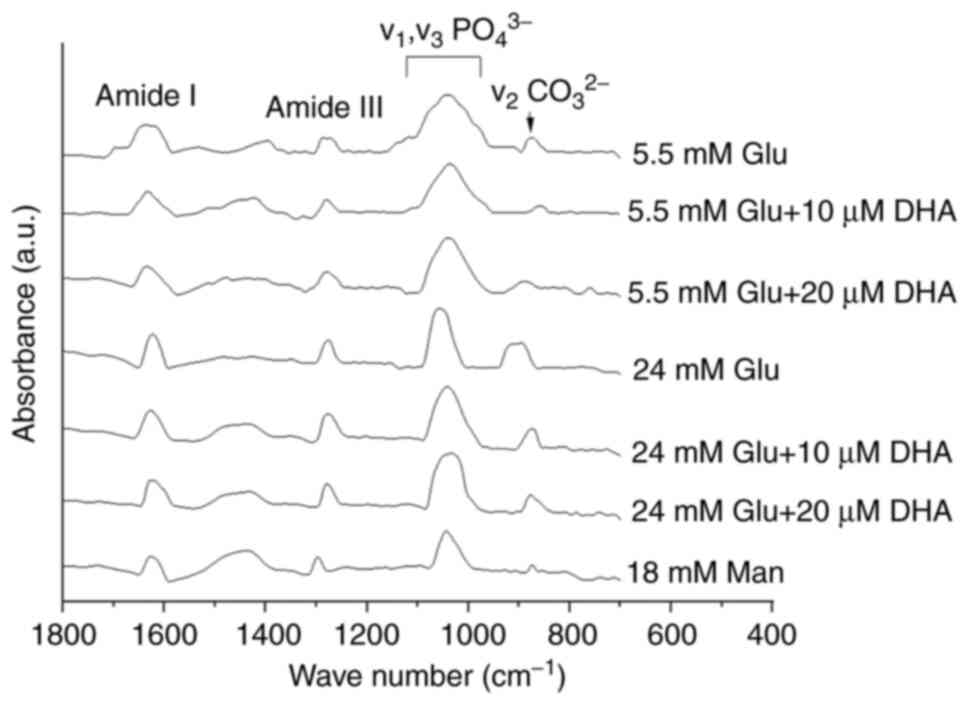
Treatment with DHA compensates for
carbonate substitution altered by HG
Due to the differences in collagen distribution,
calcium concentration and the shape of mineral crystals among
treatments, FTIR was used to measure the quality and chemical
composition of the minerals formed. The spectra obtained for cells
cultured in NG or HG with and without DHA treatment are shown in
Fig. 5. All samples showed a very
similar FTIR spectrum in terms of the peak positions and shapes.
All FTIR spectra showed absorption bands characteristic of
minerals, the peak phosphate group (v1, v3
PO43-) and the carbonate band
(v2CO32-) in the 900-1,0212
cm-1 range, and 854-892 cm-1 range,
respectively (Table I).
 | Table IFourier-transform infrared
spectroscopy absorption bands of mineral matrix. |
Table I
Fourier-transform infrared
spectroscopy absorption bands of mineral matrix.
| | Peak position
(cm-1) |
|---|
| Assignment | NG | NG + 10 µM DHA | NG + 20 µM DHA | HG | HG + 10 µM DHA | HG + 20 µM DHA | 18.5 mM
mannitol |
|---|
| Amide I
(1,599-1,701 cm-1) | 1,630 | 1,633 | 1,635 | 1,623 | 1,627 | 1,620 | 1,624 |
| Amide III
(1,250-1,371 cm-1) | 1,278 | 1,277 | 1,278 | 1,280 | 1,279 | 1,278 | 1,297 |
| ν1,
ν3 PO43- (900-1,212
cm-1) | 1,040 | 1,037 | 1,038 | 1,054 | 1,044 | 1,038 | 1,042 |
| ν2
CO32- (854-892 cm-1) | 875 | 860 | 887 | 894 | 874 | 876 | 875 |
The absorption bands characteristic of the organic
matrix were observed as spectral peaks within the amide I and III
groups from 1,620-1,635 cm-1 and from 1,277-1,280
cm-1, respectively (Table
I). Table II shows the
mineral/matrix ratio (v1, v3
PO43-/amide I; v1, v3
PO43-/amide III) and the carbonate/phosphate
ratio (v2 CO32-/v1,
v3 PO43-) and their comparison
among the groups. The mineral/matrix and carbonate/phosphate ratios
in the cells cultured in NG alone were very similar to those of the
cells cultured in NG and treated with DHA (Table II). For cells cultured in HG, the
mineral/matrix ratio was lower than cells cultured in NG and the
carbonate/phosphate ratio was higher than cells cultured in NG
(Table II). Osteoblasts cultured
in HG and treated with either DHA concentration showed a
mineral/matrix ratio like that of cells cultured in HG alone.
Still, the carbonate/phosphate ratio was more similar to the cells
cultured in NG alone rather than HG alone (Table II). The iso-osmotic group did not
show notable differences in the mineral/matrix and
carbonate/phosphate ratios compared with the NG control (Table II).
| Table IIRatio of mineral/matrix and
carbonate/phosphate. |
Table II
Ratio of mineral/matrix and
carbonate/phosphate.
| Ratio | NG | NG + 10 µM DHA | NG + 20 µM DHA | HG | HG + 10 µM DHA | HG + 20 µM DHA | 18.5 mM
mannitol |
|---|
| ν1,
ν3 PO43-/Amide I | 2.33 | 1.96 | 1.66 | 1.50 | 1.52 | 1.87 | 1.71 |
| ν1,
ν3 PO43-/Amide III | 3.76 | 3.26 | 1.98 | 1.75 | 1.72 | 2.61 | 2.46 |
| ν2
CO32-/ν1, ν3
PO43- | 0.83 | 0.92 | 0.75 | 1.42 | 0.85 | 0.91 | 0.88 |
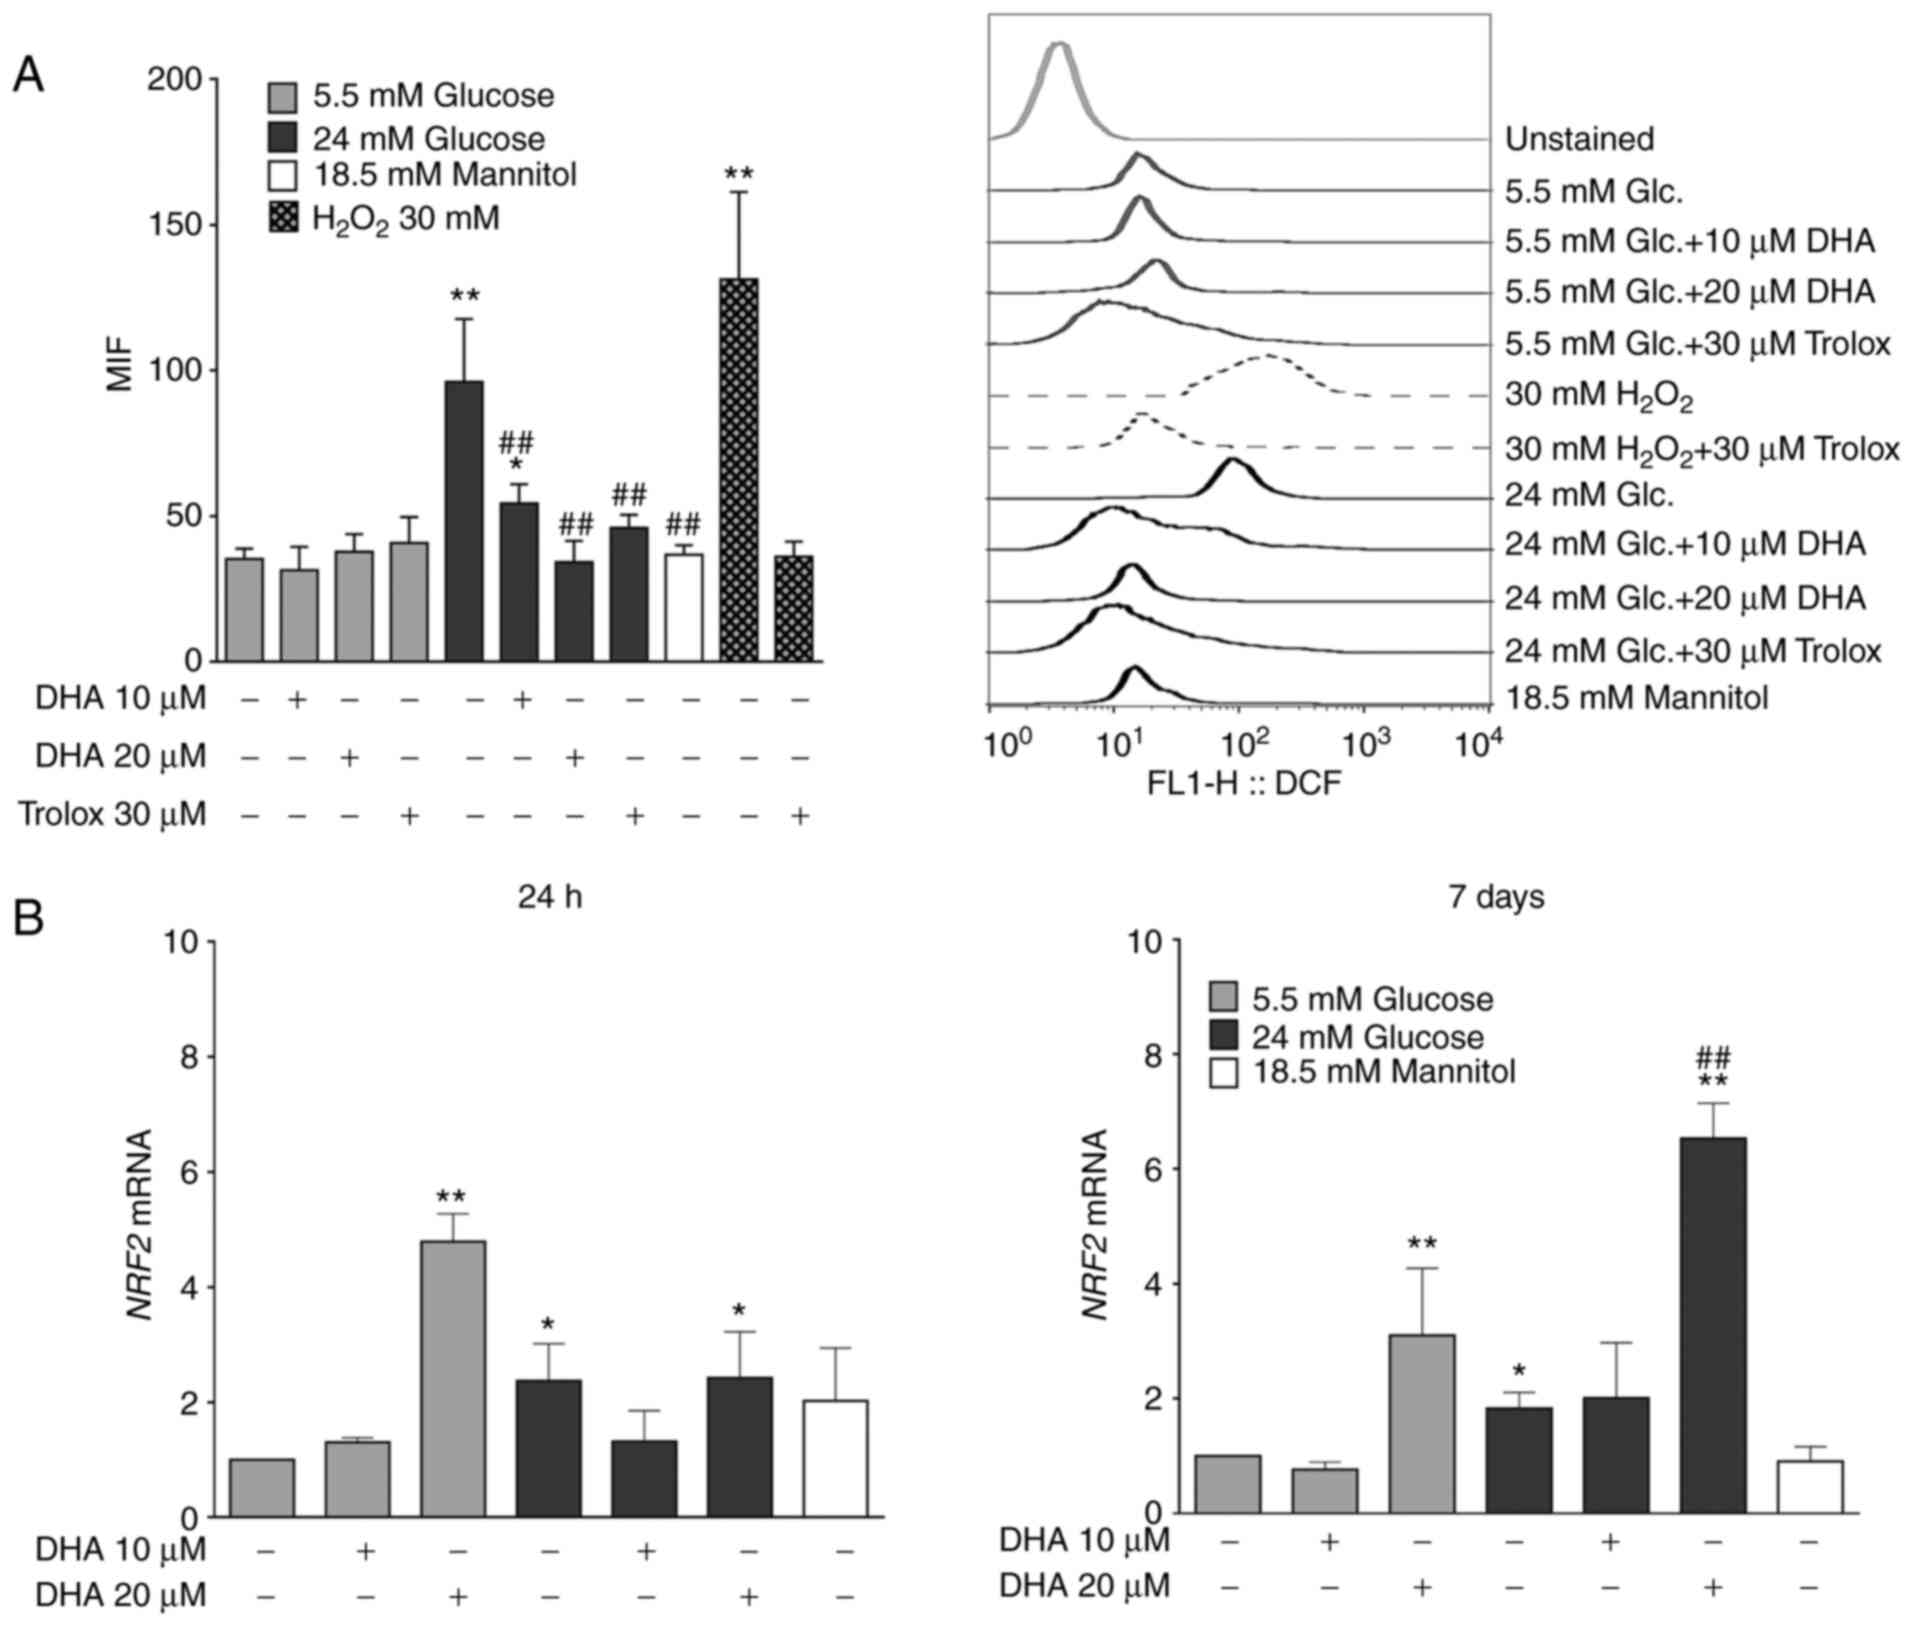
Treatment with DHA reduces ROS
overproduction induced by HG
ROS are critical mediators in the pathogenesis of
bone pathologies (35). To
determine whether the antioxidant properties of DHA underlie its
ability to counteract the bone mineralisation alterations caused by
HG, ROS production was measured. Osteoblasts cultured in NG and
treated with DHA or Trolox showed similar ROS production compared
with cells cultured in NG alone. Osteoblasts cultured in HG alone
showed significantly increased ROS production compared with cells
cultured in NG alone. However, cells cultured in HG and treated
with either DHA concentration showed significantly decreased ROS
production compared with cells cultured in HG alone, similarly to
the cells cultured in HG and treated with Trolox. The iso-osmotic
control did not show changes in ROS production (Fig. 6A). The osteoblasts had the capacity
to overproduce ROS, evidenced by the positive control group for ROS
production (30 mM H2O2) and the antioxidant
Trolox inhibited this overproduction (Fig. 6A).
Treatment of DHA increases NRF2 mRNA
expression in NG and HG
It was next speculated whether the inhibition of ROS
production by DHA in the presence of HG could be due to the
expression of NRF2, a master transcription factor related to
cytoprotective genes against oxidative and chemical insults
(36). Osteoblasts cultured in NG
and treated with 20 µM DHA showed significantly elevated NRF2 mRNA
expression compared with cells cultured in NG alone for 24 h or 7
days. Osteoblasts cultured in HG alone showed significantly
increased NRF2 mRNA expression compared with cells cultured in NG
alone, but these levels were less than those observed in cells
cultured in NG and treated with 20 µM DHA for 24 h or 7 days.
Although osteoblasts cultured in HG and treated with
20 µM DHA exhibited significantly increased NRF2 mRNA after 24 h
compared with cells cultured in NG alone, these levels were similar
to those of osteoblasts cultured in HG alone. However, after 7
days, osteoblasts cultured in HG and treated with 20 µM DHA showed
significantly more NRF2 mRNA than cells cultured in NG or HG alone.
The level of NRF2 mRNA in the iso-osmotic control was similar to
the NG group (Fig. 6B).
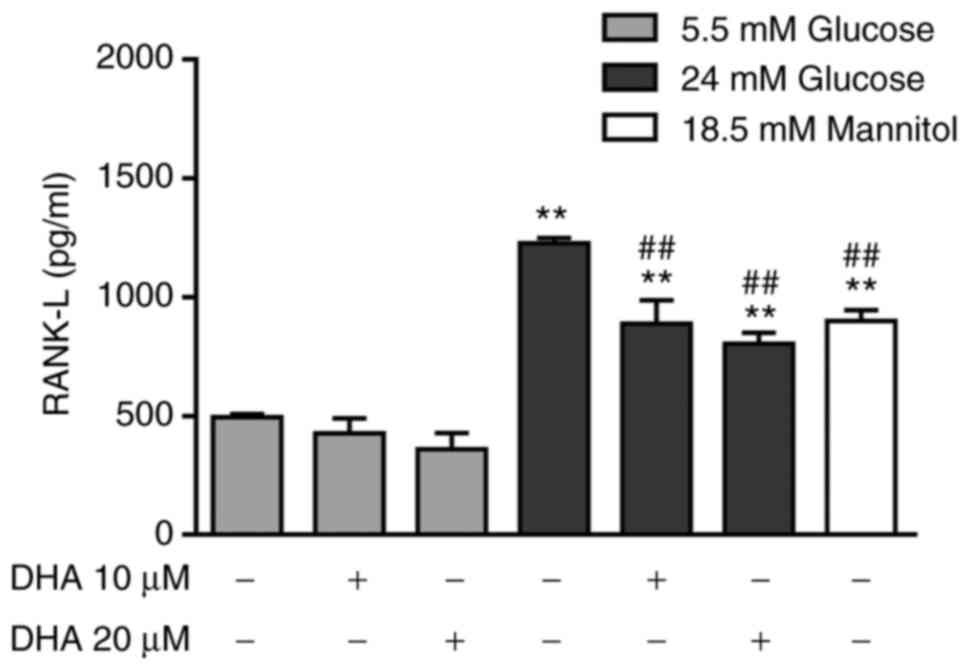
Treatment with DHA combined with HG
partially decreases the extracellular concentration of RANK-L
To determine the indirect effect of DHA on
osteoclastogenesis, RANK-L production was measured. Osteoblasts
cultured in NG and treated with either DHA concentration expressed
similar RANK-L levels to cells cultured in NG alone. Osteoblasts
cultured in HG alone showed a significant increase in RANK-L
compared with cells cultured in NG alone or with DHA treatment.
Osteoblasts cultured in HG and treated with either DHA
concentration exhibited significantly decreased RANK-L expression
compared with cells treated with HG alone, but these levels were
higher than those of cells cultured in NG alone or treated with
DHA. The iso-osmotic control increased RANK-L production compared
with NG, but the RANK-L level was lower than that seen in cells
cultured in HG (Fig. 7).
Discussion
We previously observed that HG decreases the quality
of hydroxyapatite (HAP) crystals in inorganic bone matrix (8), induces oxidative stress (9) and increases RANK-L production
(8), and to the best of our
knowledge the present study was the first to show the effect of DHA
and the possible mechanisms by which it counteracts alterations
caused by HG in mineralisation and oxidative stress of an
osteoblast cell line. It was found that the addition of DHA in the
presence of NG did not affect mineralisation of osteoblasts. This
finding is contrary to the report by Coetzee et al (22), who demonstrated that DHA increases
mineral deposition in vitro. However, the current findings
are similar to a report that DHA does not affect osteoblast
differentiation and metabolism in vitro (37). The differences in the effects of
DHA on osteoblast mineralisation in vitro could be due to
the cell line used as well as the concentration and time of
administration of this omega-3 fatty acid.
In the present study, HG increased calcium
deposition at days 14 and 21 of culture (Fig. 4B), which is likely due to a
combination of hyperosmotic stress and glucose. Still, only HG
decreased the quality of the mineral deposit by osteoblasts,
evidenced by an increase in the carbonate/phosphate ratio (Table II) (32). The decreased BSP-II expression in
osteoblasts cultured in HG (Fig.
2) may be due to the inhibition of HAP crystal enucleation.
Consequently, HG causes an accumulation of calcium phosphate and
hyper-calcification of the extracellular matrix, but the HAP
crystals are less pure and, consequently, more fragile.
The high strength and fracture toughness in the bone
matrix are also due to the collagen scaffold. HG increased the
concentration and disordered distribution of Col1 (Fig. 1A). Cunha et al (38) also reported that HG induces an
excess of organic matrix in bone. High collagen production
associated with disorganised deposition could be a consequence of
nonenzymatic glycation (39). The
formation of advanced glycation end products is associated with
changes in bone microarchitecture, which, together with the
decrease in mineral bone quality, could trigger fragile bones and
increase the risk of fracture, as observed in patients with DM2
(40,41).
HG induces oxidative stress in osteoblasts (9). Consistently, the current study
observed that HG increased ROS production (Fig. 6A). Previous reports have proposed
that oxidative stress mediated by the phosphoinositide 3-kinase
(PI3K)/Akt pathway may be one of the main causes of alterations in
biomineralization, osteoblast metabolism and bone remodelling
(9,42), as was observed in the present study
in the synthesis of OCN (Fig. 1B
and C), ALP specific activity
(Fig. 3), BSP-II expression
(Fig. 2) and HAP crystal formation
and quality (Figs. 4 and 5).
Culturing hFOB 1.19 cells in HG and treating with
DHA improved the distribution of Col1 protein and increased its
concentration in the scaffold formation (Fig. 1A). A previous report indicated that
DHA has anabolic effects on the formation of the extracellular
matrix (20). The improved
distribution of Col1 mediated by DHA could be related to a decrease
in collagen glycation.
Of note, DHA treatment in cells cultured in HG
showed promising effects; it normalised calcification, HAP crystal
quality, ALP activity, and OCN, BSP-II and Col1 expression
(Fig. 1, Fig. 2, Fig.
3, Fig. 4 and Fig. 5 and Table II). These effects may be
associated with the reported effects of omega-3 fatty acids on
enhancing ALP gene expression by decreasing prostaglandin E2
(PGE2) production through an as yet undetermined
mechanism (20). Curiously, in the
current study cells cultured in HG and treated with 20 µM DHA
showed a time-dependent increase in ALP activity, which may be
reflected in a slower or a slightly delayed mineralisation that
allows correct formation of bone matrix with the proper proportion
of HAP crystals in the organic and inorganic mineral matrices.
Sharma et al (43) proposed that omega-3 fatty acids
could negatively regulate abnormal microcalcification by modulating
PI3K/AKT/extracellular signal-regulated kinase (ERK) signalling to
inhibit expression of osteoblastic transcription factors RUNX2,
osterix and Msx2, which could be upregulated by bone morphogenetic
protein 2(43). These fatty acids
could also help in bone preservation and reduce the risk of
osteoporosis by increasing AKT, mitogen-activated protein kinase
and ERK signalling in osteoblasts to increase the differentiation
and calcification of bone (44).
The observations of the present study demonstrated
that culturing osteoblasts in HG and treating them with DHA
improved the mineral matrix synthesis and their organic matrix
components. Moreover, regarding relative mineralisation, which is
related to bone strength and mineral distribution, DHA promoted
homogeneous mineralisation of the osteoblast matrix (Fig. 4A) and a decrease in the
carbonate/phosphate ratio, indicating an increase in the HAP
crystal quality (Fig. 5C). To the
best of our knowledge, this is the first report of the effect of
DHA on the quality of HAP crystals formed by osteoblasts cultured
in HG. The effect of DHA on biomineralization of osteoblasts
cultured in HG could be related to its antioxidant effects. HG
induces oxidative stress in rat primary osteoblasts as one of the
main causes of altered biomineralization, osteoblast metabolism and
bone remodelling (9,42). DHA has antioxidant effects in
vascular endothelial cells under the stimulus of IL-1α (45). In addition, Richard et al
(12) reported that omega-3 fatty
acids could trap free radicals.
For the first time, the current study observed the
DHA-mediated inhibition of HG-induced ROS production as an
antioxidant effect in an osteoblast cell line (Fig. 6A). This mechanism possibly involves
activating the NRF2/HO-1 antioxidant pathway. Of note, DNA
activates this pathway in EA.hy926 cells (14). The ROS reduction that was observed
in the present study following DHA treatment could be mediated via
the NRF2 pathway as DHA increased NRF2 expression, which had been
reduced due to HG (Fig. 6). It
should be noted that the effects of DHA on the expression of NRF2
seem to be dependent on its concentration; 20 µM DHA increased NRF2
expression more in either NG or HG, whereas the effect of 10 µM DHA
was not as notable.
DHA is a potent inhibitor of osteoclast
differentiation in RAW 264.7 cells (46). Therefore, RANK-L production after
DHA treatment was analysed. It was found that the effect of HG on
RANK-L production is a combination of HG and hyperosmolarity,
because the iso-osmotic control (18.5 mM Man) also increased RANK-L
production (Fig. 7). Adding DHA to
osteoblasts cultured in HG decreased RANK-L overproduction
(Fig. 7). This effect may be due
to the anti-inflammatory effects of this fatty acid, as have been
reported in MC3T3-E1/4 osteoblasts cultured with PGE2
(47). Therefore, DHA may decrease
osteoclastogenesis and bone resorption in the presence of HG.
In conclusion, treatment with 20 µM DHA counteracted
the adverse effects of HG in the organic and inorganic bone mineral
matrix and improved the quality of the crystals, likely by
decreasing oxidative stress and increasing the expression of NRF2
in human osteoblasts. It is important to continue studying the
antioxidant mechanisms of DHA in osteoblasts cultured in HG. These
results suggested that DHA could be used as an adjuvant treatment
for diabetic osteopathy. Experiments involving animal models of
DM2, and clinical trials are necessary to investigate this
possibility in more detail.
Acknowledgements
The authors would like to acknowledge Dr Maria
Cristina Zorrilla Cangas (Advanced Materials Laboratory, Physics
Institute, National Autonomous University of Mexico) for her
assistance and technical support in scanning electron microscopy
and Dr Marco Antonio Alvarez Perez (Bioengineering Laboratory,
Dentistry Faculty, National Autonomous University of Mexico) for
providing the fourier-transform infrared spectroscopy
equipment.
Funding
Funding: This study was supported by Programa de Apoyo a
Proyectos de Investigación Tecnológica/Dirección General de Asuntos
del Personal Académico/Universidad Nacional Autónoma de México
(PAPIIT/DGAPA/UNAM; grant no. IN223619).
Availability of data and materials
The datasets used and/or analyzed during the current
study are available from the corresponding author on reasonable
request.
Authors' contributions
LMF and ALGH conceived and designed the study. SECM,
ALGH and PGA acquired the data. LMF, SECM, ALGH and PGA were
responsible for the analysis and interpretation of data. LMF, SECM,
ALGH and PGA drafted the manuscript. SECM and ALGH confirm the
authenticity of all the raw data. All authors have read and
approved the final manuscript.
Ethics approval and consent to
participate
Not applicable.
Patient consent for publication
Not applicable.
Competing interests
The authors declare that they have no competing
interests.
References
|
1
|
Kerner W and Brückel J: German Diabetes
Association. Definition, classification and diagnosis of diabetes
mellitus. Exp Clin Endocrinol Diabetes. 122:384–386.
2014.PubMed/NCBI View Article : Google Scholar
|
|
2
|
International Diabetes Federation: IDF
diabetes atlas eighth edition, 2017.
|
|
3
|
Farr JN and Khosla S: Determinants of bone
strength and quality in diabetes mellitus in humans. Bone.
82:28–34. 2016.PubMed/NCBI View Article : Google Scholar
|
|
4
|
Carnevale V, Romagnoli E, D'Erasmo L and
D'Erasmo E: Bone damage in type 2 diabetes mellitus. Nutr Metab
Cardiovasc Dis. 24:1151–1157. 2014.PubMed/NCBI View Article : Google Scholar
|
|
5
|
Hofbauer LC, Brueck CC, Singh SK and
Dobnig H: Osteoporosis in patients with diabetes mellitus. J Bone
Miner Res. 22:1317–1328. 2007.PubMed/NCBI View Article : Google Scholar
|
|
6
|
Hamann C, Kirschner S, Günther KP and
Hofbauer LC: Bone, sweet bone-osteoporotic fractures in diabetes
mellitus. Nat Rev Endocrinol. 8:297–305. 2012.PubMed/NCBI View Article : Google Scholar
|
|
7
|
Bonds DE, Larson JC, Schwartz AV,
Strotmeyer ES, Robbins J, Rodriguez BL, Johnson KC and Margolis KL:
Risk of fracture in women with type 2 diabetes: The women's health
initiative observational study. J Clin Endocrinol Metab.
91:3404–1310. 2006.PubMed/NCBI View Article : Google Scholar
|
|
8
|
García-Hernández A, Arzate H,
Gil-Chavarría I, Rojo R and Moreno-Fierros L: High glucose
concentrations alter the biomineralization process in human
osteoblastic cells. Bone. 50:276–288. 2012.PubMed/NCBI View Article : Google Scholar
|
|
9
|
Zhang Y and Yang JH: Activation of the
PI3K/Akt pathway by oxidative stress mediates high glucose-induced
increase of adipogenic differentiation in primary rat osteoblasts.
J Cell Biochem. 114:2595–2602. 2013.PubMed/NCBI View Article : Google Scholar
|
|
10
|
Arai M, Shibata Y, Pugdee K, Abiko Y and
Ogata Y: Effects of reactive oxygen species (ROS) on antioxidant
system and osteoblastic differentiation in MC3T3-E1 cells. IUBMB
Life. 59:27–33. 2007.PubMed/NCBI View Article : Google Scholar
|
|
11
|
Bai XC, Lu D, Bai J, Zheng H, Ke ZY, Li XM
and Luo SQ: Oxidative stress inhibits osteoblastic differentiation
of bone cells by ERK and NF-kappaB. Biochem Biophys Res Commun.
314:197–207. 2004.PubMed/NCBI View Article : Google Scholar
|
|
12
|
Richard D, Kefi K, Barbe U, Bausero P and
Visioli F: Polyunsaturated fatty acids as antioxidants. Pharmacol
Res. 57:451–455. 2008.PubMed/NCBI View Article : Google Scholar
|
|
13
|
Rotstein NP, Politi LE, German OL and
Girotti R: Protective effect of docosahexaenoic acid on oxidative
stress-induced apoptosis of retina photoreceptors. Invest
Ophthalmol Vis Sci. 44:2252–2259. 2003.PubMed/NCBI View Article : Google Scholar
|
|
14
|
Yang YC, Lii CK, Wei YL, Li CC, Lu CY, Liu
KL and Chen HW: Docosahexaenoic acid inhibition of inflammation is
partially via cross-talk between Nrf2/heme oxygenase 1 and
IKK/NF-κB pathways. J Nutr Biochem. 24:204–212. 2013.PubMed/NCBI View Article : Google Scholar
|
|
15
|
Darlington LG and Stone TW: Antioxidants
and fatty acids in the amelioration of rheumatoid arthritis and
related disorders. Br J Nutr. 85:251–269. 2001.PubMed/NCBI View Article : Google Scholar
|
|
16
|
Högström M, Nordström P and Nordström A:
n-3 Fatty acids are positively associated with peak bone mineral
density and bone accrual in healthy men: The NO2 study. Am J Clin
Nutr. 85:803–807. 2007.PubMed/NCBI View Article : Google Scholar
|
|
17
|
Fallon EM, Nazarian A, Nehra D, Pan AH,
O'Loughlin AA, Nose V and Puder M: The effect of docosahexaenoic
acid on bone microstructure in young mice and bone fracture in
neonates. J Surg Res. 191:148–155. 2014.PubMed/NCBI View Article : Google Scholar
|
|
18
|
Farahnak Z, Freundorfer MT, Lavery P and
Weiler HA: Dietary docosahexaenoic acid contributes to increased
bone mineral accretion and strength in young female sprague-dawley
rats. Prostaglandins Leukot Essent Fatty Acids. 144:32–39.
2019.PubMed/NCBI View Article : Google Scholar
|
|
19
|
Atkinson TG, Barker HJ and Meckling-Gill
KA: Incorporation of long-chain n-3 fatty acids in tissues and
enhanced bone marrow cellularity with docosahexaenoic acid feeding
in post-weanling fischer 344 rats. Lipids. 32:293–302.
1997.PubMed/NCBI View Article : Google Scholar
|
|
20
|
Watkins BA, Li Y, Lippman HE and Feng S:
Modulatory effect of omega-3 polyunsaturated fatty acids on
osteoblast function and bone metabolism. Prostaglandins Leukot
Essent Fatty Acids. 68:387–398. 2003.PubMed/NCBI View Article : Google Scholar
|
|
21
|
Kim HJ, Ohk B, Yoon HJ, Kang WY, Seong SJ,
Kim SY and Yoon YR: Docosahexaenoic acid signaling attenuates the
proliferation and differentiation of bone marrow-derived osteoclast
precursors and promotes apoptosis in mature osteoclasts. Cell
Signal. 29:226–232. 2017.PubMed/NCBI View Article : Google Scholar
|
|
22
|
Coetzee M, Haag M and Kruger MC: Effects
of arachidonic acid and docosahexaenoic acid on differentiation and
mineralization of MC3T3-E1 osteoblast-like cells. Cell Biochem
Funct. 27:3–11. 2009.PubMed/NCBI View Article : Google Scholar
|
|
23
|
Moskot M, Jakóbkiewicz-Banecka J, Kloska
A, Piotrowska E, Narajczyk M and Gabig-Cimińska M: The role of
dimethyl sulfoxide (DMSO) in gene expression modulation and
glycosaminoglycan metabolism in lysosomal storage disorders on an
example of mucopolysaccharidosis. Int J Mol Sci.
20(304)2019.PubMed/NCBI View Article : Google Scholar
|
|
24
|
Maurin AC, Chavassieux PM, Vericel E and
Meunier PJ: Role of polyunsaturated fatty acids in the inhibitory
effect of human adipocytes on osteoblastic proliferation. Bone.
31:260–266. 2002.PubMed/NCBI View Article : Google Scholar
|
|
25
|
Gregory CA, Gunn WG, Peister A and Prockop
DJ: An Alizarin red-based assay of mineralization by adherent cells
in culture: Comparison with cetylpyridinium chloride extraction.
Anal Biochem. 329:77–84. 2004.PubMed/NCBI View Article : Google Scholar
|
|
26
|
Tullberg-Reinert H and Jundt G: In situ
measurement of collagen synthesis by human bone cells with a sirius
red-based colorimetric microassay: Effects of transforming growth
factor beta2 and ascorbic acid 2-phosphate. Histochem Cell Biol.
112:271–276. 1999.PubMed/NCBI View Article : Google Scholar
|
|
27
|
Bradford MM: A rapid and sensitive method
for the quantitation of microgram quantities of protein utilizing
the principle of protein-dye binding. Anal Biochem. 72:248–254.
1976.PubMed/NCBI View Article : Google Scholar
|
|
28
|
Romero-Calvo I, Ocón B, Martínez-Moya P,
Suárez MD, Zarzuelo A, Martínez-Augustin O and de Medina FS:
Reversible ponceau staining as a loading control alternative to
actin in western blots. Anal Biochem. 401:318–320. 2010.PubMed/NCBI View Article : Google Scholar
|
|
29
|
Wrobel E, Leszczynska J and Brzoska E: The
characteristics of human bone-derived cells (HBDCS) during
osteogenesis in vitro. Cell Mol Biol Lett. 21(26)2016.PubMed/NCBI View Article : Google Scholar
|
|
30
|
Bourrat C, Radisson J, Chavassieux P,
Azzar G, Roux B and Meunier PJ: Activity increase after extraction
of alkaline phosphatase from human osteoblastic membranes by
nonionic detergents: Influence of age and sex. Calcif Tissue Int.
66:22–28. 2000.PubMed/NCBI View Article : Google Scholar
|
|
31
|
Buell MV, Lowry OH, Roberts NR, Chang ML
and Kapphahn JI: The quantitative histochemistry of the brain. V.
Enzymes of glucose metabolism. J Biol Chem. 232:979–993.
1958.PubMed/NCBI
|
|
32
|
Figueiredo MM, Gamelas JAF and Martins AG:
Characterization of bone and bone-based graft materials using FTIR
spectroscopy. In: Infrared Spectroscopy-Life and Biomedical
Sciences, Theophile T (ed). IntechOpen, 2012.
|
|
33
|
Rio DC, Ares M Jr, Hannon GJ and Nilsen
TW: Purification of RNA using TRIzol (TRI reagent). Cold Spring
Harb Protoc. 2010(pdb.prot5439)2010.PubMed/NCBI View Article : Google Scholar
|
|
34
|
Livak KJ and Schmittgen TD: Analysis of
relative gene expression data using real-time quantitative PCR and
the 2(-Delta Delta C(T)) method. Methods. 25:402–408.
2001.PubMed/NCBI View Article : Google Scholar
|
|
35
|
Manolagas SC: From estrogen-centric to
aging and oxidative stress: A revised perspective of the
pathogenesis of osteoporosis. Endocr Rev. 31:266–300.
2010.PubMed/NCBI View Article : Google Scholar
|
|
36
|
He F, Ru X and Wen T: NRF2, a
transcription factor for stress response and beyond. Int J Mol Sci.
21(4777)2020.PubMed/NCBI View Article : Google Scholar
|
|
37
|
Casado-Díaz A, Santiago-Mora R, Dorado G
and Quesada-Gómez JM: The omega-6 arachidonic fatty acid, but not
the omega-3 fatty acids, inhibits osteoblastogenesis and induces
adipogenesis of human mesenchymal stem cells: Potential implication
in osteoporosis. Osteoporos Int. 24:1647–1661. 2013.PubMed/NCBI View Article : Google Scholar
|
|
38
|
Cunha JS, Ferreira VM, Maquigussa E, Naves
MA and Boim MA: Effects of high glucose and high insulin
concentrations on osteoblast function in vitro. Cell Tissue Res.
358:249–256. 2014.PubMed/NCBI View Article : Google Scholar
|
|
39
|
Shi P, Liu H, Deng X, Jin Y, Wang Q, Liu
H, Chen M and Han X: Label-free nonenzymatic glycation monitoring
of collagen scaffolds in type 2 diabetic mice by confocal Raman
microspectroscopy. J Biomed Opt. 20(27002)2015.PubMed/NCBI View Article : Google Scholar
|
|
40
|
Vestergaard P: Discrepancies in bone
mineral density and fracture risk in patients with type 1 and 2
diabetes-a meta-analysis. Osteoporos Int. 18:427–444.
2007.PubMed/NCBI View Article : Google Scholar
|
|
41
|
Yamamoto M: Insights into bone fragility
in diabetes: The crucial role of bone quality on skeletal strength.
Endocr J. 62:299–308. 2015.PubMed/NCBI View Article : Google Scholar
|
|
42
|
Wauquier F, Leotoing L, Coxam V, Guicheux
J and Wittrant Y: Oxidative stress in bone remodelling and disease.
Trends Mol Med. 15:468–477. 2009.PubMed/NCBI View Article : Google Scholar
|
|
43
|
Sharma T, Sharma A, Maheshwari R, Pachori
G, Kumari P and Mandal CC: Docosahexaenoic acid (DHA) inhibits bone
morphogenetic protein-2 (BMP-2) elevated osteoblast potential of
metastatic breast cancer (MDA-MB-231) cells in mammary
microcalcification. Nutr Cancer. 72:873–883. 2020.PubMed/NCBI View Article : Google Scholar
|
|
44
|
Mao L, Wang M, Li Y, Liu Y, Wang J and Xue
C: Eicosapentaenoic acid-containing phosphatidylcholine promotes
osteogenesis: Mechanism of up-regulating Runx2 and ERK-mediated
phosphorylation of PPARγ at serine 112. J Funct Foods. 52:73–80.
2019.
|
|
45
|
Massaro M, Habib A, Lubrano L, Del Turco
S, Lazzerini G, Bourcier T, Weksler BB and De Caterina R: The
omega-3 fatty acid docosahexaenoate attenuates endothelial
cyclooxygenase-2 induction through both NADP(H) oxidase and PKC
epsilon inhibition. Proc Natl Acad Sci USA. 103:15184–15189.
2006.PubMed/NCBI View Article : Google Scholar
|
|
46
|
Rahman MM, Bhattacharya A and Fernandes G:
Docosahexaenoic acid is more potent inhibitor of osteoclast
differentiation in RAW 264.7 cells than eicosapentaenoic acid. J
Cell Physiol. 214:201–209. 2007.PubMed/NCBI View Article : Google Scholar
|
|
47
|
Poulsen RC, Wolber FM, Moughan PJ and
Kruger MC: Long chain polyunsaturated fatty acids alter
membrane-bound RANK-L expression and osteoprotegerin secretion by
MC3T3-E1 osteoblast-like cells. Prostaglandins Other Lipid Mediat.
85:42–48. 2008.PubMed/NCBI View Article : Google Scholar
|