Introduction
Diabetic kidney disease (DKD), the most serious
microvascular complication of diabetes mellitus, is a chronic
progressive kidney disease characterized by persistent proteinuria
and progressive proteinuria (1).
DKD is accompanied by a continuous decline in renal small
glomerular filtration rate, renal capillaries rupture, and damage
in glomerular capillaries and tubular interstitium (1). Podocytes, also known as upper
glomerular cells, are highly terminally differentiated cells that
constitute the last barrier of the glomerular filtration membrane
(2). In DKD, a typical damaged
podocyte disease, the number of podocytes in the kidney of patients
with initial DKD decreases, and this decreases even more in
patients with advanced DKD (3).
Therefore, podocyte damage is a key factor in initiating
proteinuria and glomerulosclerosis in DKD.
Recent studies have focused on glomerular podocyte
apoptosis induced by diabetes-mediated mitochondrial dysfunction
(4,5). Activation of NADPH oxidase and the
production of oxidative molecules in mitochondria can activate
animal pro-apoptotic pathways (p38 MAPK and caspase-3), which
ultimately leads to podocyte apoptosis (6). Lee et al (7) identified that a large amount of
secreted TGF-β1 mediates SMAD-7/p38 MAPK/caspase-3 activation, or
Bax expression in mitochondria, leading to cytochrome c release
from mitochondria and caspase-3 activation, causing podocyte
apoptosis in patients with diabetes. However, the molecular
mechanisms of mitochondrial dysfunction and apoptosis in podocytes
still remain unclear.
Long non-coding RNA (lncRNA) is a non-coding RNA
with a length >200 nucleotides, and microRNA (miRNA/miR) is a
class of non-coding single-stranded RNA molecules with a length of
~22 nucleotides encoded by endogenous genes (8). The present study focused on an
evolutionarily conserved long intergenic non-coding RNA (lincRNA),
taurine-upregulated gene 1 (TUG1), because it has been reported to
regulate mitochondrial bioenergetics in diabetic nephropathy
(9) and could sponge
miR-9(10). In addition, sirtuin 1
(SIRT1) has been reported as a target gene of miR-9, regulating
high glucose (HG)-induced mitochondrial dysfunction and apoptosis
in podocytes (11,12). Therefore, TUG1 could theoretically
regulate mitochondrial dysfunction and apoptosis through
miR-9-mediated SIRT1 expression in podocytes. The present study
aimed to verify TUG1-regulated mitochondrial dysfunction and
apoptosis through miR-9-mediated SIRT1 expression using HG-induced
apoptosis in podocytes.
Materials and methods
Cell culture and treatment
Conditionally immortalized mouse podocyte clonal
cells (MPC5) were purchased from Shanghai Jihe Biotechnology Co.,
Ltd. (cat. no. CC-Y2125), and podocytes were propagated and
maintained in RPMI-1640 medium (cat. no. 11875101; Thermo Fisher
Scientific, Inc.) supplemented with 10% FBS (cat. no. 10099141C;
Thermo Fisher Scientific, Inc.) and 10 U/ml-1
recombinant mouse interferon-γ (cat. no. PMC4033; Thermo Fisher
Scientific, Inc.) at 33˚C under a humidified atmosphere of 5%
CO2 for propagation, as previously described (13). Podocytes were cultured for
different times (24, 48 and 72 h) at 33˚C and incubated with normal
glucose (5 mM) as the control group, or exposed to 45 mM mannitol
as an osmotic pressure control. In the experimental group,
podocytes were exposed to different glucose concentrations (25, 35
and 45 mM) for the same times applied for the control groups
(14,15).
Cell Counting Kit-8 (CCK-8) assay
After the aforementioned treatments, the culture
medium was removed and MPC5 cells were washed twice with PBS.
Subsequently, 100 µl cell culture medium supplemented with 10 µl
CCK-8 solution (cat. no. C0038; Beyotime Institute of
Biotechnology) was added, and then the cells were incubated for 2
h. Finally, the optical density at 450 nm was measured to calculate
the relative cell viability.
Reverse transcription-quantitative PCR
(RT-qPCR)
Total RNA from MPC5 cells was extracted using a
FastPure Cell/Tissue Total RNA Isolation kit (cat. no. RC101-01;
Vazyme Biotech Co., Ltd.). Complementary DNA was prepared using the
PrimeScript™ RT Reagent kit (cat. no. RR047A; Takara Bio, Inc.)
with the following temperature protocol: 37˚C for 15 min and 85˚C
for 5 sec. Subsequently, 20 µl qPCR mix was prepared as described
in the instructions of the Go Taq qPCR master mix kit (cat. no.
A6001; Promega Corporation), and qPCR was carried out using
SYBR-Green I and the following temperature protocol: Initial
denaturation at 95˚C for 2 min, followed by 95˚C for 5 sec and 65˚C
for 30 sec for 40 cycles. The relative gene expression was
calculated using the 2-ΔΔCq method (16), with β-actin as the loading control.
The primers for qPCR analysis were as follows: TUG1 forward,
5'-CTCTGGAGG TGGACGTTTTGT-3' and reverse, 5'-GTGAGTCGTGTCTC
TCTTTTCTC-3'; SIRT1 forward, 5'-CAGCCGTCTCTGT GTCACAAA-3' and
reverse, 5'-GCACCGAGGAACTACCT GAT-3'; miR-9 forward,
5'-ACACTCCAGCTGGGTCTTTGG TTATCTAGCT-3' and reverse,
5'-TGGTGTCGTGGAGTCG-3'; U6 forward, 5'-CTCGCTTCGGCAGCACA-3' and
reverse, 5'-AACGCTTCACGAATTTGCGT-3'; and β-actin forward,
5'-AGGGAAATCGTGCGTGACAT-3' and reverse, 5'-GCC
TCAGGAGTTTTGTCACCT-3'. U6 was a loading controls for miR-9, and
β-actin was a loading controls for TUG1 and SIRT1.
Cell transfection
Small interfering RNA (siRNA) was used to knock down
TUG1 expression. A total of 2.5x10⁶ MPC5 cells were
transfected with 50 nmol/l of siRNA (5'-UAACA AGUUCUAUUUUGAGCA-3',
negative control for siRNA: 5'-UCCAAGUAGGAUCCCUUGAGC-3') and using
Lipo-fectamine® 2000 (Thermo Fisher Scientific, Inc.) at
33˚C for 6 h, and then replaced the cell cultured medium.
Experiments were performed after 72 h of transfection. Similarly,
2.5x10⁶ MPC5 cells were transfected with 50 nmol/l
mimic-negative control (NC; 5'-UCTTTTCAAGCGTTCAGTCCC-3'),
inhibitor-NC (5'-AGCAAUGUCUACUCAUAGGA-3'), miR-9-mimic
(5'-UCUUUGGUUAUCUAGCUGUAUGA-3') or miR-9-inhibitor
(5'-AGAAACCAAUGCGACAUACU-3') using Lipofectamine® 2000
at 33˚C for 72 h, and subsequent experiments were performed
following 72 h of transfection. NC, inhibitor-NC, miR-9-mimic and
miR-9-inhibitor were all synthesized at Shenggong Co., Ltd.
MPC5 cells were transfected as aforementioned with
wild-type (WT) or mutated (MUT) versions of the 3'-untranslated
region of TUG1 and SIRT1 cloned into pisCHECK2 (cat. no. 97157;
Addgene, Inc.), using a Dual-Luciferase Assay kit (cat. no. D0010;
Beijing Solarbio Science & Technology Co., Ltd.) to detect
luciferase activity according to the manufacturer's protocol. In
brief, 72 h after being transfected with the NC, miR-9-mimic or
miR-9-inhibitor, a recombinant pisCHECK2 plasmid was transfected
into MPC5 cells at 33˚C for 6 h, and the cell cultured medium was
replaced. Following 48 h of transfection, the cells were collected
and the cell lysate was added. Cells were incubated on ice for 5
min and subsequently centrifuged at 500 x g and room temperature to
collect the supernatant. A total of 20 µl cell lysis supernatant
was added to 100 µl firefly luciferase reaction solution and 100 µl
Renilla luciferase reaction solution. Luciferase activity
was detected within 30 min after mixing.
TUG1 and SIRT1 overexpression (OE)
using adenovirus (AAV) infection
Commercial AAVs were used to infect MPC5 to
overexpress TUG1 or SIRT1. First, 1x10⁶ podocytes were
cultured for 12 h in 6-well cell culture plates. Subsequently,
1x10¹⁰ PFU/100 µl TUG1-AAV (customized; Vector Biolabs)
or SIRT1-AAV (cat. no. AAV-272007; Vector Biolabs) were used to
infect podocytes. Podocytes infected with an equivalent empty AAV
(NC-AAV, a control AAV for TUG1-AAV and SIRT1 AAV; MOI=10) served
as a negative control. At 48 h after infection, the cells were
collected for further analysis.
Fluorescence in situ hybridization
(FISH)
FISH was performed as previously described (17). Following fixation with 4%
paraformaldehyde for 15 min at room temperature, cells were treated
with 0.5% Triton X-100 for 5 min at room temperature, and
subsequently washed 3 times with PBS buffer. Cells were then washed
twice in 70% ethanol and incubated in a series containing 85, 90
and 100% ethanol for 3 min each. The hybrid mixture was prepared
using 2.5 µl 4 ng/μl human-derived TUG1 gene (NCBI gene ID:55000;
synthesized by Genomeditech Co., Ltd.), 1 µl 20X SSC buffer and 6.5
µl formamide, and this was incubated at 72˚C for 5 min. The hybrid
mixture was subsequently added into cell slices at 42˚C overnight
in the dark. After being washed with eluent buffer (50% acetamide
and 2X SSC) at 2˚C for 5 min, Alexa Fluor 488-digoxin antibody
(1:5,000, cat. no. bs-0356R; Bioss) was added to the cells and
incubated for 4 h at room temperature. Finally, cells were washed 3
times with PBS buffer, and then cell nuclei were counterstained
with 5 µg/ml DAPI for 5 min at room temperature. All samples were
analyzed by confocal microscopy.
Apoptosis analysis and detection of
caspase-3 activity
Following the aforementioned treatments, MPC5 cells
were collected and washed twice with cold PBS buffer. Subsequently,
the Annexin V-FITC/7-AAD Apoptosis Detection Kit (cat. no. A213-01;
Vazyme Biotech Co., Ltd.) was used according to the manufacturer's
protocol, and apoptosis was determined with a flow cytometer
(Flow-Count™; Beckman Coulter, Inc.). Results of the apoptosis
analysis were analyzed using FlowJo software (V10; BD
Biosciences).
Apoptosis was additionally reflected by caspase-3
activity, which was measured using the Ac-DEVD-AFC Caspase-3
Fluorogenic Substrate (cat. no. 556574; BD Pharmingen; BD
Biosciences) according to the manufacturer's instructions. First,
MPC5 cells were lysed using RIPA buffer (cat. no. 9806S, Cell
Signaling Technology) on ice for 10 min, centrifuged at 4˚C at 500
x g for 10 min, and the supernatants were collected. Protein
concentration was quantified using the BCA method. A total of 50 µg
of proteins were pipetted and mixed with assay buffer supplemented
with 10 mM dithiothreitol. The fluorescence emission of AFC (400
nm) was measured with a SpectraMax Plus Microplate Reader
(Molecular Devices, LLC).
Western blotting
Tissue/cells Protein Extraction Reagent (cat. no.
78510; Thermo Fisher Scientific, Inc.) was used to extract proteins
from MPC5 cells. A BCA kit (cat. no. 23227; Thermo Fisher
Scientific, Inc.) was used to determine the protein concentration.
Subsequently, 50 µg of proteins per lane were separated by 10%
SDS-PAGE, and then transferred to PVDF membranes (cat. no. LC2002;
Thermo Fisher Scientific, Inc.). The PVDF membranes were first
blocked with 5% skimmed milk powder for 1 h at room temperature,
then probed with primary antibodies against SIRT1 (1:1,000; cat.
no. ab189494; Abcam), Bax (1:500; cat. no. ab32503; Abcam), Bcl2
(1:1,000; cat. no. ab196495; Abcam) and β-actin (1:2,000; cat. no.
ab32503; Abcam) at 4˚C overnight. After being washed 3 times with
PBS buffer, membranes were incubated with Goat Anti-Mouse IgG
H&L (HRP; 1:3,000; cat. no. ab6789; Abcam) or Goat Anti-Rabbit
IgG H&L (HRP; 1:3,000; cat. no. ab6721; Abcam) for 1 h at room
temperature. Proteins were visualized with ECL solution (cat. no.
WBKLS0100; Beijing Xinjingke Biotechnologies Co., Ltd.), followed
by densitometry analysis using ImageJ 3.0 software (National
Institutes of Health). β-actin was used as a loading control.
Mitochondrial superoxide
indicator
A total of 0.5x10⁵ MPC5 cells were seeded
into Nunc™ Lab-Tek™ Chambered Coverglass (cat. no. 155411; Thermo
Fisher Scientific, Inc.). Following the aforementioned treatments,
cell medium was replaced with fresh medium, and 200 nM MitoSOX™ Red
Mitochondrial Superoxide Indicator (cat. no. M36008; Invitrogen;
Thermo Fisher Scientific, Inc.) was added for 30 min at 33˚C. After
being washed three times with PBS buffer, MPC5 cells were fixed
with 4% paraformaldehyde for 15 min at room temperature followed by
treatment with 0.5% Triton X-100 for 5 min at room temperature.
Cell nuclei were counterstained with 5 µg/ml DAPI for 5 min at room
temperature. Finally, all samples were analyzed using confocal
microscopy.
Mitochondrial complexes activity
The Cell Mitochondria Isolation Kit (cat. no. C3601;
Beyotime Institute of Biotechnology) was used to isolate
mitochondria from MPC5 cells according to the manufacturer's
instructions. The activities of the mitochondrial respiratory chain
complexes were measured in microplates using specific kits: Complex
I (cat. no. ab109721; Abcam) and complex III (cat. no. ab109905;
Abcam) according to the manufacturer's instructions. The activity
of the mitochondrial complexes was normalized to the concentration
of mitochondrial protein.
Mitochondrial respiration
monitoring
Mitochondrial oxidative phosphorylation reactions
were assessed by comparing oxygen consumption rates (OCRs) measured
with a Agilent Seahorse XF Cell Mito Stress Test kit (cat. no.
103010; Agilent) and an Xfe-24 Extracellular Flux Analyzer (Agilent
Technologies, Inc.), as previously described (18). MPC5 cells (2x10⁵
cells/well) were seeded into plates. After stimulation with 35 mM
glucose for 48 h at 33˚C, the cell culture medium was removed and
replaced with bicarbonate-free and HEPES-free RPMI medium (pH 7.4;
Invitrogen; Thermo Fisher Scientific, Inc.) supplemented with 2%
FBS (cat. no. 10099141C; Invitrogen; Thermo Fisher Scientific,
Inc.) for 1 h at 37˚C in a CO2-free incubator. OCRs were
measured under basic conditions; subsequently, according to the
manufacturer's instructions, oligomycin, trifluoromethoxy
carbonylcyanide phenylhydrazone and antimycin A were loaded into a
sensor cartridge to produce a final concentration of 1, 1.5 and 1
µM, respectively. The data were analyzed using XFe software 2.6.1
(Agilent Technologies, Inc.) and normalized to the amount of
protein loaded per well.
Statistical analysis
SPSS 20.0 software (IBM Corp.) was used to analyze
the data. Data are presented as the mean ± standard deviation and
each experiment was repeated three times. Unpaired Student's t-test
was used to compare the differences between two groups, and one-way
ANOVA followed by Tukey's post hoc test was used to compare the
differences among multiple groups. P<0.05 was considered to
indicate a statistically significant difference.
Results
HG reduces TUG1 expression in
podocytes
Viability was evaluated in MPC5 podocytes using a
CCK-8 assay after incubation with different HG concentrations (25,
35 and 45 mM) for different durations (24, 48 and 72 h). Mannitol
(45 mM) was used as an osmotic pressure control. The results
indicated that, compared with the control group (normal glucose),
HG significantly decreased the viability of podocytes (Fig. 1A). In addition, cell viability was
decreased when the concentration of glucose added was increased, as
well as when the incubation time with HG was increased. Previous
studies have reported that lncRNA TUG1 and podocytes serve an
important role in the progression of diabetic nephropathy (19,20).
Therefore, it was hypothesized that HG would also affect TUG1
expression in podocytes. RT-qPCR results revealed that TUG1
expression in podocytes stimulated with HG was lower than that in
the control group, and the higher the dose of glucose, the lower
the expression level of TUG1 (Fig.
1B). Subsequently, TUG1 knockdown (KD) was established in
podocytes and confirmed (Fig.
S1A), and TUG1 OE was also established and confirmed (Fig. S1B). RT-qPCR analysis indicated
successfully established TUG1 KD and OE podocyte cell lines
(Fig. 1C). TUG1 expression in TUG1
KD podocytes was ~45% of that of the WT, and its expression in TUG1
OE podocytes was ~220% of that of the WT. Additionally, TUG1
expression in podocytes was observed using FISH staining, which
revealed that TUG1 was expressed both in the cytoplasm and the
nucleus, but mainly in the cytoplasm (Fig. 1D).
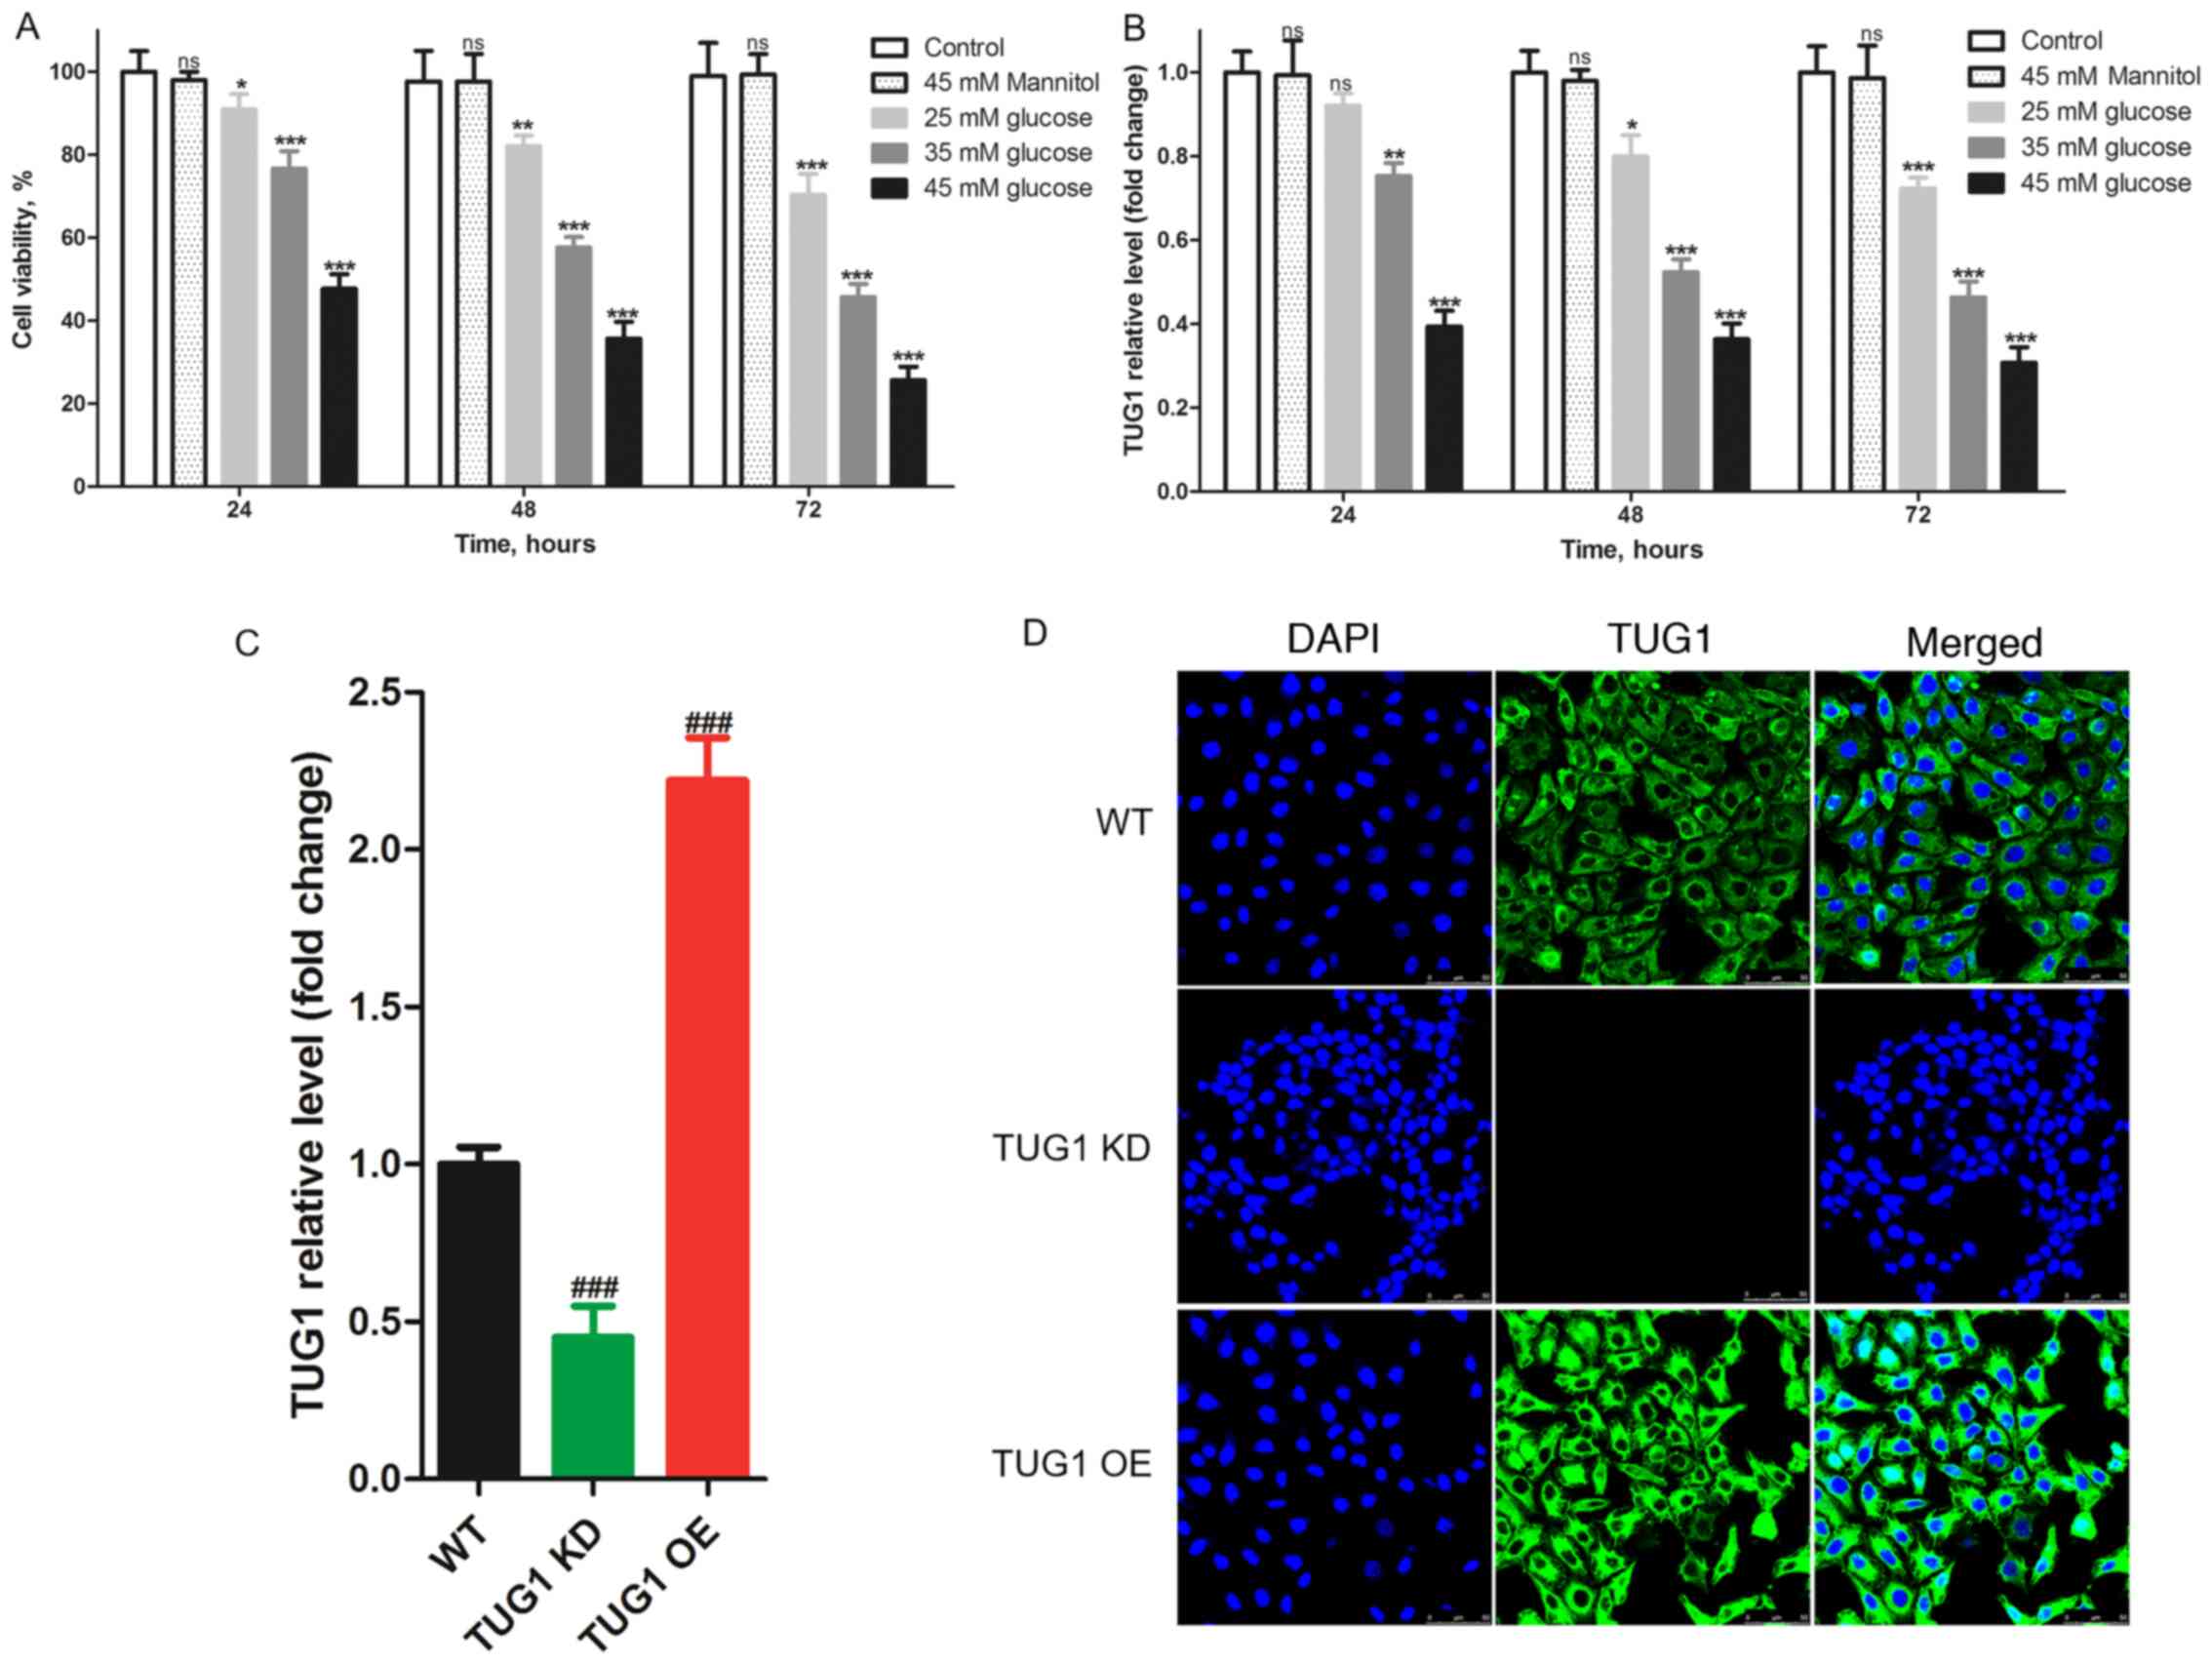 | Figure 1High glucose downregulates TUG1
expression and cell viability of mouse podocyte clonal cells in a
dose-dependent manner. Following incubation with different
concentrations of glucose for various durations, (A) the viability
of podocytes was determined using a Cell Counting Kit-8 assay and
(B) the expression levels of TUG1 were detected by RT-qPCR. (C)
RT-qPCR analysis indicated that TUG1 KD and TUG1 OE were
successfully established. (D) Fluorescence in situ
hybridization staining revealed that TUG1 was mainly expressed in
the cytoplasm and to a lesser extent in the nucleus of podocytes
(magnification, x800). Each experiment was repeated at least three
times, and data are presented as the mean ± SD. P-values were
calculated using one-way ANOVA followed by Tukey's post hoc test.
nsP>0.05, *P<0.05,
**P<0.01 and ***P<0.001 vs. control
group; ###P<0.001 vs. WT group. TUG1,
taurine-upregulated gene 1; KD, knockdown; OE, overexpression; WT,
wild-type; RT-qPCR, reverse transcription-quantitative PCR. |
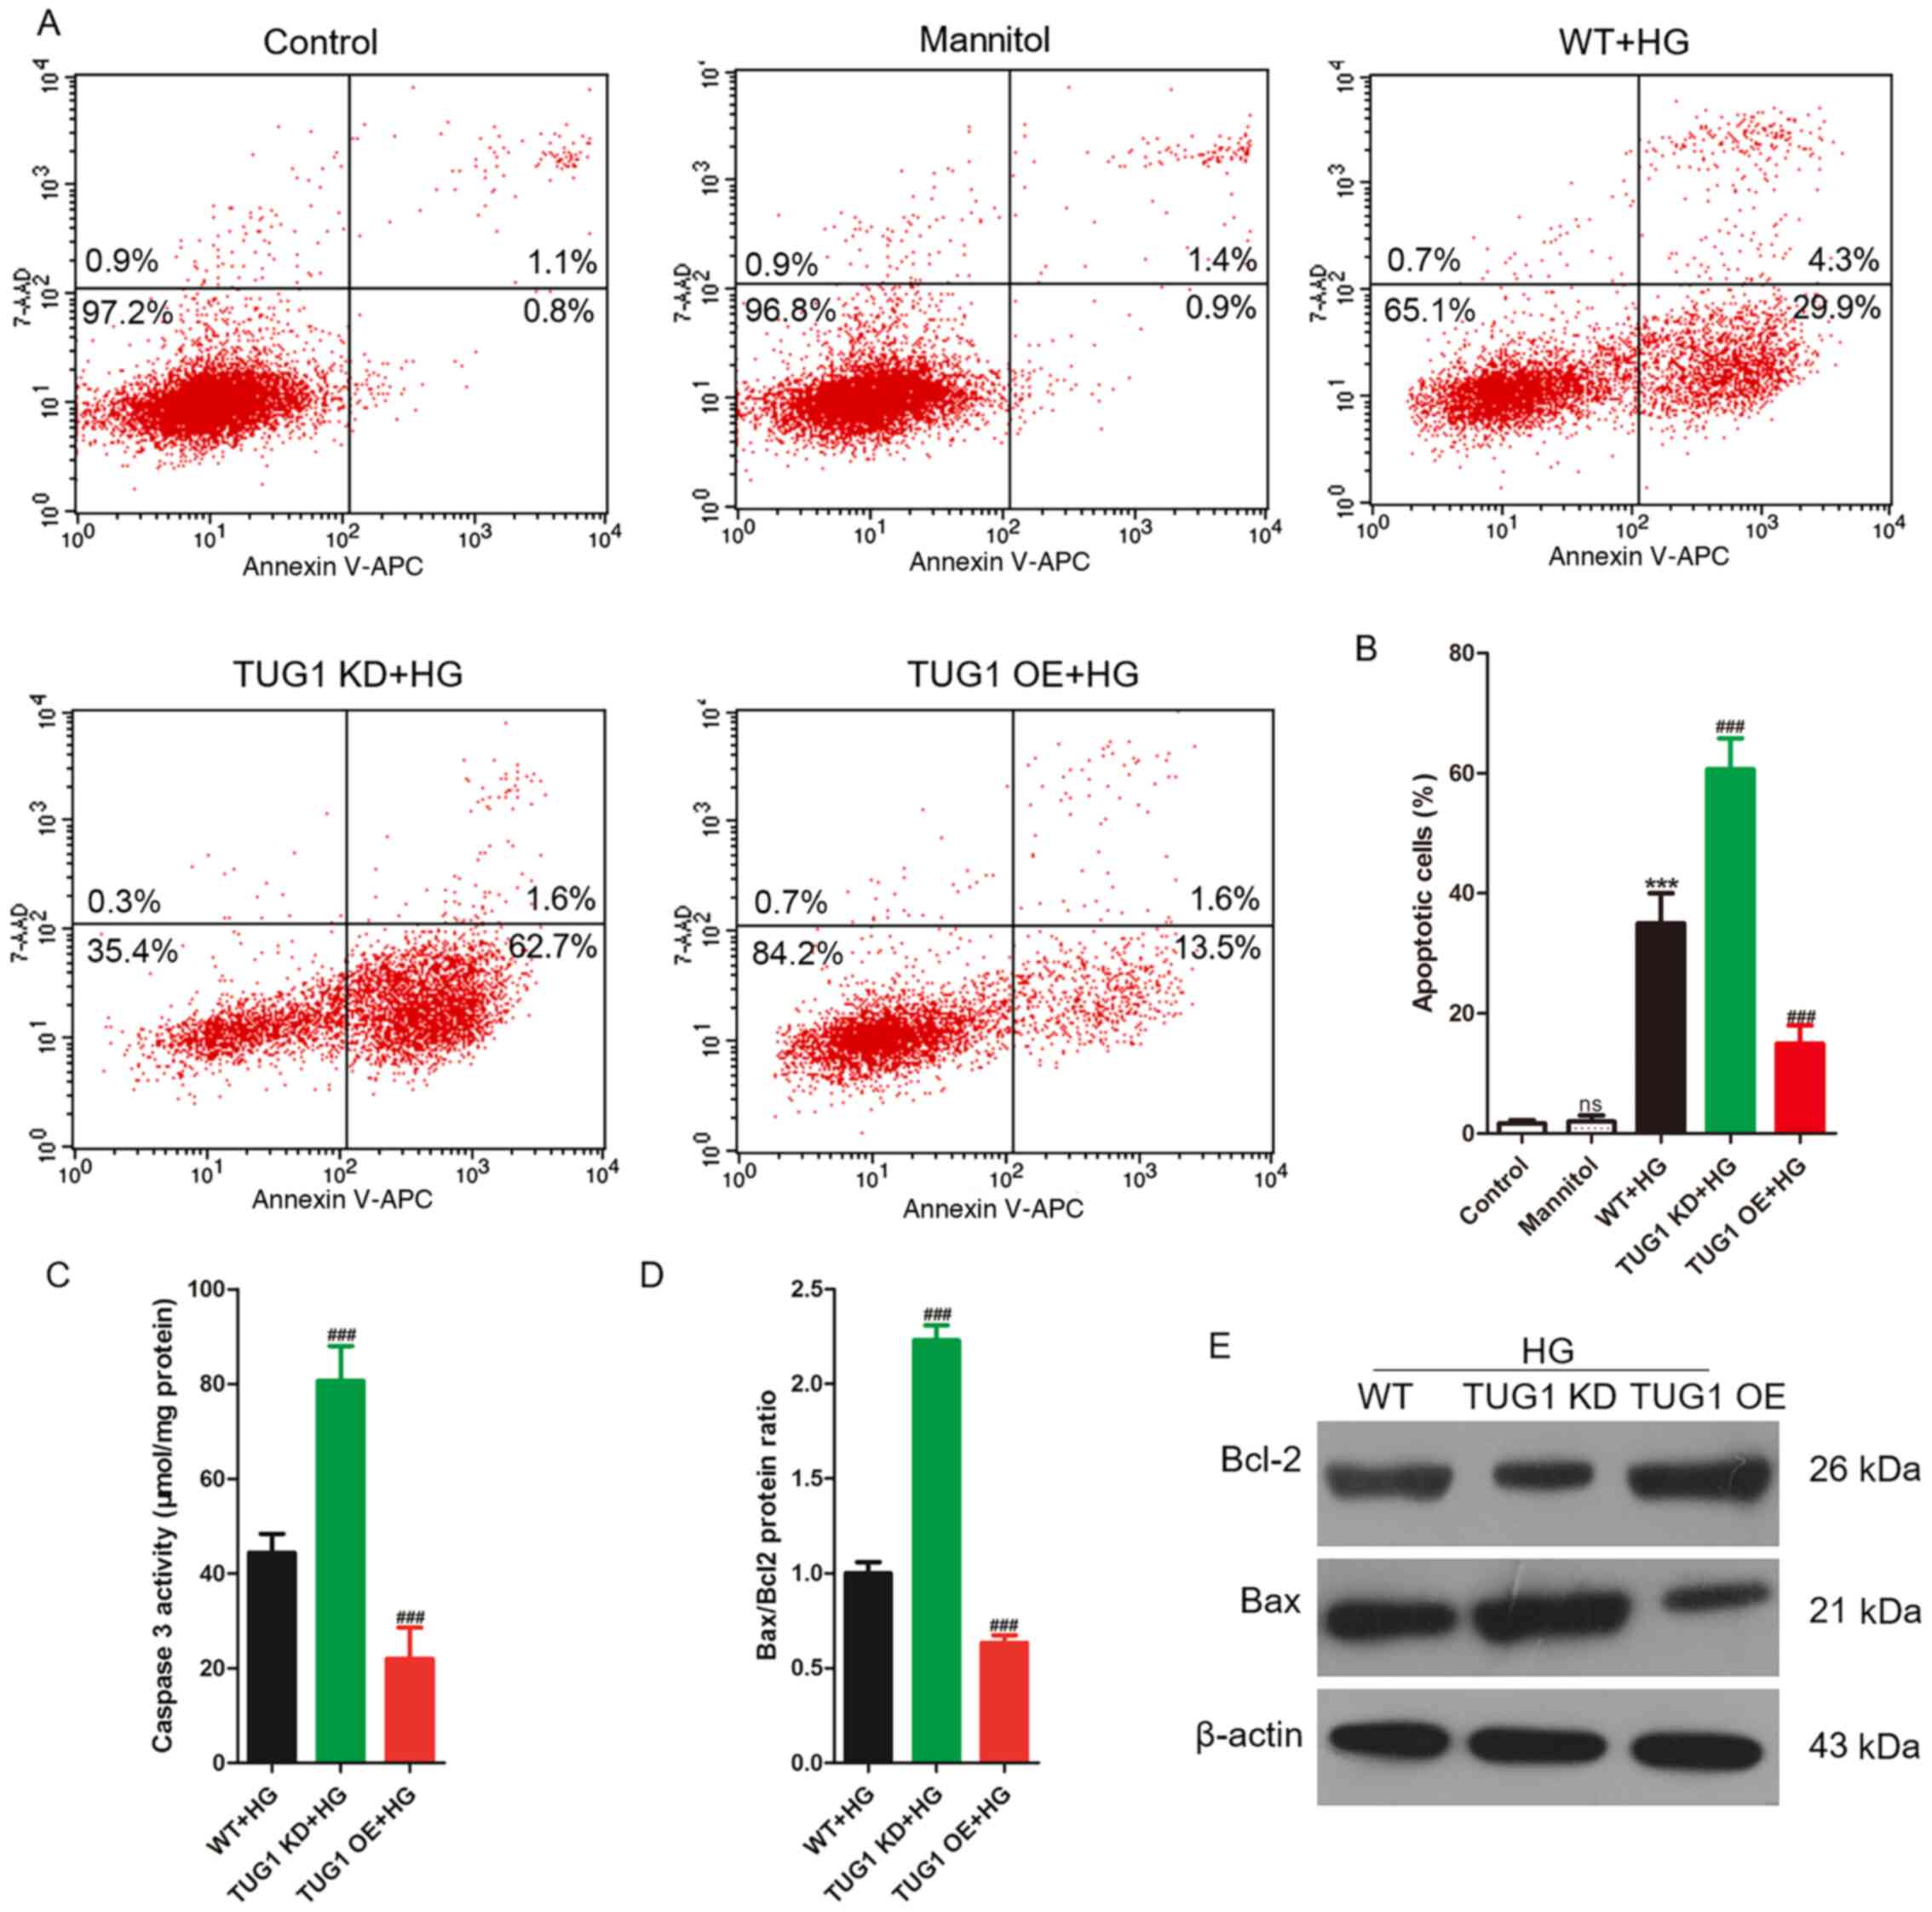
TUG1 protects podocytes from
HG-induced apoptosis
As podocytes were treated with 35 mM glucose for 48
h, ~60% of the viable cells were available for follow-up research,
and HG stimulation condition was defined as 35 mM for 48 h in the
following experiments. After stimulation with 35 mM glucose or 35
mM mannitol for 48 h, podocytes were harvested to analyze apoptosis
using flow cytometry. No significant difference was observed in the
ratio of apoptotic cells between the normal control and mannitol
groups. However, compared with the control group, the ratio of
apoptotic podocytes in the WT + HG group was significantly
increased. The percentage of apoptotic podocytes in the TUG1 KD +
HG group was significantly higher than that in the WT + HG group,
while the percentage in the TUG1 OE + HG group was significantly
lower compared with that in the WT + HG group (Fig. 2A and B). Subsequently, apoptosis-related
indexes, such as caspase-3 activity and the expression levels of
Bax and Bcl2, were evaluated. Caspase-3 activity was significantly
increased in the TUG1 KD + HG group compared with the WT + HG group
(Fig. 2C). The Bax/Bcl2 protein
expression ratio was significantly increased in the TUG1 KD + HG
group compared with the WT + HG group (Fig. 2D and E). Taken together, TUG1 KD aggravated the
effects of HG in podocytes, while TUG1 OE reversed these
effects.
TUG1 restores HG-induced mitochondrial
dysfunction
Caspase-3, Bax and Bcl2 are key molecules in the
mitochondrial-mediated apoptosis pathway (21). Additionally, a previous study has
indicated that TUG1 regulates mitochondrial bioenergetics in
diabetic nephropathy (19).
Therefore, the effect of TUG1 expression on mitochondrial
bioenergetics was assessed in podocytes stimulated with HG. First,
the levels of reactive oxygen species (ROS) were measured in
podocytes using the MitoSOX™ kit, since ROS is the direct cause of
lipid peroxidation damage to biofilms and macromolecular substances
(22,23). It was revealed that HG triggered a
significant increase in ROS levels in podocytes, which was
aggravated by TUG1 KD and reversed by TUG1 OE (Fig. 3A and B). Compared with the control group, HG
treatment was associated with a significant decrease in the levels
of complex I and III activity and of basal and maximal OCR. TUG1 KD
aggravated this decrease, while TUG1 OE reversed these effects
(Fig. 3C-F). Therefore, the
present data suggested that HG induced mitochondrial dysfunction in
podocytes, TUG1 KD aggravated this dysfunction and TUG1 OE reversed
it.
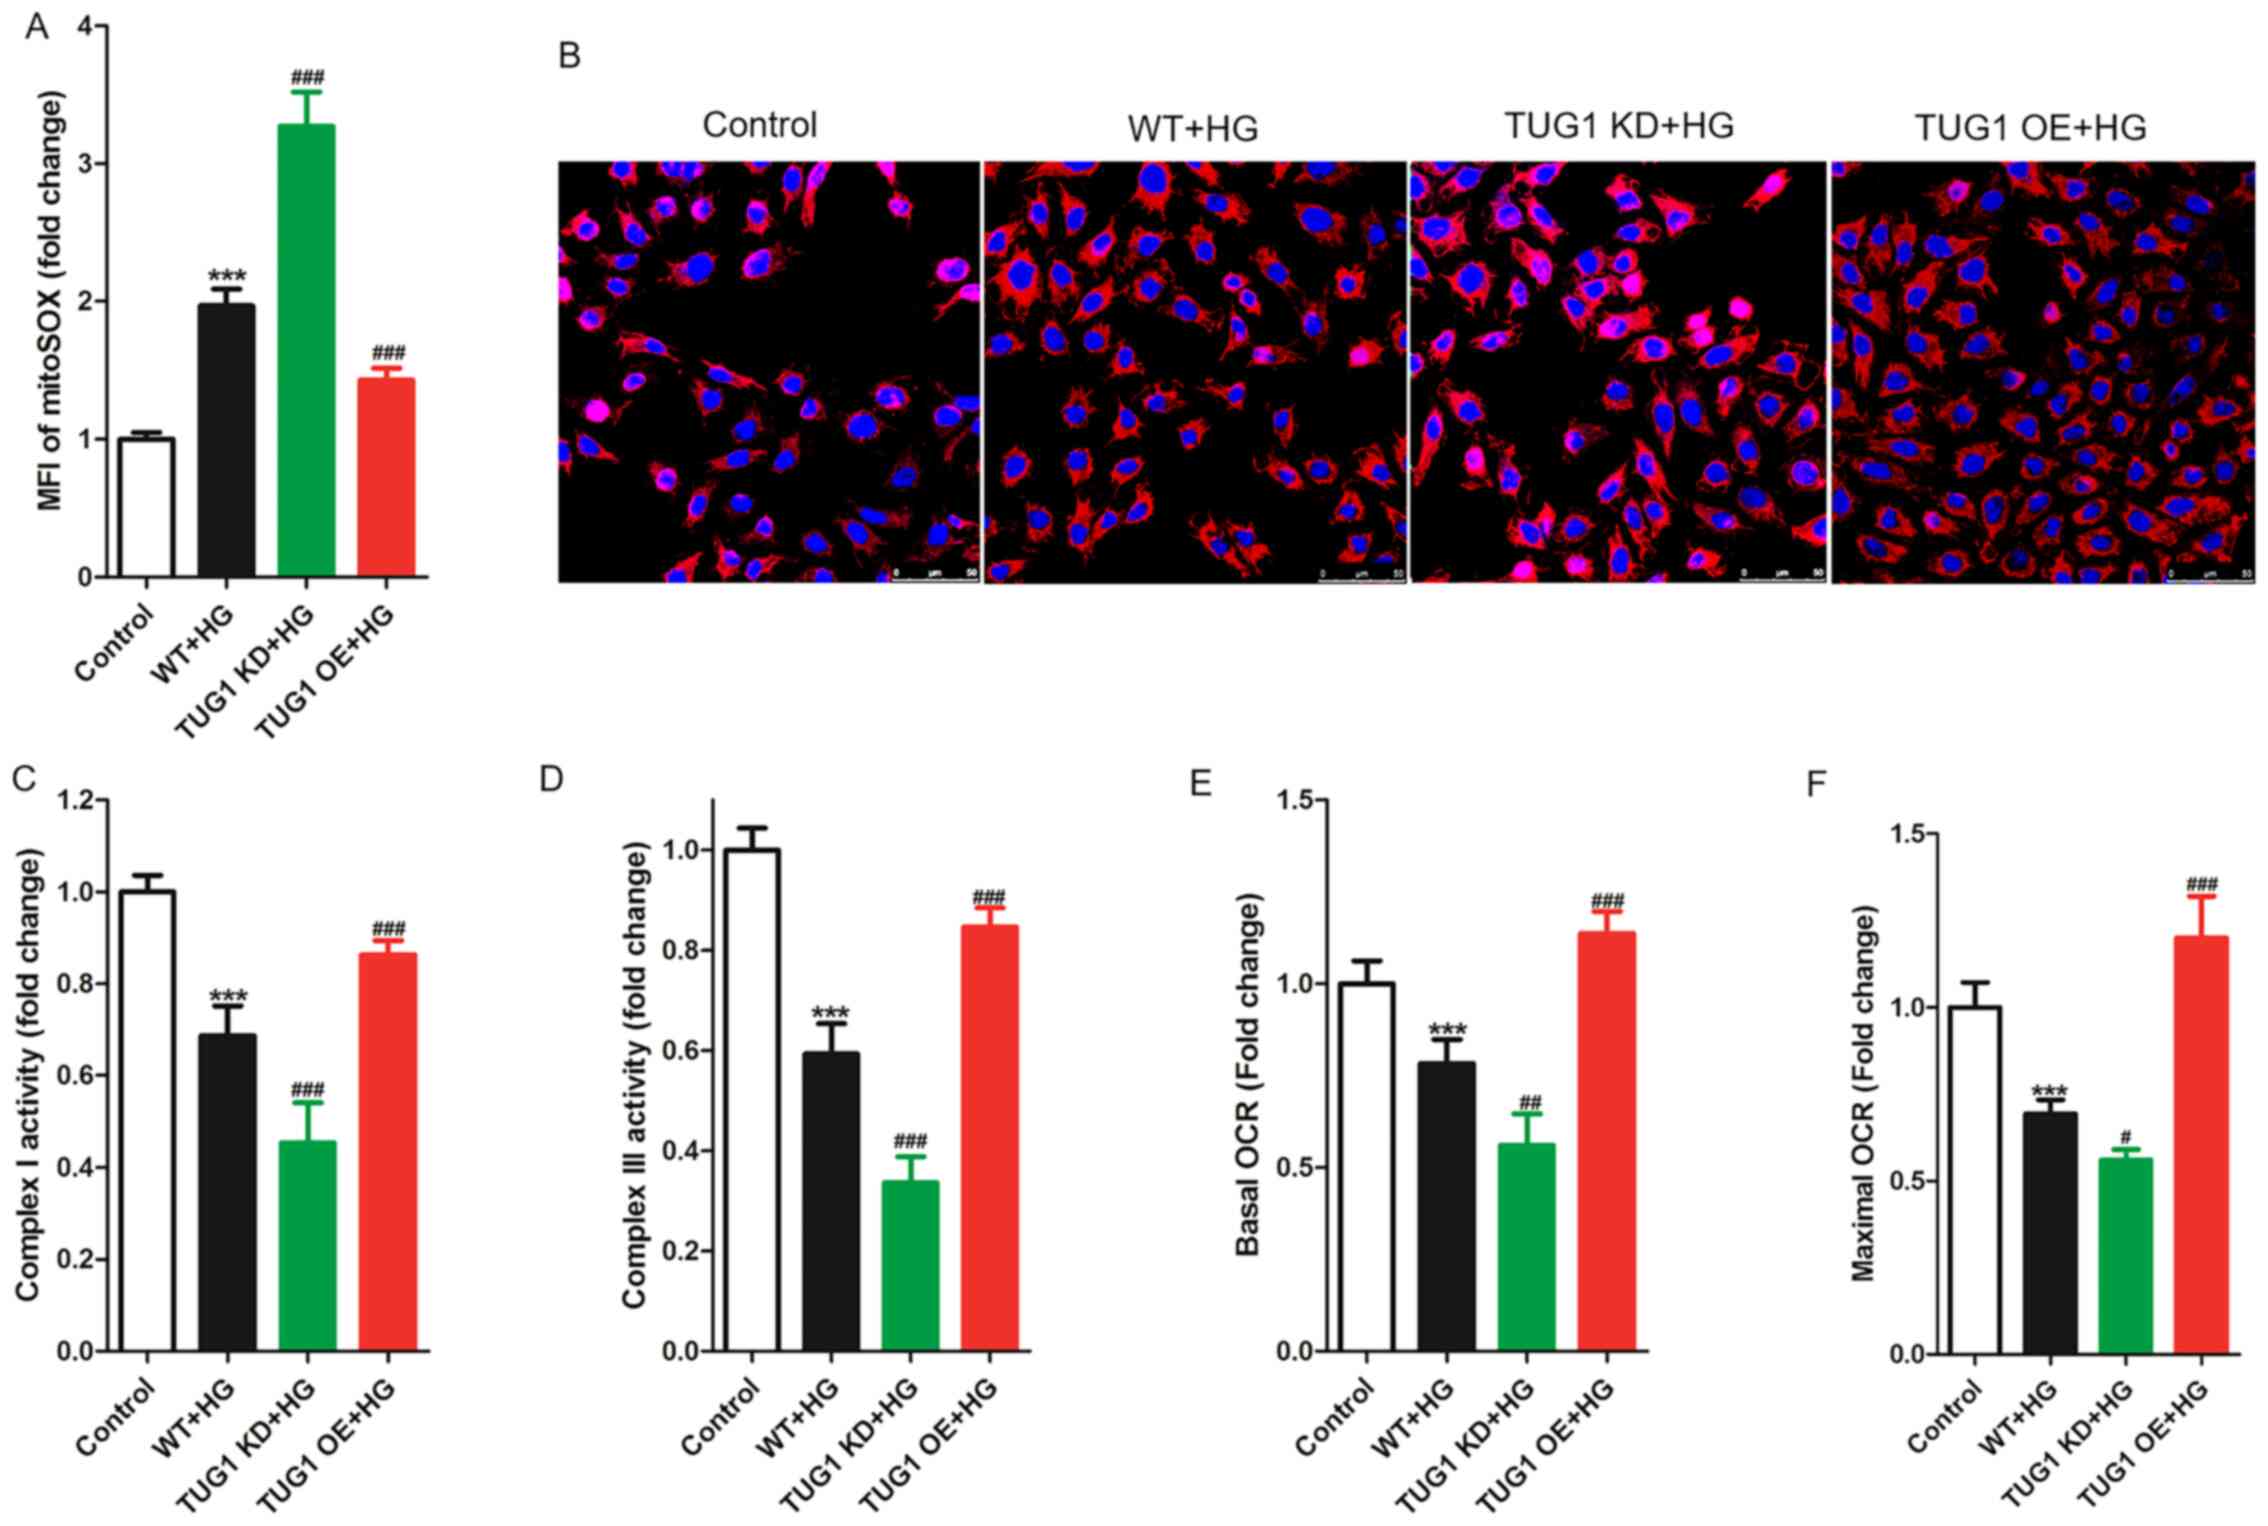 | Figure 3TUG1 modulates mitochondrial
bioenergetics in HG-induced mouse podocyte clonal cells. Podocytes
were incubated with 35 mM glucose for 48 h. (A) Mitochondrial
superoxide production calculated from (B) MitoSOX™ staining
(magnification, x800). Measurement of (C) complex I and (D) complex
III activity in mitochondria isolated from cultured podocytes.
Seahorse XF24 was used to analyze the (E) basal and (F) maximal OCR
in podocytes. Each experiment was repeated at least three times,
and data are presented as the mean ± SD. P-values were calculated
using one-way ANOVA followed by Tukey's post hoc test, or Student's
t-test accordingly (compared with control group).
***P<0.001 vs. control group; #P<0.05,
##P<0.01 and ###P<0.001 vs. WT + HG
group. MFI, medial fluorescence intensity; OCR, oxygen consumption
rate; TUG1, taurine-upregulated gene 1; KD, knockdown; OE,
overexpression; WT, wild-type; HG, high glucose. |
TUG1 upregulates SIRT1 expression by
sponging miR-9
As a non-coding RNA (ncRNA), TUG1 can only
participate in the regulation of cell life activities by regulating
the expression of downstream genes (10,11).
After reviewing a number of previous reports (10-13),
miR-9 and SIRT1 were selected as potential downstream genes for
TUG1. TUG1 interacts with miR-9 to reduce doxorubicin-induced
breast cancer cell apoptosis (24), and the miR-9/SIRT1 axis has been
reported to be involved in regulating podocyte damage induced by HG
(25). Additionally, resveratrol,
an activator of SIRT1, has been demonstrated to improve
mitochondrial function by upregulating SIRT1 (26,27).
Therefore, it was hypothesized that TUG1 regulated HG-induced
apoptosis and mitochondrial function in podocytes via the
miR-9/SIRT1 axis.
To examine this hypothesis, miR-9 was overexpressed
(mimic) or inhibited (inhibitor) in podocytes (Fig. S2). The potential binding sequences
of miR-9/TUG1 and miR-9/SIRT1 are presented in Fig. 4A. WT or MUT binding sequences of
TUG1/SIRT1 were co-transfected into podocytes with NC, miR-9-mimic
(mimic) or miR-9-inhibitor (inhibitor), and luciferase activity was
measured. The results indicated that miR-9 OE significantly
reduced, and downregulating miR-9 significantly increased
luciferase activity in podocytes after co-transfection with the WT
sequence of TUG1/SIRT1 into podocytes (Fig. 4B and C). In addition, RT-qPCR analysis
indicated that miR-9 OE significantly reduced, while its inhibition
significantly increased, the expression levels of TUG1 and SIRT1
mRNA in podocytes (Fig. 4D). In
addition, TUG1 KD significantly reduced the mRNA expression levels
of SIRT1 and increased miR-9 expression, while TUG1 OE
significantly increased the mRNA expression levels of SIRT1 and
reduced miR-9 expression in podocytes (Fig. 4E). Inhibiting miR-9 reversed the
inhibition of SIRT1 protein expression induced by TUG1 KD, and
miR-9 OE also reversed the promotion of SIRT1 protein expression
induced by TUG1 OE (Fig. 4F).
Taken together, these results indicated that TUG1 upregulated SIRT1
expression by sponging miR-9 in podocytes.
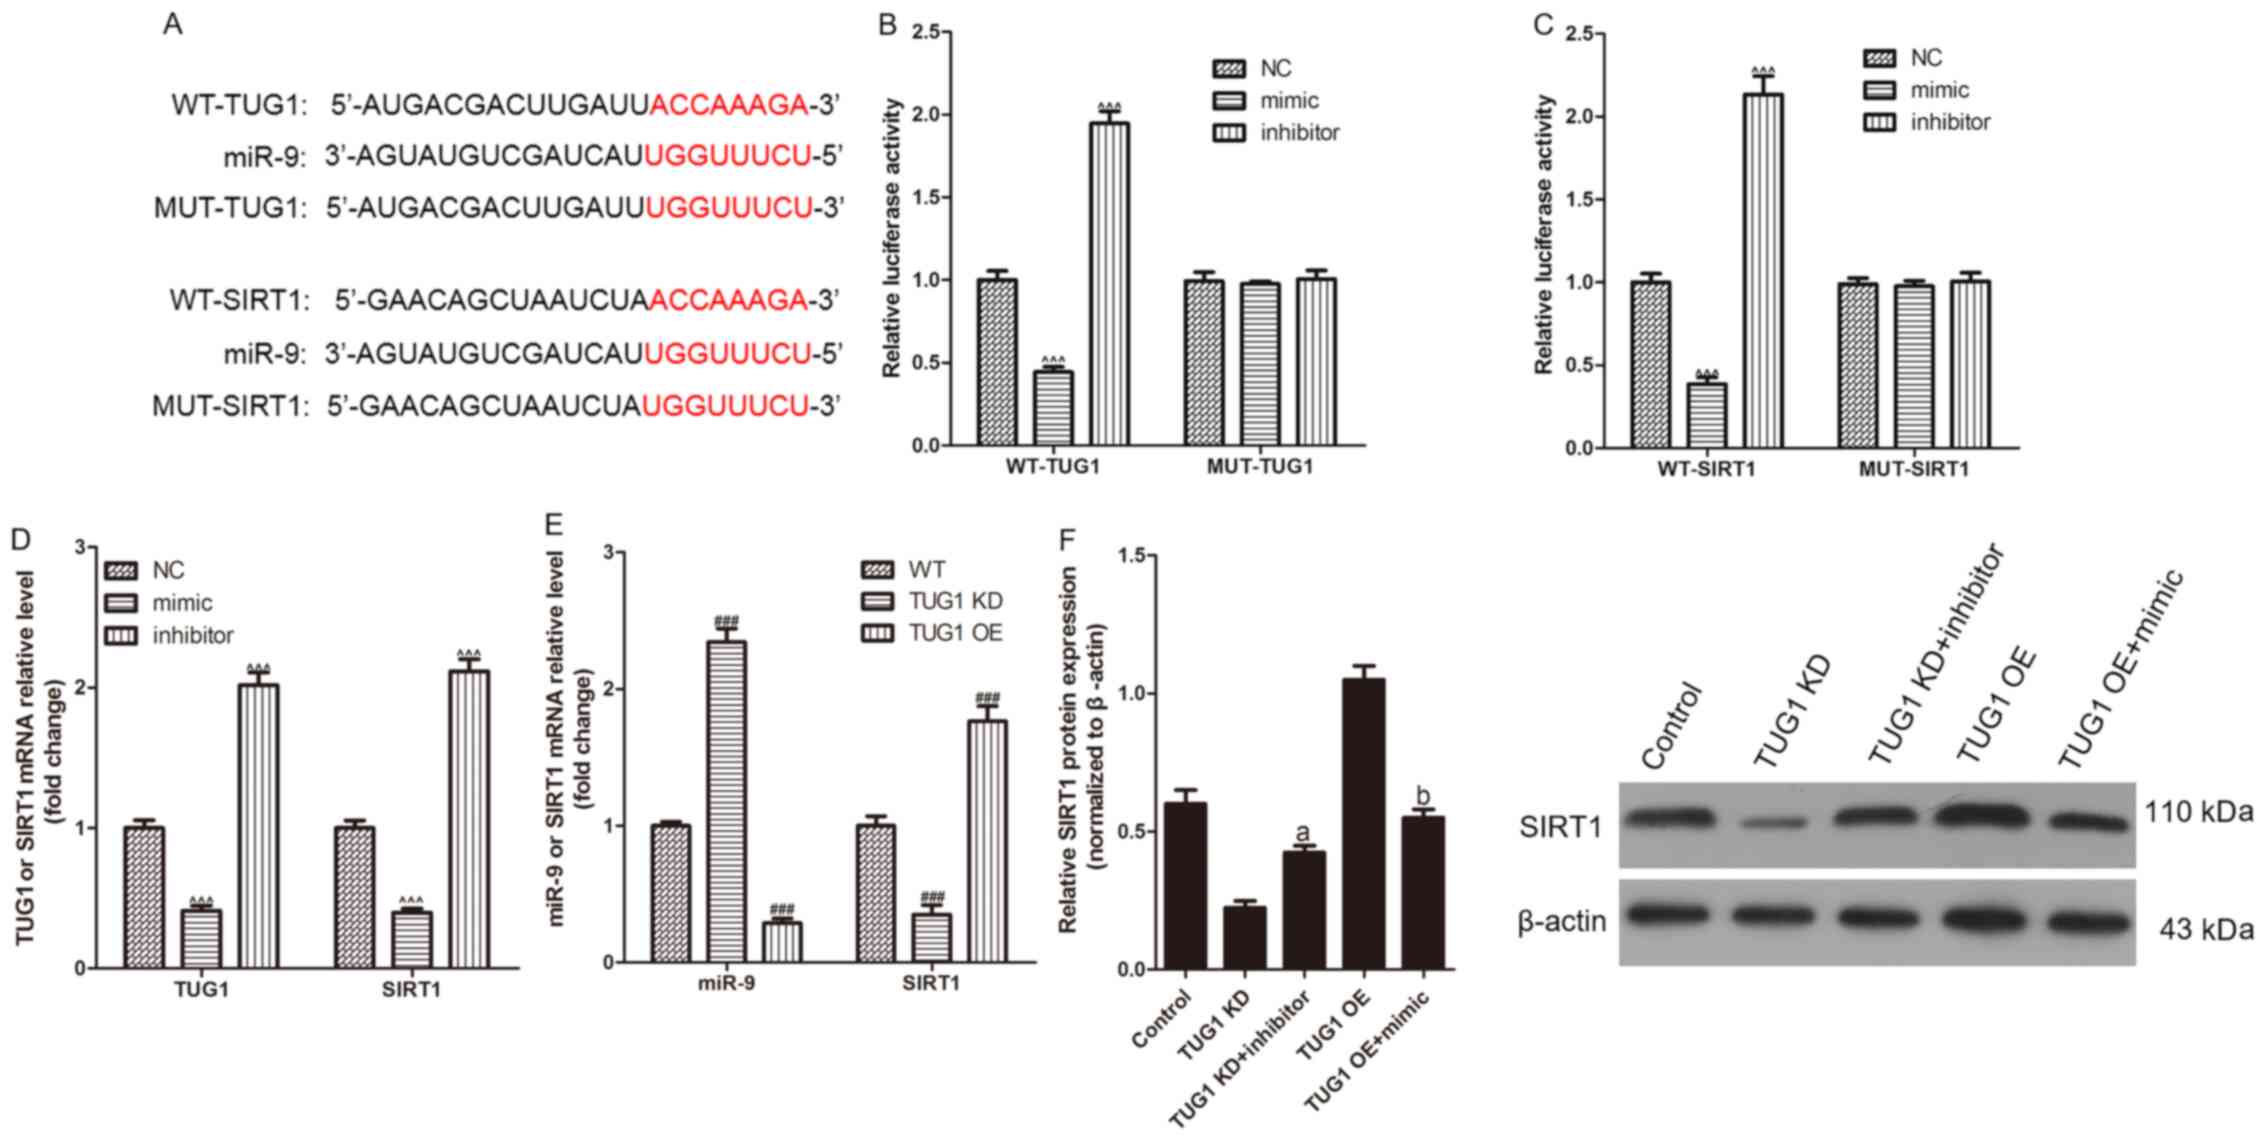 | Figure 4TUG1 promotes SIRT1 expression by
inhibiting miR-9 in mouse podocyte clonal cells. (A) Predicted
binding sequence of miR-9/TUG1 and miR-9/SIRT1, including WT and
MUT types. WT or MUT sequence of (B) TUG1 or (C) SIRT1 which was
predicted to bind to miR-9 were co-transfected into podocytes with
NC, mimic or inhibitor, and then luciferase activity was measured.
mRNA expression levels of (D) TUG1 and SIRT1 after transfection
with miR-9 mimic or inhibitor, and (E) miR-9 and SIRT1 after
transfection of TUG1 KD or OE, as determined by reverse
transcription-quantitative PCR. (F) Western blotting was used to
detect the protein expression levels of SIRT1 in podocytes treated
with TUG1 KD, TUG1 KD + miR-9 inhibitor, TUG1 OE and TUG1 OE +
miR-9 mimic. Each experiment was repeated at least three times, and
data are presented as the mean ± SD. P-values were calculated using
one-way ANOVA followed by Tukey's post hoc test, or Student's
t-test accordingly. ^^^P<0.001 vs. NC group;
###P<0.001 vs. WT group; aP<0.001 vs.
TUG1 KD group; bP<0.001 vs. TUG1 OE group. miR,
microRNA; SIRT1, sirtuin 1; TUG1, taurine-upregulated gene 1; KD,
knockdown; OE, overexpression; WT, wild-type; MUT, mutated; HG,
high glucose; NC, negative control. |
TUG1 protects HG-induced podocytes by
upregulating SIRT1
Based on the aforementioned data and previous
studies (26,27), it was hypothesized that TUG1
protected podocytes from HG-induced apoptosis and mitochondrial
dysfunction by upregulating SIRT1. To test this hypothesis, AAVs
were used to infect TUG1 KD podocytes in order to overexpress SIRT1
(SIRT1 OE; Fig. S3). After
stimulation with 35 mM glucose for 48 h, podocytes were harvested
to analyze apoptosis using flow cytometry. The results revealed
that, compared with the TUG1 KD group, the percentage of apoptotic
podocytes in TUG1 KD + SIRT1 OE group was significantly decreased
(Fig. 5A and B). In addition, the levels of MitoSOX in
the TUG1 KD + SIRT1 OE group were significantly lower than those in
the TUG1 KD group (Fig. S4). The
levels of complex I and III activity, and basal and maximal OCR in
the TUG1 KD + SIRT1 OE group were significantly higher than those
in the TUG1 KD group (Fig.
5C).
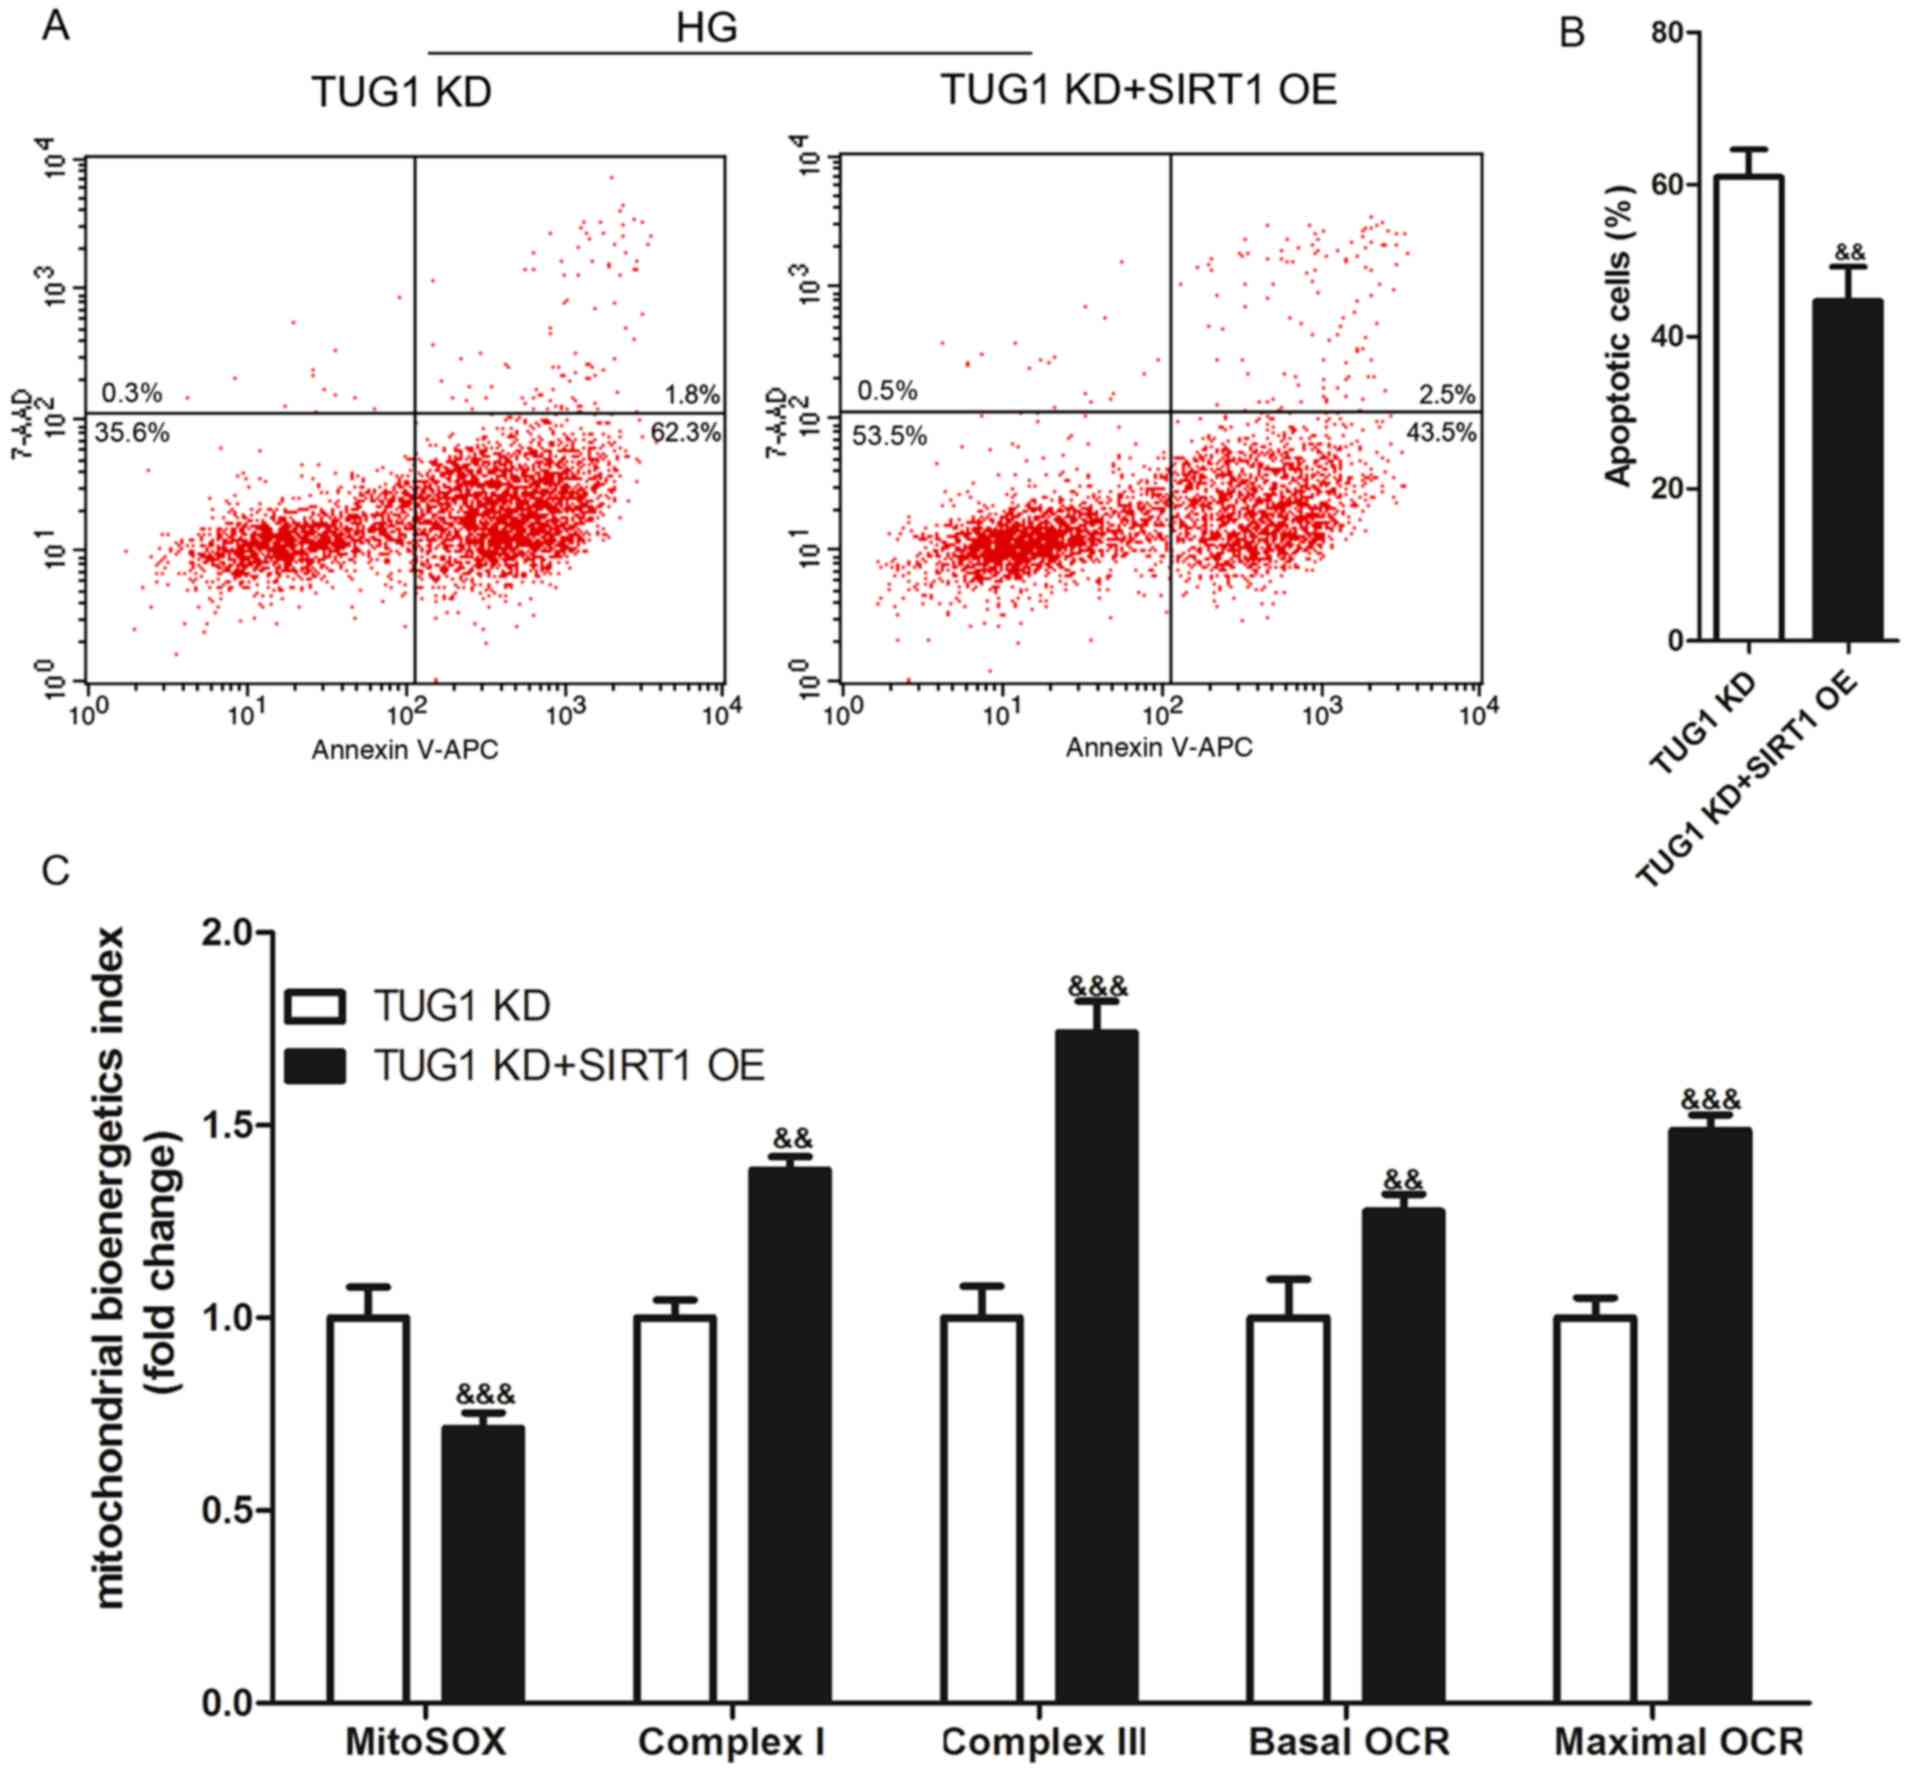 | Figure 5SIRT1 OE reverses HG-induced
apoptosis and mitochondrial dysfunction exacerbated by TUG1 KD in
mouse podocyte clonal cells. After podocytes were incubated with 35
mM glucose for 48 h, apoptosis was detected using flow cytometry.
(A) Representative flow cytometry analysis plots and (B)
statistical analysis of apoptosis. (C) Levels of mitochondrial
superoxide production, complex I and III activities, and basal and
maximal OCR were determined to assess mitochondrial function. Each
experiment was repeated at least three times, and data are
presented as the mean ± SD. P-values were calculated using an
unpaired Student's t-test. &&P<0.01 and
&&&P<0.001 vs. TUG1 KD group. SIRT1,
sirtuin 1; TUG1, taurine-upregulated gene 1; KD, knockdown; OE,
overexpression; HG, high glucose; OCR, oxygen consumption rate. |
Discussion
A total of 75% of human genomic DNA is transcribed
into RNA, but only 2% of RNA encode proteins, and 98% of
transcripts are ncRNAs (28,29).
Single-stranded RNAs with a length of 20-24 nucleotides are called
non-coding single-stranded RNA molecules, while an ncRNA with a
length of >200 nucleotides is called a lncRNA (28,29).
lncRNAs were originally considered to be ‘junk’ RNA, but previous
research has indicated that lncRNAs serve an important role in
several activities, such as the dose compensation effect in which
the genetic effects of the same phenotype appear in individuals
with two or more copies of the gene and individuals with only one
gene (30), as well as epigenetic,
cell cycle and cell differentiation regulation (17,31).
TUG1 lncRNA has been reported to be related to DKD (8,32).
In the present study, an in vitro HG podocyte
damage model was established and TUG1 expression was quantified
using RT-qPCR. The present results indicated that HG decreased TUG1
expression in a dose-dependent manner. TUG1 KD aggravated, and TUG1
OE reversed the apoptosis caused by HG in podocytes, suggesting
that TUG1 protected podocytes from HG-induced apoptosis. Consistent
with the present results, a previous study linked TUG1 with
HG-induced podocyte damage, Lei et al (33) reported that the expression levels
of TUG1 were decreased in DKD tissues and HG-treated podocytes, and
that TUG1 could alleviate HG-induced podocyte apoptosis in
vitro. Additionally, TUG1 could be used as a drug target to
attenuate podocyte apoptosis and protect diabetic rats from DKD
(34). Taken together, the
previous studies and the present results demonstrated that TUG1
protected podocytes from HG-induced apoptosis.
The maintenance of normal functions of all cells is
closely related to mitochondria. Mitochondria carry out aerobic
respiration, and they participate in the processes of cell
proliferation, differentiation, apoptosis and information
transmission between cells (34).
Podocyte damage is a key hallmark of DKD progression, and the
peculiarities of the structure and function of the multi-stage foot
process of the podocyte make it an energy-intensive cell (2). A large number of mitochondria can be
found in both the foot processes and cell bodies of podocytes, and
most of the energy required for the cell to function normally is
obtained through oxidative phosphorylation in mitochondria; as a
result, mitochondrial dysfunction serves an important role in
podocyte damage in DKD (3,4). In addition, TUG1 has been reported to
be involved in the regulation of mitochondrial bioenergetics in
diabetic nephropathy (7). In the
present study, the effect of TUG1 expression on mitochondrial
bioenergetics of podocytes was assessed following HG stimulation.
The present results indicated that HG induced mitochondrial
dysfunction in podocytes, TUG1 KD aggravated this dysfunction and
TUG1 OE reversed it.
As a lncRNA, TUG1 is not translated into a protein.
Therefore, regulatory genes downstream of TUG1 were selected to
study the molecular mechanisms regulating HG-induced mitochondrial
dysfunction and apoptosis in podocytes. In the present study, miR-9
and SIRT1 were selected as potential downstream genes for TUG1, as
numerous previous studies have reported associations between TUG1,
miR-9, SIRT1 and mitochondrial function (21-24).
The present study reported that TUG1 promoted SIRT1 expression by
sponging miR-9, and SIRT1 OE reversed the HG-induced apoptosis and
mitochondrial dysfunction worsened by TUG1 KD.
In the present study, HG decreased TUG1 expression
in a dose-dependent manner, and TUG1 OE reversed the mitochondrial
dysfunction and apoptosis caused by HG in podocytes. In addition,
TUG1 was revealed to upregulate SIRT1 expression through sponging
miR-9, and SIRT1 OE decreased the apoptosis in HG-induced TUG1 KD
podocytes. In conclusion, it was revealed that lncRNA TUG1
regulated HG-induced apoptosis and mitochondrial dysfunction via
the miR-9/SIRT1 axis, and this revealed a molecular mechanism of
podocyte apoptosis and mitochondrial dysfunction regulation, and
provided potential targets for diabetic nephropathy prevention and
treatment.
Supplementary Material
Transfection efficiency of TUG1 (A) KD
and (B) OE in mouse podocyte clonal cells. RT-qPCR analysis
indicated that transfection did not affect the expression of TUG1.
Each experiment was repeated at least three times, and data are
presented as the mean ± SD. P-values were calculated using one-way
ANOVA followed by Tukey's post hoc test. nsP>0.05 vs.
WT group; ***P<0.001 vs. si-NC group;
###P<0.001 vs. NC-AAV group. WT, wild-type; TUG1,
taurine-upregulated gene 1; KD, knockdown; OE, overexpression; NC,
negative control, si, small interfering RNA; AAV, adeno-associated
virus.
Transfection efficiency of (A) the
miR-9-mimic and (B) the miR-9-inhibitor. RT-qPCR analysis indicated
that transfection did not affect the expression of miR-9. Each
experiment was repeated at least three times, and data are
presented as the mean ± SD. P-values were calculated using one-way
ANOVA followed by Tukey's post hoc test. nsP>0.05 vs.
WT group; aaaP<0.001 vs. mimic-NC group;
bbbP<0.001 vs. inhibitor-NC group. NC, negative
control; miR, microRNA; WT, wild-type.
Transfection efficiency of SIRT1
overexpression in mouse podocyte clonal cells. Each experiment was
repeated at least three times, and data are presented as the mean ±
SD. P-values were calculated using one-way ANOVA followed by
Tukey's post hoc test. nsP>0.05 vs. WT group;
###P<0.001 vs. NC-AAV group. SIRT1, sirtuin 1; WT,
wild-type; NC, negative control; AAV, adeno-associated virus.
Representative MitoSOX™
staining images (magnification, x800). SIRT1, sirtuin 1; TUG1,
taurine-upregulated gene 1; KD, knockdown; OE, overexpression; HG,
high glucose.
Acknowledgements
Not applicable.
Funding
Funding: No funding was received.
Availability of data and materials
The datasets used and/or analyzed during the current
study are available from the corresponding author on reasonable
request.
Authors' contributions
YH made substantial contributions to the conception
and design of the present study. ML, GK, YW and DL acquired the
data, and analyzed and interpreted the data. ML and YH drafted the
article and revised it critically for important intellectual
content. All authors agreed to submit to the current journal, and
agreed to be accountable for all aspects of the work. ML and YH
confirm the authenticity of all the raw data. All authors have read
and approved the final manuscript.
Ethics approval and consent to
participate
Not applicable.
Patient consent for publication
Not applicable.
Competing interests
The authors declare that they have no competing
interests.
References
|
1
|
Alicic RZ, Rooney MT and Tuttle KR:
Diabetic kidney disease: Challenges, progress, and possibilities.
Clin J Am Soc Nephrol. 12:2032–2045. 2017.PubMed/NCBI View Article : Google Scholar
|
|
2
|
Altintas MM and Reiser J: Podocytes: Way
to Go. Am J Pathol. 189:226–228. 2019.PubMed/NCBI View Article : Google Scholar
|
|
3
|
Lin JS and Susztak KJ: Podocytes: the
weakest link in diabetic kidney disease? Curr Diab Rep.
16(45)2016.PubMed/NCBI View Article : Google Scholar
|
|
4
|
Forbes JM and Thorburn DR: Mitochondrial
dysfunction in diabetic kidney disease. Nat Rev Nephrol.
14:291–312. 2018.PubMed/NCBI View Article : Google Scholar
|
|
5
|
Wei PZ and Szeto CC: Mitochondrial
dysfunction in diabetic kidney disease. Clin Chim Acta.
496:108–116. 2019.PubMed/NCBI View Article : Google Scholar
|
|
6
|
Piwkowska A, Rogacka D, Jankowski M,
Dominiczak MH, Stepiński JK and Angielski S: Metformin induces
suppression of NAD (P) H oxidase activity in podocytes. Biochem
Biophys Res Commun. 393:268–273. 2010.PubMed/NCBI View Article : Google Scholar
|
|
7
|
Lee SH, Moon SJ, Paeng J, Kang HY, Nam BY,
Kim S, Kim CH, Lee MJ, Oh HJ, Park JT, et al: Podocyte hypertrophy
precedes apoptosis under experimental diabetic conditions.
Apoptosis. 20:1056–1071. 2015.PubMed/NCBI View Article : Google Scholar
|
|
8
|
Long J, Badal SS, Ye Z, Wang Y, Ayanga BA,
Galvan DL, Green NH, Chang BH, Overbeek PA and Danesh FR: Long
noncoding RNA Tug1 regulates mitochondrial bioenergetics in
diabetic nephropathy. J Clin Invest. 126:4205–4218. 2016.PubMed/NCBI View
Article : Google Scholar
|
|
9
|
Yue P, Jing L, Zhao X, Zhu H and Teng J:
Down-regulation of taurine-up-regulated gene 1 attenuates
inflammation by sponging miR-9-5p via targeting NF-κB1/p50 in
multiple sclerosis. Life Sci. 233(116731)2019.PubMed/NCBI View Article : Google Scholar
|
|
10
|
Hong Q, Zhang L, Das B, Li Z, Liu B, Cai
G, Chen X, Chuang PY, He JC and Lee K: Increased podocyte Sirtuin-1
function attenuates diabetic kidney injury. Kidney Int.
93:1330–1343. 2018.PubMed/NCBI View Article : Google Scholar
|
|
11
|
Zhang Y, Chang B, Zhang J and Wu X: LncRNA
SOX2OT alleviates the high glucose-induced podocytes injury through
autophagy induction by the miR-9/SIRT1 axis. Exp Mol Pathol.
110(104283)2019.PubMed/NCBI View Article : Google Scholar
|
|
12
|
Cai X, Bao L, Ren J, Li Y and Zhang Z:
Grape seed procyanidin B2 protects podocytes from high
glucose-induced mitochondrial dysfunction and apoptosis via the
AMPK-SIRT1-PGC-1α axis in vitro. Food Funct. 7:805–815.
2016.PubMed/NCBI View Article : Google Scholar
|
|
13
|
Lei X, Zhang L, Li Z and Ren J:
Astragaloside IV/lncRNA-TUG1/TRAF5 signaling pathway participates
in podocyte apoptosis of diabetic nephropathy rats. Drug Des Devel
Ther. 12:2785–2793. 2018.PubMed/NCBI View Article : Google Scholar
|
|
14
|
Chen J, Gui D, Chen Y, Mou L, Liu Y and
Huang J: Astragaloside IV improves high glucose-induced podocyte
adhesion dysfunction via alpha3beta1 integrin upregulation and
integrin-linked kinase inhibition. Biochem Pharmacol. 76:796–804.
2008.PubMed/NCBI View Article : Google Scholar
|
|
15
|
Livak KJ and Schmittgen TD: Analysis of
relative gene expression data using real-time quantitative PCR and
the 2(-ΔΔC(T)) method. Methods. 25:402–408. 2001.PubMed/NCBI View Article : Google Scholar
|
|
16
|
Chen ZZ, Huang L, Wu YH, Zhai WJ and Gao
YF: LncSox4 promotes the self-renewal of liver tumour-initiating
cells through Stat3-mediated Sox4 expression. Nat Commun.
7(12598)2016.PubMed/NCBI View Article : Google Scholar
|
|
17
|
Jie Tao J, Zhang J, Ling Y, McCall CE and
Liu TF: Mitochondrial Sirtuin 4 resolves immune tolerance in
monocytes by rebalancing glycolysis and glucose oxidation
homeostasis. Front Immunol. 9(419)2018.PubMed/NCBI View Article : Google Scholar
|
|
18
|
Long J, Badal SS, Ye Z, Wang Y, Ayanga BA,
Galvan DL, Green NH, Chang BH, Overbeek PA and Danesh FR: Long
noncoding RNA Tug1 regulates mitochondrial bioenergetics in
diabetic nephropathy. J Clin Invest. 126:4205–4218. 2016.PubMed/NCBI View
Article : Google Scholar
|
|
19
|
Maestroni S and Zerbini G: Glomerular
endothelial cells versus podocytes as the cellular target in
diabetic nephropathy. Acta Diabetol. 55:1105–1111. 2018.PubMed/NCBI View Article : Google Scholar
|
|
20
|
Shang X, Ji X, Dang J, Wang L, Sun C, Liu
K, Sik A and Jin M: α-asarone induces cardiac defects and QT
prolongation through mitochondrial apoptosis pathway in zebrafish.
Toxicol Lett. 324:1–11. 2020.PubMed/NCBI View Article : Google Scholar
|
|
21
|
Yang B, Chen Y and Shi J: Reactive oxygen
species (ROS)-based nanomedicine. Chem Rev. 119:4881–4985.
2019.PubMed/NCBI View Article : Google Scholar
|
|
22
|
Turrens JF: Mitochondrial formation of
reactive oxygen species. J Physiol. 552:335–344. 2003.PubMed/NCBI View Article : Google Scholar
|
|
23
|
Wang S, Cheng M, Zheng X, Zheng L, Liu H,
Lu J, Liu Y and Chen W: Interactions between lncRNA TUG1 and miR-9
modulate the resistance of breast cancer cells to doxorubicin by
regulating eIF5A2. Onco Targets Ther. 13:13159–13170.
2020.PubMed/NCBI View Article : Google Scholar
|
|
24
|
Zhang Y, Chang B, Zhang J and Wu X: LncRNA
SOX2OT alleviates the high glucose-induced podocytes injury through
autophagy induction by the miR-9/SIRT1 axis. Exp Mol Pathol.
110(104283)2019.PubMed/NCBI View Article : Google Scholar
|
|
25
|
Lagouge M, Argmann C, Gerhart-Hines Z,
Meziane H, Lerin C, Daussin F, Messadeq N, Milne J, Lambert P,
Elliott P, et al: Resveratrol improves mitochondrial function and
protects against metabolic disease by activating SIRT1 and PGC-1α.
Cell. 127:1109–1122. 2006.PubMed/NCBI View Article : Google Scholar
|
|
26
|
Yousuf S, Atif F, Ahmad M, Hoda N, Ishrat
T, Khan B and Islam F: Resveratrol exerts its neuroprotective
effect by modulating mitochondrial dysfunctions and associated cell
death during cerebral ischemia. Brain Res. 1250:242–253.
2009.PubMed/NCBI View Article : Google Scholar
|
|
27
|
Zhao Y, Li H, Fang S, Kang Y, Wu W, Hao Y,
Li Z, Bu D, Sun N, Zhang MQ, et al: NONCODE 2016: an informative
and valuable data source of long non-coding RNAs. Nucleic Acids
Res. 44:D203–D208. 2016.PubMed/NCBI View Article : Google Scholar
|
|
28
|
Ulitsky I: Evolution to the rescue: using
comparative genomics to understand long non-coding RNAs. Nat Rev
Genet. 17:601–614. 2016.PubMed/NCBI View Article : Google Scholar
|
|
29
|
Militti C, Maenner S, Becker PB and
Gebauer F: UNR facilitates the interaction of MLE with the lncRNA
roX2 during Drosophila dosage compensation. Nat Commun.
5(4762)2014.PubMed/NCBI View Article : Google Scholar
|
|
30
|
Rinn JL and Chang HY: Long noncoding RNAs:
molecular modalities to organismal functions. Annu Rev Biochem.
89:283–308. 2020.PubMed/NCBI View Article : Google Scholar
|
|
31
|
Li SY and Susztak K: The long noncoding
RNA Tug1 connects metabolic changes with kidney disease in
podocytes. J Clin Invest. 126:4072–4075. 2016.PubMed/NCBI View Article : Google Scholar
|
|
32
|
Li Y, Huang D, Zheng L, Cao H, Gao Y,
Yanga Y and Fan Z: Long non-coding RNA TUG1 alleviates high glucose
induced podocyte inflammation, fibrosis and apoptosis in diabetic
nephropathy via targeting the miR-27a-3p/E2F3 axis. RSC Adv.
9:37620–37629. 2019.
|
|
33
|
Lei X, Zhang L, Li Z and Ren J:
Astragaloside IV/lncRNA-TUG1/TRAF5 signaling pathway participates
in podocyte apoptosis of diabetic nephropathy rats. Drug Des Devel
Ther. 12:2785–2793. 2018.PubMed/NCBI View Article : Google Scholar
|
|
34
|
Roger AJ, Muñoz-Gómez SA and Kamikawa R:
The origin and diversification of mitochondria. Curr Biol.
27:R1177–R1192. 2017.PubMed/NCBI View Article : Google Scholar
|