Introduction
Diquat (1,1'-ethylene-2,2'-bipyridylium) is a type
of widely used agricultural chemical, whose toxicities result in
the damage to numerous tissues, including the lung, liver, kidney
and brain (1). Diquat is a
herbicide that started to be widely used in agricultural production
following the ban of paraquat (2).
As a result, the incidence of rapid acute diquat poisoning has
increased in recent years. Diquat is very toxic to humans, as it
leads to damage of the function of multiple organs, and can even
prove life-threatening (3,4). Diquat is distributed through the
bloodstream to the organs and tissues of the entire body. The liver
and kidney contain the highest concentrations of diquat (5). Research has also found that bile
contains diquat, which indicates that bile may be an effective way
of lowering the concentration of diquat in the serum and tissues of
the human body long after ingestion (6). Redox cycling and consequent reactive
oxygen species (ROS) generation are believed to be key cytotoxic
mechanisms induced by these bipyridyl herbicides. The diquat
radicals are also capable of reacting with a variety of
nucleophiles in cells, causing direct damage to cellular components
(2,7). To date, the treatment method for
diquat poisoning and satisfactory therapeutic effects remain in the
exploratory stages. There is no specific antidote for rapid
poisoning with diquat, as well as no clear therapeutic means of
treatment (4). Key factors that
determine the prognosis of diquat poisoning include whether the
patient goes to the hospital after poisoning, the timely and
effective gastrointestinal treatment and application of blood
purification technology, as well as the timely application of
glucocorticoids to protect organ function (3,8).
Although human exposure to diquat can cause dysfunction or even
multiple organ failure, the liver and kidneys are the major organs
involved, mainly due to the high accumulation of diquat in those
organs after poisoning (9). It is
worth noting that diquat is mainly metabolized in the kidneys;
thus, the kidneys are the main target organ after poisoning
(9,10). In the present study, a rat model of
acute diquat exposure was established following gavage
administration to further unveil the distribution characteristics,
metabolism and organ damage of diquat in the body.
Materials and methods
Experimental animals, dosing, and
blood and tissue collection
Healthy adult SPF male Wistar rats aged 6-8 weeks
and weighing 240-260 g were provided by the Experimental Animal
Center of Shandong University (Jinan, China) [certificate no. SCXK
(Lu) 20130009]. Ethical approval for this experiment was obtained
from the Ethics Committee of Preventive Medicine of Shandong
University (no. 20180225/February 12, 2018). The rats were allowed
to eat and drink freely, and the environmental conditions of the
room were set to maintain a relative humidity of 40-70%, a
temperature of ~26˚C and a 12-h light/dark cycle. The rats were
fasted overnight (~16 h), and were allowed free access to water
prior to treatment.
A total of 140 healthy adult male Wistar rats were
randomly divided into the control and exposure groups. The dose of
the diquat solution intragastrically administered to the exposure
groups was 140 mg/kg (50% of the median lethal dose) (11). An equal volume of normal saline
solution was administered to the control group (n=70). The dynamic
changes in the plasma and tissue diquat levels were quantitatively
determined by liquid chromatography mass spectrometry at 0.5, 1, 2,
4, 8, 16 and 24 h after poisoning (n=10 per time point).
Approximately 5 ml of blood was taken from the inferior vena cava
for serological tests. Blood was collected following cervical
dislocation under anesthesia. The blood was placed in a short
purple tube (containing an EDTA anticoagulant). Following
centrifugation, the plasma was collected and frozen at -80˚C for
serum concentration and renal function analyses. Left lung and left
kidney tissues were collected to determine the tissue diquat
content using electron microscopy (Zeiss Axio Scope A1 Microscope;
Carl Zeiss AG) and for western blot analysis. The right lung and
right kidney tissues were used for pathological examination and
fixed in a paraformaldehyde solution with a mass volume fraction of
4%. Conventional paraffin was used for embedding, and the tissue
was sectioned. Following hematoxylin and eosin (H&E) and Masson
staining, the sections were observed using the IX53 and DP73
upright fluorescence microscopes (Olympus Corp.). In addition, the
lung tissue was used to determine the hydroxyproline (HYP) content
using a commercial kit from the Nanjing Jiancheng Bioengineering
Institute (cat. no. A030-2).
Humane endpoints
The rats were anesthetized at the established time
points (0.5, 1, 2, 4, 8, 16 and 24 h). The animals were
anaesthetized through an intraperitoneal injection of 10% chloral
hydrate (300 mg/kg). The rats were euthanized by cervical
dislocation immediately after anesthesia. At that time, peritonitis
had not developed in the rats.
Establishment of the standard
curve
The peak area of diquat was used as the
y-coordinate, the concentration of diquat was plotted on the
abscissa and the weighting coefficient (1/x2) was used
to obtain a standard curve.
Detection of various kidney
indexes
Creatinine (Cr), blood urea nitrogen (BUN) and uric
acid (UA) were detected using an automatic biochemical analyzer
[Cobas® 8000 detection system (775 module); Roche
Diagnostics GmbH] at Qilu Hospital, Shandong University (Jinan,
China). BUN was used for the urease method, and UA and Cr were used
for the enzyme method.
ELISA and western blot analysis
The tissue block was washed with pre-cooled PBS for
2-3 times, two 3-mm homogenization beads were added, 10 times the
tissue volume of lysis buffer (Servicebio G2002) was added for
homogenization, and then the lysis buffer was placed on ice for 30
min. After complete lysis, centrifugation at 12,000 rpm was carried
out for 10 min at 4˚C, the supernatant was collected, and the
protein concentration was measured with a BCA protein concentration
test kit. Reduced protein loading buffer was added to the protein
solution at a ratio of 4:1, denatured in a boiling water bath for
15 min, and stored at -20˚C for later use. The proteins were
separated by 10% SDS-PAGE, transferred to PVDF membranes, blocked
with 5% skim milk in TBST buffer (20% Tween) for 30 min at room
temperature, and then incubated with the primary antibody overnight
at 4˚C. The primary antibody dilution ratio was 1:1,000 and it
included KIM-1 (Abbexa, cat. no. ABX102459), TGF-β1 (Abcam, cat.
no. AB92486), and actin (Servicebio). Membranes were then washed
three times with TBST and incubated with secondary antibodies
peroxidase-conjugated goat anti-rabbit IgG (H+L) (Servicebio, cat.
no. GB23303), peroxidase-conjugated donkey anti-goat IgG (H+L)
(Servicebio, cat. no. GB23404), peroxidase-conjugated goat
anti-mouse IgG (H+L) (Servicebio, cat. no. GB23301),
peroxidase-conjugated goat anti-rat IgG (H+L) (Servicebio, cat. no.
GB23302) at room temperature. The protein bands were observed using
ECL (Servicebio, cat. no. G2014). The semi-quantitative expression
was measured by densitometry analysis using AlphaEaseFC 5.0
software (Alpha Innotech), and normalized to the expression of
actin.
Statistical analyses
All experiments were performed independently at
least 3 times. Data are presented as mean ± standard deviation of
three replicates. SPSS17.0 statistical analysis software (SPSS
Inc.) was used to conduct normality test, variance homogeneity
test, one-way ANOVA and repeated measures analysis of variance for
the experimental data. For pairwise comparisons, Dunnett's T3 was
used when the variances were unequal, and LSD was used when the
variances were homogeneous.
Results
H&E staining in the lung and renal
tissues
Fig. 1 shows
H&E staining in lung tissues in the control (a), and at times
0.5 (b), 1 (c), 2 (d), 4 (e), 8 (f), 16 (g) and 24 h (h) after
diquat exposure. In the exposure groups, H&E staining showed
that the alveolar walls were dilated and hyperaemic, and the
alveolar spaces were slightly widened. Infiltration by
polymorphonuclear leukocytes and mononuclear macrophages was
visible, and the alveolar cavities were clean, cell-free and
structurally intact. Inflammatory cell infiltration between the
pulmonary alveoli was comparable 8, 16 and 24 h after
administration, and the pulmonary alveoli were wider than
previously measured. Part of the alveolar structure was disordered,
and the alveolar cavities had disappeared (Fig. 1).
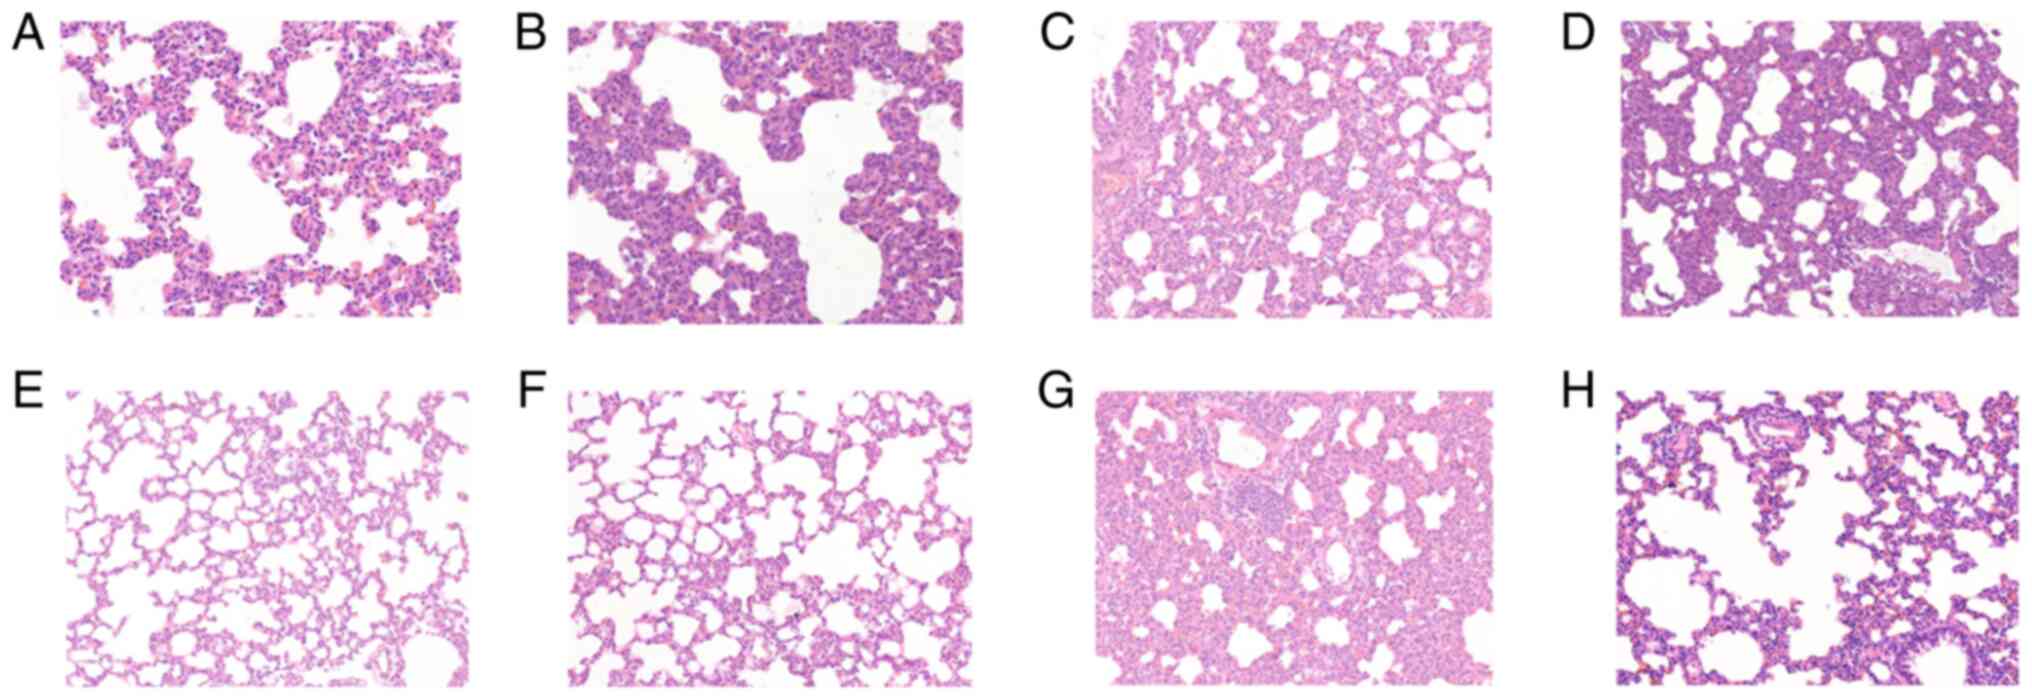 | Figure 1Results of hematoxylin and eosin
(H&E) staining in lung tissues. Light microscopic observation
of lung pathological sections at each time point (A-H shows the
control, and at times 0.5, 1, 2, 4, 8, 16 and 24 h in lung tissue
after diquat exposure; magnification, x200). (A) In the control
group, the alveolar walls were dilated and hyperaemic, and the
alveolar spaces were slightly widened. Infiltration by
polymorphonuclear leukocytes and mononuclear macrophages was
visible. At (B) 0.5, (C) 1, (D) 2 and (E) 4 h, the alveolar
cavities were clean, cell-free and structurally intact. At (F) 8,
(G) 16 and (H) 24 h, the pulmonary alveoli were wider than
previously measured. Part of the alveolar structure was disordered,
and the alveolar cavities had disappeared. |
Fig. 2 shows the
results of H&E staining in renal tissues. Light microscopic
observation of renal pathological sections in the control (a), and
at times 0.5 (b), 1 (c), 2 (d), 4 (e), 8 (f), 16 (g) and 24 h (h)
after diquat exposure is shown. Under microscopic examination, the
renal interstitium was not found to be congested in the control
group at any time point. The glomerular basement membrane was
intact, and the renal tubules had clear borders, with no exfoliated
cells in the lumen. Pathological changes, such as inflammatory cell
infiltration and fibrous tissue hyperplasia, were rare in the
stroma. In the exposure group, renal tubular epithelial cells
exhibited hydropic degeneration, and a small number of casts were
observed in the lumen. The glomerular mesentery basement membrane
was slightly thickened and partial glomerular atrophy was observed.
The renal tissue exhibited oedema, and the kidney tubules were
notably widened. After 16 and 24 h, mesenchymal inflammatory cell
infiltration was observed (Fig.
2).
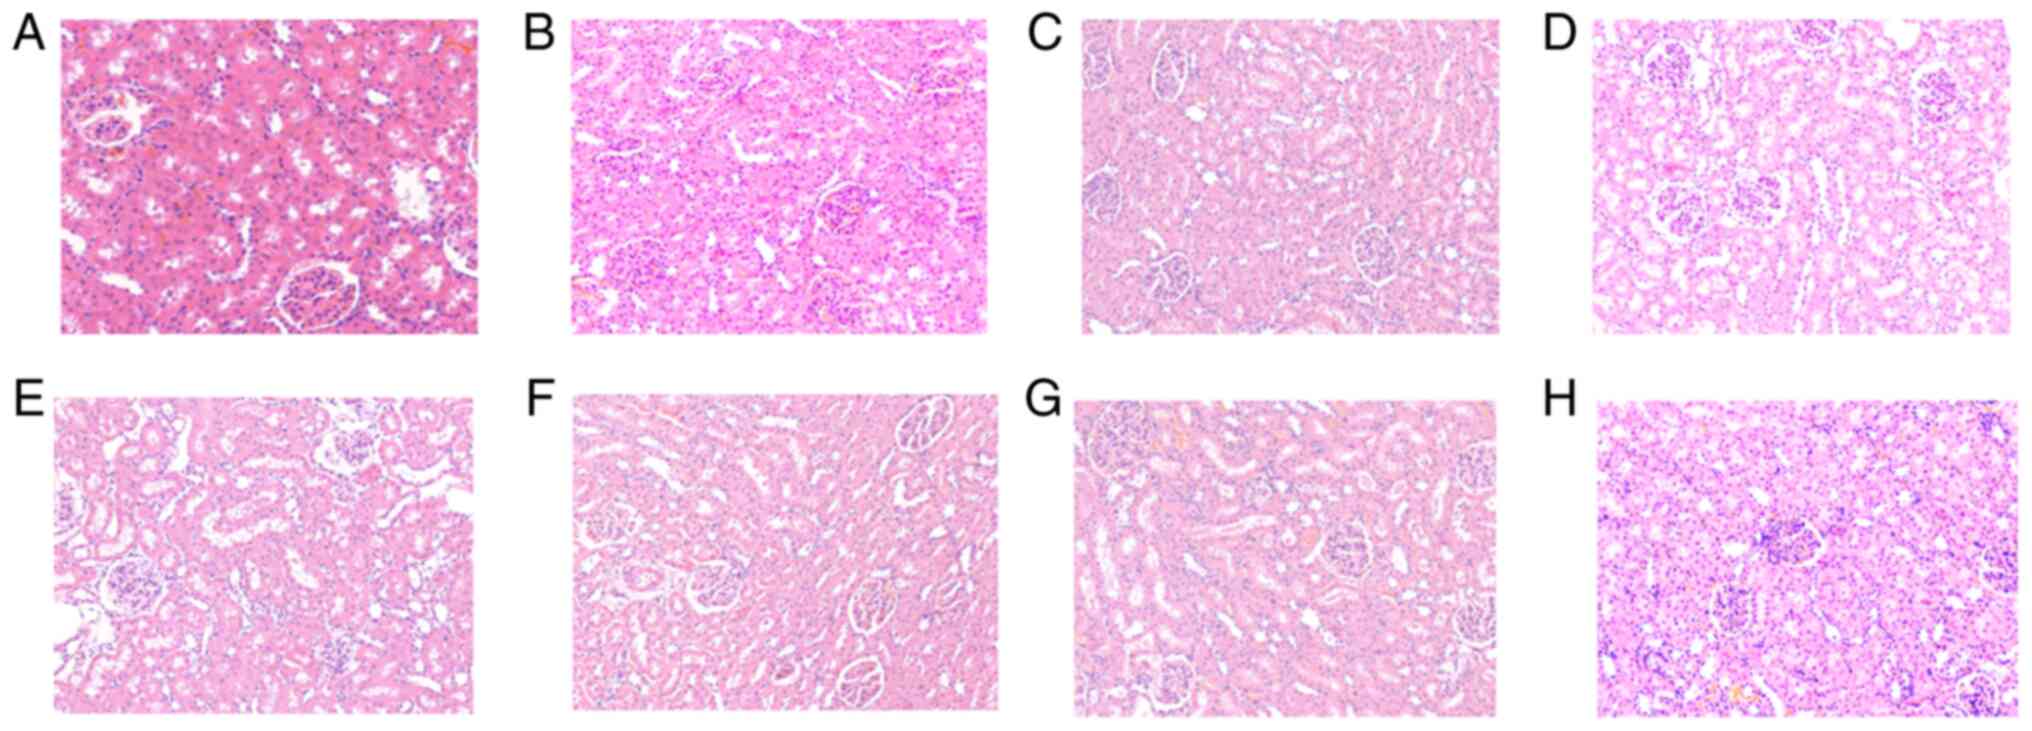 | Figure 2Results of hematoxylin and eosin
(H&E) staining in renal tissues. Light microscopic observation
of renal pathological sections at each time point (A-H shows the
control, and at times 0.5, 1, 2, 4, 8, 16 and 24 h in renal tissue
after diquat exposure; magnification, x200). (A) In the control
group, there was no congestion observed at any time point. The
glomerular basement membrane was intact, and the renal tubules had
clear borders, with no exfoliated cells in the lumen. Pathological
changes, such as inflammatory cell infiltration and fibrous tissue
hyperplasia, were rare in the stroma. At (B) 0.5, (C) 1 and (D) 2
h, renal tubular epithelial cells exhibited hydropic degeneration,
and a small number of casts were observed in the lumen. At (E) 4
and (F) 8 h, the glomerular mesentery basement membrane was
slightly thickened and partial glomerular atrophy was observed. The
renal tissue exhibited oedema, and the kidney tubules were notably
widened. At (G) 16 and (H) 24 h, mesenchymal inflammatory cell
infiltration was observed. |
Electron microscopy observation of the
lung tissue
After 0.5 h, a large number of organelles were
observed in the cytoplasm of the lung type II alveolar cells using
electron microscopy (Fig. 3), and
a number of organelles were shown to be swollen. After 2 h, a small
number of microvilli appeared locally in the cell membrane and an
abundance of organelles were observed in the cytoplasm. The
abundance of organelles were notably swollen and dilated after 8 h.
After 16 h, the cell membrane of the type II lung alveolar cells
had partially disappeared. After 24 h, the cell membrane was
partially blurred, and abundant and slightly swollen organelles
(slightly milder than at 16 h) were observed in the cytoplasm.
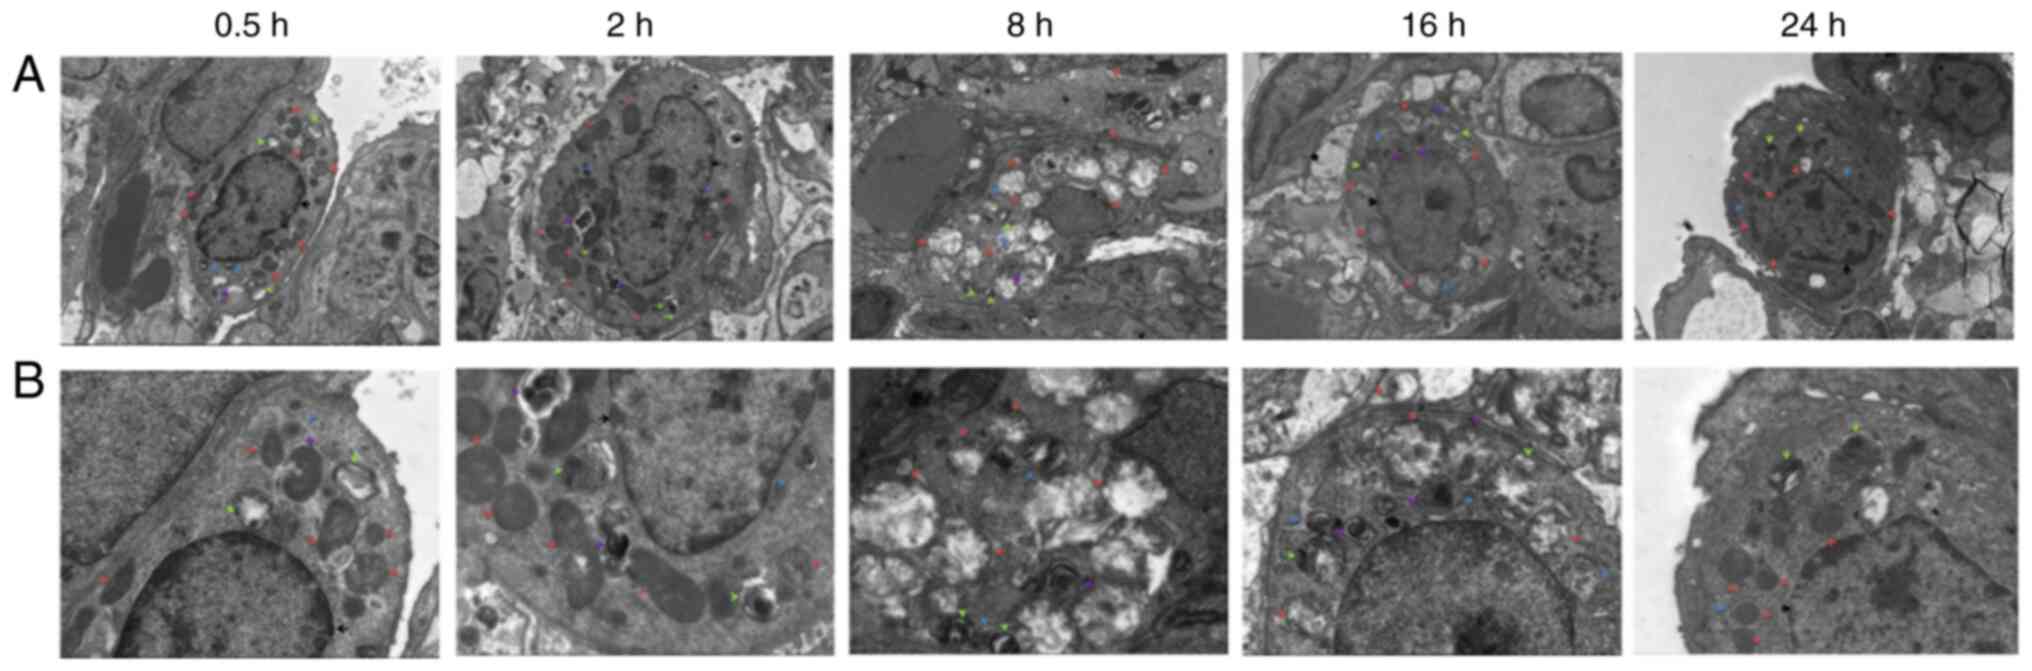 | Figure 3Electron microscopy observation of
lung tissue at each time point. (A) Electron microscopy of lung
tissue at 0.5, 2, 8, 16 and 24 h after diquat exposure
(magnification, x3,000; scale bar, 5 µm). (B) Electron microscopy
of lung tissue at 0.5, 2, 8, 16 and 24 h after diquat exposure
(magnification, x7,000; scale bar, 2 µm). |
Electron microscopy observation of
renal tissues
Electron microscopy of renal tissues (Fig. 4) revealed relatively intact renal
tubular epithelial cell membranes after 2 h, with an abundance of
organelles and numerous vacuoles in the cytoplasm. After 4 h, the
renal tubular epithelial cells were relatively intact, and an
abundance of organelles was observed in the cytoplasm. The nuclear
membrane was intact, the nucleolus was clearly visible, and the
level of heterochromatin had increased. Mitochondrial swelling and
cytoplasmic vacuolization were observed. After 8 h, the amount of
heterochromatin and lysosomes increased. After 16 h, the
mitochondria were swollen, part of the mitochondrial cristae was
fractured, the podocyte feet were protruded and fused, and the
basement membrane exhibited dense deposition. After 24 h,
cavitation bubbles appeared; the bilayer membrane structure of some
mitochondria had disappeared, podocytic processes of Sertoli cells
were fused, a dense basement membrane deposition was observed, and
the number of lysosomes had increased.
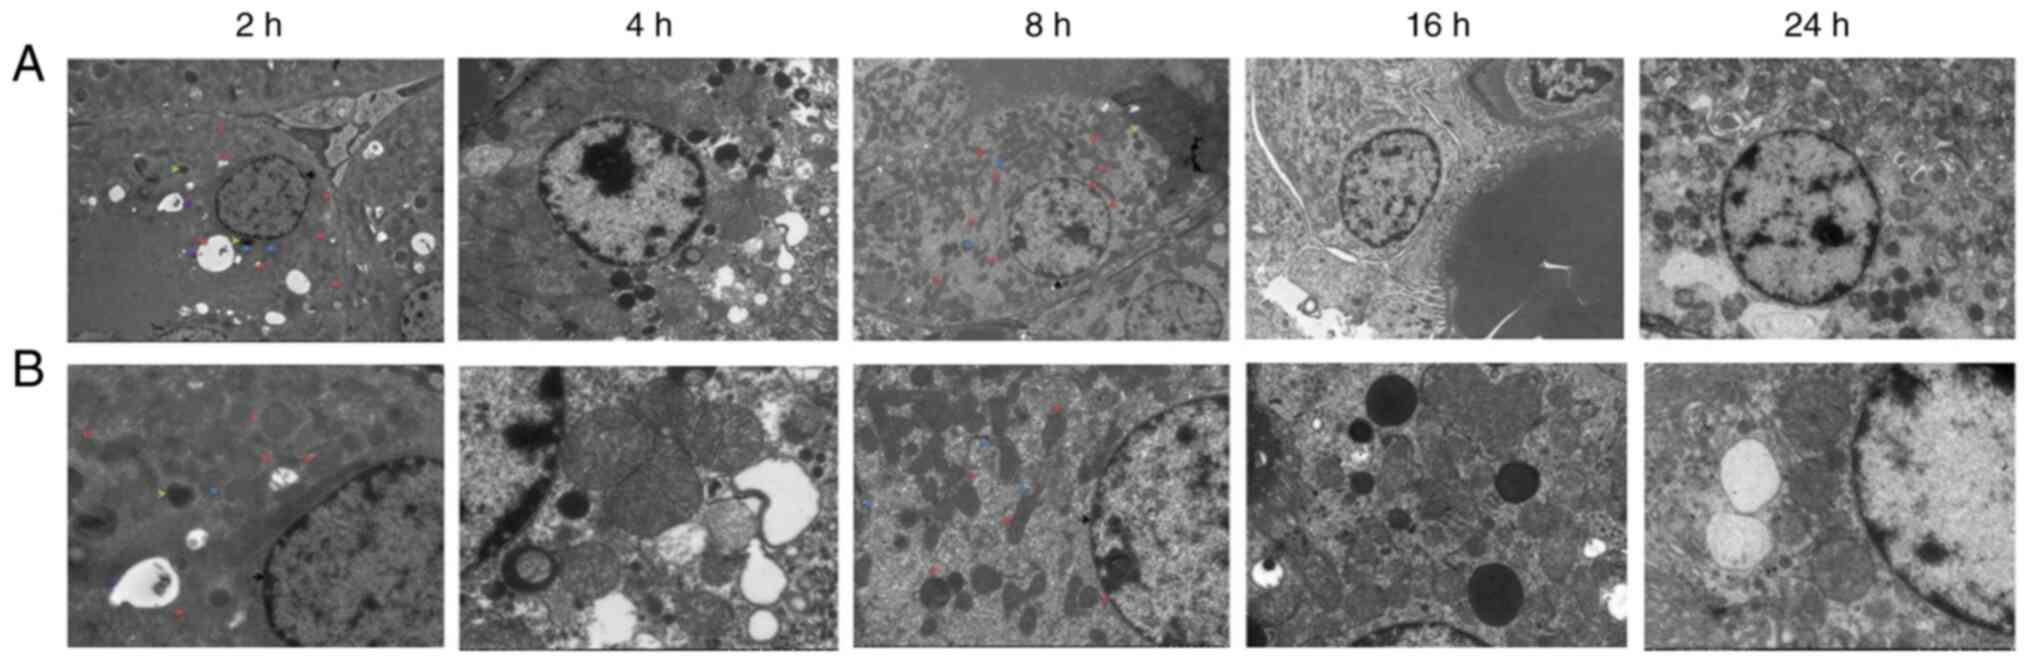 | Figure 4Electron microscopy observation of
renal tissue at each time point. (A) Electron microscopy of renal
tissue at 2, 4, 8, 16 and 24 h after diquat exposure
(magnification, x2,000; scale bar 5 µm). (B) Electron microscopy of
renal tissue at 2, 4, 8, 16 and 24 h after diquat exposure
(magnification, x5,000; scale bar, 2 µm). |
Diquat levels in the plasma, kidney
and lung tissues of rats
The diquat peak was clear and specific under the
chromatographic conditions used in this study, with a retention
time of 6.386 min (Fig. 5A). The
diquat peak area was considered as the y-coordinate, and the
concentration of diquat as the x-coordinate. The weighting factor
(1/x2) was used to perform regression; the standard
curve equation is listed in Table
I. The standard curve of the diquat plasma sample exhibited a
linear relationship at a concentration range of 0.100-5,000 ng/ml,
that of the renal sample at a concentration range of 0.1-200, and
that of the lung at a concentration range of 0.1-100. The lowest
limit of detection, that is, the lowest point of the standard
curve, was 0.1. Results were compared with the standard curve. A
content below the lower limit of detection (undetectable) was
defined as below the limit of quantification.
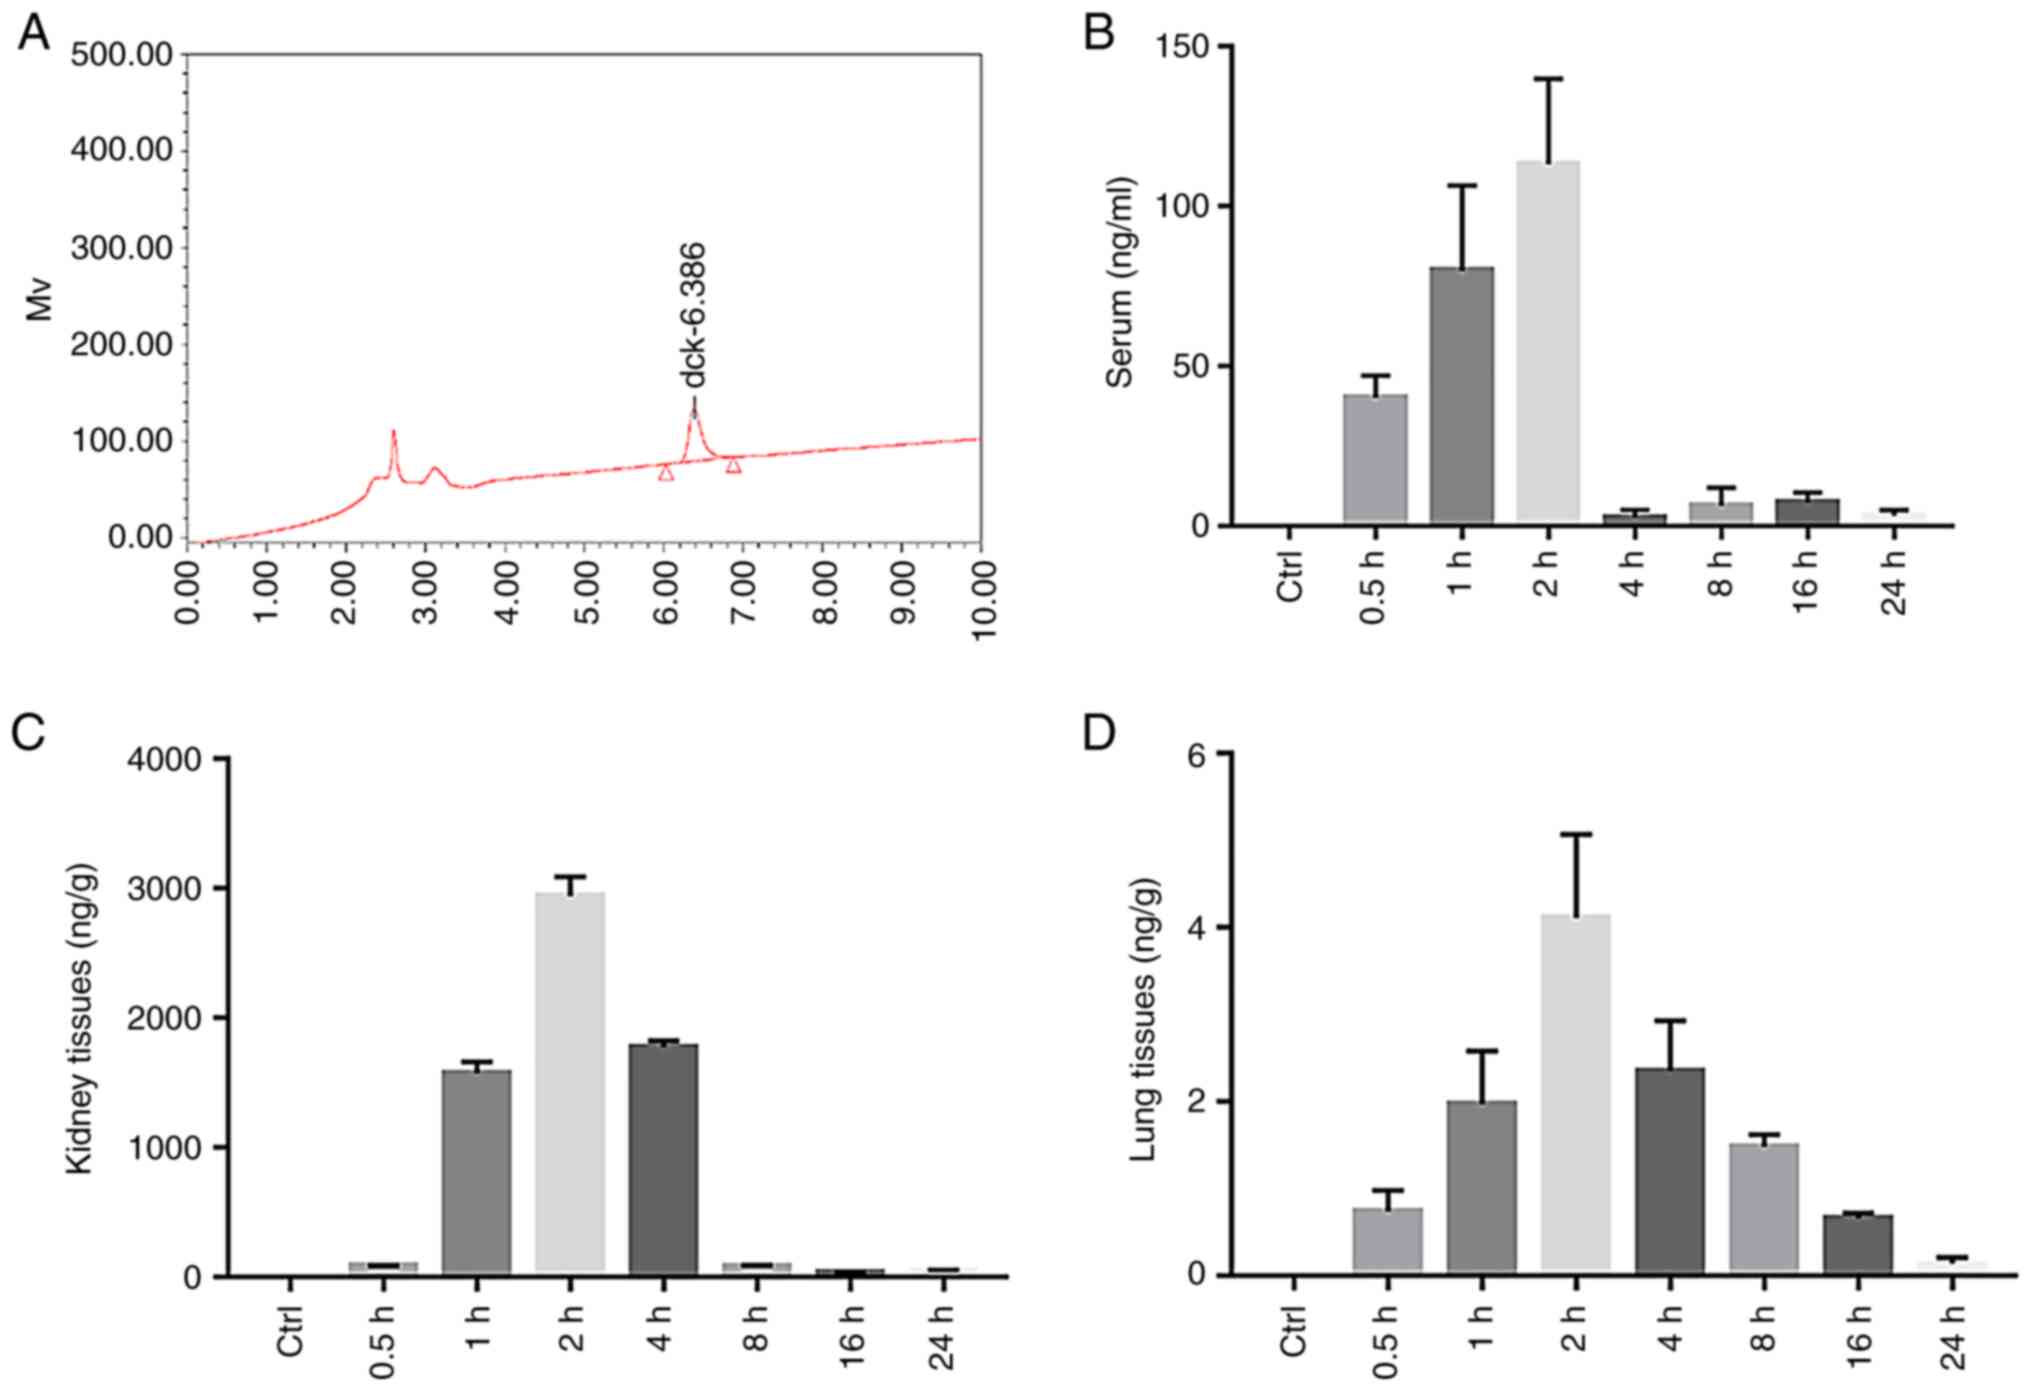 | Figure 5The content of diquat in the plasma,
kidney and lung tissues of rats. (A) HPLC of the diquat standard.
(B) Histogram of the serum diquat concentration in the Control
(Ctrl) and Experimental group (at 0.5, 1, 2, 4, 8, 16 and 24 h
after diquat exposure). (C) Histogram of kidney diquat
concentration in the Control (Ctrl) and Experimental group (at 0.5,
1, 2, 4, 8, 16 and 24 h after diquat exposure). (D) Histogram of
lung diquat concentration in the Control (Ctrl) and Experimental
group (at 0.5, 1, 2, 4, 8, 16 and 24 h after diquat exposure). |
 | Table IRegression equations of plasma and
tissues. |
Table I
Regression equations of plasma and
tissues.
| Biological
examination | Regression
equation | Correlation
coefficient r |
|---|
| Plasma | y=332.855x +
1,395.76 | 0.9941 |
| Renal | y=9,450x + 1,650 | 0.9993 |
| Lung | y=24,440x +
1,050 | 0.9968 |
The plasma concentrations of diquat significantly
increased at 0.5, 1 and 2 h (P<0.01) after administration,
peaking at 2 h, and then significantly decreasing by 4 h, before
slightly increasing again at 8 and 16 h (Fig. 5B and Table II). The concentration of diquat in
the kidney was significantly increased at 1, 2 and 4 h (P<0.01)
from administration (Table II),
also peaking at 2 h (Fig. 5C and
Table II). The concentration of
diquat in the lung tissue was significantly increased at 1, 2 and 4
h from administration (Fig. 5D and
Table II), peaked at 2 h and then
decreased.
| Table IIConcentration of diquat at every time
point after infection (n=10, ± SD, ng/ml). |
Table II
Concentration of diquat at every time
point after infection (n=10, ± SD, ng/ml).
| Group Control
group | 0.5 h BLQ | 1 h BLQ | 2 h BLQ | 4 h BLQ | 8 h BLQ | 16 h BLQ | 24 h BLQ |
|---|
| Exposure group | | | | | | | |
|
Serum |
40.14±6.86a |
79.91±26.71a |
113.20±26.72a | 2.87±2.17 | 6.41±5.62 | 7.49±3.08 | 3.26±1.85 |
|
Kidney
tissues | 84.17±3.39 |
1,575.70±86.68a |
2,940.38±151.49a |
1,775.69±49.73a | 77.96±13.48 | 34.38±4.35 | 52.11±2.97 |
|
Lung
tissues | 0.74±0.24 |
1.97±0.61a |
4.11±0.96a |
2.35±0.58a | 1.48±0.14 | 0.66±0.06 | 0.14±0.07 |
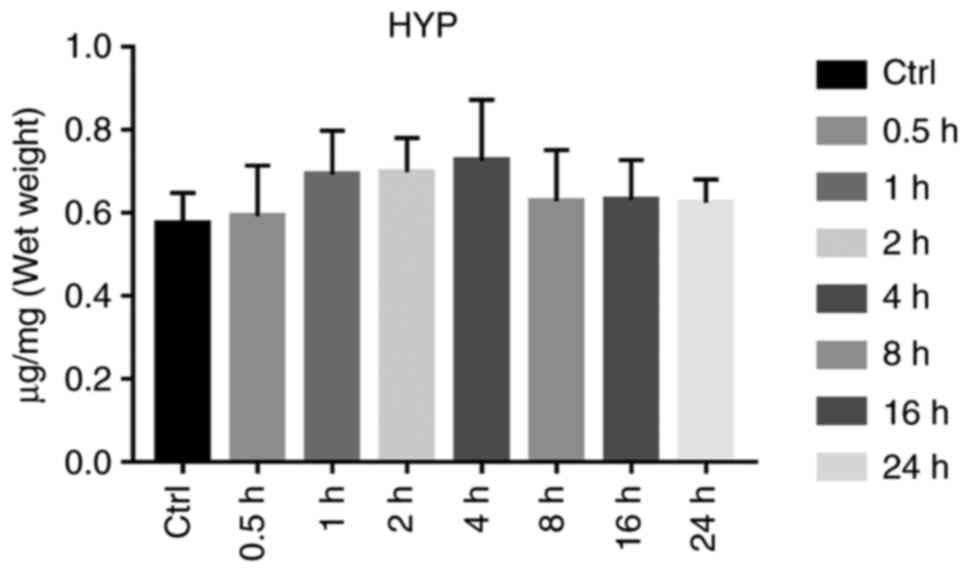
HYP content determination in the lung
tissues
HYP levels in the lung tissue reflects lung tissue
collagen content, and is used as a parameter to assess the degree
of pulmonary fibrosis. Compared with that in the control group, the
HYP content in the lung tissues of the exposure group was not
significantly increased, and variance analysis yielded no
statistical significance (P>0.05; Fig. 6 and Table III).
| Table IIIContent of HYP, UA, BUN, Cr, and Kim-1
at every time point after infection (n=10, ± SD). |
Table III
Content of HYP, UA, BUN, Cr, and Kim-1
at every time point after infection (n=10, ± SD).
| Content | Group | 0.5 h | 1 h | 2 h | 4 h | 8 h | 16 h | 24 h |
|---|
| HYP in | Control | 0.575±0.074 | 0.574±0.036 | 0.569±0.049 | 0.582±0.056 | 0.570±0.041 | 0.586±0.063 | 0.569±0.084 |
| lung tissue
(µg/mg) | Exposure | 0.593±0.122 | 0.693±0.106 | 0.699±0.082 | 0.726±0.147 | 0.629±0.123 | 0.632±0.096 | 0.625±0.056 |
| Serum UA | Control | 126.81±11.66 | 135.53±20.68 | 133.64±17.54 | 142.72±15.93 | 117.45±22.51 | 128.84±14.77 | 112.57±18.53 |
| (µmol/l) | Exposure | 209.46±47.08 |
304.86±128.86b |
330.03±87.32b | 220.82±71.86 | 218.80±65.73 |
255.45±115.75b |
267.49±87.76b |
| BUN | Control | 9.18±0.71 | 10.58±1.79 | 9.65±1.57 | 10.28±2.33 | 11.21±1.10 | 8.65±0.94 | 8.44±2.38 |
| (mg/dl) | Exposure |
23.53±2.40b |
23.88±3.09b |
22.12±3.26b |
17.81±2.83b |
26.01±5.35b |
23.43±2.66b |
21.87±3.09b |
| Serum Cr | Control | 29.43±9.67 | 27.57±7.64 | 33.21±6.82 | 31.19±8.03 | 26.90±9.46 | 35.17±6.86 | 30.33±8.07 |
| (µmol/l) | Exposure |
104.87±9.55b |
110.24±23.36b |
118.55±32.99b |
70.70±26.63b |
76.03±14.23b |
85.08±26.54b |
91.04±14.90b |
| Serum | Control | 2.21±0.38 | 2.17±0.17 | 2.30±0.28 | 2.22±0.42 | 2.19±0.16 | 2.14±0.37 | 2.24±0.26 |
| KIM-1 (ng/ml) | Exposure |
3.21±0.80a |
3.85±0.71b |
3.89±0.88b |
3.93±1.09b | 2.94±0.67 | 2.94±0.42 |
3.49±0.45b |
Renal function
The serum UA levels were significantly increased at
1, 2, 16 and 24 h (P<0.01), There was no apparent difference
between the exposure and control groups at 0.5, 4 and 8 h
(P>0.05). Following exposure, the serum BUN of each group was
significantly increased, and the difference between the two groups
was statistically significant (P<0.01). The serum Cr levels of
the rats exposed to diquat were significantly increased from 0.5 to
24 h, and the Cr content peaked at 2 h. The Cr level of the
exposure group was significantly higher from that of the control
group (P<0.01; Table III and
Fig. 7A-C).
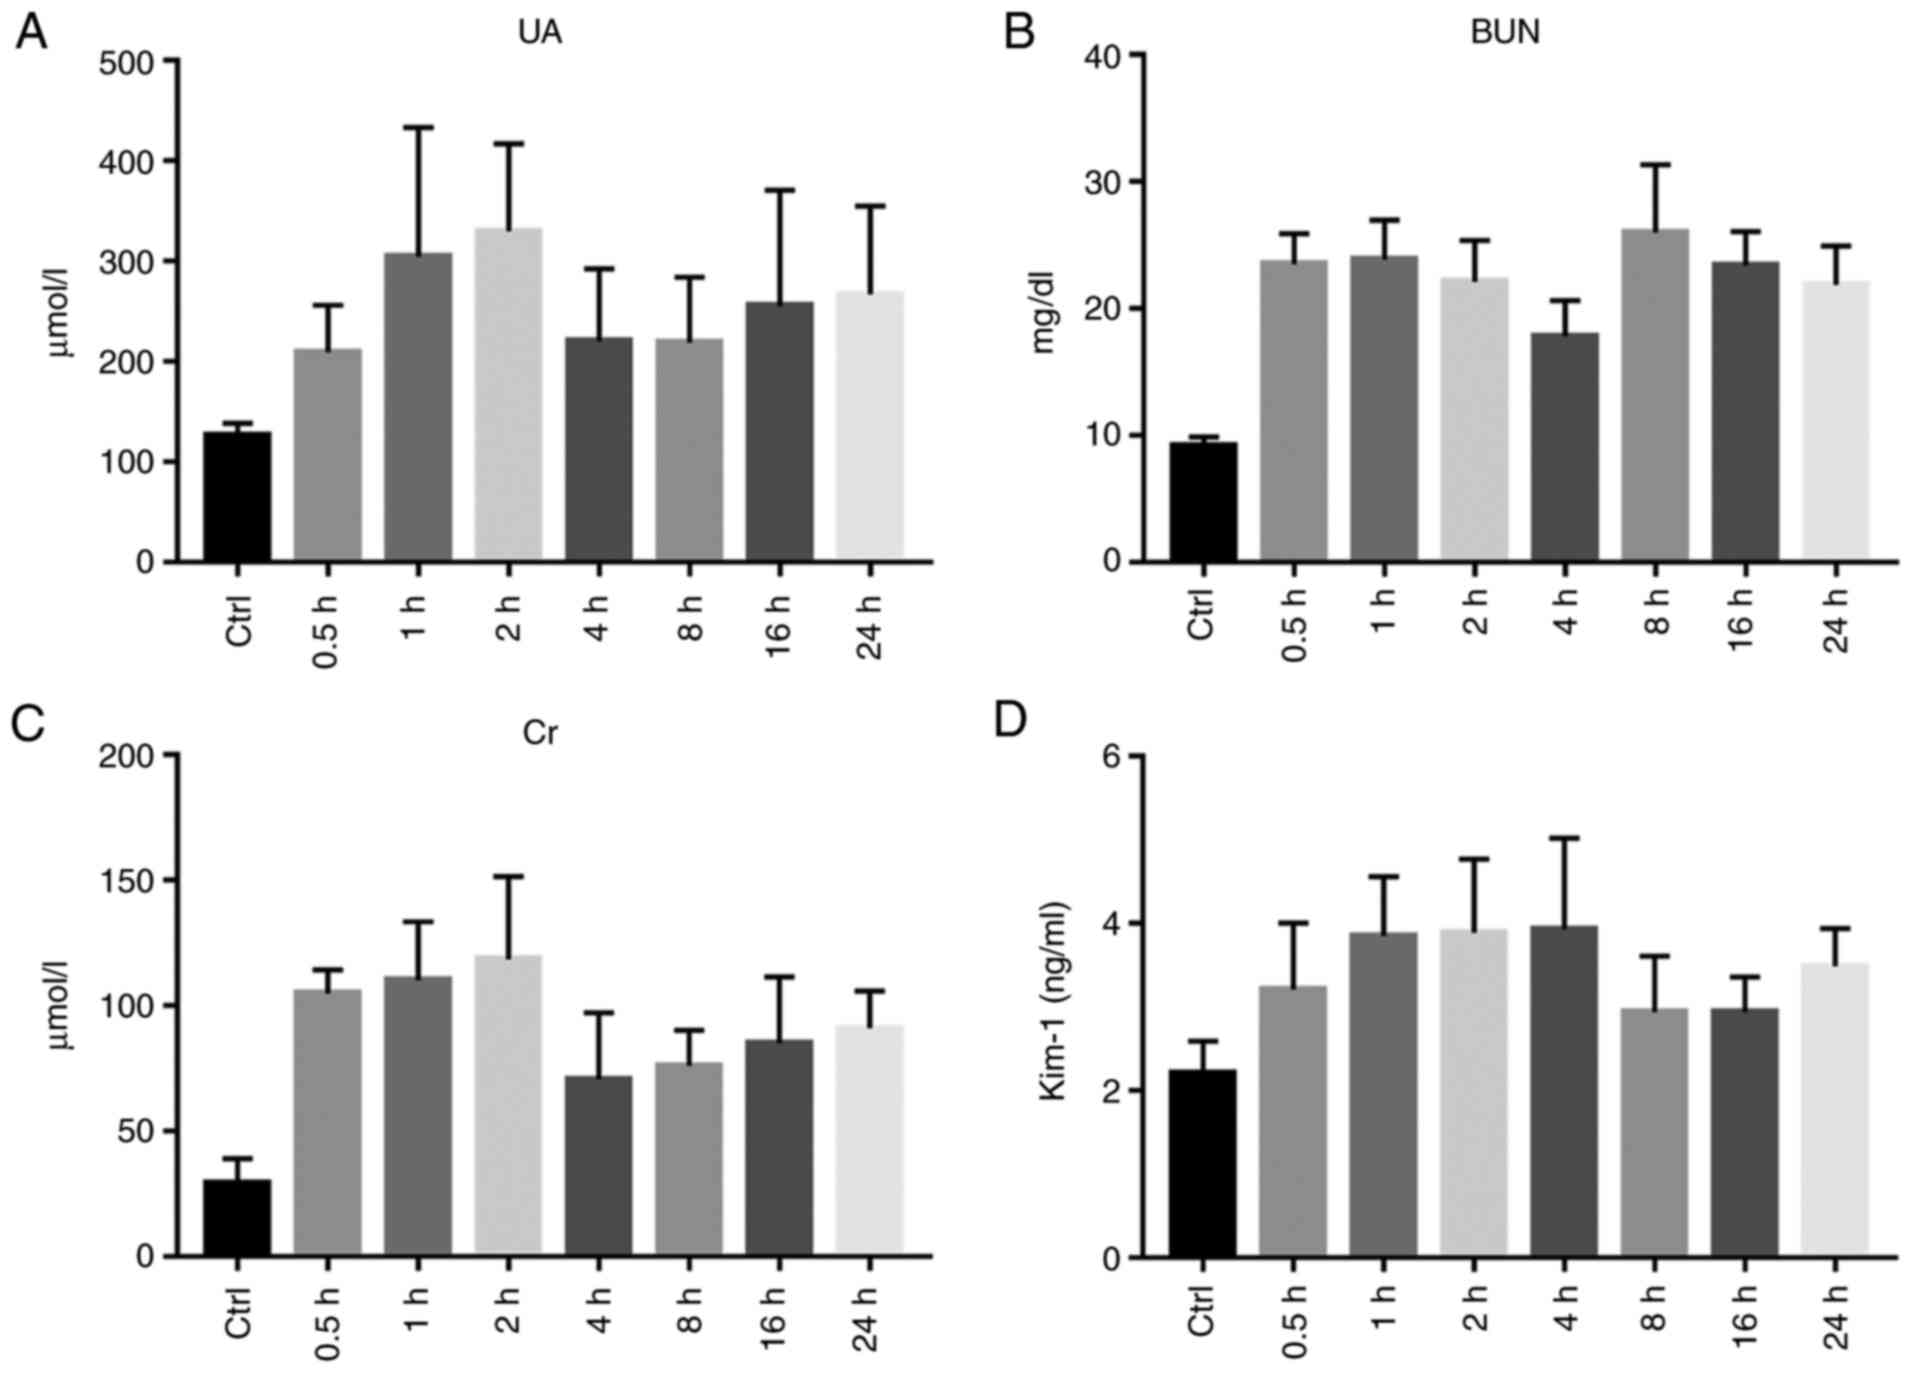 | Figure 7Renal function. (A) Statistical chart
of serum uric acid (UA) level in the Control (Ctrl) and
Experimental group (at 0.5, 1, 2, 4, 8, 16 and 24 h after diquat
exposure). (B) Statistical chart of serum urea nitrogen (BUN) level
in the Control (Ctrl) and Experimental group (at 0.5, 1, 2, 4, 8,
16 and 24 h after diquat exposure). (C) Serum creatinine (Cr) level
of rats in the Control (Ctrl) and Experimental group (at 0.5, 1, 2,
4, 8, 16 and 24 h after diquat exposure). (D) Statistical chart of
serum kidney injury molecule-1 (KIM-1) content in the Control
(Ctrl) and Experimental group (at 0.5, 1, 2, 4, 8, 16 and 24 h
after diquat exposure). |
The serum KIM-1 levels were determined using ELISA
and were found to be significantly increased at 0.5, 1, 2, 4 and 24
h from exposure (P<0.05). There was no significant difference
between the groups after 8 and 16 h (P>0.05; Table III and Fig. 7D).
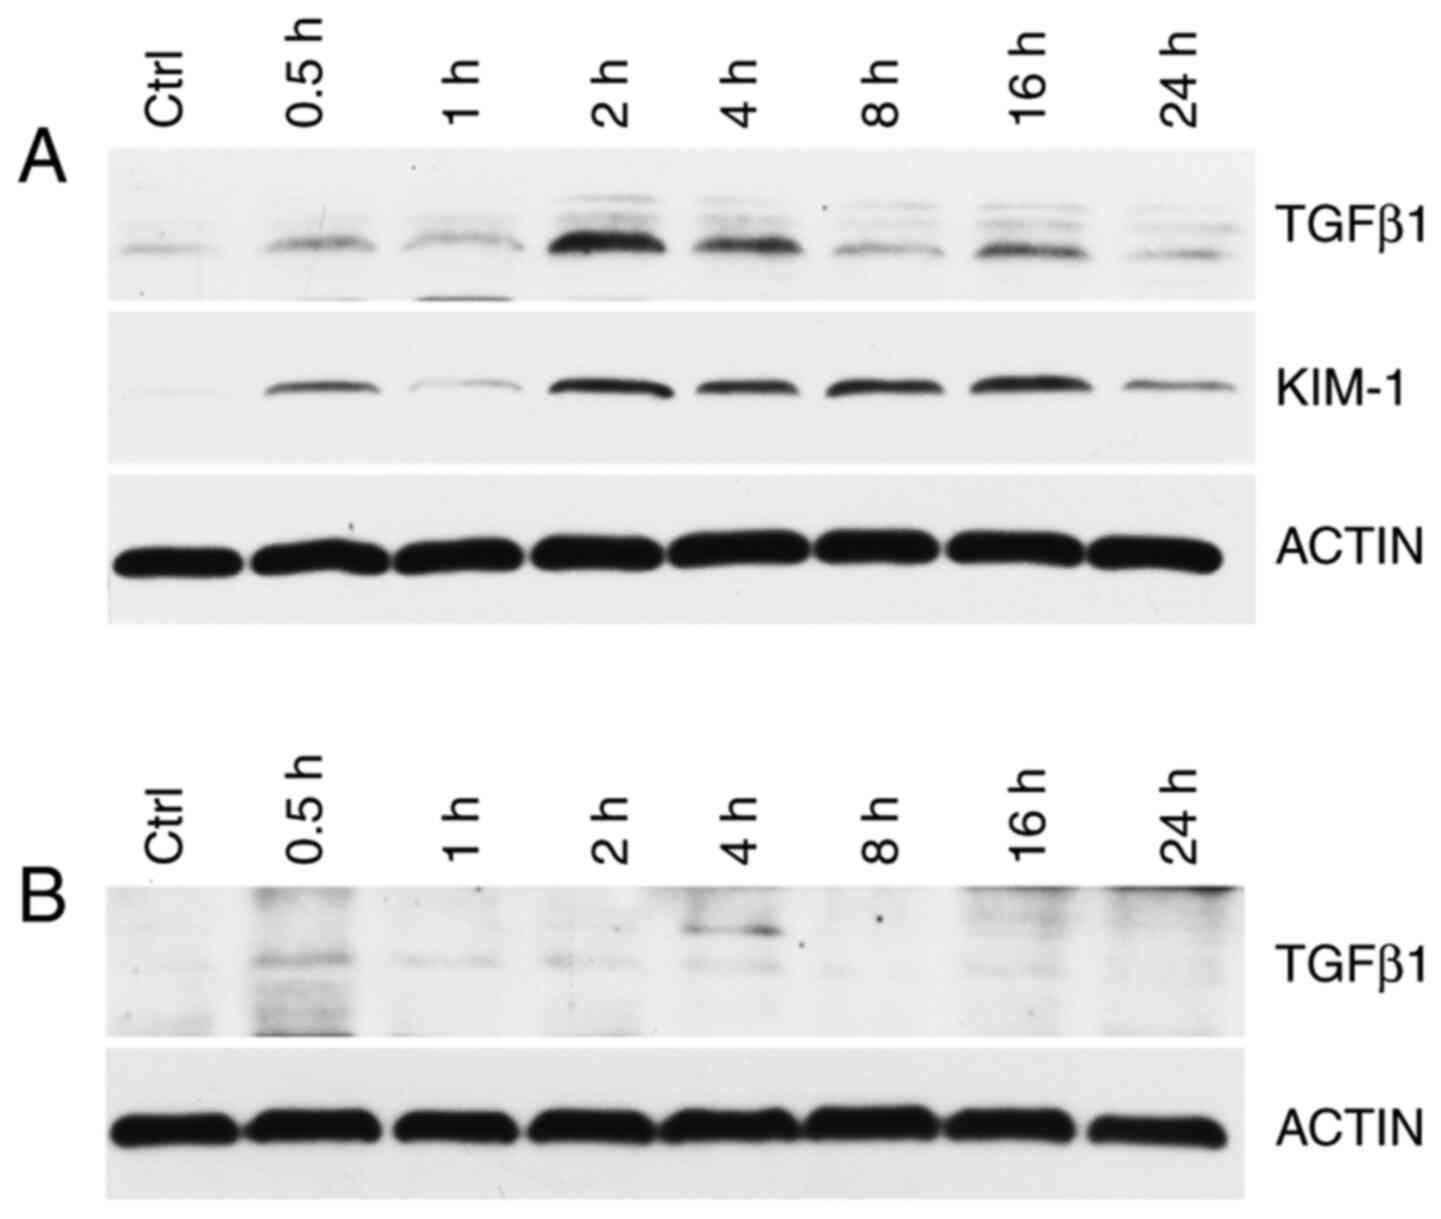
KIM-1 and TGF-β1 expression in rat kidney and lung
tissues were detected using western blot analysis. Compared with
the control group, at 0.5, 1, 2, 4, 8, 16 and 24 h after exposure,
the renal KIM-1 and TGF-β1 levels were increased, peaking at 2 h
from exposure (Fig. 8A). The lung
TGF-β1 concentration was not significant (Fig. 8B).
Discussion
Diquat (1,1'-ethylene-2,2'-bipyridylium) is a type
of widely used agricultural chemical, whose toxicities result in
the damage to numerous tissues, including the lung, liver, kidney
and brain (1). Diquat, a redox
cycling compound, mediates its systemic toxicity through an
enhanced production of free radicals. In vitro studies have
shown that these compounds are potent generators of reactive oxygen
species (ROS) by redox cycling and that they stimulate lipid
peroxidation (5). However, in
vivo research has failed to provide clear evidence of lipid
peroxidation in response to exposure to these compounds (5). The role of ROS and lipid peroxidation
in the toxic effects of diquat remains controversial. In the
present study, a rat model of diquat poisoning was established
using a one-time administration of diquat by gavage, and the
dynamic changes in the levels of diquat in the blood, and various
organs and tissues, were observed for 24 h. The results showed that
the plasma and organ levels of diquat peaked at 2 h. They then
decreased steadily according to different excretion rates. It is
worth mentioning that the plasma diquat concentration increased
again at 24 h, which appeared to be linked to the reabsorption of
renal tubules and collecting ducts, and enterohepatic circulation.
Generally, the concentration of diquat was at its highest in the
kidney, second highest in the plasma and lowest in the lung
tissues, which is consistent with the metabolic effect of diquat,
and the observed degree of injury to various organs in patients
with diquat poisoning in the clinic.
The kidney is one of the main organs damaged by
diquat poisoning. In the present study, rats with acute diquat
exposure underwent significant renal function impairment in a short
period of time, and the renal function indexes, specifically blood
urea nitrogen (BUN) and creatinine (Cr) were significantly higher
in the exposure group than in the control group. Recent studies
have shown that an increased uric acid (UA) is a strong independent
biomarker for adverse outcomes in several diseases and conditions
linked to increased oxidative stress and inflammation (12). The UA levels were not significantly
increased in the 4-8 h group compared with the control group, which
was considered to be linked to the transient decrease in UA levels
through glomerular filtration, due to the strong compensatory
function of the kidney during early renal injury.
Kidney injury molecule-1 (KIM-1) is a novel
potential urinary biomarker for the early detection of acute kidney
injury (AKI) within 24 h following kidney insult (13,14).
The serum levels of KIM-1 were tested in the rats following
exposure; they began to increase at 0.5 h and significantly
increased at 4 h. This indicated that KIM-1 may serve as an early
biomarker of kidney damage caused by early diquat poisoning.
Although none of the reported biomarkers are entirely specific for
AKI (15), biomarkers such as
KIM-1 may be positively used for the risk stratification of diquat
exposure-induced AKI.
Tumor growth factor (TGF)-β1 as a multifunctional
growth factor, is closely associated with the deposition of the
extracellular matrix and is an important regulator of
glomerulosclerosis and renal tubule and interstitial fibrosis.
Additionally, evidence indicates the causal relationship between
the increase in TGF-β1 levels and tissue fibrosis (12,16,17).
The present study indicated that TGF-β1 was strongly expressed in
renal tissues of the diquat-exposed mice, but was scarcely
expressed in lung tissues. In addition, its expression was mainly
concentrated at 2 and 4 h when compared to other time period in the
kidneys, and the levels of expression may have been positively
correlated with the degree of renal interstitial fibrosis. TGF-β1
in the kidney tissues was therefore significantly higher. TGF-β1
may be linked to the mechanism of AKI caused by diquat
poisoning.
Histological analysis of the H&E-stained kidney
sections indicated that the renal tubules were the primary targets
of injury, with renal tubular epithelial cells showing hydropic
degeneration, and a small number of casts observed in the lumen.
KIM-1 is characteristically expressed in the epithelial cell
parietal membranes of the renal proximal convoluted tubules. In the
present study, KIM-1 began to increase 0.5 h after exposure, which
supported the interpretation that renal injury was likely initiated
principally in the proximal tubules. Electron microscopy analysis
of renal tissues showed that the renal tubular epithelial cells in
each group had relatively complete cell membranes, basically
complete organelle structures and an abundance of organelles in the
cytoplasm. However, after 2 h, there were more vacuoles (suspected
to be formed by the swelling of mitochondria or formed after
autophagic digestion), the local nuclear membrane and mitochondrial
cristae were indistinct, and autophagy was increased.
Heterochromatin levels increased after 4 h. The mitochondria
swelled and the cytoplasm was vacuolated. After 24 h, the number of
vacuoles increased compared to that at 16 h. Some of the
mitochondrial bilayer membrane structures disappeared, and the
number of lysosomes increased. Collectively, these results strongly
suggested that diquat exposure induces mitochondrial dysfunction.
Diquat-induced cell death in the kidney of rats leads to kidney
dysfunction, and the degree of damage may gradually increase over
time.
The damage caused to lungs by diquat within 24 h was
determined by detecting the hydroxyproline (HYP) levels in the lung
tissue. As one of the main components of collagen in the body, HYP
accounts for 13.4% of collagen amino acids, a very small amount of
elastin (18). The HYP content in
the lung tissue is a direct indicator of the degree of pulmonary
fibrosis. When pulmonary fibrosis occurs, the amount of collagen
fibers in the lung tissue increases. In rats exposed to diquat, the
lack of increase in HYP content in the lung tissues showed that
there was no marked difference in lung tissue injury and lung
function between the exposure and control groups. Diquat caused
relatively less injury to the lungs and did not lead to any obvious
formation of fibrotic scars in the lung tissues at the early stages
after exposure. However, whether the degree of pulmonary fibrosis
worsens with time remains to be confirmed by further experimental
studies.
In conclusion, in the present study, an animal model
of acute diquat exposure was established, and the changes in diquat
in the plasma and organ tissues were dynamically observed. The
pathological damage to the kidney and lung tissues caused by diquat
was studied. The results demonstrated that the diquat content in
the organs and tissues was related to organ injury; although the
mechanisms of kidney injury are not completely understood, the
release of inflammatory factors is believed to play an important
role, and the related acute exposure-related mechanism requires
further exploration. By determining the main organs damaged by
diquat poisoning, the patterns of plasma and tissue concentration
of diquat and organ damage were preliminarily explored in order to
provide an experimental basis for clinical preventive interventions
and effective therapeutic options of diquat poisoning.
As a limitation of the present study, there was not
enough data that could accurately determine the clinical prognosis
based on the measured plasma diquat concentration. The
pharmacokinetics of diquat in the human body can only be inferred
based on the results of animal experiments to date. It is
preliminarily estimated that the best time is the early clinical
treatment of patients. The relationship between the blood
concentration of diquat and the prognosis of patients requires us
to conduct further research through clinical epidemiological
observations.
Acknowledgements
Not applicable.
Funding
Funding: No funding was received.
Availability of data and materials
The datasets used and/or analyzed during the current
study are available from the corresponding author on reasonable
request.
Authors' contributions
YW, BK and XJ conceived and designed the study. YW,
SC, WW, TJ and XJ performed the experiments. YW, SC and BK wrote
the paper. SC, BK and XJ reviewed and edited the manuscript. BK and
XJ critically revised important intellectual content. YW and XJ
confirm the authenticity of all the raw data All authors read and
approved the manuscript and agree to be accountable for all aspects
of the research in ensuring that the accuracy or integrity of any
part of the work are appropriately investigated and resolved.
Ethics approval and consent to
participate
All experiments were conducted following the
guidelines of the Chinese Laboratory Animal Welfare Ethical Review.
Ethical approval was provided by the Ethics Committee of Preventive
Medicine of Shandong University (no. 20180225) for this study.
Patient consent for publication
Not applicable.
Competing interests
The authors declare that they have no competing
interests.
References
|
1
|
Ameno K, Fuke C, Shirakawa Y, Ogura S,
Ameno S, Kiriu T, Kinoshita H and Ijiri I: Different distribution
of paraquat and diquat in human poisoning cases after ingestion of
a combined herbicide. Arch Toxicol. 68:134–137. 1994.PubMed/NCBI View Article : Google Scholar
|
|
2
|
Van Vleet TR and Schnellmann RG: Toxic
nephropathy: Environmental chemicals. Semin Nephrol. 23:500–508.
2000.PubMed/NCBI View Article : Google Scholar
|
|
3
|
Jones GM and Vale JA: Mechanisms of
toxicity, clinical features, and management of diquat poisoning: A
review. J Toxicol Clin Toxicol. 38:123–128. 2000.PubMed/NCBI View Article : Google Scholar
|
|
4
|
Fortenberry GZ, Beckman J, Schwartz A,
Prado JB, Graham LS, Higgins S, Lackovic M, Mulay P, Bojes H, Waltz
J, et al: Magnitude and characteristics of acute paraquat- and
diquat-related illnesses in the US: 1998-2013. Environ Res.
146:191–199. 2016.PubMed/NCBI View Article : Google Scholar
|
|
5
|
Magalhães N, Carvalho F and Dinis-Oliveira
RJ: Human and experimental toxicology of diquat poisoning:
Toxicokinetics, mechanisms of toxicity, clinical features, and
treatment. Hum Exp Toxicol. 37:1131–1160. 2018.PubMed/NCBI View Article : Google Scholar
|
|
6
|
Dinis-Oliveira RJ, Duarte JA,
Sánchez-Navarro A, Remião F, Bastos ML and Carvalho F: Paraquat
poisonings: Mechanisms of lung toxicity, clinical features, and
treatment. Crit Rev Toxicol. 38:13–71. 2008.PubMed/NCBI View Article : Google Scholar
|
|
7
|
Fussell KC, Udasin RG, Gray JP, Mishin V,
Smith PJ, Heck DE and Laskin JD: Redox cycling and increased oxygen
utilization contribute to diquat-induced oxidative stress and
cytotoxicity in Chinese hamster ovary cells overexpressing
NADPH-cytochrome P450 reductase. Free Radic Biol Med. 50:874–882.
2011.PubMed/NCBI View Article : Google Scholar
|
|
8
|
Vanholder R, Colardyn F, De Reuck J, Praet
M, Lameire N and Ringoir S: Diquat intoxication: Report of two
cases and review of the literature. Am J Med Jun. 70:1267–1271.
1981.PubMed/NCBI View Article : Google Scholar
|
|
9
|
Clark DG and Hurst EW: The toxicity of
diquat. Br J Ind Med. 27:51–55. 1970.PubMed/NCBI View Article : Google Scholar
|
|
10
|
Rose MS, Crabtree HC, Fletcher K and Wyatt
I: Biochemical effects of diquat and paraquat. Disturbance of the
control of corticosteroid synthesis in rat adrenal and subsequent
effects on the control of liver glycogen utilization. Biochem J.
138:437–443. 1974.PubMed/NCBI View Article : Google Scholar
|
|
11
|
Lock EA: The effect of paraquat and diquat
on renal function in the rat. Toxicol Appl Pharmacol. 48:327–336.
1979.PubMed/NCBI View Article : Google Scholar
|
|
12
|
Zhang J, Zhao Y, Bai Y, Lv G, Wu J and
Chen Y: The significance of serum uric acid level in humans with
acute paraquat poisoning. Sci Rep. 5(9168)2015.PubMed/NCBI View Article : Google Scholar
|
|
13
|
Djukic M, Jovanovic MD, Ninkovic M,
Stevanovic I, Curcic M, Topic A, Vujanovic D and Djurdjevic D:
Intrastriatal pre-treatment with L-NAME protects rats from diquat
neurotoxcity. Ann Agric Environ Med. 19:666–672. 2012.PubMed/NCBI
|
|
14
|
Rogers LK, Bates CM, Welty SE and Smith
CV: Diquat induces renal proximal tubule injury in glutathione
reductase-deficient mice. Toxicol Appl Pharmacol. 217:289–298.
2006.PubMed/NCBI View Article : Google Scholar
|
|
15
|
Kashani K, Cheungpasitporn W and Ronco C:
Biomarkers of acute kidney injury: The pathway from discovery to
clinical adoption. Clin Chem Lab Med. 55:1074–1089. 2017.PubMed/NCBI View Article : Google Scholar
|
|
16
|
Calvier L, Chouvarine P, Legchenko E,
Hoffmann N, Geldner J, Borchert P, Jonigk D, Mozes MM and Hansmann
G: PPARγ Links BMP2 and TGF-β1 pathways in vascular smooth muscle
cells, regulating cell proliferation and glucose metabolism. Cell
Metab. 25:1118–1134.e7. 2017.PubMed/NCBI View Article : Google Scholar
|
|
17
|
Kim KK, Sheppard D and Chapman HA: TGF-β1
signaling and tissue fibrosis. Cold Spring Harb Perspect Biol.
10(a022293)2018.PubMed/NCBI View Article : Google Scholar
|
|
18
|
Wu Z, Hou Y, Dai Z, Hu CA and Wu G:
Metabolism, nutrition, and redox signaling of hydroxyproline.
Antioxid Redox Signal. 30:674–682. 2019.PubMed/NCBI View Article : Google Scholar
|