Introduction
Prostate cancer (PCa) is the most pervasive tumor
among solid male tumors, accounting for 26% of cases reported, and
is also the second leading cause of tumor-associated deaths in men,
accounting for 11% of cancer-specific deaths (1). Radical prostatectomy with androgen
deprivation therapy (ADT) has become the basic treatment strategy
for primary PCa (2). However, most
primary PCa may locally relapse and develop into
castration-resistant prostate cancer (CRPC) (3) or even metastatic PCa (4). Prostate-specific antigen (PSA)
re-elevation following ADT, commonly known as biochemical
recurrence (BCR), was the most prevalent technique to detect this
problem (5). Nevertheless, PSA
assays frequently failed to discover BCR or distant metastases in
the first place, given its low sensitivity and specificity
(6). Similarly, the clinical and
pathological markers used to diagnose BCR of PCa (e.g., Gleason
score, clinical and pathological stage) were still insufficient.
Several diagnostic biomarkers for BCR of PCa have been described in
the literature. For instance, Kim et al (7) reported that PSCA, COX-2, Ki67 were
independent predictive biomarkers for BCR of PCa. Some studies have
found that non-coding RNAs, such as lncRNAs play an essential role
in the malignant progression and BCR of PCa (8,9).
However, the exact mechanism of primary PCa progression remains
unclear. Therefore, it is important to identify a stable and
reliable biomarker for diagnosing BCR of PCa and to provide a guide
for detecting the etiology of malignant progression in PCa and the
mechanism of BCR.
Immune cells are an essential component of the tumor
microenvironment (TME) and play a crucial role in tumorigenesis and
progression, which has been investigated in numerous studies
(10,11). Tumor immunotherapy, which activates
the natural defense system of the body that is responsible for
recognizing and removing bacteria, viruses, and tumor cells, is
considered a promising cancer treatment modality for recurrent or
metastatic cancers (12). Notably,
immune checkpoint blockade (ICB) and T-cell therapy have made
significant breakthroughs in improving the clinical prognosis of
several types of solid tumors (13,14),
demonstrating an effective response to immunotherapy for tumors.
Literature (15,16) has revealed several biomarkers
associated with immunity and prognosis, but few have been
confirmed. Therefore, new biomarkers need to be identified as well
as their association with the TME, and immunity and prognosis.
Given the aforementioned reasons, the present study
aimed to identify potential diagnostic biomarkers of BCR in PCa and
validate their correlation with immunity and prognosis. In this
present study, latent transforming growth factor β-binding protein
2 (LTBP2) was screened and determined as a diagnostic biomarker
gene associated with BCR of PCa by different algorithms, which
could be confirmed by other external datasets. Next, the
association between LTBP2 and immunity and prognosis was evaluated.
The results revealed that the LTBP2 expression was associated with
CD4+ T-cell recruitment. Moreover, the present study
emphasized the important role of LTBP2 in inhibiting PCa invasion
and metastasis in vitro and confirmed its exact molecular
mechanism. Therefore, LTBP2 could be a novel diagnostic biomarker
and potential immunotherapeutic target for BCR in PCa.
Materials and methods
Raw data sources, preparation,
merging, and differential expression analysis
Available public transcriptome data for PCa from the
Gene Expression Omnibus (GEO) database (https://www.ncbi.nlm.nih.gov/geo/) and The Cancer
Genome Atlas (TCGA) database (https://portal.gdc.cancer.gov/) were screened and
downloaded based on the inclusion criteria, which were as follows:
i) Sample size >30 days; ii) complete expression information of
transcriptome data; and iii) sample information including the
description of BCR. Relevant information is presented in Table SI. PCa samples from three datasets
[GSE46602(17), GSE70768(18) and GSE116918(19)] were merged as the training cohort.
The batch effect of non-biotechnical bias was eliminated using the
ComBat algorithm (version 3.44.0) of the SVA package (20). Differential expression analysis was
performed using the Bayesian algorithm (version 3.52.1) of the
‘limma’ package if the criteria adjusted P<0.05 was met
(21). GSE70769(22) and TCGA-prostate adenocarcinoma
(PRAD) dataset and corresponding clinical information were
downloaded and used as validation cohorts.
Least absolute shrinkage and selection
operator (Lasso) Cox regression analysis and support vector machine
with recursive feature elimination (SVM-RFE) algorithm to obtain
BCR-associated differential expression genes (DEGs)
Lasso regression analysis is a valuable method for
identifying interpretable prediction rules in high-dimensional
data, featuring a simultaneous selection of variables and
elimination of high correlations among them to prevent overfitting
(23). BCR-related differentially
expressed genes (DEGs) were identified based on the best lambda
values selected by 1,000 cross-validations using the glmnet package
(version 4.1-4) in the R language (24). The SVM-RFE algorithm is essentially
a backward elimination method for determining a subset of
characteristics to optimize the performance of the classifier
(25), which was initially
designed to solve binary gene selection problems (26). The e1071 and kernlab packages in R
software were used to implement SVM-RFE analysis to obtain
BCR-related DEGs (27).
Gene Ontology (GO) biological
function, The Kyoto Encyclopedia of Genes and Genomes (KEGG)
pathway annotation, Disease Ontology (DO) enrichment analysis, and
gene set enrichment analysis (GSEA)
GO (24) enrichment
analysis of the 44 BCR-related DEGs was utilized for biological
function enrichment studies involving molecular functions (MF),
cellular components (CC), and biological processes (BP) using the
‘clusterProfiler (version 3.14.3) (28), enrichplot (29) and ggplot2 package (30)’ in R software (adjusted P<0.05).
KEGG was widely employed to screen biological pathways (31). DO enrichment analysis was commonly
used to identify large-scale disease enrichment research by
clusterProfiler, GSEABase (version 1.58.0) (32), DOSE (version 3.22.0) (33), and enrichplot package in R language
(adjusted P<0.05). GSEA analysis was applied to investigate
potential differences in biological processes and signaling
pathways in GEO merged dataset and TCGA-PRAD cohort by the
‘clusterProfiler and enrichplot package’ in R software. The gene
set ‘c2.cp.kegg.v7.4.symbols.gmt’ was retrieved from the Molecular
Signatures Database (MSigDB) (34), and the adjusted P-values <0.05
were regarded as statistically significant.
TME cell infiltration level and
tumor-infiltrating immune cell profile, as well as correlation
between immune infiltration and LTBP2 expression in PCa
Tumor cell TME infiltration level was estimated by
immune score, stromal score and tumor purity for each sample using
the estimation of stromal and immune cells in malignant tumor
tissues using expression data (ESTIMATE) algorithm (35). The CIBERSORT algorithm was
implemented to generate an estimate of the abundance distribution
of each tumor cell in the tumor sample using the R package ‘e1071’
(36). Spearman correlation
analysis was undertaken to determine the association between immune
cell infiltration levels and the expression of LTBP2.
Gene expression and clinical benefits
for ICB and TCGA pan-cancer analyses
To elucidate the interaction of LTBP2 on the ICB,
the association between LTBP2 expression and three well-known
immune checkpoint genes was explored using the Tumor Immune
Estimation Resource (TIMER) database (37) and Gene Expression Profiling
Interactive Analysis (GEPIA; http://gepia.cancer.pku.cn/) database. Transcriptomic
data and corresponding clinicopathological features of TCGA
pan-cancer were obtained from the UCSC Xena browser (https://xena.ucsc.edu/) and preprocessed as described
above.
Establishment of protein-protein
interaction (PPI) network and molecular complex detection (MCODE)
analysis to identify hub genes
The Search Tool for Retrieving Interacting Genes
(STRING) database (https://cn.string-db.org/) (38,39)
was applied to predict the PPI network for the 44 BCR-related DEGs,
with a threshold of combined score >0.4. Moreover, the MCODE
algorithm was used to identify hub genes (40).
Construction of lncRNA-miRNA-LTBP2
mRNA competing endogenous RNA (ceRNA) regulatory networks
The ceRNA regulatory network is a common upstream
regulatory mechanism of target genes (41). LTBP2 was considered as the target
gene, and the sponging miRNA was screened via the starBase database
(https://starbase.sysu.edu.cn/) (42). Spearman correlation analysis was
then used to identify miRNAs that were negatively correlated with
LTBP2 expression. In addition, the sponging lncRNAs were identified
by the starBase database and a negative correlation with miRNAs was
confirmed by Spearman correlation analysis (cor >0.3; P-value
<0.01). Finally, Cytoscape software (version 3.9.1) was utilized
to construct the lncRNA-miRNA-LTBP2 ceRNA regulatory network
(43).
Collection of gene expression data
with immunotherapy response prediction
To evaluate the predictive value of LTBP2 in
immunotherapeutic response, two immunotherapy cohorts, including
clinical and transcriptomic data, were downloaded. The GSE78220
cohort (44), downloaded from the
GEO database, is an anti-programmed cell death protein 1 (PD-1)
immunotherapy cohort containing 27 samples with complete clinical
information. The IMvigor210 cohort, obtained from http://research-pub.gene.com/IMvigor210CoreBiologies/,
is an anti-PD-L1 immunotherapy cohort containing 298 samples with
complete clinical data.
Cell culture and cell
transfection
The human prostate cell (RWPE-1; cat. no. SCSP-5025)
and human PCa cell lines (LNcap; cat. no. TCHu173), PC3 (cat. no.
TCHu158) and DU145 cells (cat. no. TCHu222) were originally
purchased from the Cell Bank of Shanghai Institute of Life
Sciences, Chinese Academy of Sciences. RPMI-1640 medium (Procell
Life Science & Technology Co., Ltd.) containing 10% fetal
bovine serum (FBS; Thermo Fisher Scientific, Inc.), penicillin (25
U/ml) and streptomycin (25 mg/ml; Gibco; Thermo Fisher Scientific,
Inc.), were used to culture prostate cells and PCa cells at 37˚C in
a humidified 5% CO2 environment. The sequence of LTBP2
was cloned in to a pcDNA3.1-vector to generate overexpression
plasmid constructs by Shanghai GeneChem Co., Ltd. Lipofectamine
3000 reagent (Vazyme Biotech Co., Ltd.) was used for cell
transfection according to the manufacturer's protocol (45). In short, the transfection reagent
was added and samples were placed in a humidified 5% CO2
environment at 37˚C for 6 h, then changed to fresh medium and
performed the subsequent experiments the next day.
RNA extraction and reverse
transcription-quantitative polymerase chain reaction (RT-qPCR)
Total RNA was isolated and extracted from cells and
clinical tissues using E.Z.N.A.® Total RNA Kit I (50
preps) (Omega Bio-Tek, Inc.). Reverse transcription was then
achieved with the HiScript II Q RT SuperMix reagent kit according
to the manufacturer's protocol (cat. no. R223-01; Vazyme Biotech
Co., Ltd.). PCR was implemented to measure Cq values using the SYBR
Green PCR kit (Vazyme Biotech Co., Ltd.) according to the
manufacturer's protocol (46). In
short, qPCR was performed under the conditions: Holding at 50˚C for
2 min, 95.0˚C for 30 sec and 40 circles of 95.0˚C for 10 sec and
60˚C for 30 sec in an applied biosystems 7300 Realtime PCR
instrument. The 2-ΔΔCq calculation method was employed
to calculate the relative expression levels of LTBP2 (47-49).
The primers for LTBP2 used in the present study were as follows:
LTBP2 forward, 5'-AGCACCAACCACTGTATCAAAC-3' and reverse,
5'-CTCATCGGGAATGACCTCCTC-3'; GAPDH forward,
5'-ACCATCTTCCAGGAGCGAGAT-3' and reverse,
5'-GGGCAGAGATGATGACCCTTT-3'.
Cell Counting Kit-8 (CCK-8) cell
proliferation assays
CCK-8 assay Kit (BioBIO EXCELLENCE) was used to
perform the cell proliferation. In brief, the transfected LNcap and
DU145 cells were seeded into 96-well plates at a density of 1,500
cells/well. Following seeding for 24, 48, 72 and 96 h, 10 µl CCK-8
reagent was added to each well and then incubated for another 3 h
before detecting the optical density (OD) at 450 nm.
Transwell migration and Matrigel
invasion assays
Cell migration and invasion assays were implemented
in 8-µm pore size Transwell chambers, distinguishing that invasion
assays required 0.5 mg/ml Matrigel pretreatment (37˚C for 1 h).
Specifically, the transfected PCa cells (10x104) were
resuspended in a serum-free medium and inoculated into the upper
chamber, and 600 µl of medium containing 10% FBS was placed in the
lower chamber and incubated at 37˚C for 8-20 h. Subsequently,
migrating and invading cells were fixed in methanol (20 min at room
temperature), stained with 0.1% crystal violet (20 min at room
temperature), and photographed and counted using a light microscope
at x10 magnification.
Western blot analysis
Western blotting was conducted using the same method
previously reported in the literature (50). In short, cells were lysed with RIPA
buffer (Beyotime Institute of Biotechnology), and protein was
extracted. The protein concentration was then quantified utilizing
a BCA Protein Assay Kit (Thermo Fisher Scientific, Inc.).
Subsequently, the protein (10 µg/well) was separated by 10% sodium
dodecyl sulfate-polyacrylamide gels electrophoresis (SDS-PAGE) and
electroblotted to polyvinylidene fluoride membranes (PVDF)
(MilliporeSigma). Following blocking with 5% skim milk for 1 h at
room temperature, the membrane was incubated with various specific
primary antibodies overnight at 4˚C. Next, washing with TBST
(Tween, 1:1,000) followed by incubation with horseradish peroxidase
(HRP)-conjugated secondary antibody (Table SII) for 1 h at room temperature.
Protein bands were treated with BeyoEcl Plus reagent (Beyotime
Institute of Biotechnology) after washing with TBST and observed
using an ECL system.
Statistical analysis
The statistical analysis was undertaken with R
software (version 4.0.3) and GraphPad Prism 7 software (GraphPad
Software, Inc.). The Perl programming language (version 5.30.2) was
used for data processing. The Kaplan-Meier (K-M) survival analysis
and log-rank tests were utilized to analyze the overall survival
(OS), progression-free interval (PFI) and disease-specific survival
(DSS). The associations between LTBP2 expression and various
clinicopathological covariates were examined using a chi-square
test. Data were obtained from at least three independent
experiments in vitro and were expressed as mean ± SD. A
P-value <0.05 was considered to indicate a statistically
significant difference.
Results
Identification of 44 differentially
expressed mRNAs between primary PCa and BCR of PCa based on the GEO
merged dataset
The flow chart of the present study is presented in
Fig. 1. First, three GSE datasets
(GSE46602, GSE70768, and GSE116918) were merged using the SVA
algorithm to obtain 312 primary PCa and 97 BCR in PCa cases. The
differential expression analysis of primary PCa and BCR in PCa was
then performed using the R software Limma package based on the GEO
merged datasets. A total of 44 BCR-related DEGs are presented in
Fig. S1. Among them, 18 DEGs were
in the downregulated subset and 26 in the upregulated subset.
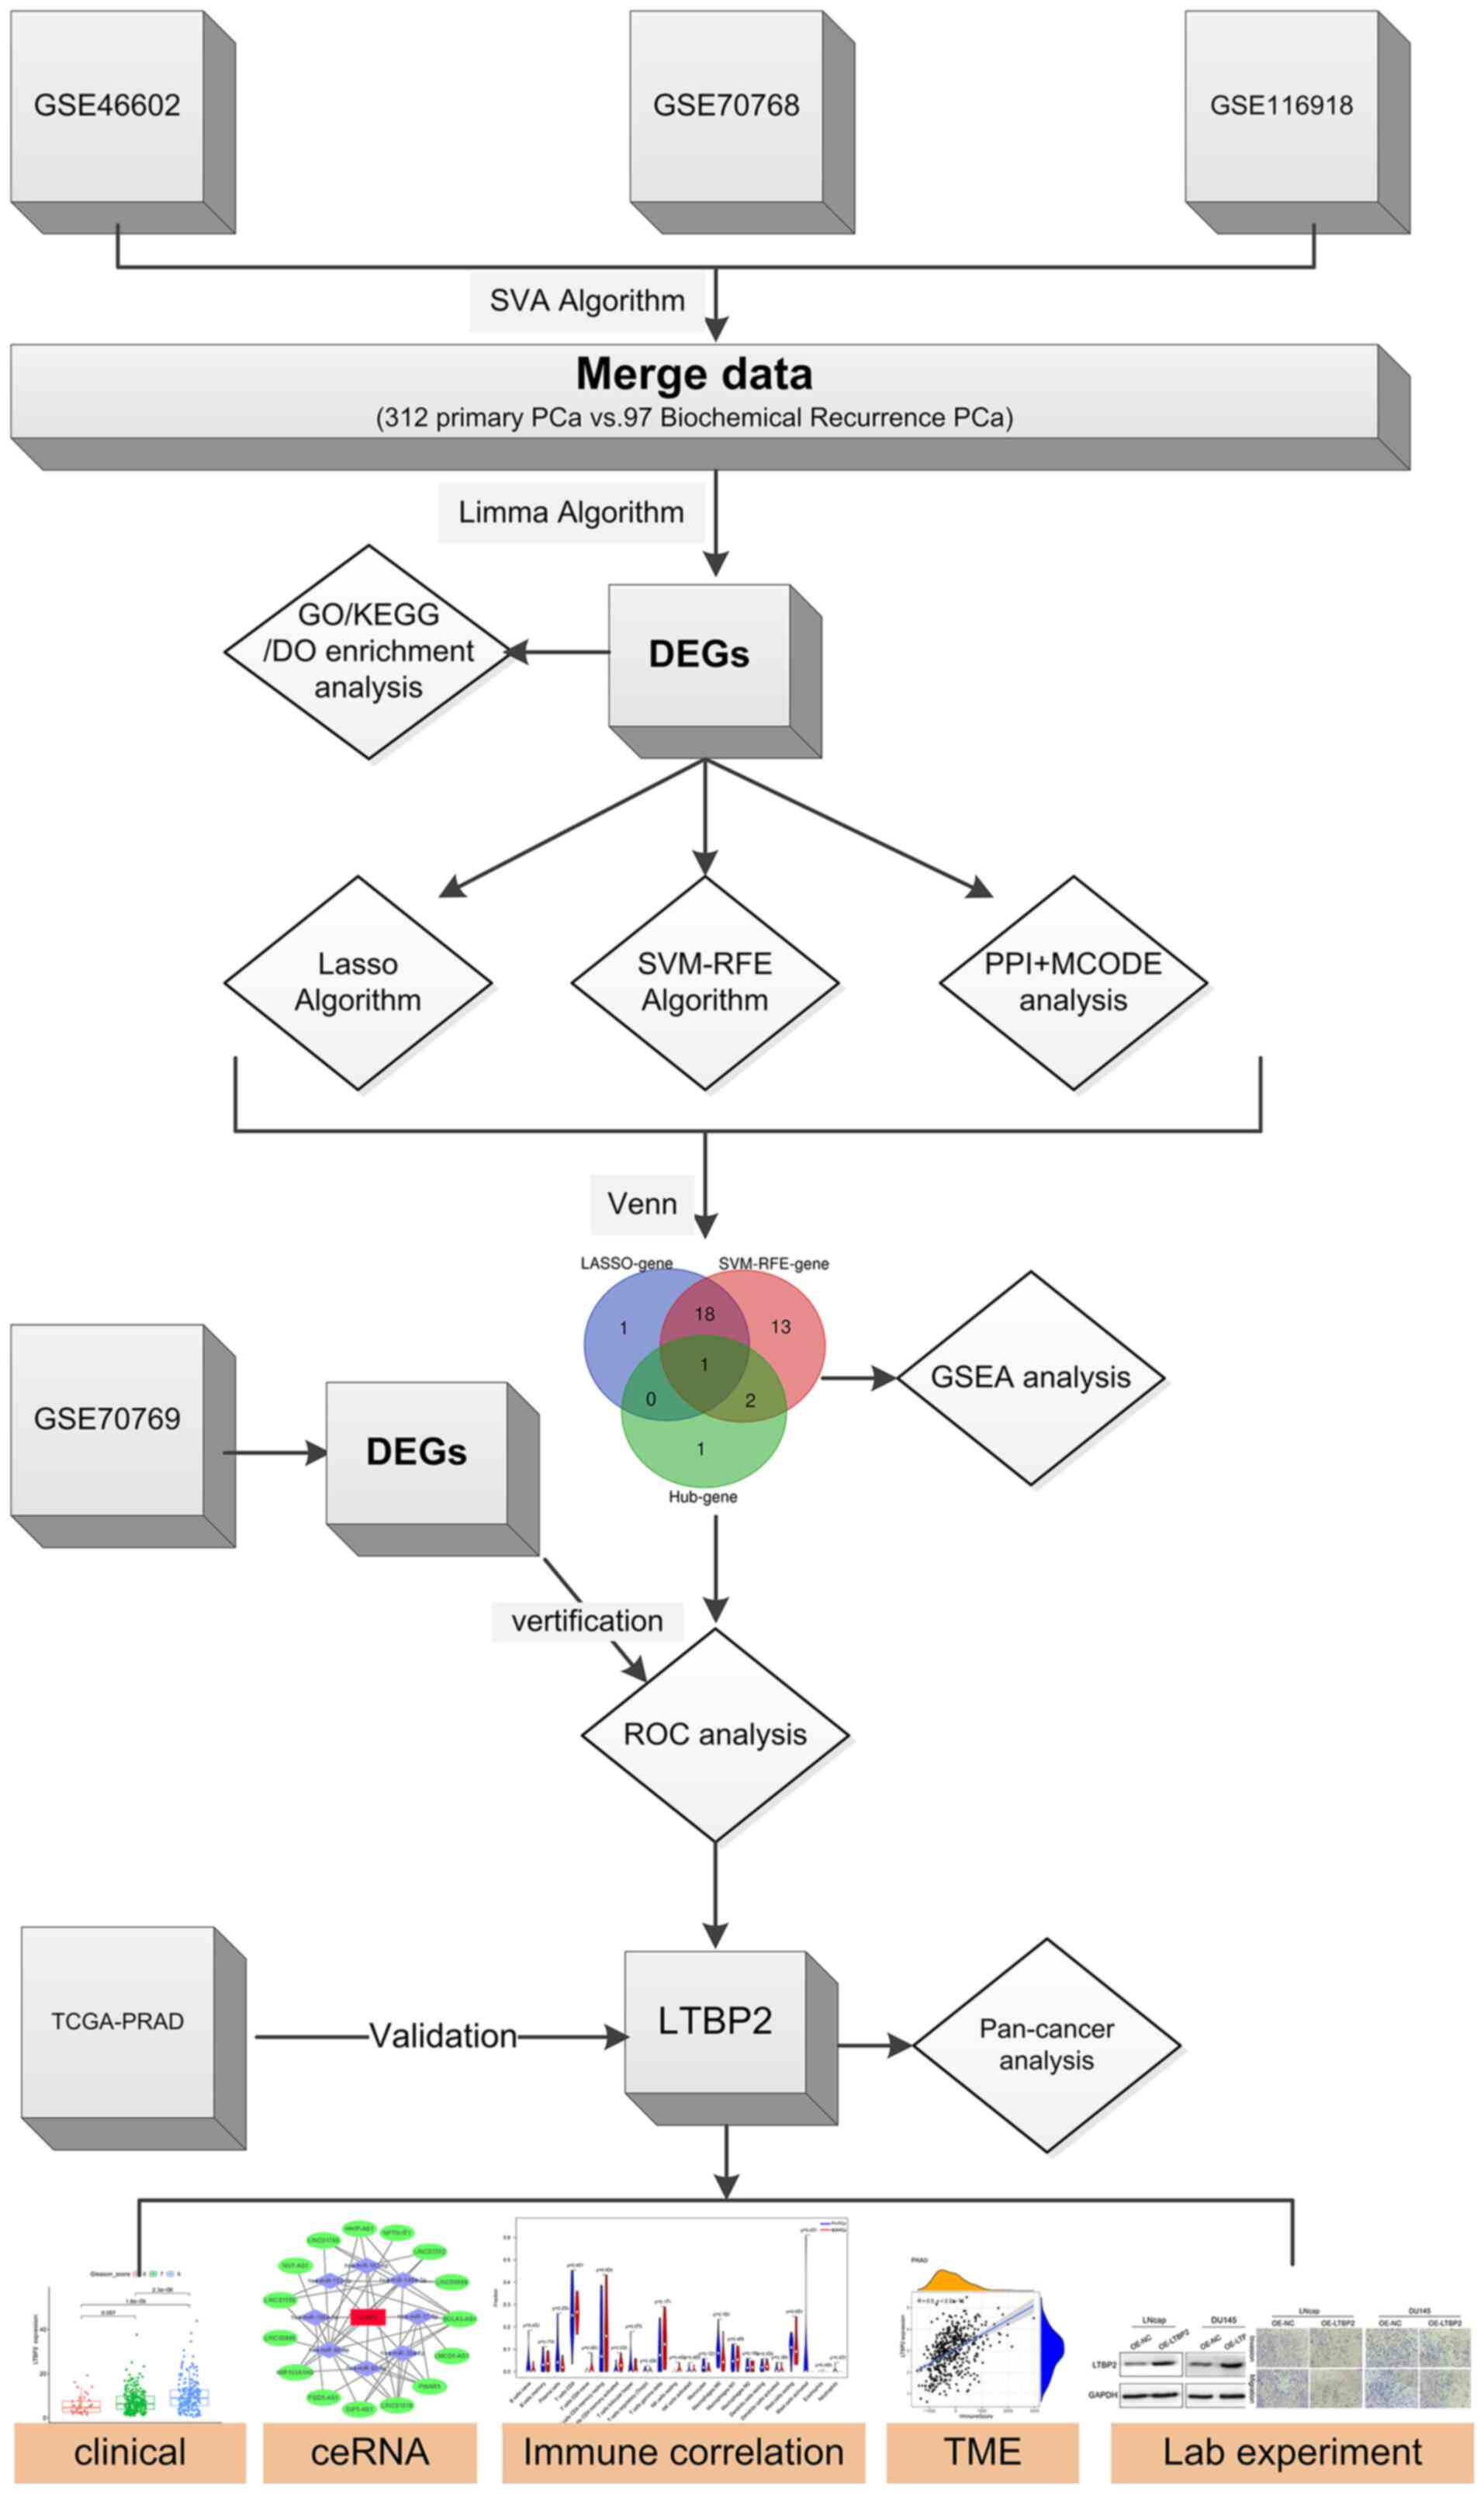 | Figure 1Flow chart of the work on screening
and identifying a key gene associated with biochemical recurrence
of prostate cancer and validating some potential biological
functions. PCa, prostate cancer; GO, Gene Ontology; KEGG, Kyoto
Encyclopedia of Genes and Genomes; DO, Disease Ontology; DEGs,
differentially expressed genes; Lasso, least absolute shrinkage and
selection operator; SVM-RFE, support vector machine with recursive
feature elimination; PPI, protein-protein interaction; MCODE,
molecular complex detection; GSEA, gene set enrichment analysis;
ROC, receiver operating characteristic; TCGA, The Cancer Genome
ATLAS; PRAD, prostate adenocarcinoma; LTBP2, latent transforming
growth factor β-binding protein 2; ceRNA, competitive endogenous
RNA; TME, tumor microenvironment. |
Genes are screened as BCR-associated
key DEGs based on two different algorithms
To obtain key BCR-associated DEGs, two distinct
algorithms for screening were implemented. First, the Lasso Cox
regression algorithm was applied, and 20 key genes were filtered
out from 44 BCR-related DEGs (Fig.
2A). Similarly, the SVM-RFE algorithm was applied, and 34 key
genes were screened out (Fig. 2B).
Finally, 19 BCR-related DEGs were selected as candidates via
overlapping (Fig. 2C).
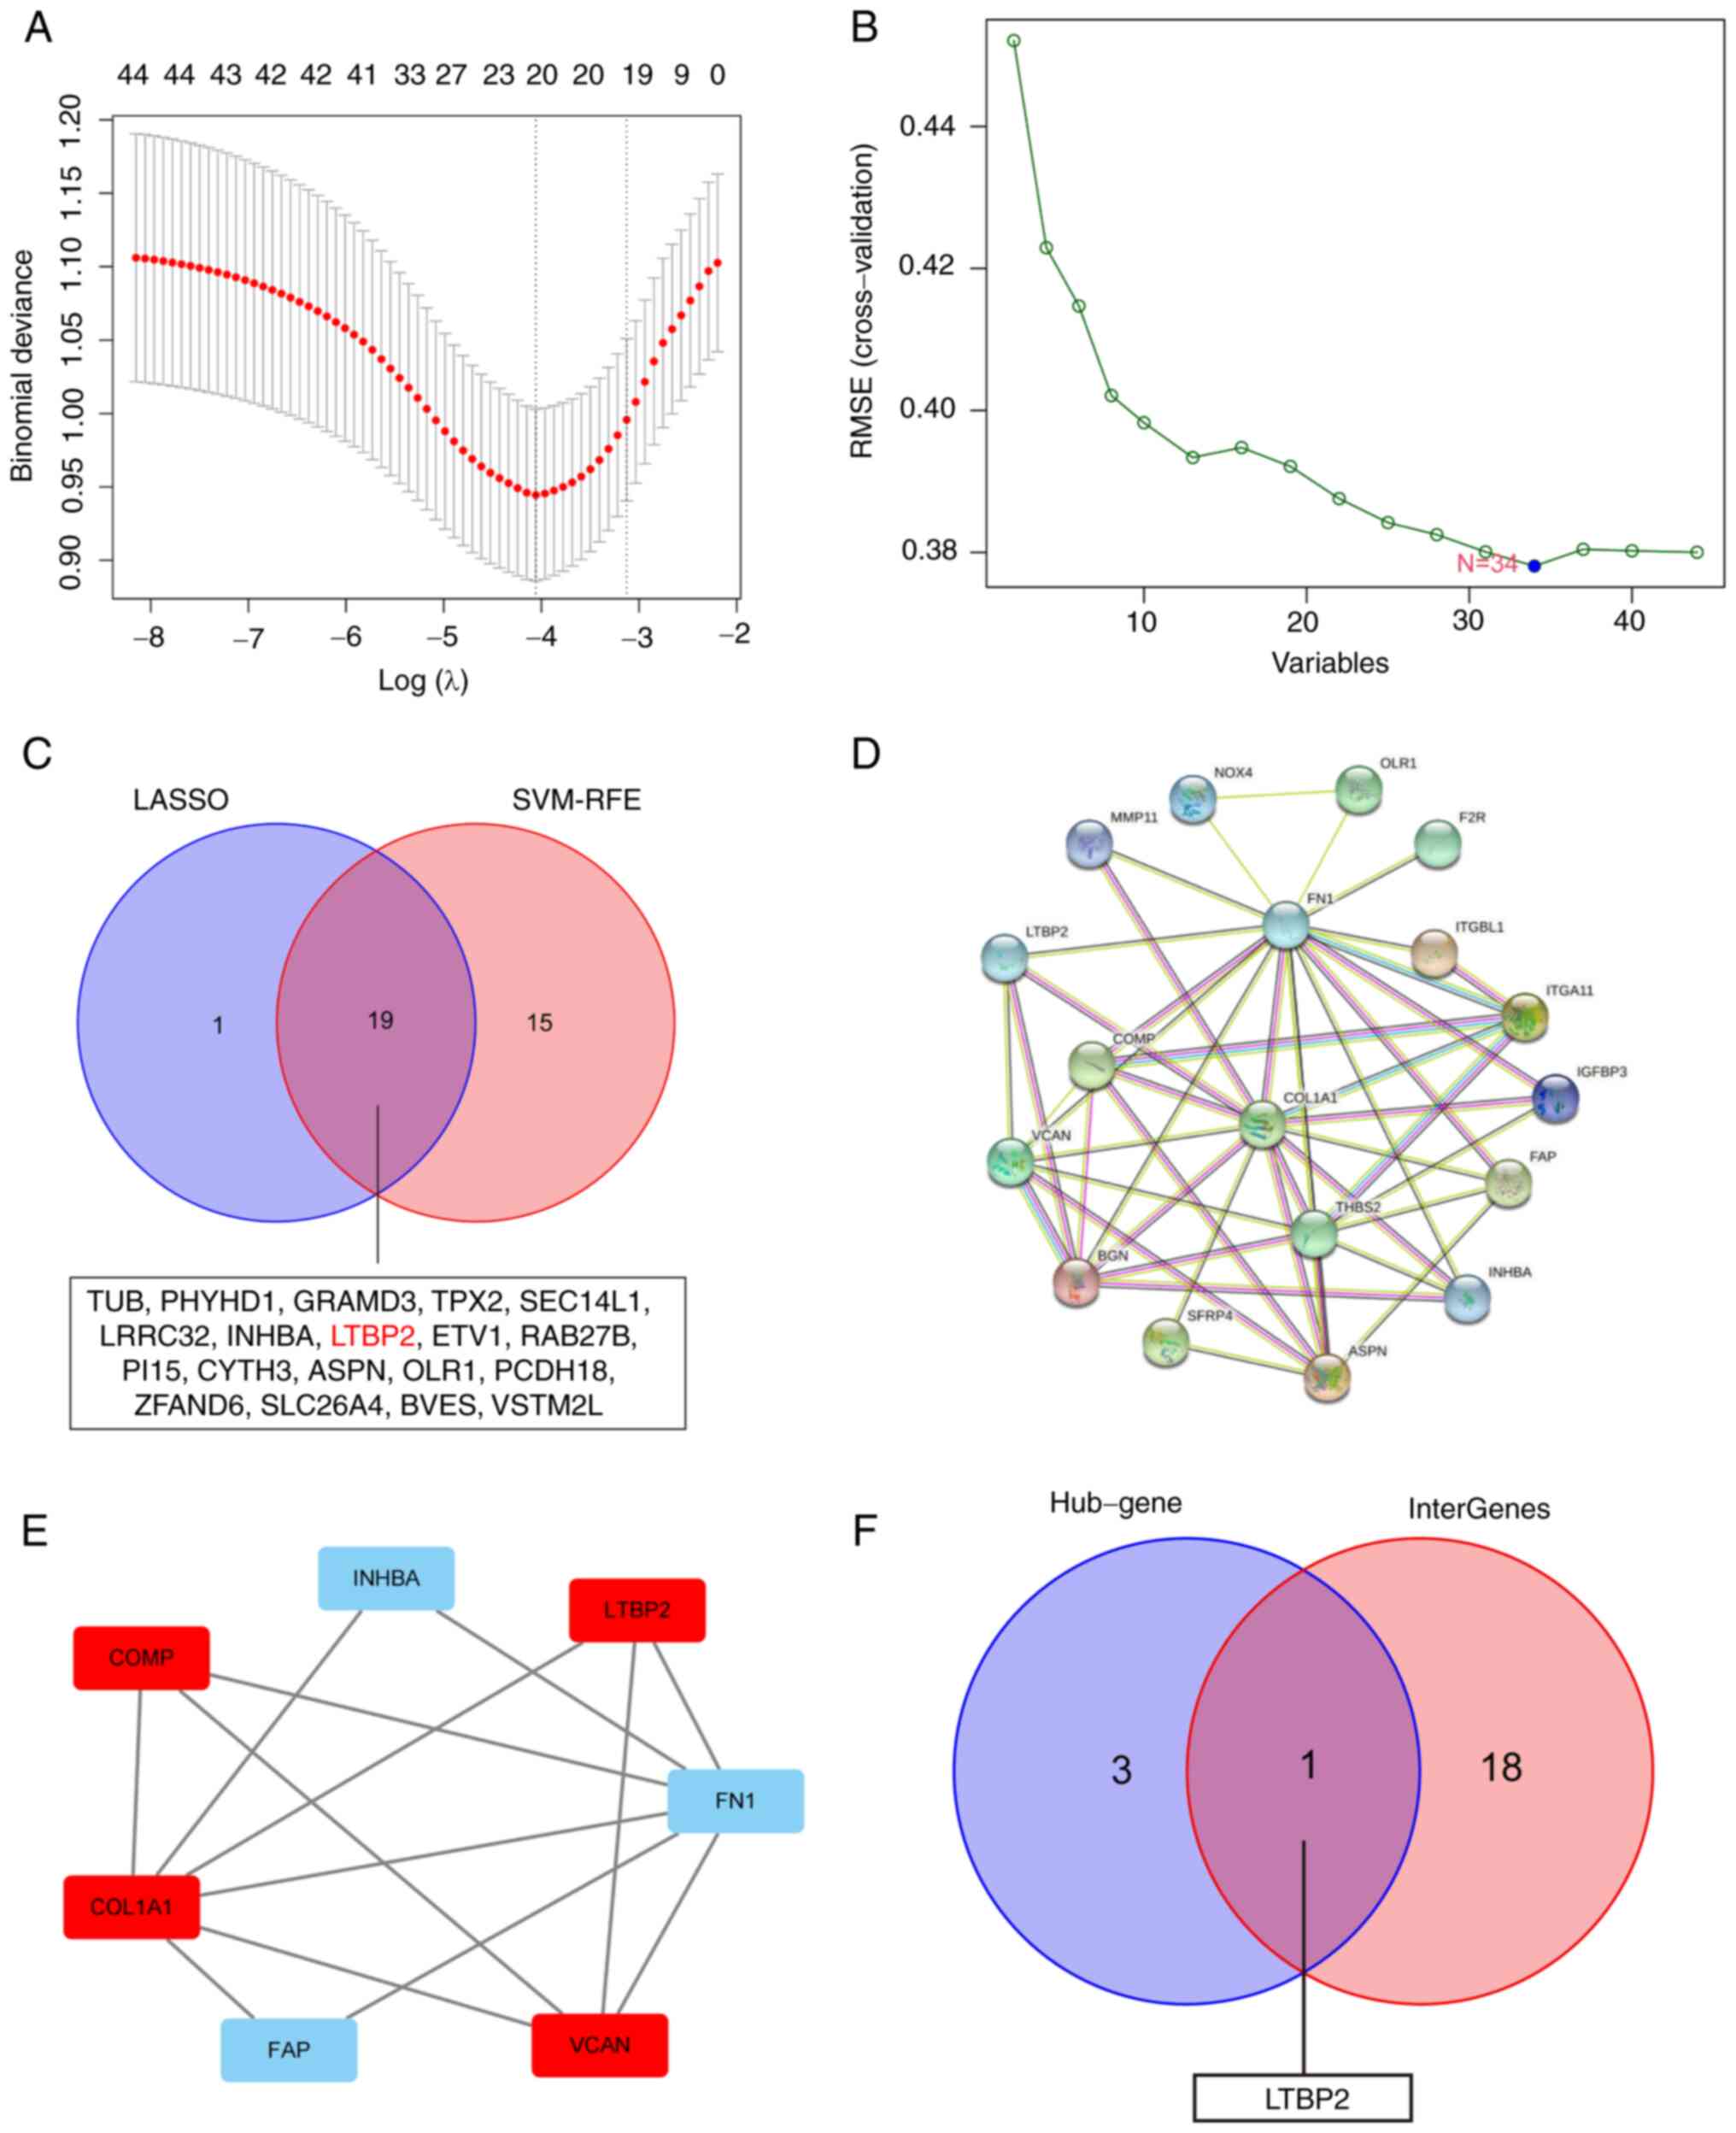 | Figure 2Screening and identification of LTBP2
as a key DEG associated with BCR of PCa. (A) Lasso Cox regression
algorithm was applied to screen DEGs associated with BCR of PCa in
GEO-merged datasets. (B) SVM-RFE algorithm was performed to
identify DEGs associated with BCR of PCa in GEO-merged datasets.
(C) Venn diagram showing the overlap of 19 BCR-based DEGs between
the two different algorithms. (D) PPI analysis of BCR-related DEGs
in PCa using STRING database. (E) The STRING outcomes were uploaded
to Cytoscape software to identify hub genes using MCODE algorithm
in the PPI network. (F) Venn diagram revealed that LTBP2 was the
only BCR-associated hub gene. LTBP2, latent transforming growth
factor β-binding protein 2; DEG, differentially expressed gene;
BCR, biochemical recurrence; PCa, prostate cancer; Lasso, least
absolute shrinkage and selection operator; GEO, Gene Expression
Omnibus; SVM-RFE, support vector machine with recursive feature
elimination; PPI, protein-protein interaction; STRING, The Search
Tool for Retrieving Interacting Genes; MCODE, molecular complex
detection. |
Construction of a PPI network and
MCODE analysis to obtain 4 hub genes
These 44 BCR-related DEGs were utilized to construct
a PPI network using STRING software (Fig. 2D). The outcomes were uploaded to
Cytoscape software and 4 hub genes were identified by MCODE
algorithm (Fig. 2E). Ultimately,
by overlapping the hub genes and key BCR-related DEGs, LTBP2 was
found to be the only candidate diagnostic gene of BCR in PCa that
should be investigated further (Fig.
2F).
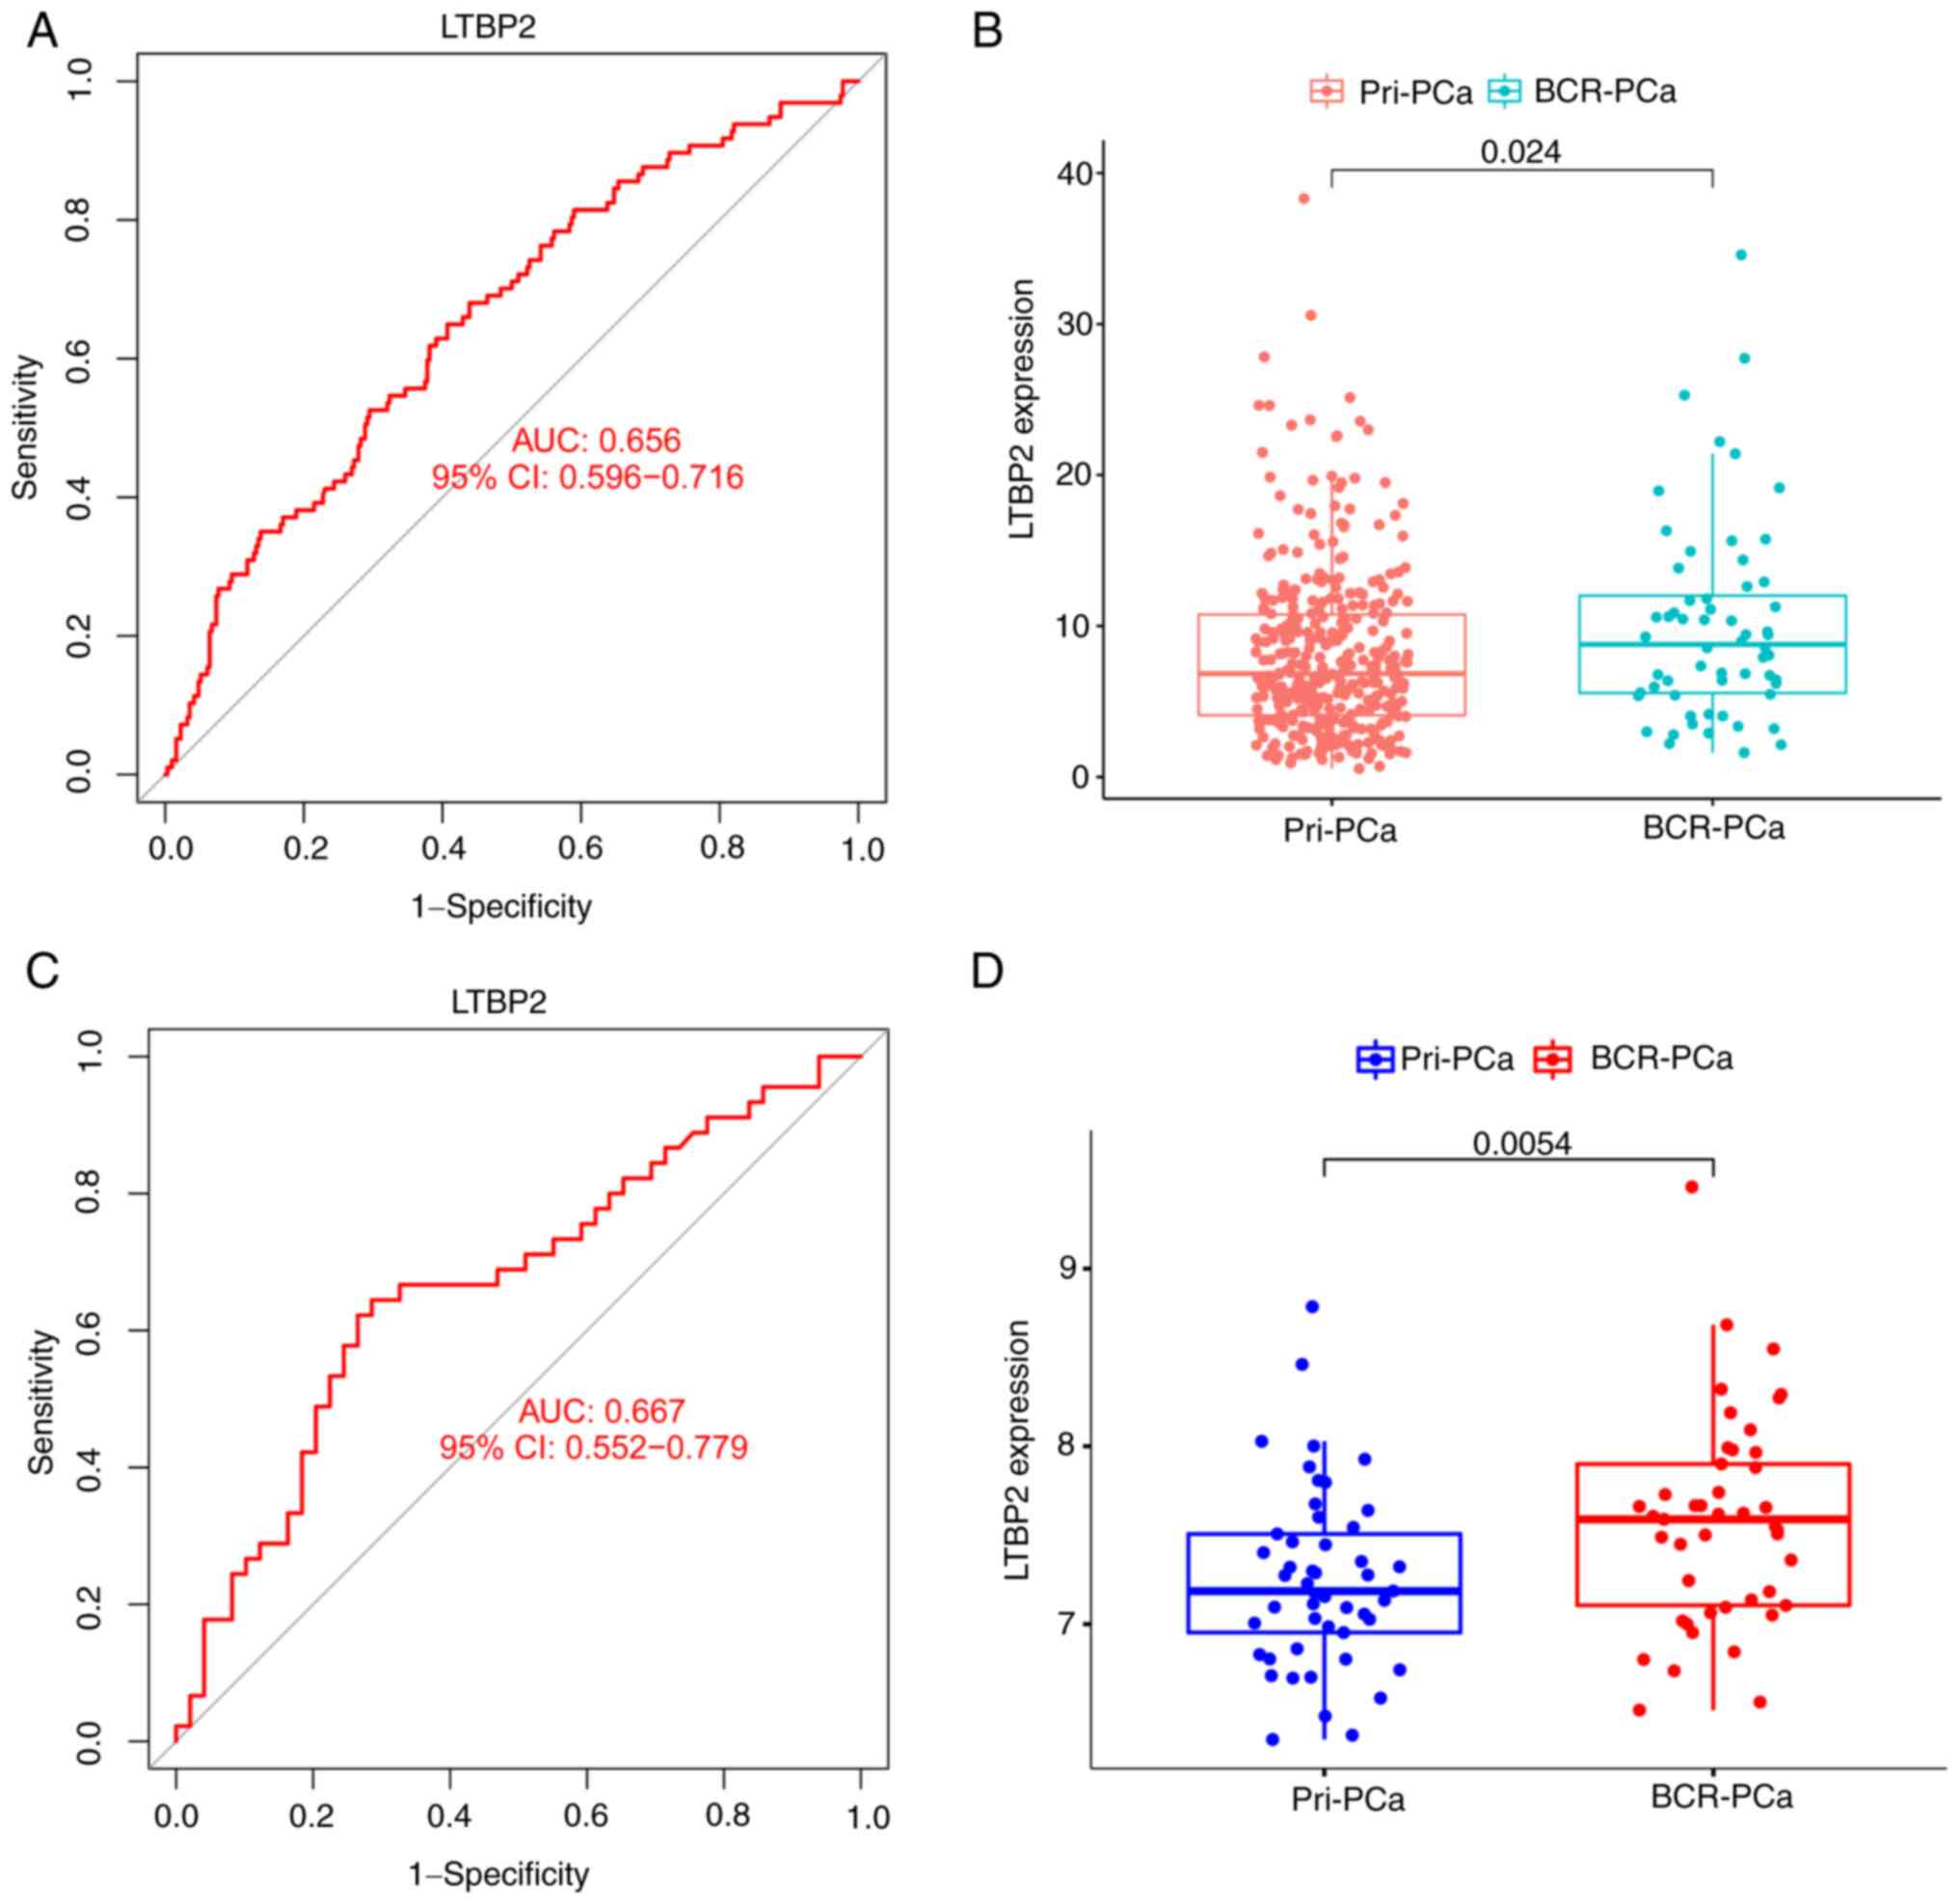
Subsequently, the ROC curve and its AUC value of GEO
merged datasets (the training set) were calculated to assess the
accuracy and sensitivity of LTBP2 as a BCR diagnostic gene for PCa.
As indicated in Fig. 3A, LTBP2 had
moderate accuracy and sensitivity, which was also consistent with
the ROC curve results of the GEO validation cohort (GSE70769)
(Fig. 3C). Additionally, the
expression of LTBP2 in the primary PCa subgroup and the BCR of PCa
subgroup was evaluated. The results demonstrated that the
expression level of LTBP2 was statistically significantly higher in
the BCR of PCa subgroup compared to the primary PCa subgroup in
TCGA-PRAD (Fig. 3B) and GEO
validation dataset (Fig. 3D).
Association of LTBP2 expression with
clinicopathological features and overview of LTBP2 in human tumors
in TCGA database
To assess the clinical value and application of
LTBP2, the association between LTBP2 expression and
clinicopathological traits and the impact on prognosis in TCGA-PRAD
dataset were examined. The results revealed that LTBP2 was
under-expressed in tumor tissues in the TCGA and Genotype-Tissue
Expression (GTEx) database (Fig.
4A and B). Moreover, the ROC
curve also clarified that the efficiency of LTBP2 expression levels
was moderate in distinguishing PCa tissue from normal prostate
tissue (AUC value=0.616) (Fig.
4F). Concurrently, a stratified analysis along with
clinicopathological features was performed. The results highlighted
in Fig. 4C-E and Table I indicated that LTBP2 expression
was primarily upregulated with increased Gleason score and American
Joint Committee on Cancer (AJCC) T stage (P<0.05). However, it
was independent of increasing PSA value.
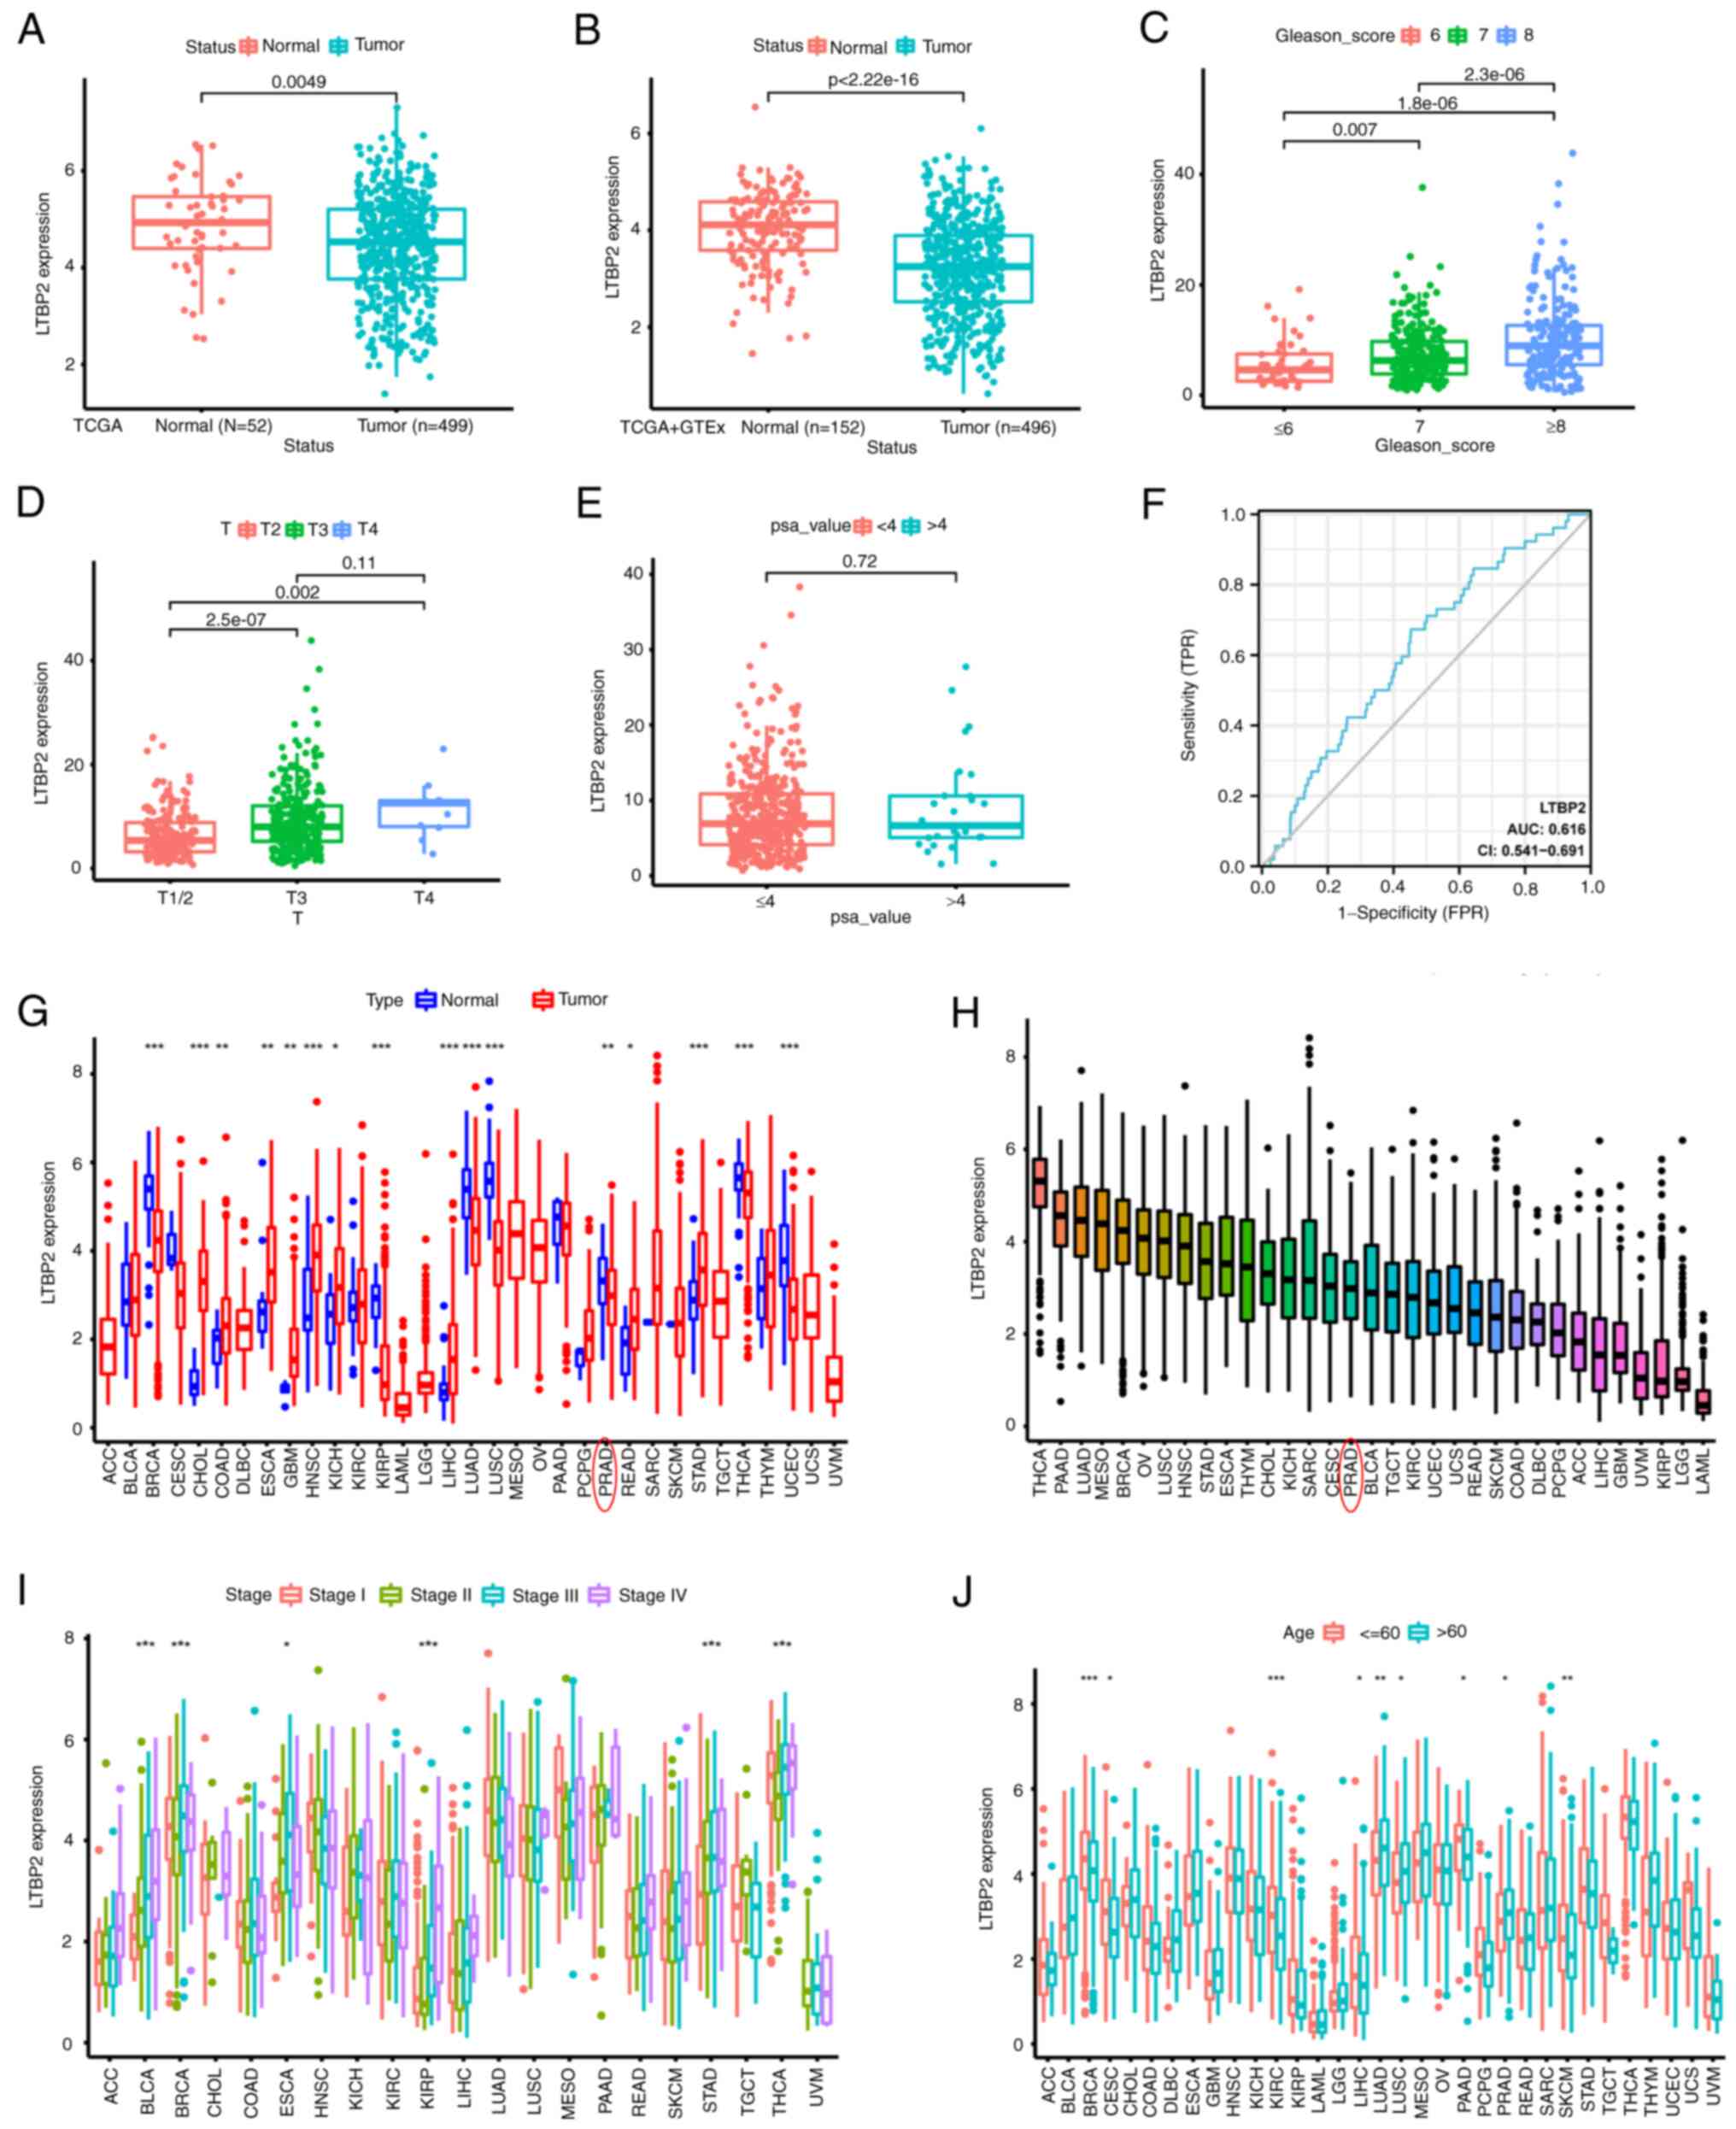 | Figure 4Associations of LTBP2 expression with
clinicopathological features and pan-cancer analysis. (A and B)
Boxplots revealed that LTBP2 was under-expressed in tumor tissues
compared with normal control tissues in (A) TCGA-PRAD dataset and
(B) TCGA combined with GTEx dataset. (C-E) Boxplot indicating LTBP2
expression in different (C) Gleason-score, (D) AJCC T stage, (E)
PSA-value of PCa samples from TCGA-PRAD dataset. (F) The ROC curves
revealed the efficiency of LTBP2 expression levels to distinguish
PCa tissues from normal prostate tissues. (G and H) Boxplots
displaying the LTBP2 expression using pan-cancer analysis. (I and
J) Boxplot indicating LTBP2 expression in various
clinicopathological features using pan-cancer analysis. Subgroup
comparison between different tumors in G-I were demonstrated using
*P<0.05, **P<0.01 and
***P<0.001. LTBP2, latent transforming growth factor
β-binding protein 2; TCGA, The Cancer Genome ATLAS; PRAD, prostate
adenocarcinoma; GTEx, Genotype-Tissue Expression; AJCC, American
Joint Committee on Cancer; PSA, prostate-specific antigen; PCa,
prostate cancer; ROC, receiver operating characteristic. |
 | Table IComparison of clinical
characteristics of prostate cancer patients in TCGA-PRAD
database. |
Table I
Comparison of clinical
characteristics of prostate cancer patients in TCGA-PRAD
database.
| | Expression of
LTBP2 | |
|---|
|
Characteristics | Total | Low (%) | High (%) | P-value |
|---|
| Total samples,
n | 449 | 249 | 250 | |
| Age, n (%) | | | | 0.054 |
|
≤60 | 324 | 123 (24.6) | 101 (20.2) | |
|
>60 | 275 | 126 (25.3) | 149 (29.9) | |
| T stage, n (%) | | | | <0.001 |
|
T2 | 189 | 117 (23.8) | 72 (14.6) | |
|
T3 | 292 | 128(26) | 164 (33.3) | |
|
T4 | 11 | 2 (0.4) | 9 (1.8) | |
| N stage, n (%) | | | | 0.120 |
|
N0 | 347 | 168 (39.4) | 179(42) | |
|
N1 | 79 | 30(7) | 49 (11.5) | |
| M stage, n (%) | | | | 0.99 |
|
M0 | 455 | 228 (49.8) | 227 (49.6) | |
|
M1 | 3 | 2 (0.4) | 1 (0.2) | |
| PSA (ng/ml), n
(%) | | | | 0.99 |
|
<4 | 415 | 207 (46.8) | 208 (47.1) | |
|
≥4 | 27 | 14 (3.2) | 13 (2.9) | |
| Gleason score, n
(%) | | | | <0.001 |
|
6 | 46 | 33 (6.6) | 13 (2.6) | |
|
7 | 247 | 142 (28.5) | 105(21) | |
|
8 | 64 | 28 (5.6) | 36 (7.2) | |
|
9 | 138 | 45(9) | 93 (18.6) | |
|
10 | 4 | 1 (0.2) | 3 (0.6) | |
Furthermore, given the scarcity of LTBP2-associated
cancer studies in solid tumors, as shown in Fig. S2, its expression was evaluated in
33 solid tumors. LTBP2 was differentially expressed in distinct
cancer types and was under-expressed in numerous solid tumors
compared to corresponding normal tissues (Fig. 4G and H). In addition, to describe the
association between LTBP2 expression and clinicopathological
features, LTBP2 expression was analyzed according to the different
clinicopathological features in different solid tumors, such as the
AJCC stage. Significant differences between LTBP2 expression and
some clinical characteristics of different strata of certain tumors
were identified (Fig. 4I and
J). Moreover, a univariate Cox
regression analysis was performed to assess the effect of LTBP2 on
prognosis in different cancer types. The LTBP2 expression did not
significantly affect OS (Fig.
S3A), DSS (Fig. S3B), PFI
(Fig. S3C) in PCa, paralleling
the results obtained from the Kaplan-Meier survival analysis
(Fig. S4).
Expression of LTBP2 is associated with
CD4+ T-cell recruitment and linked to immunotherapeutic
response
As reported in the literature, immunity plays an
essential role in the development and treatment of tumors (51). Hence, the association between LTBP2
and immunity was investigated. The CIBERSORT algorithm was used to
calculate the score of the tumor immune cells in pan-cancer.
Spearman correlation analysis was performed and revealed that LTBP2
was associated with T-cell follicular helper and CD4+
T-cell memory resting recruitment as well as macrophage M2
polarization in TCGA-PRAD dataset in 33 solid tumors (Fig. S5). Subsequently, the correlation
of LTBP2 with tumor immune infiltration cells in GEO merged
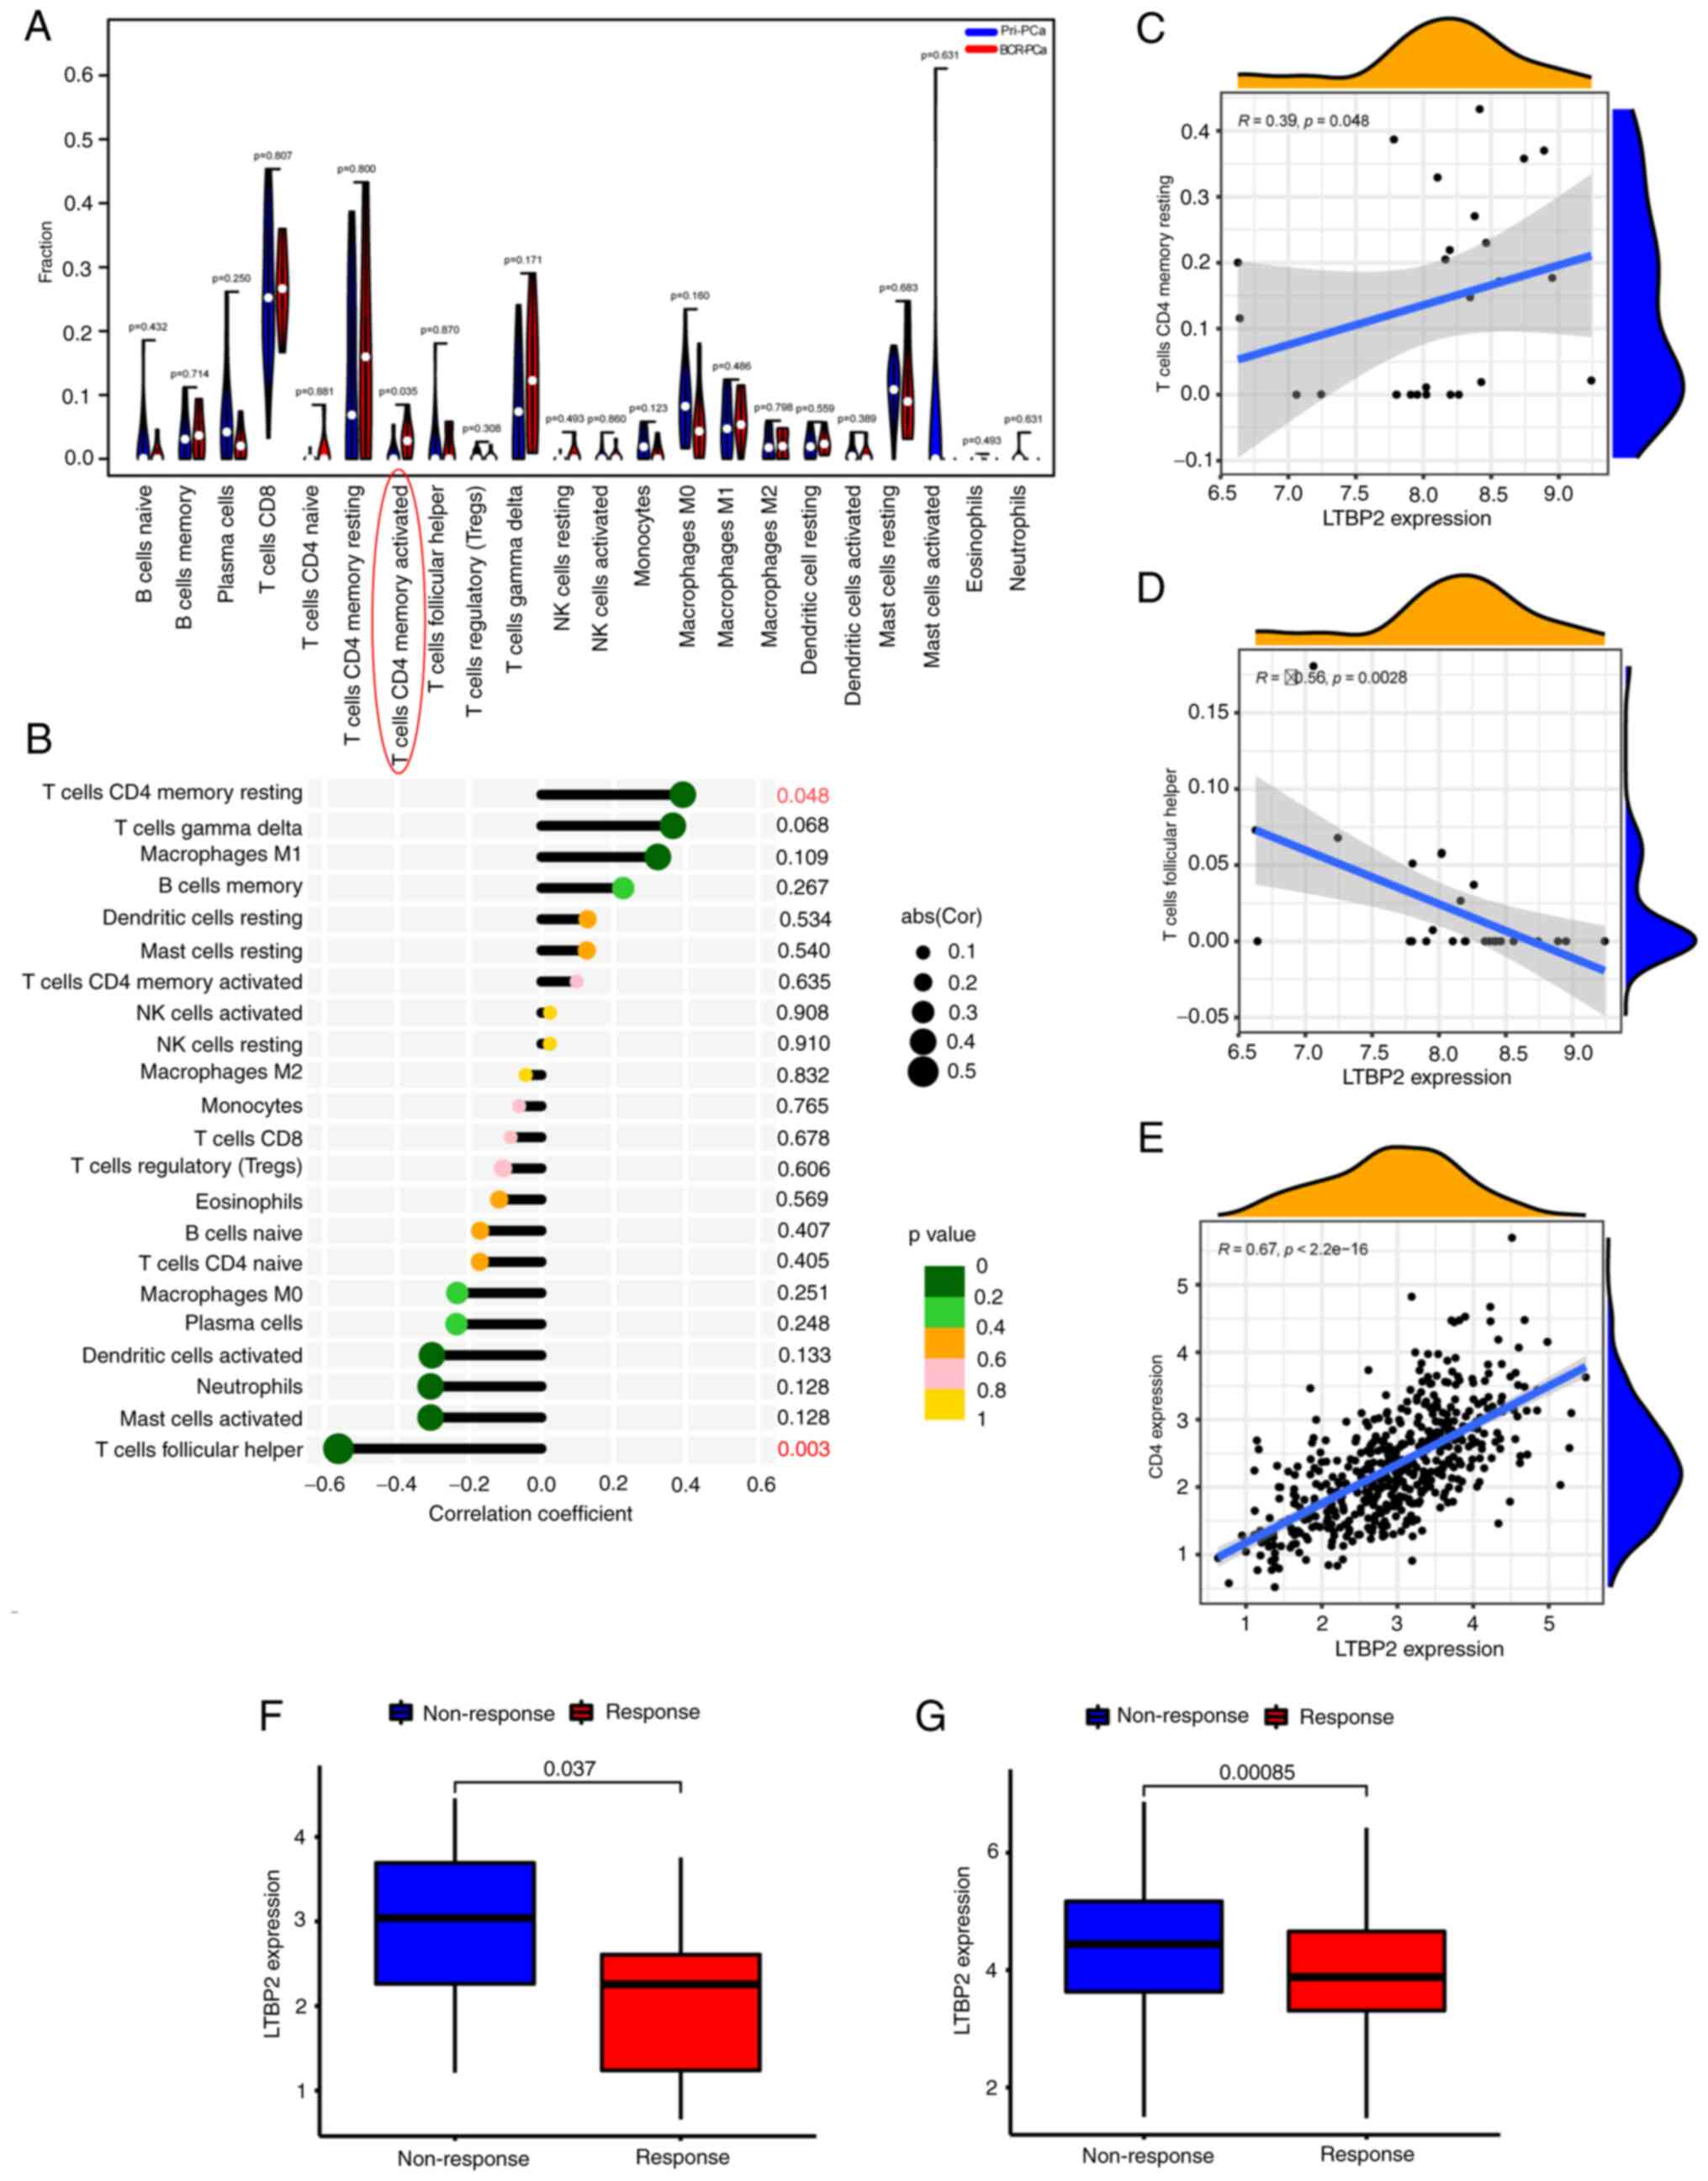
datasets was validated. As revealed in Figs. S6A and 5A, there were significant differences in
the proportion of immune cells between primary PCa and BCR of PCa,
especially CD4 memory-activated T cells. Moreover, as revealed in
Fig. 5B-D, LTBP2 expression was
correlated with T-cell follicular helper and CD4+ T-cell
memory resting in the GEO merged datasets, paralleling the results
obtained from TCGA-PRAD dataset. Furthermore, the effect of LTBP2
expression on the correlation between different tumor-infiltrating
immune cells in the GEO merged datasets was identified (Fig. S6B). Therefore, based on the
aforementioned results, it was hypothesized that LTBP2 expression
was associated with CD4+ T-cell recruitment, which was
also verified in TCGA-PRAD dataset. As confirmed in Fig. 5E, LTBP2 expression revealed a
significant positive correlation with CD4+ T-cell
levels. However, whether LTBP2 had an effect on macrophage M2
polarization was not verified in the GEO merged cohort.
Additionally, the predictive role of LTBP2 was
investigated in the immunotherapeutic response against PD-1/PD-L1
based on two immunotherapy cohorts. As shown in Fig. 5F and G, patients with low LTBP2
expression had a significantly more robust immune response than
those with high expression in the anti-PD-1 immunotherapy cohort
(GSE78220) and anti-PD-L1 immunotherapy cohort (IMvigor210 cohort).
Hence, these results confirmed the predictive role of LTBP2 on the
immunotherapeutic benefit in PCa patients with BCR.
Expression of LTBP2 is associated with
TME and can predict clinical benefit of ICB
Given the aforementioned results, it was
hypothesized that LTBP2 was also correlated with the TME. The
ESTIMATE algorithm was used to calculate the tumor cell stromal
score, immune score and tumor purity for each patient in TCGA-PRAD
dataset. Spearman correlation analysis was performed and revealed
that LTBP2 expression was positively correlated with immune score
and stromal score in TCGA-PRAD dataset (Fig. 6A and B). In addition, LTBP2 expression was
significantly positively correlated with T-cell CD4 memory resting
and significantly negatively correlated with T-cell follicular
helper in the TCGA-PRAD dataset, which validated the recruitment of
LTBP2 to CD4+ T cells (Fig.
6C and D). LTBP2 expression
was significantly associated with immune cell marker genes, except
for CEACAM8 (Fig. S7; Table SIII). In addition, to further
clarify the role of LTBP2 on ICB, the association between LTBP2 and
several well-known immune checkpoint genes was explored. The
results showed that the mRNA expression of LTBP2 was significantly
positively correlated with the relative expression levels of PD-L1,
CTLA4, and PD-1 (Fig. 6E), but
negatively correlated with tumor purity in the TIMER database, as
verified in the GEPIA database.
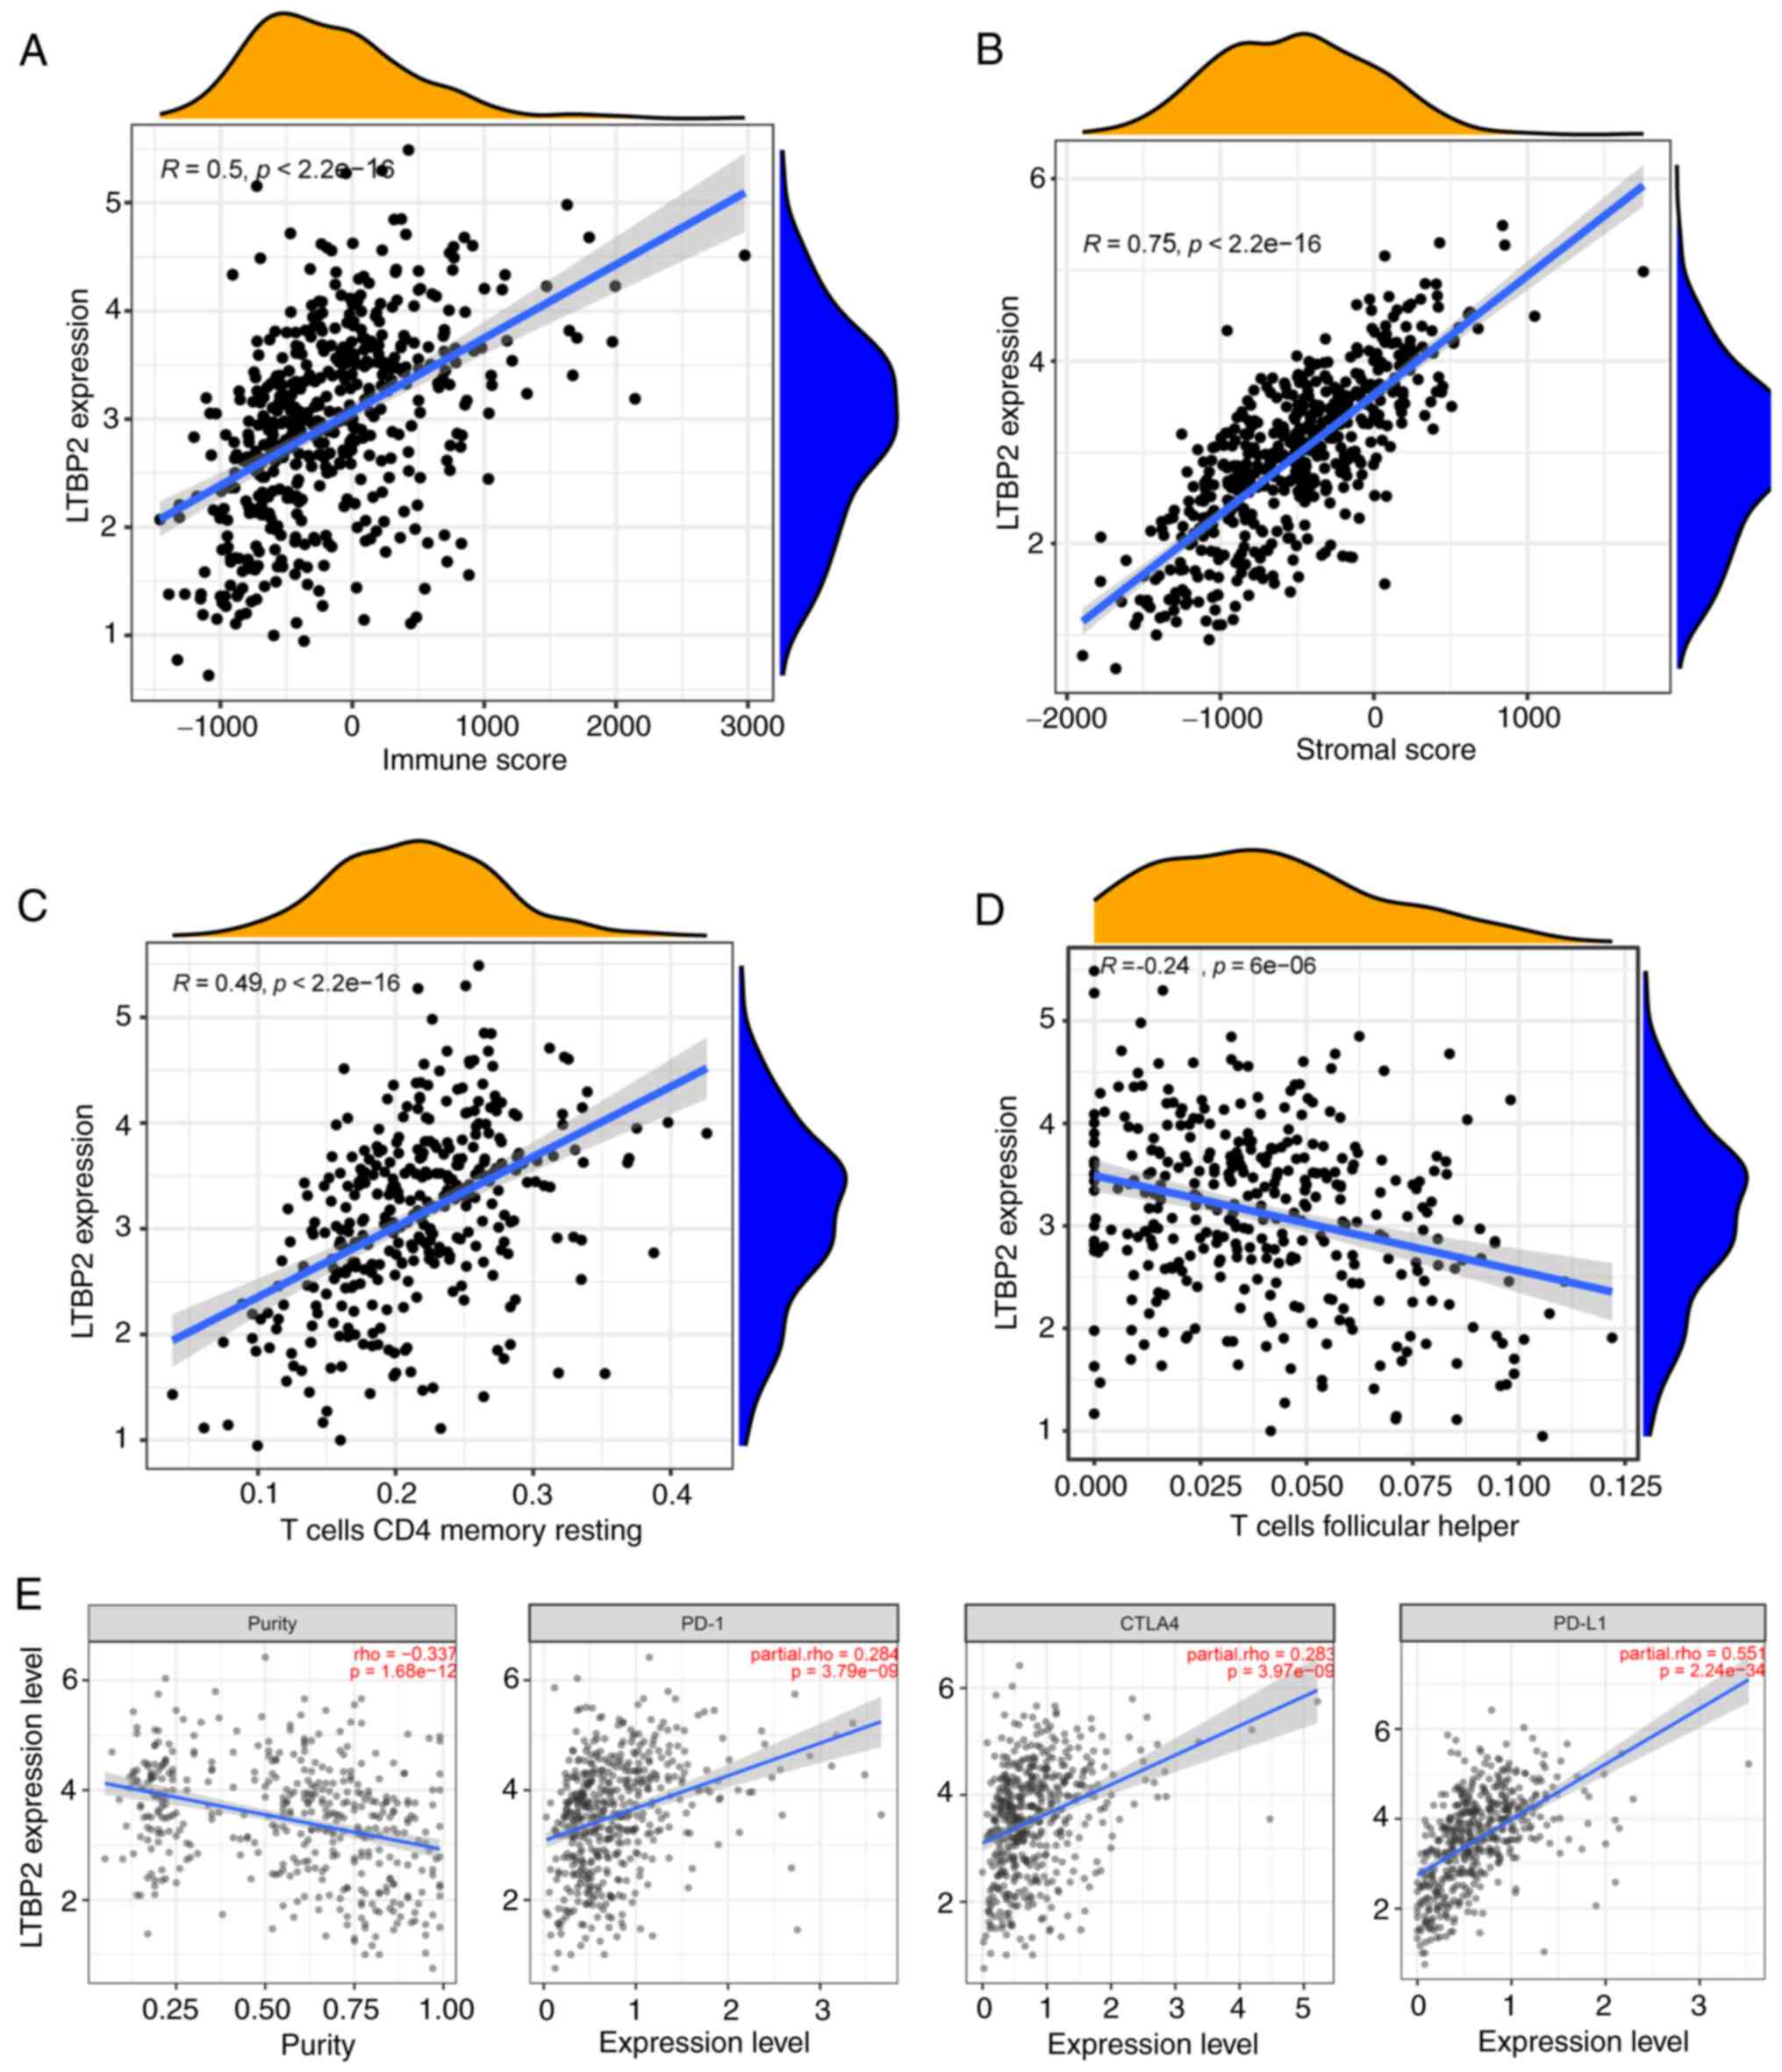 | Figure 6mRNA expression of LTBP2 is
correlated with the TME infiltration cell characteristics and
immune checkpoint genes. (A and B) The correlation scatter plot
revealed that LTBP2 expression was positively correlated with (A)
immune score and (B) stromal score in TCGA-PRAD dataset. (C and D)
The correlation scatter plot confirmed that LTBP2 expression was
significantly positively correlated with T-cell CD4 memory resting,
while it was significantly negatively correlated with T-cell
follicular helper in TCGA-PRAD dataset. (E) The scatter plot showed
that the mRNA expression of LTBP2 was significantly positively
correlated with the relative expression of immune checkpoint genes,
including PD-L1, CTLA4, PD-1, but negatively correlated with tumor
purity in the TIMER database and GEPIA database (cor >0; P-value
<0.001). LTBP2, latent transforming growth factor β-binding
protein 2; TME, tumor microenvironment; TCGA, The Cancer Genome
ATLAS; PRAD, prostate adenocarcinoma; PD-1, programmed cell death
protein 1; TIMER, Tumor Immune Estimation Resource; GEPIA, Gene
Expression Profiling Interactive Analysis. |
GO/KEGG/DO functional enrichment
analysis and GSEA analysis of the DEGs
Subsequently, GO, KEGG, DO enrichment analyses and
GSEA analysis was conducted to identify the biological functions
and signaling pathways of LTBP2. These enrichment analyses were
performed for the BCR-associated DEGs. The GO profiles revealed
that these DEGs were integrally correlated with transforming growth
factor-β (TGF-β) receptor and cellular metabolic processes. The top
ten GO terms of MF, CC, and BP associated with 44 BCR-related are
presented in Fig. 7A. Similarly,
the DO enrichment analysis revealed that the top five DO terms had
a close association with cardiovascular disease and connective
tissue cancer (Fig. 7B). It was
also observed that the top 5 signaling pathways based on KEGG
analysis mainly participated in PI3K-AKT/ECM-receptor
interaction/Focal adhesion/TGF-β signaling pathways (Fig. 7C). Finally, to systematically
assess the potential biological functions and signaling pathways of
these BCR-associated DEGs involved in molecular heterogeneity, the
GSEA method was employed to identify and validate them in a
GEO-merged BCR-related dataset (Fig.
7D) and TCGA-PRAD BCR-related dataset (Fig. 7E). The findings also demonstrated
that the top 5 pathways were closely associated to cell adhesion
molecules (CAMs) and focal adhesion.
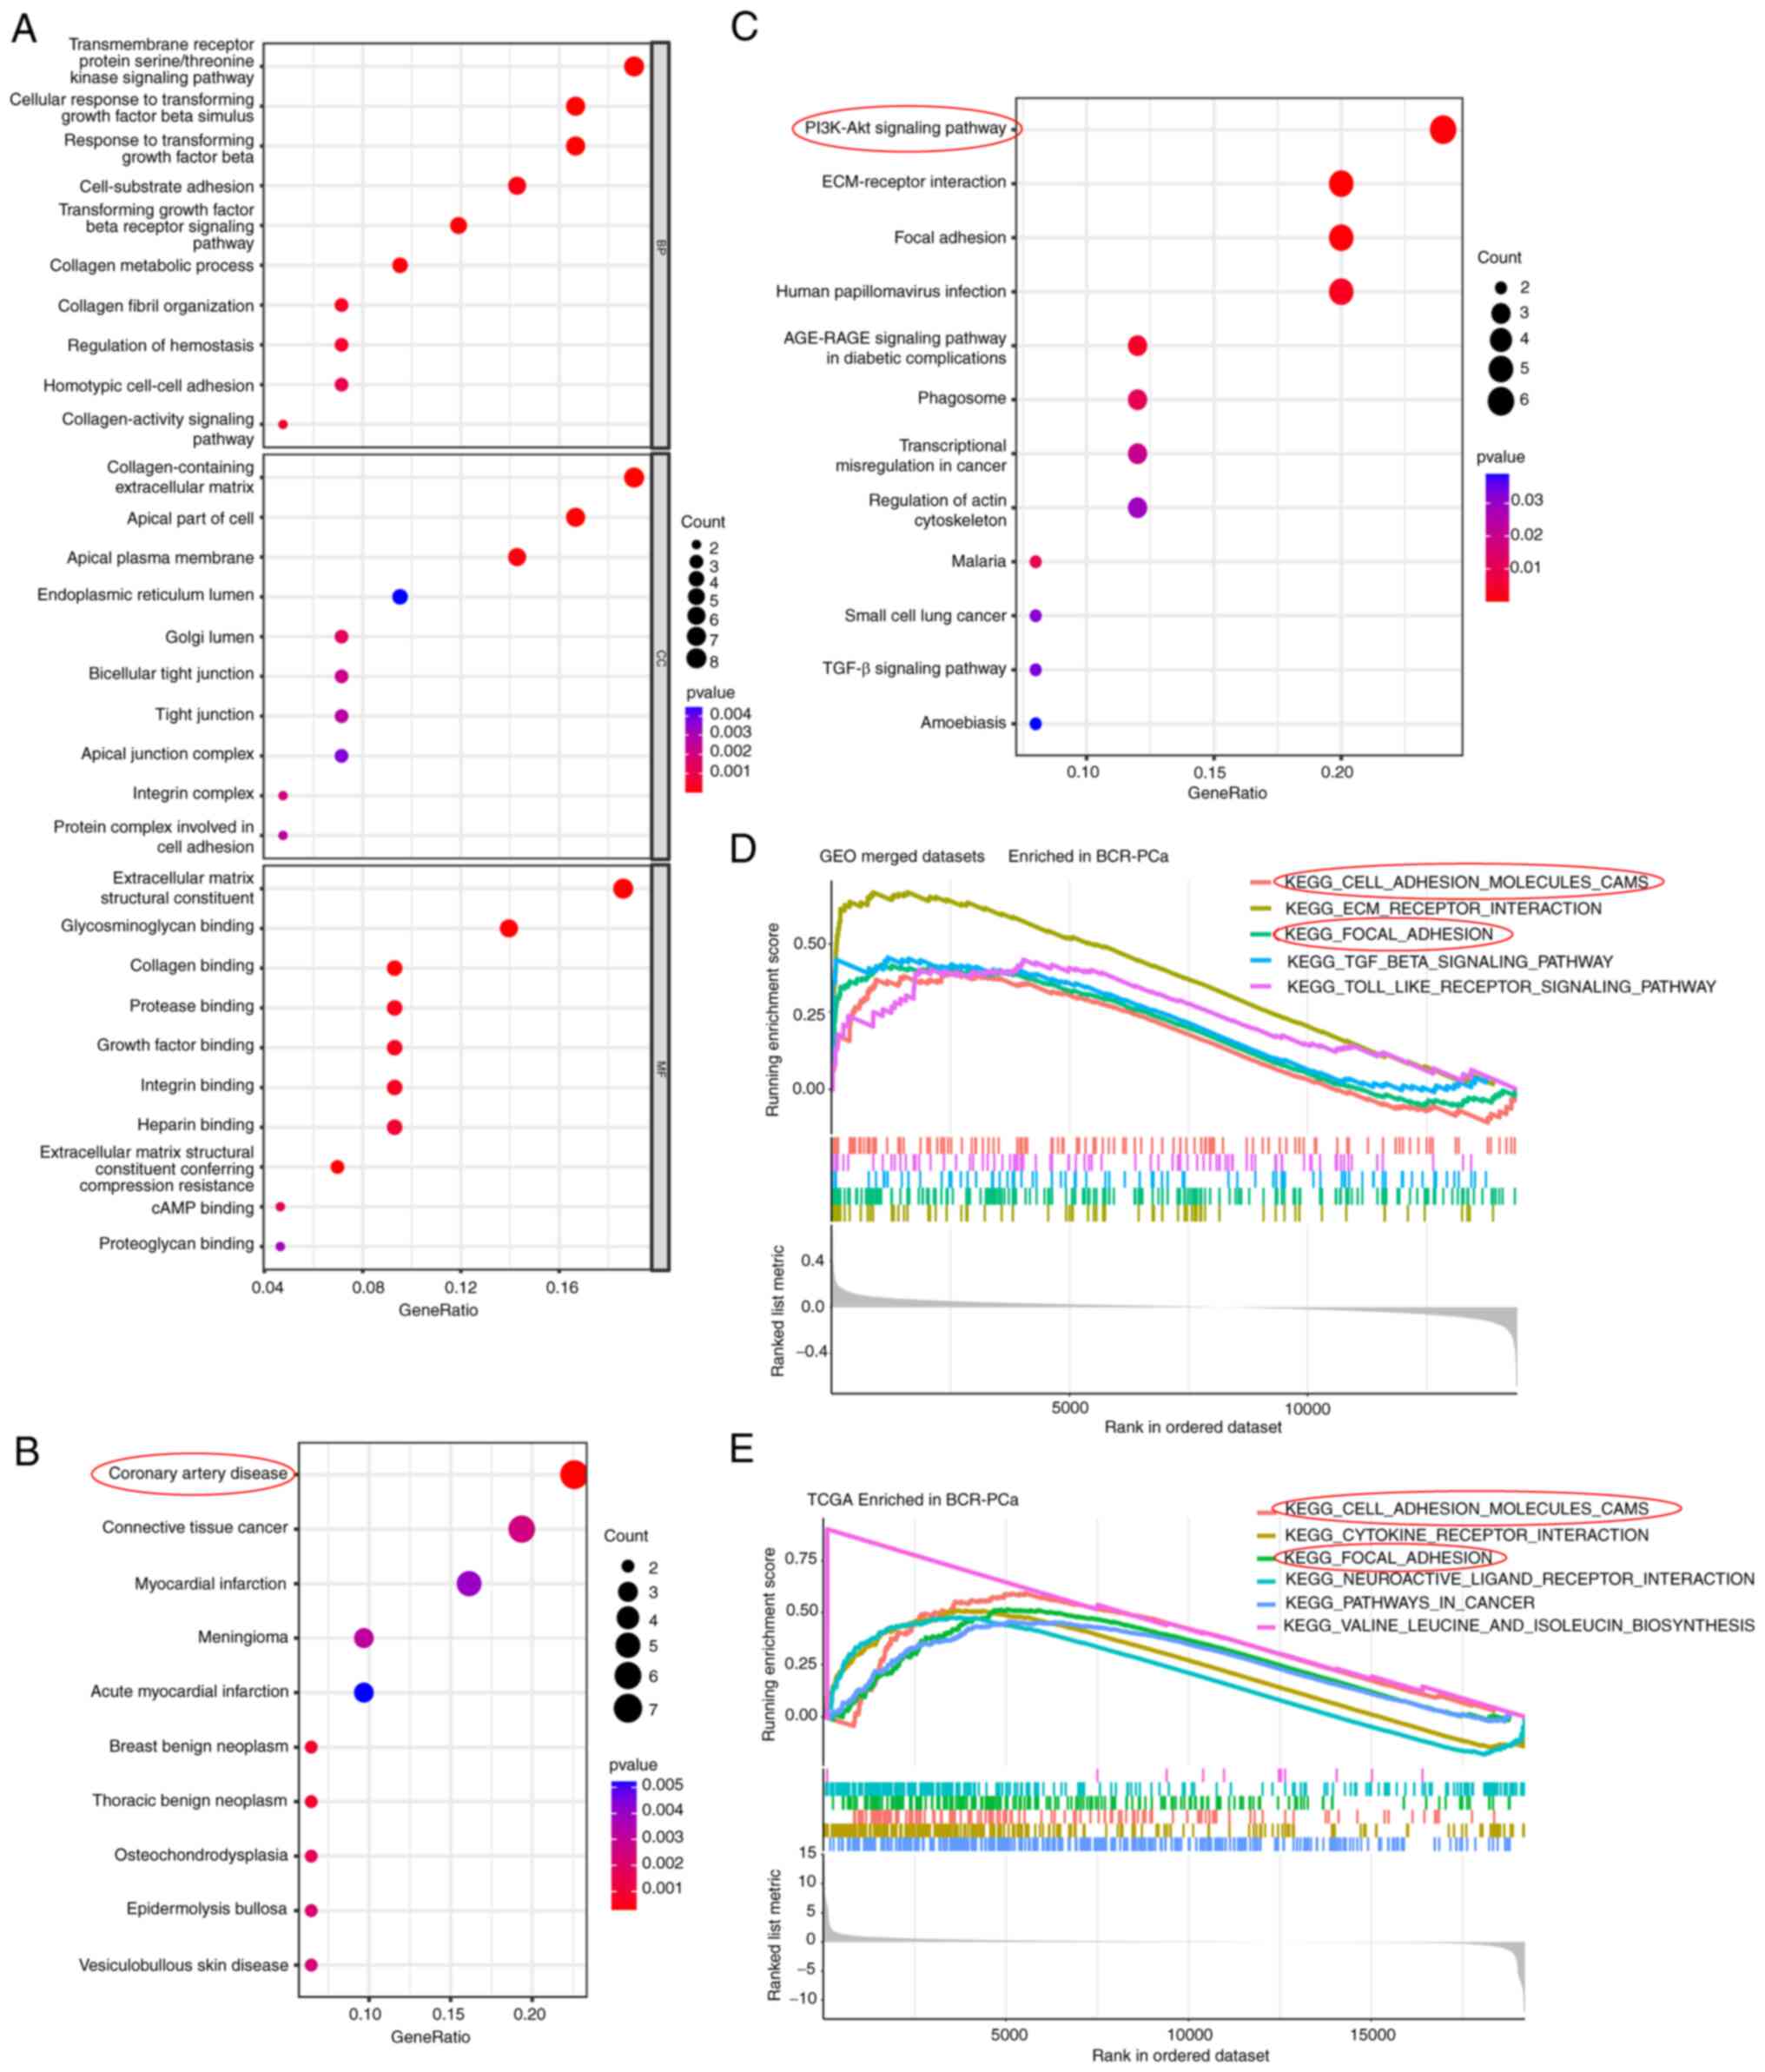 | Figure 7Biological function and pathway
annotation enrichment analysis. (A) Bubble plot of GO enrichment
analysis of the 44 BCR-associated DEGs revealing the enriched BP,
CC and MF. (B) DO enrichment analysis of the 44 BCR-associated DEGs
showing the enriched top 10 diseases. (C) KEGG pathway analysis
revealed the enriched signaling pathways of the 44 BCR-associated
DEGs. (D) GSEA showed the top five KEGG signaling pathways in
BCR-PCa of the GEO-merged dataset. (E) GSEA enrichment analysis
showed the top six KEGG signaling pathways in BCR-PCa in TCGA-PRAD
dataset. GO, Gene Ontology; BCR, biochemical recurrence; DEGs,
differentially expressed genes; BP, biological processes; CC,
cellular components; MF, molecular functions; DO, Disease Ontology;
KEGG, Kyoto Encyclopedia of Genes and Genomes; GSEA, gene set
enrichment analysis; PCa, prostate cancer; GEO, Gene Expression
Omnibus. |
Validation of LTBP2 expression and
biological function in vitro and confirmation of the involvement of
the PI3K/AKT signaling pathway in BCR of PCa
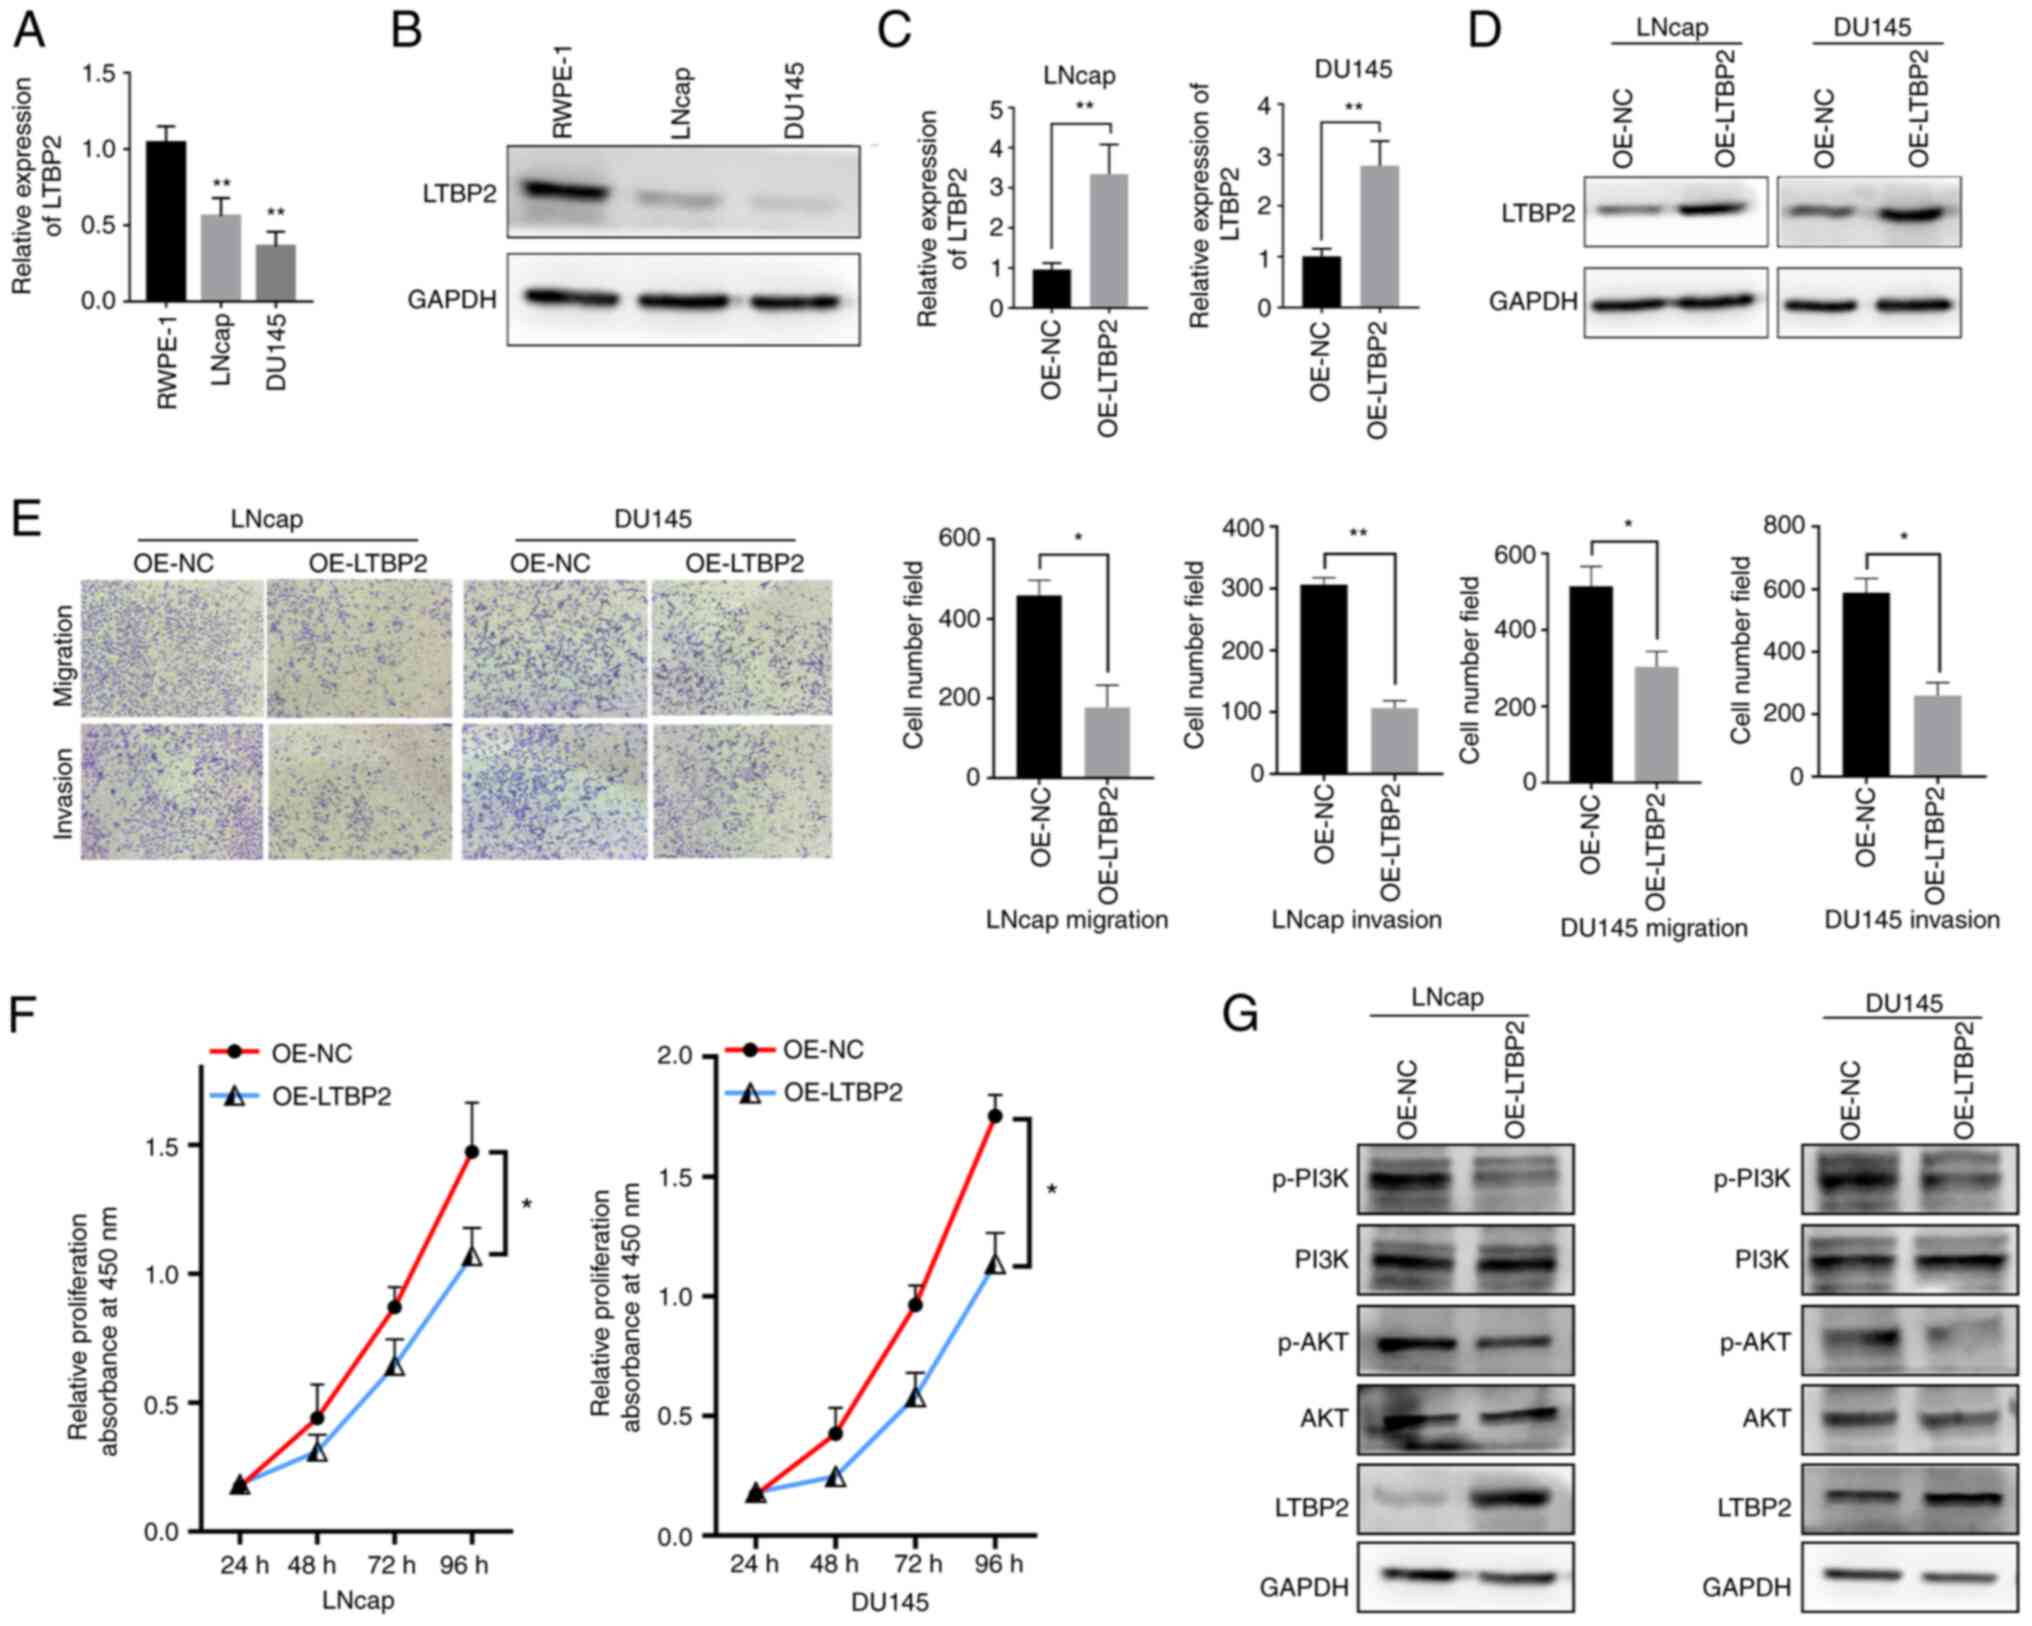
To better evaluate the expression and biological
function of LTBP2, cellular experiments in vitro were
carried out. RT-qPCR assays were performed to validate whether the
LTBP2 expression was downregulated in TCGA-PRAD database. As
revealed in Fig. 8A, LTBP2 was
under-expressed in tumor cell lines, and similar results could be
observed at the protein level via western blot analysis (Fig. 8B). To investigate the biological
function of LTBP2 in PCa cells, an overexpression plasmid
(OE-LTBP2) was constructed and transfected into LNcap and DU145
cells. RT-qPCR and western blot analysis revealed that OE- LTBP2
could upregulate the mRNA and protein expression levels of LTBP2
(Fig. 8C and D). Subsequently, Transwell assays
revealed that overexpression of LTBP2 reduced cell migration and
invasion abilities (Fig. 8E).
Moreover, CCK-8 assays also showed that overexpression of LTBP2
significantly inhibited the proliferation of LNcap and DU145 cells
(Fig. 8F)
Furthermore, the potential mechanisms by which LTBP2
inhibited PCa progression were further explored. Based on previous
literature (52-54)
and KEGG signaling pathway analysis as well as GSEA analysis, it
was hypothesized that the downstream signaling pathway of LTBP2 may
involve the PI3K/AKT pathway. Hence, the expression changes of
proteins related to the PI3K/AKT signaling pathway were examined.
As revealed in Fig. 8G, western
blot results demonstrated that transfection with OE-LTBP2 resulted
in a significant increase in LTBP2 expression levels, and a
decrease in the protein levels of phosphorylated (p)-AKT and p-PI3K
in LNcap and DU145 cells. Collectively, it was confirmed that LTBP2
may be involved in BCR of PCa progression and metastasis via the
PI3K/AKT signaling pathway.
Discussion
Identification and characterization of the specific
biomarkers for BCR of PCa may be important for the diagnosis and
prognosis of prostate tumors. In the present study, it was
demonstrated that LTBP2 could be a diagnostic biomarker for BCR of
PCa, which is correlated with immune response. To identify
diagnostic biomarkers associated with BCR of PCa, the screening
algorithms, Lasso and SVM-RFE were used to screen 44 BCR-related
DEGs and 19 differential genes associated with BCR were obtained
via overlapping. PPI analysis and MCODE algorithm were also used to
screen the 44 DEGs and 4 hub genes were identified. Finally, by
overlapping the hub genes and key BCR-related DEGs, LTBP2 was
revealed to be the only candidate diagnostic gene for BCR of PCa
and was found to be associated with CD4+ T-cell
recruitment and anti-PD-1/PD-L1 immunotherapy response.
Subsequently, using the ESTIMATE algorithm, it was determined that
LTBP2 was associated with the TME state and could predict the
clinical benefit of ICB. Finally, the expression and biological
function of LTBP2 were evaluated by cellular experiments. The
results showed that LTBP2 was downregulated in PCa cells and
inhibited PCa proliferation and metastasis via the PI3K/AKT
signaling pathway. Collectively, the present study demonstrated
that LTBP2 could be employed as a novel biomarker for diagnosing
BCR in PCa and a potential immunotherapeutic tool, which could
inhibit PCa proliferation and metastasis via the PI3K/AKT signaling
pathway.
Several studies (7,15)
have assessed the diagnostic biomarkers for BCR of PCa. However,
the specific molecular mechanisms and their correlation with
immunity and prognosis are still not well clarified. LTBP2, a
member of the fibronectin or LTBP extracellular matrix (ECM)
glycoprotein superfamily, which is characterized by repetitive
domain structures, has an important influence on tumorigenesis
development by regulating TGF-β activity, elastogenesis and
maintenance of ECM structure (54,55).
In the present study, LTBP2 was identified and validated as a novel
diagnostic biomarker for BCR of PCa by public databases. Moreover,
it was determined that LTBP2 was associated with immune response
and TME. In addition, through cellular experiments, it was revealed
that LTBP2 was under-expressed in PCa, which was consistent with
the results obtained from the public databases. However, through
pan-cancer analysis and several previous studies, it was observed
that LTBP2 was upregulated in a variety of diseases, such as
cervical adenocarcinoma (53),
oral squamous cell carcinoma (54), lung myofibroblast (56), gastric cancer (52), colorectal cancer (57), glaucoma (58), which indicates that LTBP2 has
diverse biological functions. For the first time, to the best of
our knowledge, the present study reported the role of LTBP2 in PCa
progression, especially in the diagnosis of BCR. In addition, the
results of the present study indicated that LTBP2 was significantly
positively correlated with CD4+ T-cell infiltration and
TME score as well as ICB, suggesting that high expression of LTBP2
along with increased ICB and CD4+ T-cell recruitment
could increase the clinical benefit of immunotherapy for PCa
patients. Naturally, more studies are required to further confirm
the aforementioned findings.
Undoubtedly, immunotherapy is a powerful treatment
strategy for solid tumors, yet PCa appears to be excluded from the
ongoing immunotherapy revolution. However, several studies have
confirmed the value of immunotherapy in advanced PCa. Bilusic et
al (59) reported that turning
a ‘cold’ PCa TME into a ‘hot’ one by driving T cells into the tumor
and combining it with ADT could be a new approach to PCa treatment.
Gamat et al (60) found
that treatment of CD4+ T cells with testosterone or DHT
increased the level of the immunosuppressive cytokine IL-10,
suggesting that androgens could have a direct negative effect on
T-cell function. It was hypothesized that combining ADT with
immunotherapy is a reasonable direction to improve the efficacy of
PCa. Several studies have also reported that ICB plays a key role
in the treatment of PCa. For example, Zhou et al and Zhang
et al (61,62) found that WDR5 could combine with
PD-L1 expression to influence the progression and chemosensitivity
of PCa. The present study determined that LTBP2 was associated with
CD4+ T cells and could predict clinical benefit from
immunotherapy, particularly from ICB. This may provide new insights
into the treatment for BCR of PCa.
Recently, LTBP2 was recently identified as an ECM
glycoprotein, and its expression was associated with poor prognosis
in several tumors. For example, Wang et al (52) found that LTBP2 promoted metastasis
of gastric cancer cells and was associated with a poor prognosis.
Turtoi et al (63)
identified significant high expression of LTBP2 in pancreatic
ductal adenocarcinoma tissue by 2D-nano-HPLC_MS/MS method and
western blotting. By contrast, Chen et al (64) reported that LTBP2 was downregulated
in nasopharyngeal carcinoma and it conferred a propensity to
inhibit proliferation and metastasis in a favorable (growth
factor-permitting) TME, which suggested that it had significant
heterogeneity. However, the specific molecular mechanism that
affected tumor progression has not been fully elucidated. In the
present study, insight into the exact mechanism by which LTBP2
regulates PCa progression was provided. Based on KEGG pathway
enrichment analysis and GSEA analysis and previous literature
(50), it was confirmed that LTBP2
inhibited PCa proliferation and metastasis in vitro via the
PI3K/AKT signaling pathway.
lncRNAs play an important regulatory role in the
malignant progression and BCR of PCa (8,9).
Therefore, the possible upstream molecular mechanisms were
investigated. In fact, lncRNA-miRNA-LTBP2 ceRNA regulatory networks
were constructed using the starBase database and Spearman
correlation analysis, which contained 15 lncRNAs and 8 miRNAs
(Fig. S8). Furthermore, it was
confirmed that these lncRNAs were downregulated while the miRNAs
were upregulated in PCa. Therefore, in the future LTBP2 will be
further explored and its biological function will be further
characterized from in vivo and in vitro experiments.
Regretfully, it was determined that LTBP2 expression did not affect
prognosis, including OS, DSS and PFI. In fact, clinical data
related to BCR is being presently collected, to explore the
association between LTBP2 expression and BCR of PCa. If LTBP2 is
determined to be associated with prognosis related to BCR, this
could be an important finding. Hence, the aforementioned results
demonstrated that LTBP2 holds promise as a diagnostic biomarker for
BCR of PCa and offered new perspectives for immunotherapy. In
addition, a contradiction was found with regard to LTBP2 being
lowly expressed in tumors, but its expression increased with TNM
stage. This may require further validation in large clinical
samples.
In conclusion, 44 BCR-related DEGs were screened
using the GEO-merged datasets, and LTBP2 was then identified as a
diagnostic biomarker for BCR of PCa based on Lasso, SVM-RFE
algorithms, PPI analysis and MCODE algorithm. The stability and
reliability of candidate genes were validated with the GEO
validation dataset and TCGA-PRAD datasets. It was then determined
that LTBP2 exerted a crucial role in CD4+ T-cell
recruitment and TME state. Notably, LTBP2 expression enhanced the
clinical benefit of immunotherapy for PCa patients with BCR. In
addition, the upstream lncRNA-miRNA-LTBP2 ceRNA regulatory network
was constructed by bioinformatics and the downstream signaling
pathway and biological functions were validated by in vitro
experiments based on KEGG enrichment analysis. It was determined
that LTBP2 inhibited PCa progression and metastasis via the
PI3K/AKT signaling pathway. In short, the present study provided
novel insights into the role of LTBP2 in diagnosing BCR of PCa and
facilitating personalized immunotherapy in patients with PCa.
Supplementary Material
Heatmap of BCR-related genes in
primary PCa and BCR PCa tissues. The heatmap was applied to
visualize the differential expression of 44 BCR-related genes
between 312 primary PCa tissues and 97 BCR PCa tissues in the
GEO-merged cohort (GSE46602, GSE70768 and GSE116918). BCR,
biochemical recurrence; PCa, prostate cancer; GEO, Gene expression
Omnibus; Pri-, primary.
Expression of LTBP2 in pan-cancer.
Differential expression of LTBP2 between 33 solid human cancers and
normal control tissues in TCGA database. *P<0.05,
**P<0.01, ***P<0.001. LTBP2, latent
transforming growth factor β-binding protein 2; TCGA, The Cancer
Genome Atlas; GTex, Genotype-Tissue Expression; PRAD, prostate
adenocarcinoma.
Prognostic value of LTBP2 in
pan-cancer. (A-C) Univariate Cox regression analysis was performed
to assess the (A) OS, (B) DSS, and (C) PFI of LTBP2 in different
cancer types in TCGA database. LTBP2, latent transforming growth
factor β-binding protein 2; OS, overall survival; DSS,
disease-specific survival; PFI, progression-free interval; TCGA,
The Cancer Genome Atlas.
Prognostic value of LTBP2 in
pan-cancer. (A-C) The Kaplan-Meier survival plot revealed the
difference in the (A) OS, (B) DSS, (C) PFI between high and low
expression of LTBP2 in TCGA-PRAD dataset. LTBP2, latent
transforming growth factor β-binding protein 2; OS, overall
survival; DSS, disease-specific survival; PFI, progression-free
interval; TCGA, The Cancer Genome Atlas; PRAD, prostate
adenocarcinoma.
Spearman correlation analysis
indicated the correlation between LTBP2 expression and
tumor-infiltrating immune cellsin TCGA database for 33 pan-cancers.
P<0.05 suggested a correlation between LTBP2 and
tumor-infiltrating immune cells. *P<0.05,
**P<0.01, ***P<0.001. TCGA, The Cancer
Genome Atlas; PRAD, prostate adenocarcinoma.
Landscape and correlation of
tumor-infiltrating immune cells in PCa in the GEO-merged dataset.
(A) The proportions of immune infiltrating cells in primary PCa
subgroup and biochemical recurrence PCa subgroup. (B) Spearman
analysis indi-cated the correlation between different
tumor-infiltrating immune cells. Red represents a positive
correlation and blue represents a negative correlation. PCa,
prostate cancer; GEO, Gene expression Omnibus; Pri-, primary; BCR,
biochemical recurrence.
Correlation between LTBP2 expression
with immune-cell marker genes. The correlation scatter plot
confirmed that LTBP2 expression was significantly positively
correlated with immune-cell marker genes, except for CEACAM8.
LTBP2, latent transforming growth factor β-binding protein 2.
Construction of lncRNA-miRNA-LTBP2
ceRNA regulatory network. LTBP2-associated ceRNA regulatory network
was mapped based on co-expression analysis and starBase database,
where green ovals represent lncRNAs and purple triangles represent
miRNAs (cor >0.3; P-value <0.01). LTBP2, latent transforming
growth factor β-binding protein 2; ceRNA, competitive endogenous
RNA.
Characteristics of the included
datasets.
List of antibodies.
Correlation between LTBP2 expression
with immune-cell marker genes.
Acknowledgements
Not applicable.
Funding
Funding: The present study was supported by the National Natural
Science Foundation of China (grant nos. 81872089,
81370849,81672551, and 81202034), and the Natural Science
Foundation of Jiangsu Province (grant nos. BE2019751, BK20161434,
and BK2012336), and the opening foundation (JSHD2021029).
Availability of data and materials
The datasets generated and/or analyzed during the
current study are available in the TCGA and GEO repositories,
https://portal.gdc.cancer.gov/repository and
https://www.ncbi.nlm.nih.gov/geo/query/acc.cgi?acc=GSE46602;
https://www.ncbi.nlm.nih.gov/geo/query/acc.cgi?acc=GSE70768;
https://www.ncbi.nlm.nih.gov/geo/query/acc.cgi?acc=GSE116918.
Authors' contributions
XZ and CT confirm the authenticity of all the raw
data. All authors (XZ, CT, JC, WM, ML and MC) made a significant
contribution to the work reported, whether that is in the
conception, study design, execution, acquisition of data, analysis
and interpretation, or in all these areas; took part in drafting,
revising or critically reviewing the article; gave final approval
of the version to be published; have agreed on the journal to which
the article has been submitted, and agree to be accountable for all
aspects of the work.
Ethics approval and consent to
participate
Not applicable.
Patient consent for publication
Not applicable.
Competing interests
The authors declare that they have no competing
interests.
References
|
1
|
Siegel RL, Miller KD, Fuchs HE and Jemal
A: Cancer statistics, 2021. CA Cancer J Clin. 71:7–33.
2021.PubMed/NCBI View Article : Google Scholar
|
|
2
|
Nevedomskaya E, Baumgart SJ and Haendler
B: Recent advances in prostate cancer treatment and drug discovery.
Int J Mol Sci. 19(1359)2018.PubMed/NCBI View Article : Google Scholar
|
|
3
|
Sundi D, Tosoian JJ, Nyame YA, Alam R,
Achim M, Reichard CA, Li J, Wilkins L, Schwen Z, Han M, et al:
Outcomes of very high-risk prostate cancer after radical
prostatectomy: Validation study from 3 centers. Cancer.
125:391–397. 2019.PubMed/NCBI View Article : Google Scholar
|
|
4
|
Cornford P, van den Bergh RCN, Briers E,
Van den Broeck T, Cumberbatch MG, Santis MD, Fanti S, Fossati N,
Gandaglia G, Gillessen S, et al: EAU-EANM-ESTRO-ESUR-SIOG
guidelines on prostate cancer. Part II-2020 update: Treatment of
relapsing and metastatic prostate cancer. Eur Urol. 79:263–282.
2021.PubMed/NCBI View Article : Google Scholar
|
|
5
|
Van den Broeck T, van den Bergh RCN,
Briers E, Cornford P, Cumberbatch M, Tilki D, De Santis M, Fanti S,
Fossati N, Gillessen S, et al: Biochemical recurrence in prostate
cancer: The european association of urology prostate cancer
guidelines panel recommendations. Eur Urol Focus. 6:231–234.
2020.PubMed/NCBI View Article : Google Scholar
|
|
6
|
Barry MJ and Simmons LH: Prevention of
prostate cancer morbidity and mortality: Primary prevention and
early detection. Med Clin North Am. 101:787–806. 2017.PubMed/NCBI View Article : Google Scholar
|
|
7
|
Kim SH, Park WS, Park BR, Joo J, Joung JY,
Seo HK, Chung J and Lee KH: Psca, cox-2, and ki-67 are independent,
predictive markers of biochemical recurrence in clinically
localized prostate cancer: A retrospective study. Asian J Androl.
19:458–462. 2017.PubMed/NCBI View Article : Google Scholar
|
|
8
|
Gu P, Chen X, Xie R, Han J, Xie W, Wang B,
Dong W, Chen C, Yang M, Jiang J, et al: LncRNA HOXD-AS1 regulates
proliferation and chemo-resistance of castration-resistant prostate
cancer via recruiting wdr5. Mol Ther. 25:1959–1973. 2017.PubMed/NCBI View Article : Google Scholar
|
|
9
|
Gu P, Chen X, Xie R, Xie W, Huang L, Dong
W, Han J, Liu X, Shen J, Huang J and Lin T: A novel AR
translational regulator lncrna lbcs inhibits castration resistance
of prostate cancer. Mol Cancer. 18(109)2019.PubMed/NCBI View Article : Google Scholar
|
|
10
|
Lei X, Lei Y, Li JK, Du WX, Li RG, Yang J,
Li J, Li F and Tan HB: Immune cells within the tumor
microenvironment: Biological functions and roles in cancer
immunotherapy. Cancer Lett. 470:126–133. 2020.PubMed/NCBI View Article : Google Scholar
|
|
11
|
Pitt JM, Marabelle A, Eggermont A, Soria
JC, Kroemer G and Zitvogel L: Targeting the tumor microenvironment:
Removing obstruction to anticancer immune responses and
immunotherapy. Ann Oncol. 27:1482–1492. 2016.PubMed/NCBI View Article : Google Scholar
|
|
12
|
Riley RS, June CH, Langer R and Mitchell
MJ: Delivery technologies for cancer immunotherapy. Nat Rev Drug
Discov. 18:175–196. 2019.PubMed/NCBI View Article : Google Scholar
|
|
13
|
Tomita Y, Ikeda T, Sakata S, Saruwatari K,
Sato R, Iyama S, Jodai T, Akaike K, Ishizuka S, Saeki S and
Sakagami T: Association of probiotic clostridium butyricum therapy
with survival and response to immune checkpoint blockade in
patients with lung cancer. Cancer Immunol Res. 8:1236–1242.
2020.PubMed/NCBI View Article : Google Scholar
|
|
14
|
Bagchi S, Yuan R and Engleman EG: Immune
checkpoint inhibitors for the treatment of cancer: Clinical impact
and mechanisms of response and resistance. Annu Rev Pathol.
16:223–249. 2021.PubMed/NCBI View Article : Google Scholar
|
|
15
|
Rui X, Shao S, Wang L and Leng J:
Identification of recurrence marker associated with immune
infiltration in prostate cancer with radical resection and build
prognostic nomogram. BMC Cancer. 19(1179)2019.PubMed/NCBI View Article : Google Scholar
|
|
16
|
Hou Q, Bing ZT, Hu C, Li MY, Yang KH, Mo
Z, Xie XW, Liao JL, Lu Y, Horie S and Lou MW: Rankprod combined
with genetic algorithm optimized artificial neural network
establishes a diagnostic and prognostic prediction model that
revealed c1QTNF3 as a biomarker for prostate cancer. EBioMedicine.
32:234–244. 2018.PubMed/NCBI View Article : Google Scholar
|
|
17
|
Mortensen MM, Høyer S, Lynnerup AS,
Ørntoft TF, Sørensen KD, Borre M and Dyrskjøt L: Expression
profiling of prostate cancer tissue delineates genes associated
with recurrence after prostatectomy. Sci Rep.
5(16018)2015.PubMed/NCBI View Article : Google Scholar
|
|
18
|
Ross-Adams H, Lamb AD, Dunning MJ, Halim
S, Lindberg J, Massie CM, Egevad LA, Russell R, Ramos-Montoya A,
Vowler SL, et al: Integration of copy number and transcriptomics
provides risk stratification in prostate cancer: A discovery and
validation cohort study. EBioMedicine. 2:1133–1144. 2015.PubMed/NCBI View Article : Google Scholar
|
|
19
|
Jain S, Lyons CA, Walker SM, McQuaid S,
Hynes SO, Mitchell DM, Pang B, Logan GE, McCavigan AM, Rourke DO,
et al: Validation of a metastatic assay using biopsies to improve
risk stratification in patients with prostate cancer treated with
radical radiation therapy. Ann Oncol. 29:215–222. 2018.PubMed/NCBI View Article : Google Scholar
|
|
20
|
Leek JT, Johnson WE, Parker HS, Jaffe AE
and Storey JD: The sva package for removing batch effects and other
unwanted variation in high-throughput experiments. Bioinformatics.
28:882–883. 2012.PubMed/NCBI View Article : Google Scholar
|
|
21
|
Ritchie ME, Phipson B, Wu D, Hu Y, Law CW,
Shi W and Smyth GK: Limma powers differential expression analyses
for rna-sequencing and microarray studies. Nucleic Acids Res.
43(e47)2015.PubMed/NCBI View Article : Google Scholar
|
|
22
|
Engebretsen S and Bohlin J: Statistical
predictions with glmnet. Clin Epigenetics. 11(123)2019.PubMed/NCBI View Article : Google Scholar
|
|
23
|
Klosa J, Simon N, Westermark PO, Liebscher
V and Wittenburg D: Seagull: Lasso, group lasso and sparse-group
lasso regularization for linear regression models via proximal
gradient descent. BMC Bioinformatics. 21(407)2020.PubMed/NCBI View Article : Google Scholar
|
|
24
|
Sun S, Shen Y, Wang J, Li J, Cao J and
Zhang J: Identification and validation of autophagy-related genes
in chronic obstructive pulmonary disease. Int J Chron Obstruct
Pulmon Dis. 16:67–78. 2021.PubMed/NCBI View Article : Google Scholar
|
|
25
|
Sanz H, Valim C, Vegas E, Oller JM and
Reverter F: SVM-RFE: Selection and visualization of the most
relevant features through non-linear kernels. BMC Bioinformatics.
19(432)2018.PubMed/NCBI View Article : Google Scholar
|
|
26
|
Zhou X and Tuck DP: MSVM-RFE: Extensions
of SVM-RFE for multiclass gene selection on DNA microarray data.
Bioinformatics. 23:1106–1114. 2007.PubMed/NCBI View Article : Google Scholar
|
|
27
|
Li F, Zhao C, Xia Z, Wang Y, Zhou X and Li
GZ: Computer-assisted lip diagnosis on traditional chinese medicine
using multi-class support vector machines. BMC Complement Altern
Med. 12(127)2012.PubMed/NCBI View Article : Google Scholar
|
|
28
|
Yu G, Wang LG, Han Y and He QY:
ClusterProfiler: An R package for comparing biological themes among
gene clusters. OMICS. 16:284–287. 2012.PubMed/NCBI View Article : Google Scholar
|
|
29
|
Xu Q, Xu H, Deng R, Wang Z, Li N, Qi Z,
Zhao J and Huang W: Multi-omics analysis reveals prognostic value
of tumor mutation burden in hepatocellular carcinoma. Cancer Cell
Int. 21(342)2021.PubMed/NCBI View Article : Google Scholar
|
|
30
|
Wu X, Sui Z, Zhang H, Wang Y and Yu Z:
Integrated analysis of lncRNA-mediated ceRNA network in lung
adenocarcinoma. Front Oncol. 10(554759)2020.PubMed/NCBI View Article : Google Scholar
|
|
31
|
Kanehisa M, Furumichi M, Tanabe M, Sato Y
and Morishima K: KEGG: New perspectives on genomes, pathways,
diseases and drugs. Nucleic Acids Res. 45:D353–D361.
2017.PubMed/NCBI View Article : Google Scholar
|
|
32
|
Liu P, Jiang W, Zhao J and Zhang H:
Integrated analysis of genome-wide gene expression and DNA
methylation microarray of diffuse large B-cell lymphoma with TET
mutations. Mol Med Rep. 16:3777–3782. 2017.PubMed/NCBI View Article : Google Scholar
|
|
33
|
Gambardella A, Licata G and Sohrt A: Dose
adjustment of biologic treatments for moderate-to-severe plaque
psoriasis in the real world: A systematic review. Dermatol Ther
(Heidelb). 11:1141–1156. 2021.PubMed/NCBI View Article : Google Scholar
|
|
34
|
Subramanian A, Tamayo P, Mootha VK,
Mukherjee S, Ebert BL, Gillette MA, Paulovich A, Pomeroy SL, Golub
TR, Lander ES and Mesirov JP: Gene set enrichment analysis: A
knowledge-based approach for interpreting genome-wide expression
profiles. Proc Natl Acad Sci USA. 102:15545–15550. 2005.PubMed/NCBI View Article : Google Scholar
|
|
35
|
Yoshihara K, Shahmoradgoli M, Martínez E,
Vegesna R, Kim H, Torres-Garcia W, Treviño V, Shen H, Laird PW,
Levine DA, et al: Inferring tumour purity and stromal and immune
cell admixture from expression data. Nat Commun.
4(2612)2013.PubMed/NCBI View Article : Google Scholar
|
|
36
|
Zhang S, Zhang E, Long J, Hu Z, Peng J,
Liu L, Tang F, Li L, Ouyang Y and Zeng Z: Immune infiltration in
renal cell carcinoma. Cancer Sci. 110:1564–1572. 2019.PubMed/NCBI View Article : Google Scholar
|
|
37
|
Pan JH, Zhou H, Cooper L, Huang JL, Zhu
SB, Zhao XX, Ding H, Pan YL and Rong L: LAYN is a prognostic
biomarker and correlated with immune infiltrates in gastric and
colon cancers. Front Immunol. 10(6)2019.PubMed/NCBI View Article : Google Scholar
|
|
38
|
Franceschini A, Szklarczyk D, Frankild S,
Kuhn M, Simonovic M, Roth A, Lin J, Minguez P, Bork P, von Mering C
and Jensen LJ: STRING v9.1: Protein-protein interaction networks,
with increased coverage and integration. Nucleic Acids Res.
41:D808–D815. 2013.PubMed/NCBI View Article : Google Scholar
|
|
39
|
Szklarczyk D, Morris JH, Cook H, Kuhn M,
Wyder S, Simonovic M, Santos A, Doncheva NT, Roth A, Bork P, et al:
The string database in 2017: Quality-controlled protein-protein
association networks, made broadly accessible. Nucleic Acids Res.
45:D362–D368. 2017.PubMed/NCBI View Article : Google Scholar
|
|
40
|
Bader GD and Hogue CW: An automated method
for finding molecular complexes in large protein interaction
networks. BMC Bioinformatics. 4(2)2003.PubMed/NCBI View Article : Google Scholar
|
|
41
|
Tay Y, Rinn J and Pandolfi PP: The
multilayered complexity of cerna crosstalk and competition. Nature.
505:344–352. 2014.PubMed/NCBI View Article : Google Scholar
|
|
42
|
Li JH, Liu S, Zhou H, Qu LH and Yang JH:
Starbase v2.0: decoding miRNA-ceRNA, miRNA-ncRNA and protein-RNA
interaction networks from large-scale clip-seq data. Nucleic Acids
Res. 42:D92–D97. 2014.PubMed/NCBI View Article : Google Scholar
|
|
43
|
Shannon P, Markiel A, Ozier O, Baliga NC,
Wang JT, Ramage D, Amin N, Schwikowski B and Ideker T: Cytoscape: A
software environment for integrated models of biomolecular
interaction networks. Genome Res. 13:2498–2504. 2003.PubMed/NCBI View Article : Google Scholar
|
|
44
|
Hugo W, Zaretsky JM, Sun L, Song C, Moreno
BH, Hu-Lieskovan S, Berent-Maoz B, Pang J, Chmielowski B, Cherry G,
et al: Genomic and transcriptomic features of response to anti-PD-1
therapy in metastatic melanoma. Cell. 165:35–44. 2016.PubMed/NCBI View Article : Google Scholar
|
|
45
|
Mancinelli S, Turcato A, Kisslinger A,
Bongiovanni A, Zazzu V, Lanati A and Liguori GL: Design of
transfections: Implementation of design of experiments for cell
transfection fine tuning. Biotechnol Bioeng. 118:4488–4502.
2021.PubMed/NCBI View Article : Google Scholar
|
|
46
|
Taylor SC, Nadeau K, Abbasi M, Lachance C,
Nguyen M and Fenrich J: The ultimate qPCR experiment: Producing
publication quality, reproducible data the first time. Trends
Biotechnol. 37:761–774. 2019.PubMed/NCBI View Article : Google Scholar
|
|
47
|
Yu J, Mao W, Sun S, Hu Q, Wang C, Xu Z,
Liu R, Chen S, Xu B and Chen M: Identification of an m6A-related
lncRNA signature for predicting the prognosis in patients with
kidney renal clear cell carcinoma. Front Oncol.
11(663263)2021.PubMed/NCBI View Article : Google Scholar
|
|
48
|
Chen S, Wang L, Xu C, Chen H, Peng B, Xu
Y, Yao X, Li L and Zheng J: Knockdown of regγ inhibits
proliferation by inducing apoptosis and cell cycle arrest in
prostate cancer. Am J Transl Res. 9:3787–3795. 2017.PubMed/NCBI
|
|
49
|
Livak KJ and Schmittgen TD: Analysis of
relative gene expression data using real-time quantitative pcr and
the 2(-Delta Delta C(T)) method. Methods. 25:402–408.
2001.PubMed/NCBI View Article : Google Scholar
|
|
50
|
Mao W, Wang K, Xu B, Zhang H, Sun S, Hu Q,
Zhang L, Liu C, Chen S, Wu J, et al: CiRS-7 is a prognostic
biomarker and potential gene therapy target for renal cell
carcinoma. Mol Cancer. 20(142)2021.PubMed/NCBI View Article : Google Scholar
|
|
51
|
Pulendran B and Davis MM: The science and
medicine of human immunology. Science. 369(eaay4014)2020.PubMed/NCBI View Article : Google Scholar
|
|
52
|
Wang J, Liang WJ, Min GT, Wang HP, Chen W
and Yao N: LTBP2 promotes the migration and invasion of gastric
cancer cells and predicts poor outcome of patients with gastric
cancer. Int J Oncol. 52:1886–1898. 2018.PubMed/NCBI View Article : Google Scholar
|
|
53
|
Ren Y, Lu H, Zhao D, Ou Y, Yu K, Gu J,
Wang L, Jiang S, Chen M, Wang J, et al: LTPB2 acts as a prognostic
factor and promotes progression of cervical adenocarcinoma. Am J
Transl Res. 7:1095–1105. 2015.PubMed/NCBI
|
|
54
|
Wang J, Jiang C, Li N, Wang F, Xu Y, Shen
Z, Yang L, Li Z and He C: The circEPSTI1/mir-942-5p/LTBP2 axis
regulates the progression of oscc in the background of osf via emt
and the PI3K/Akt/mTOR pathway. Cell Death Dis.
11(682)2020.PubMed/NCBI View Article : Google Scholar
|
|
55
|
Pang XF, Lin X, Du JJ and Zeng DY: LTBP2
knockdown by siRNA reverses myocardial oxidative stress injury,
fibrosis and remodelling during dilated cardiomyopathy. Acta
Physiol (Oxf). 228(e13377)2020.PubMed/NCBI View Article : Google Scholar
|
|
56
|
Enomoto Y, Matsushima S, Shibata K,
Aoshima Y, Yagi H, Meguro S, Kawasaki H, Kosugi I, Fujisawa T,
Enomoto N, et al: LTBP2 is secreted from lung myofibroblasts and is
a potential biomarker for idiopathic pulmonary fibrosis. Clin Sci
(Lond). 132:1565–1580. 2018.PubMed/NCBI View Article : Google Scholar
|
|
57
|
Huang Y, Wang G, Zhao C, Geng R, Zhang S,
Wang W, Chen J, Liu H and Wang X: High expression of LTBP2
contributes to poor prognosis in colorectal cancer patients and
correlates with the mesenchymal colorectal cancer subtype. Dis
Markers. 2019(5231269)2019.PubMed/NCBI View Article : Google Scholar
|
|
58
|
Rauf B, Irum B, Khan SY, Kabir F, Naeem
MA, Riazuddin S, Ayyagari R and Riazuddin SA: Novel mutations in
LTBP2 identified in familial cases of primary congenital glaucoma.
Mol Vis. 26:14–25. 2020.PubMed/NCBI
|
|
59
|
Bilusic M, Madan RA and Gulley JL:
Immunotherapy of prostate cancer: Facts and hopes. Clin Cancer Res.
23:6764–6770. 2017.PubMed/NCBI View Article : Google Scholar
|
|
60
|
Gamat M and McNeel DG: Androgen
deprivation and immunotherapy for the treatment of prostate cancer.
Endocr Relat Cancer. 24:T297–T310. 2017.PubMed/NCBI View Article : Google Scholar
|
|
61
|
Zhou Q, Chen X, He H, Peng S, Zhang Y,
Zhang J, Cheng L, Liu S, Huang R, Xie R, et al: Wd repeat domain 5
promotes chemoresistance and programmed death-ligand 1 expression
in prostate cancer. Theranostics. 11:4809–4824. 2021.PubMed/NCBI View Article : Google Scholar
|
|
62
|
Zhang J, Zhou Q, Xie K, Cheng L, Peng S,
Xie R, Liu L, Zhang Y, Dong W, Han J, et al: Targeting WD repeat
domain 5 enhances chemosensitivity and inhibits proliferation and
programmed death-ligand 1 expression in bladder cancer. J Exp Clin
Cancer Res. 40(203)2021.PubMed/NCBI View Article : Google Scholar
|
|
63
|
Turtoi A, Musmeci D, Wang Y, Dumont B,
Somja J, Bevilacqua G, De Pauw E, Delvenne P and Castronovo V:
Identification of novel accessible proteins bearing diagnostic and
therapeutic potential in human pancreatic ductal adenocarcinoma. J
Proteome Res. 10:4302–4313. 2011.PubMed/NCBI View Article : Google Scholar
|
|
64
|
Chen H, Ko JMY, Wong VCL, Hyytiainen M,
Keski-Oja J, Chua D, Nicholls JM, Cheung FMF, Lee AWM, Kwong DLW,
et al: LTBP-2 confers pleiotropic suppression and promotes dormancy
in a growth factor permissive microenvironment in nasopharyngeal
carcinoma. Cancer Lett. 325:89–98. 2012.PubMed/NCBI View Article : Google Scholar
|