Introduction
Myocardial infarction (MI) is a severe disease that
occurs globally; from 2002 to 2015, the incidence of MI was
~242/100,000 individuals per year (1). According to the universal definition
of MI (2), it may be divided into
five types and is primarily induced by acute myocardial ischemia
resulting from several factors. For example, the rupture of acute
atherosclerotic plaques leads to ischemic myocardial damage due to
the mismatch between oxygen supply and demand (3). Based on the existing clinical
guidelines (4,5), clearing blocked vessels and reducing
thrombotic obstruction with drugs as quickly as possible are the
two most important treatment options. However, for vessels that are
difficult to clear and when MI is caused by microvascular lesions,
only conservative drug treatment should be used and recurrent
attacks are more probable (6).
Consequently, it is important to identify novel therapeutic targets
to reduce MI.
Ferroptosis is a process in which unsaturated fatty
acids are highly expressed on the cell membrane and are subject to
lipid peroxidation by Fe2+ ions and lipoxygenase,
thereby inducing cell death. It is also hallmarked by a decrease in
the expression of the glutathione-dependent antioxidant system and
glutathione peroxidase 4 (GPX4) enzymes (7). Ferroptosis is involved in tumor cell
death, neurodegenerative diseases, renal failure and cardiac
ischemic injury (8-10).
MI is a severe type of ischemic heart disease in which ferroptosis
plays a central role (11). At
present, studies on the mechanism of ferroptosis in MI have
primarily focused on endoplasmic reticulum stress, reactive oxygen
species (ROS) generation, GPX4 and the autophagy-dependent
ferroptosis pathway (11-15).
Several studies have concluded that the inhibition of cardiomyocyte
ferroptosis is a potentially important target for MI treatment. For
example, treatment of an MI mouse model using ferrostatin-1 (an
inhibitor of ferroptosis) or dexrazoxane (an iron-chelating agent)
can reduce MI scar areas and myocardial enzyme activity (16). In addition, baicalin has been shown
to prevent MI by inhibiting long-chain-fatty-acid-CoA ligase
4-mediated ferroptosis (17).
Moreover, other drugs, such as piperonylamine and artesunate, have
also inhibited ferroptosis and represent potential drugs for the
treatment of related diseases (18,19).
Since ferroptosis plays a key role in MI, in the
present study genes associated with MI and ferroptosis were
identified. These genes may be useful for identifying putative
therapeutic targets or providing a theoretical basis for
understanding the molecular pathology of MI. Furthermore, microRNAs
(miRNAs/miRs), transcription factors (TFs) and targeted drugs were
analyzed in context to the above genes, and differential expression
of these genes was verified using a separate dataset and clinical
specimens. The present study provides a basis for further research
exploring the potential therapeutic targets and regulatory
mechanisms of MI, and also provides a new treatment strategy.
Materials and methods
Data sources
The transcriptome data of the current study were
obtained from two datasets, GSE59867(20) and GSE141512(21) datasets of Gene Expression Omnibus
(GEO) database (http://www.ncbi.nlm.nih.gov/geo/) (22). The population of the GSE59867
dataset consisted of 46 controls and 390 MI samples, and was used
as a training set. The GSE141512 dataset consisted of 6 controls
and 6 MI samples, and was used as an external validation set. The
ferroptosis-related genes were extracted from the FerrDb database
(http://www.zhounan.org/ferrdb). After
removing the duplicated genes of the three subgroups of ferroptosis
gene sets, a total of 259 genes were obtained (23).
Acquisition of differentially
expressed genes (DEGs)
All the microarray data after normalization were
analyzed by R 4.1.0 software (24). The R package, ‘limma’, was used to
identify differentially expressed mRNAs between MI and control
samples, with adjusted P-value <0.05 as the threshold (25). A heatmap cluster and volcano plot
of the DEGs were created using the ‘ggplot2’ packages via R
software. Furthermore, by intersecting with ferroptosis-related
genes, the ferroptosis-related DEGs were obtained and the heat map
of ferroptosis-related DEGs was created using the ‘pheatmap’
package (26).
Gene set enrichment analysis
(GSEA)
The potential biological function of the DEGs was
enriched using the GSEA method and annotated using Gene Ontology
(GO) (http://geneontology.org/) and Kyoto
Encyclopedia of Genes and Genomes (KEGG) databases (https://www.kegg.jp/). In GSEA, a false discovery rate
(FDR) of <0.05 was considered to indicate DEGs that were
significantly enriched.
Weighted gene co-expression network
analysis (WGCNA)
The GEO expression file was used for WGCNA using the
WGCNA R package (27). Firstly,
samples were clustered to assess the presence of any outliers.
Then, the automatic network construction function was used to
obtain the co-expression network. The ‘pick Soft Threshold’
function was used (set to 15) to calculate the soft thresholding
power β. Furthermore, the matrix data were then transformed into an
adjacency matrix, hierarchical clustering and the ‘dynamic Tree
Cut’ function were used to detect modules. After completing the
calculation of module eigengene (ME) and merging similar modules in
the clustering tree according to ME, a hierarchical clustering
dendrogram was drawn. Modules were combined with phenotypic data to
calculate gene significance (GS) and module significance (MS) to
measure the significance of genes and clinical information and
analyze the correlation between modules and clinical features. Then
which modules are most relevant to MI was revealed.
Functional annotation and pathway
enrichment analysis
To reveal the functions of DEGs, GO annotation
(28) and KEGG enrichment
(29) analysis were conducted
using the ‘cluster profile’ package. GO enrichment results of
‘biological process’ (BP), ‘cellular component’ (CC) and ‘molecular
function’ (MF) were obtained. KEGG pathway analysis was used to
describe gene function at the genomic and molecular levels and
reveal the associated genes. P<0.05 was considered to indicate a
statistically significant difference.
Protein-protein interaction (PPI)
network construction
The PPI network was constructed using the STRING
database (30). The confidence
score was set at 0.4 for the PPI analysis and was considered
statistically significant. Cytoscape 3.8.2 was used to visualize
the PPI network (31). Cytoscape
plugin, MCODE, was used to screen the significant modules in the
PPI network.
Validation of hub genes
Receiver operating characteristic (ROC) curve
analysis was performed using the pROC package (32) to evaluate the diagnostic value of
the hub genes for MI. ROC curve analysis, which yields indictors of
accuracy, such as the area under the curve (AUC), provides the
basic principle and rationale for distinguishing between the
specificity and sensitivity of diagnostic performance.
Analysis of interaction effect and
functional similarity for hub genes
The ‘ggpubr’ package was used to perform Spearman's
correlation analysis on hub genes. The ‘ggpubr’ was a flexible
package for data visualization based on ‘ggplot2’ package in R
(33). Moreover, the functional
similarity among proteins was evaluated using the geometric mean of
semantic similarities in CCs and MFs through the GOSemSim package
(34). Functional similarity
measures the strength of the relationship between each protein and
its partners by considering the function and location of
proteins.
Construction of gene-drug interaction
network and regulatory network of hub genes
In order to explore the potential therapeutic drugs
for MI, DEGs were uploaded to the CMAP database (https://www.complement.us/cmap) (34), and relevant drugs associated with
MI treatment were identified. Then, drugs targeting proteins
encoded by hub genes were identified using the through the
Comparative Toxicogenomics Database (CTD) (35). MiRNet database (36) was used to predict the TFs and
miRNAs of hub genes. Hub genes and their TFs and miRNAs were
integrated into a regulatory network, and visualized using
Cytoscape software.
Sample collection
The present study was approved by the Ethics
Committee of Dezhou Municipal Hospital (Dezhou, China; approval no.
2022-L-06; January 17, 2022) and complied with The Declaration of
Helsinki. Written informed consent was obtained from all subjects.
A total of 5 patients with MI and 5 patients with stable angina
pectoris/chronic coronary syndromes (CCS) were enrolled at Dezhou
Municipal Hospital (Dezhou, China) between February 2022 and March
2022, and blood draws were completed at the hospital. The diagnoses
of the patients followed the latest diagnostic guidelines. The
diagnosis of MI was in accordance with the Fourth Universal
Definition of Myocardial Infarction (2018) (3). MI is diagnosed when there is clinical
evidence of acute myocardial ischemia and the rise or fall of
cardiac troponin T values with at least one value exceeding the
99th percentile upper reference limit, followed by at least one of
the following: i) Symptoms of myocardial ischemia; ii) changes on
an electrocardiogram indicating new ischemia; iii) development of
pathological Q waves on an electrocardiogram; iv) new loss of
viable myocardium or new regional wall motion abnormality evidenced
by imaging; and v) coronary thrombus evidenced by angiography or
autopsy. CCS is diagnosed when the following three characteristics
are met simultaneously: i) Retrosternal discomfort (its nature and
duration have typical characteristics) (37); ii) fatigue or emotional stress can
be induced; and iii) rest or nitrates can provide relief. The above
criteria were met, and serum cardiac troponin I (cTnI) and
myocardial enzymes were negative (38,39).
Subjects diagnosed with CCS were considered to be the control
group. Peripheral blood collection was completed within 12 h after
admission.
Inclusion criteria: i) Patients met the diagnostic
criteria for MI or CCS; ii) patients were aged between 40-80 years
old (sex was not limited); and iii) patient hemodynamics were
stable, and there was no evident abnormality in liver and kidney
function.
Exclusion criteria: i) Patients with acute
decompensation of chronic heart failure, symptomatic hypotension
(systolic blood pressure <90 mmHg) or an expected survival
period of <3 months; ii) patients with abnormal liver and kidney
function and serious primary disease (for example, acute
exacerbation of chronic obstructive pulmonary disease, diabetic
ketoacidosis, multiple tumor metastasis); iii) pregnant and
lactating women; iv) patients who have previously been found to be
allergic to the experimental drug; or v) the presence of factors
that can increase death, such as severe arrhythmia, pulmonary
embolism, cardiogenic shock or obvious infection.
RNA extraction and reverse
transcription-quantitative PCR (RT-qPCR)
Total RNA from peripheral blood was extracted using
the SPEAKeasy Serum/Plasma RNA kit (Shandong Sparkjade
Biotechnology Co., Ltd.) according to the manufacturer's protocol
under low temperature. The Nano400 Spectrophotometer (Hangzhou
Allsheng Instruments Co., Ltd.) was utilized to check the
concentration and purity of the extracted RNA, with the A260/A280
ratio between 1.8 and 2.0. cDNA synthesis was conducted using
HiScript II Q RT SuperMix (Vazyme Biotech Co., Ltd.) according to
the manufacturer's protocol. Using GAPDH as a reference, RT-qPCR
was performed with ChamQ Universal SYBR qPCR Master Mix (cat. no.
R311-02; Vazyme Biotech Co., Ltd.) in the CFX96 Touch Real-Time PCR
Detection System (Bio-Rad Laboratories, Inc.). Primer sequences
(TsingKe Biological Technology) for reference and candidate genes
are shown in Table I. The
thermocycling protocol for PCR was as follows: 50˚C For 3 min, 95˚C
for 2 min, followed by 40 cycles of 95˚C for 10 sec and 60˚C for 10
sec. The 2-ΔΔCq method was applied
to calculate the relative expression level of mRNA (40).
 | Table IPrimer sequences for reverse
transcription-quantitative PCR. |
Table I
Primer sequences for reverse
transcription-quantitative PCR.
| Gene | Direction | Primer sequence
(5'-3') |
|---|
| ATM | Forward |
GGAGCCATAATTCAGGGTAGT |
| | Reverse |
GTCAGTGCCAAAGTCAAACA |
| KRAS | Forward |
TGGCGTAGGCAAGAGTG |
| | Reverse |
TTGACCTGCTGTGTCGAG |
| PIK3CA | Forward |
GACGCATTTCCACAGCTAC |
| | Reverse |
CACATAAGGGTTCTCCTCCA |
| MAPK8 | Forward |
TCTCCAACACCCGTACATC |
| | Reverse |
CCTCCAAGTCCATAACTTCCT |
| SIRT1 | Forward |
TTCCAGCCATCTCTCTGTC |
| | Reverse |
ATTCCCGCAACCTGTTC |
| GAPDH | Forward |
CCTTCCGTGTCCCCACT |
| | Reverse |
GCCTGCTTCACCACCTTC |
Statistical analysis
SAS 9.4 (SAS Institute, Inc.) was used to analyze
the clinical data, and the measurement data were tested for
normality first. Two groups were compared using independent
Student's t-test. If non-conformity was expressed as the median
(Q1-Q3), Wilcoxon rank-sum test was used. Enumeration data were
compared between the two groups using the x2 test. If
the theoretical frequency was too small, Fisher's exact probability
method was used. All experiments were performed three times, and
the results are expressed as the mean ± standard error of the mean.
GraphPad Prism 9 (GraphPad Software, Inc.) was used to analyze the
data. The statistically significant differences between the MI
group and controls were examined using independent Student's
t-test. P<0.05 was considered to indicate a statistically
significant difference.
Results
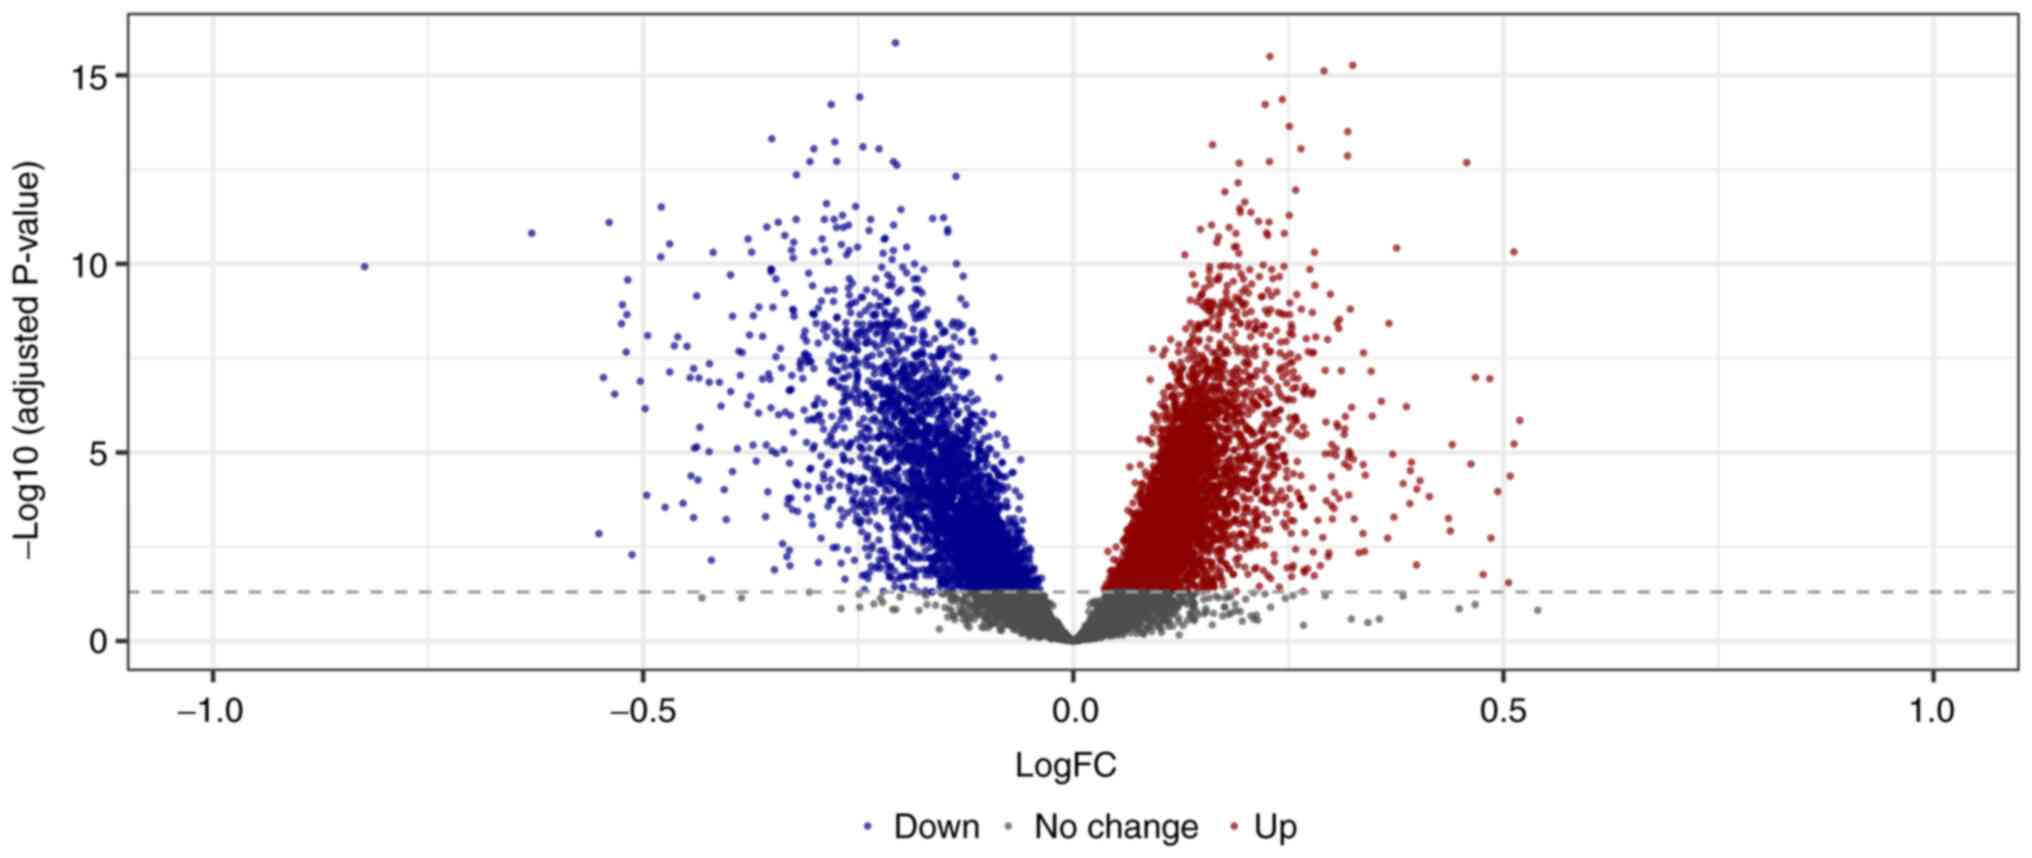
Identification of DEGs
After standardization of the microarray results from
GSE59867, a total of 10,286 DEGs, including 6,822 upregulated genes
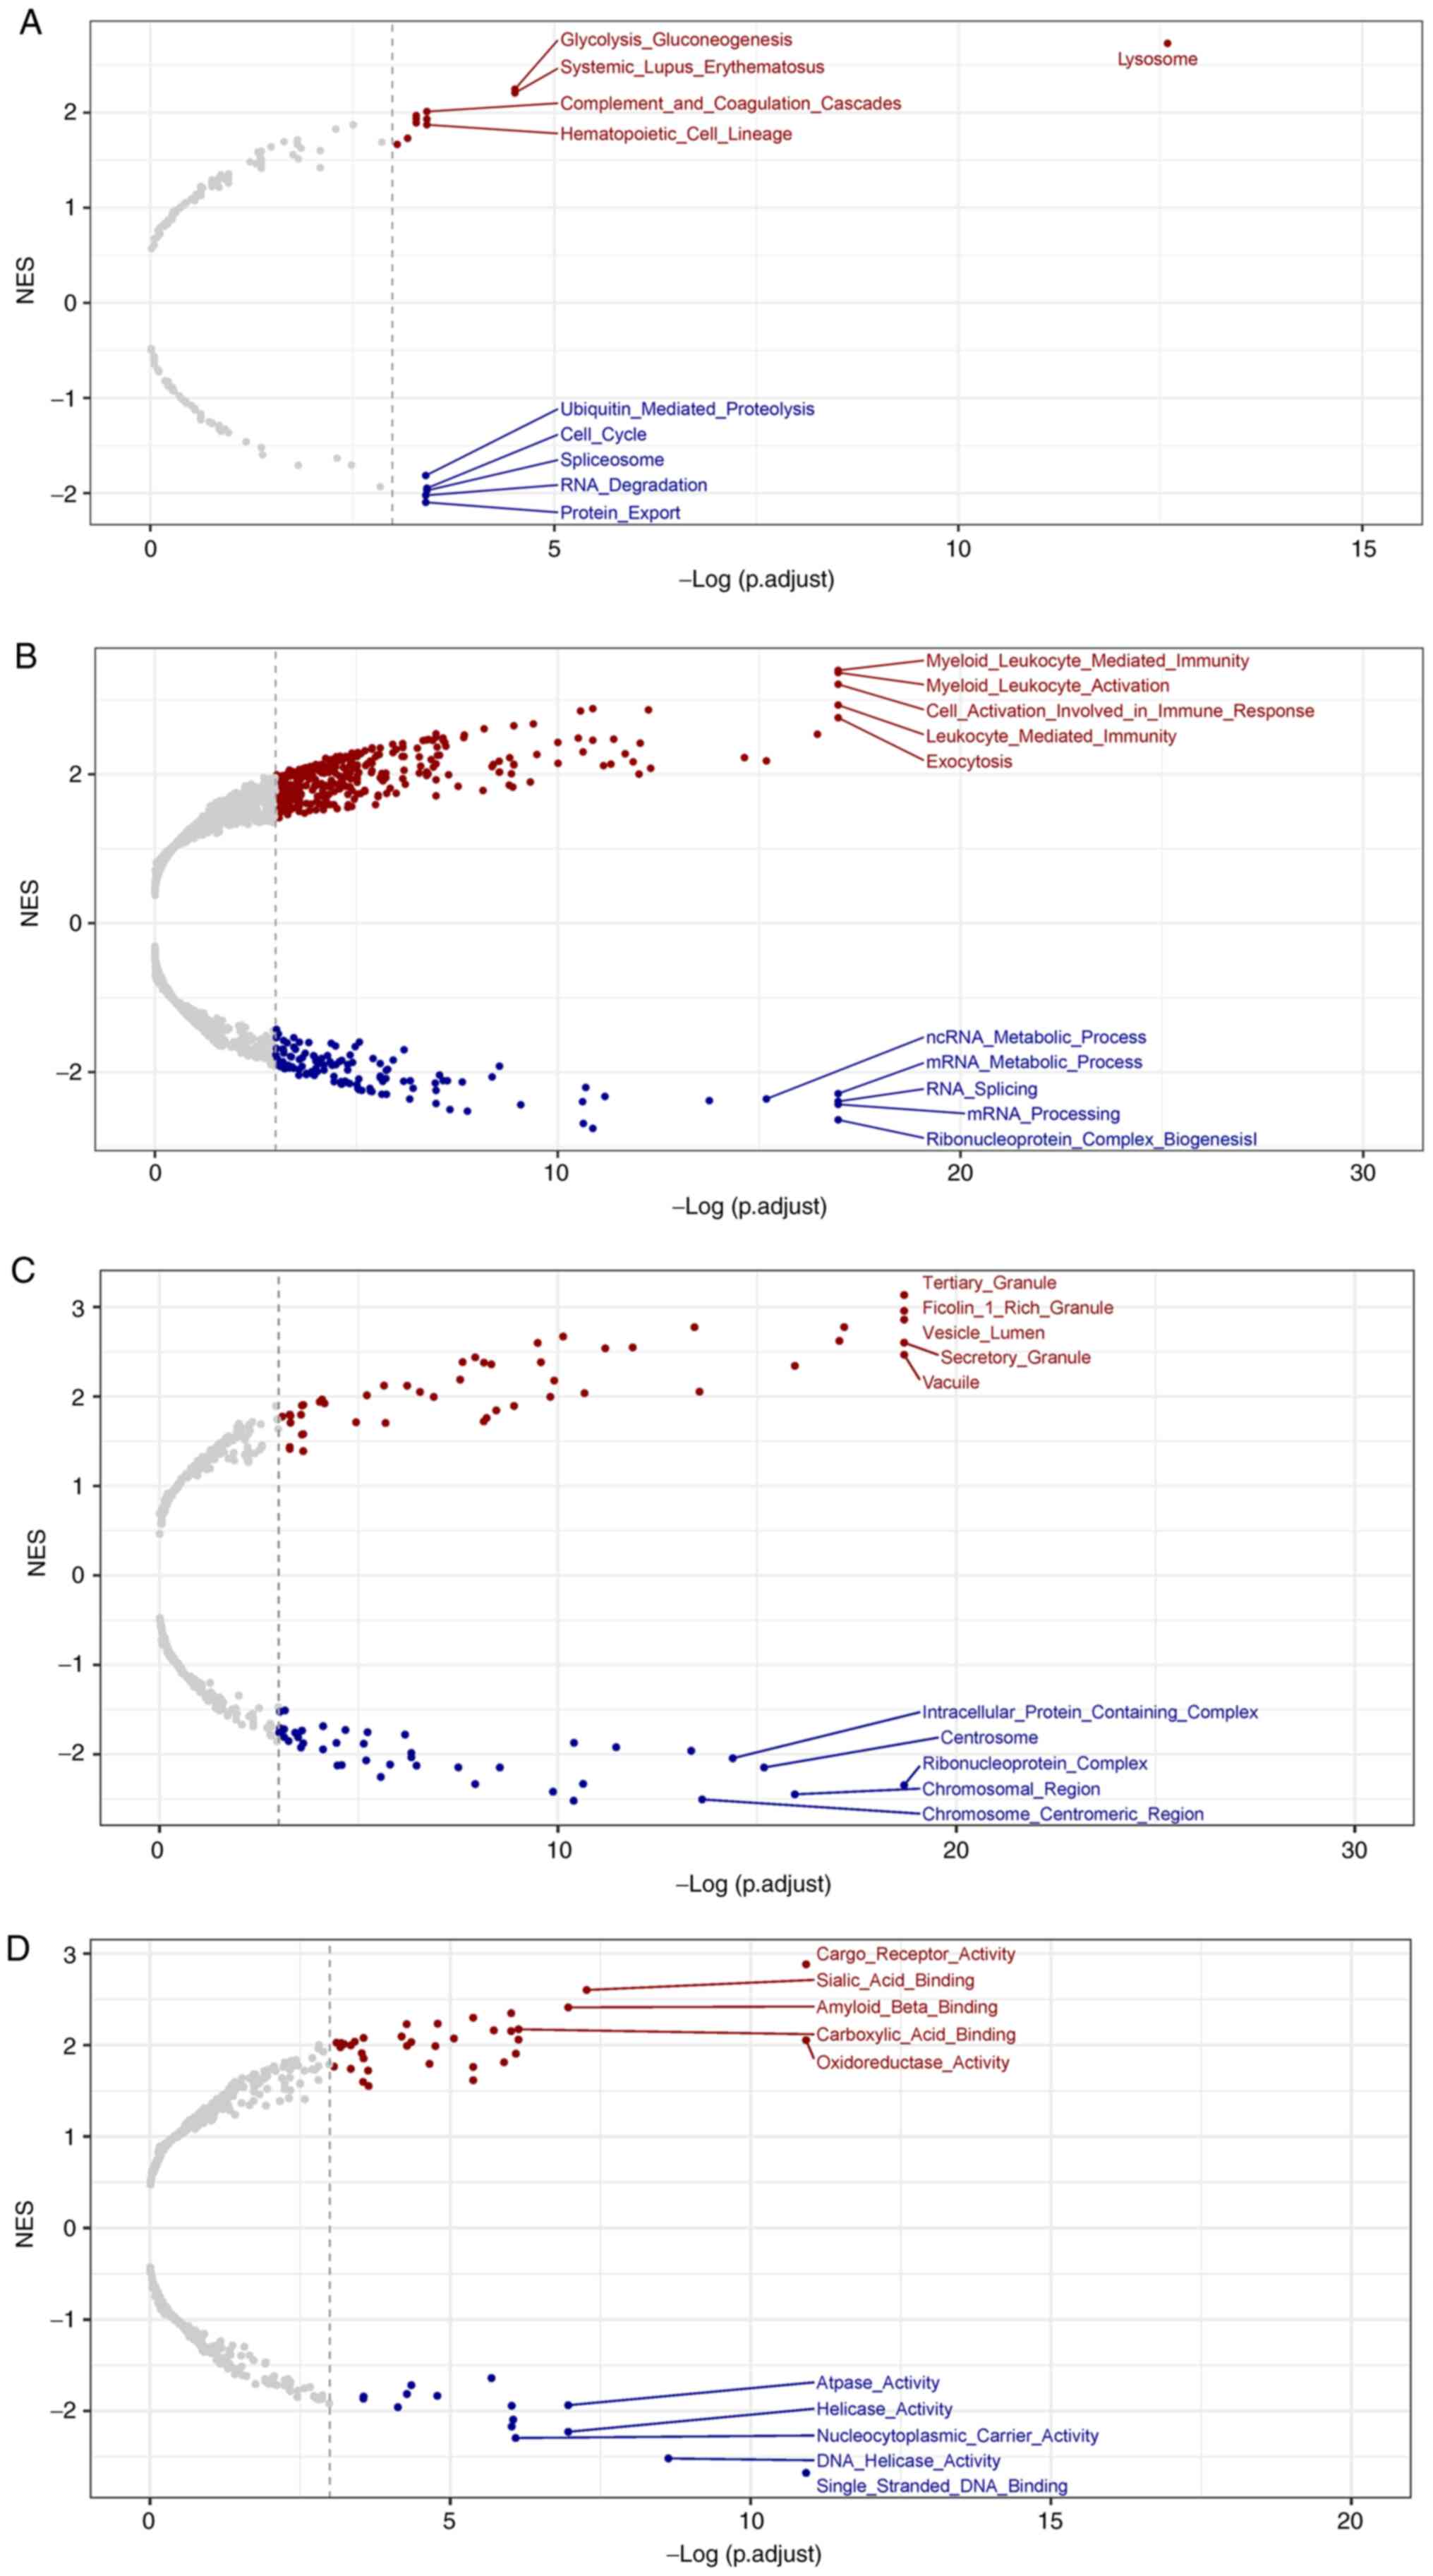
and 3,464 downregulated genes, were detected, as shown in Fig. 1. GSEA analysis showed that
upregulated genes were enriched in GO and KEGG pathways, including
‘Glycolysis gluconeogenesis’, ‘Myeloid leukocyte mediated
immunity’, ‘Tertiary granule’ and ‘Cargo receptor activity’.
Downregulated genes were enriched in ‘Cell cycle’, ‘mRNA
processing’, ‘Ribonucleoprotein complex’ and ‘ATPase activity’
(Fig. 2A-D).
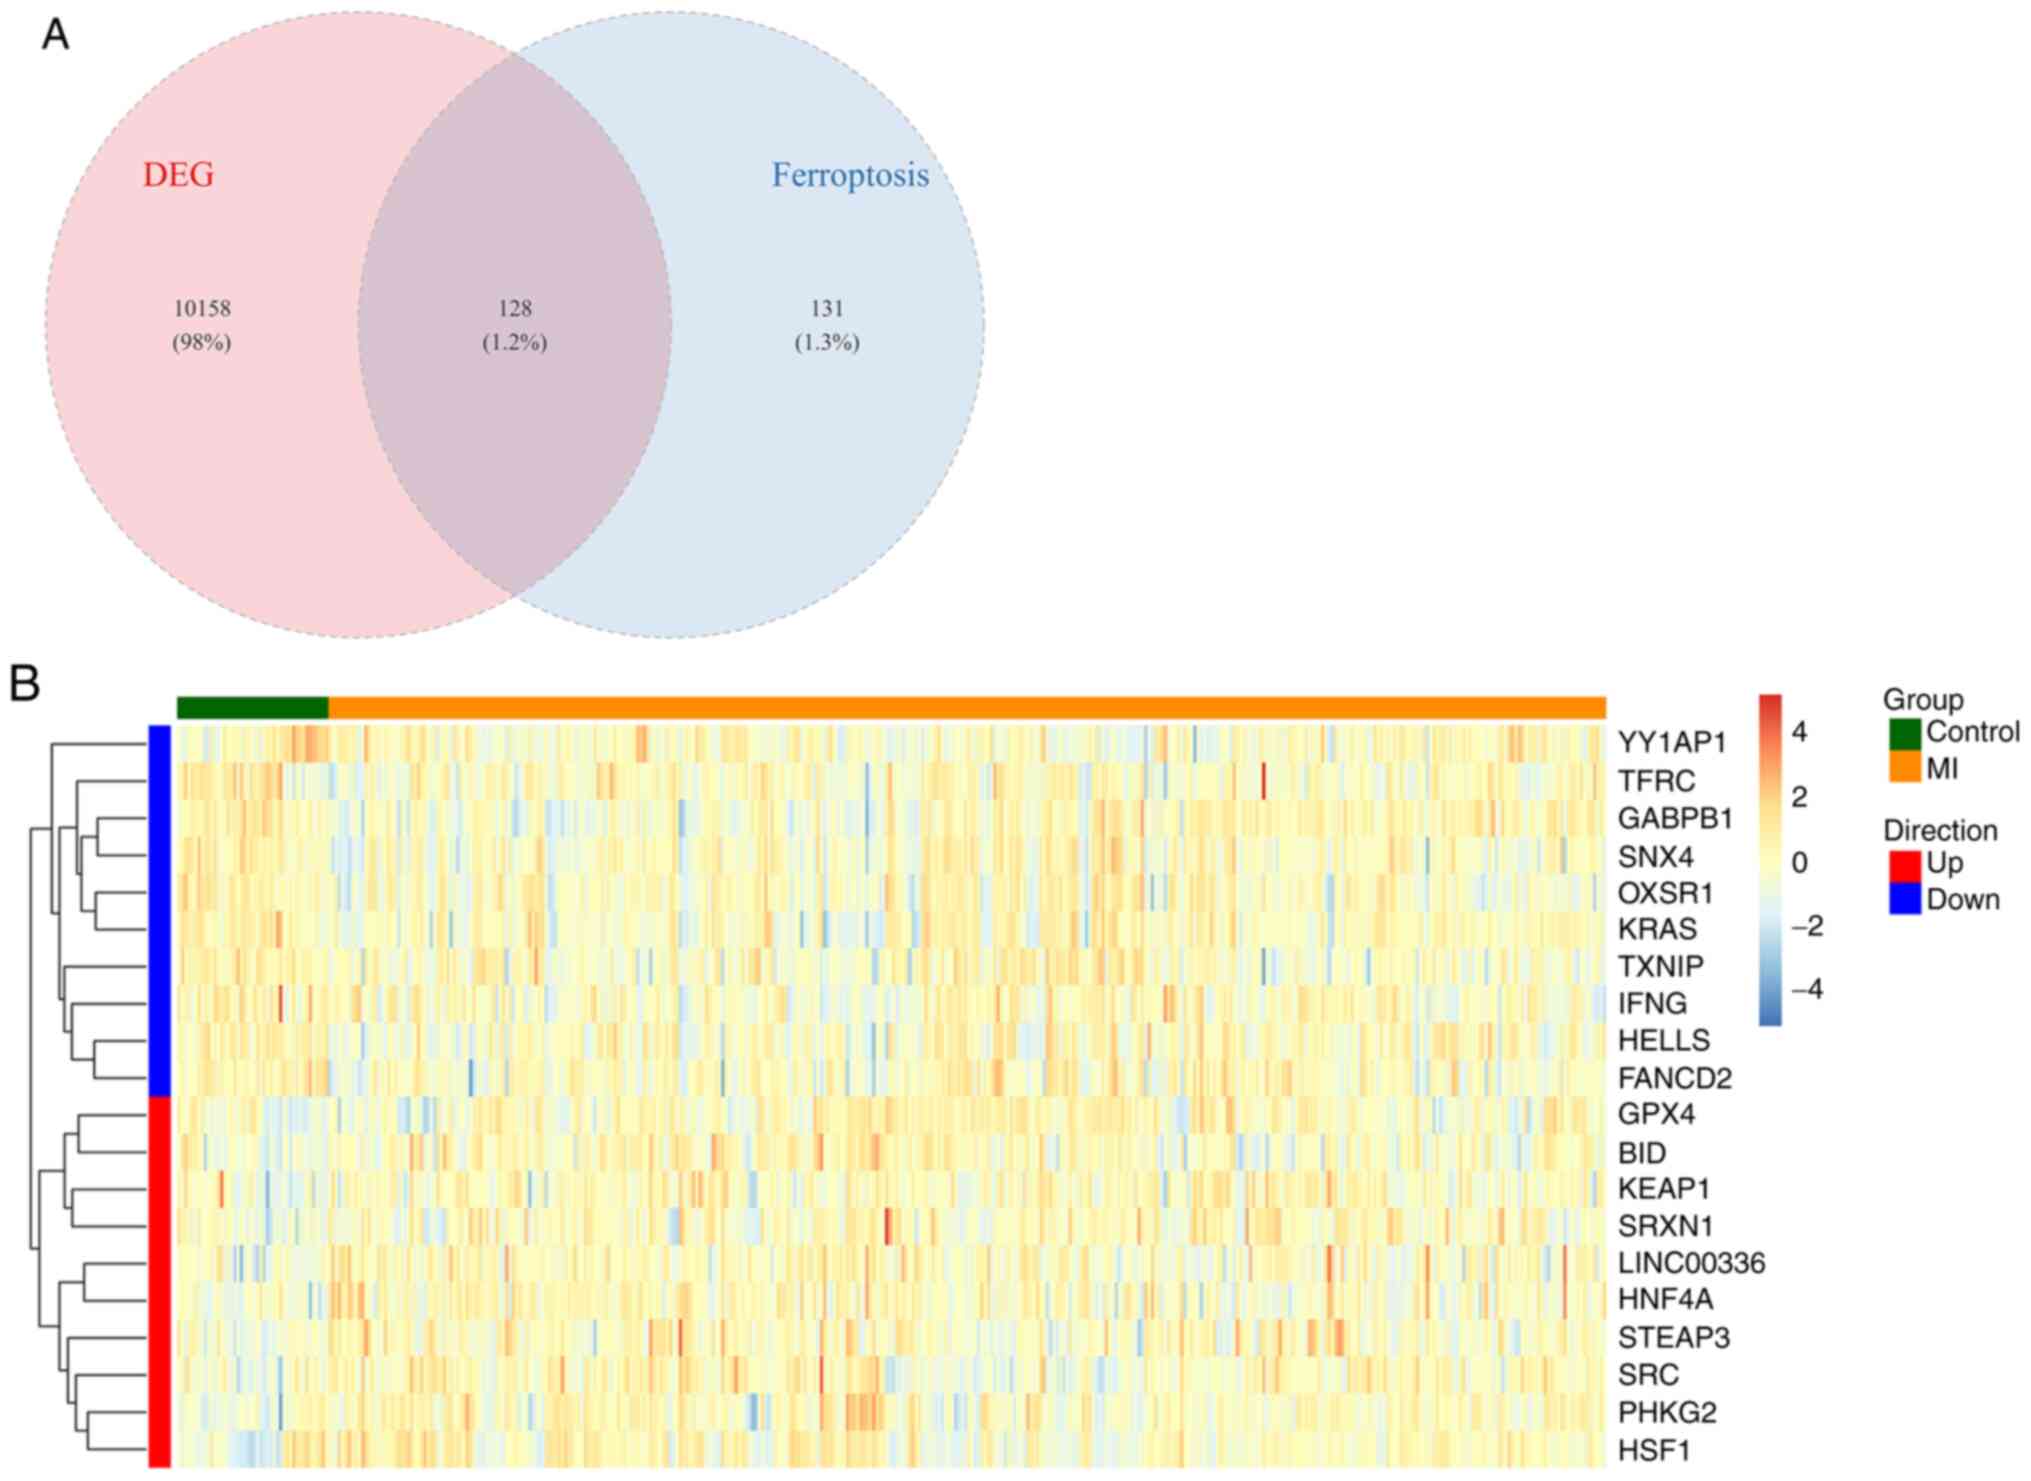
Analysis of ferroptosis-related DEGs. A total
of 259 ferroptosis-related genes were extracted from the FerrDb
database. After intersecting them with the DEGs, a total of 128
ferroptosis-related DEGs were found. The Venn diagram of the
ferroptosis-related DEGs are shown in Fig. 3A. Fig.
3B, which presents the 10 most significantly upregulated and 10
downregulated genes by heat map, indicating the differential
expression of ferroptosis-related DEGs between the control and MI
groups.
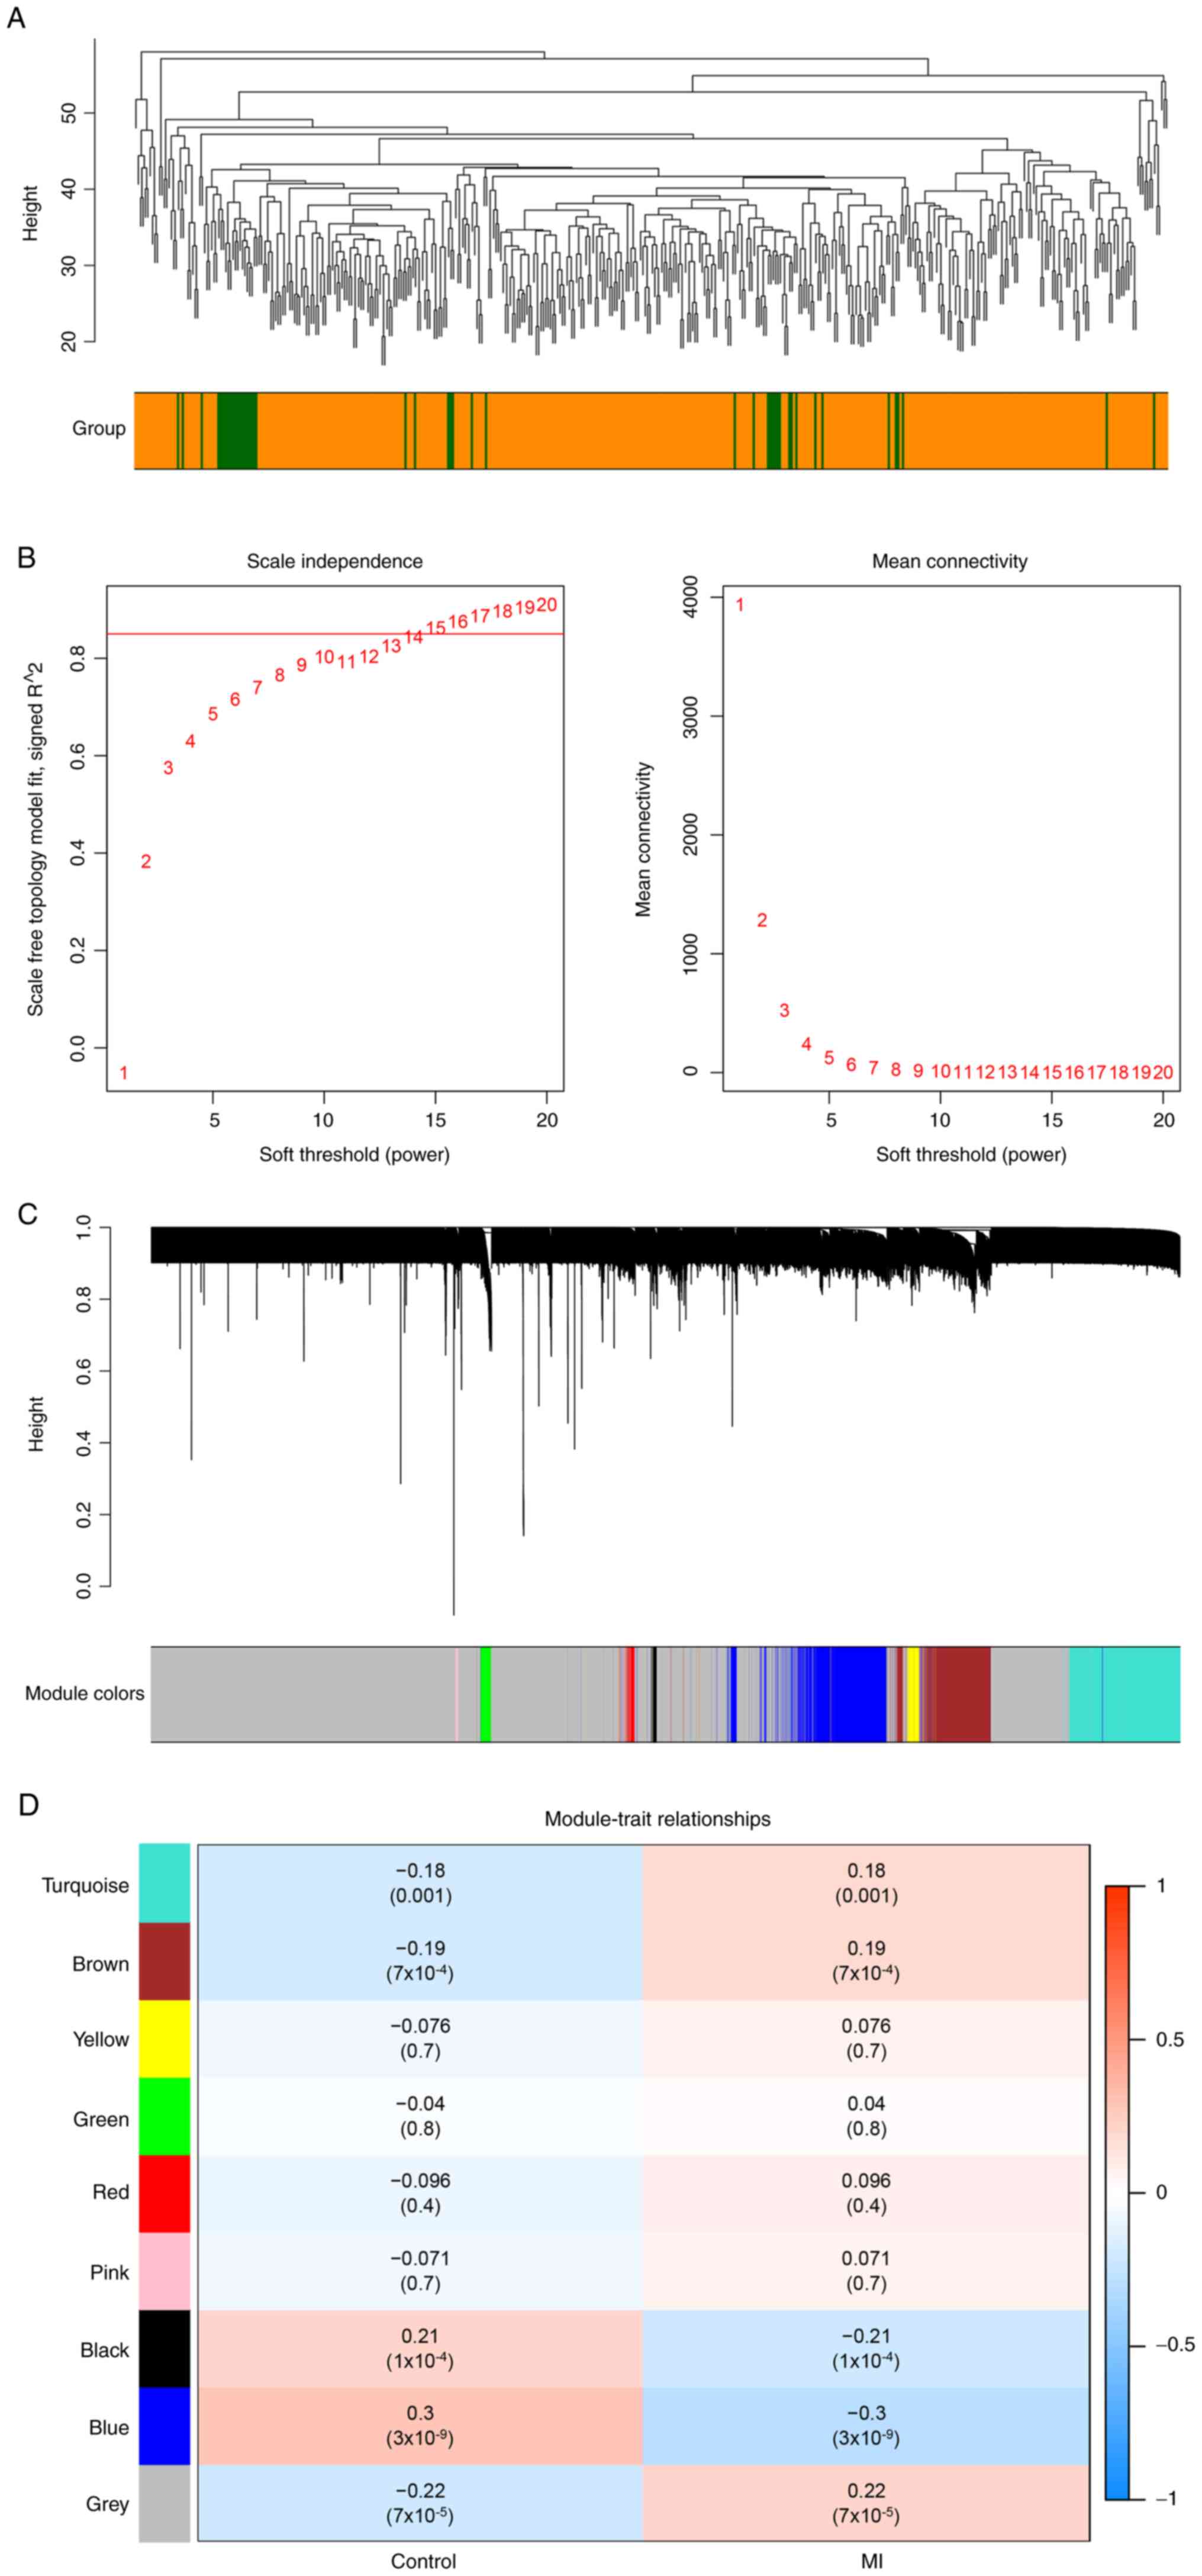
Weighted co-expression network
construction and identification of key modules
Euclidean distance of the expression was used to
perform hierarchical clustering. There were no outliers to remove
(Fig. 4A). The soft threshold was
set to 15 to construct a scale-free network (Fig. 4B). Next, eight modules were
identified based on average hierarchical clustering and dynamic
tree clipping (Fig. 4C). The blue
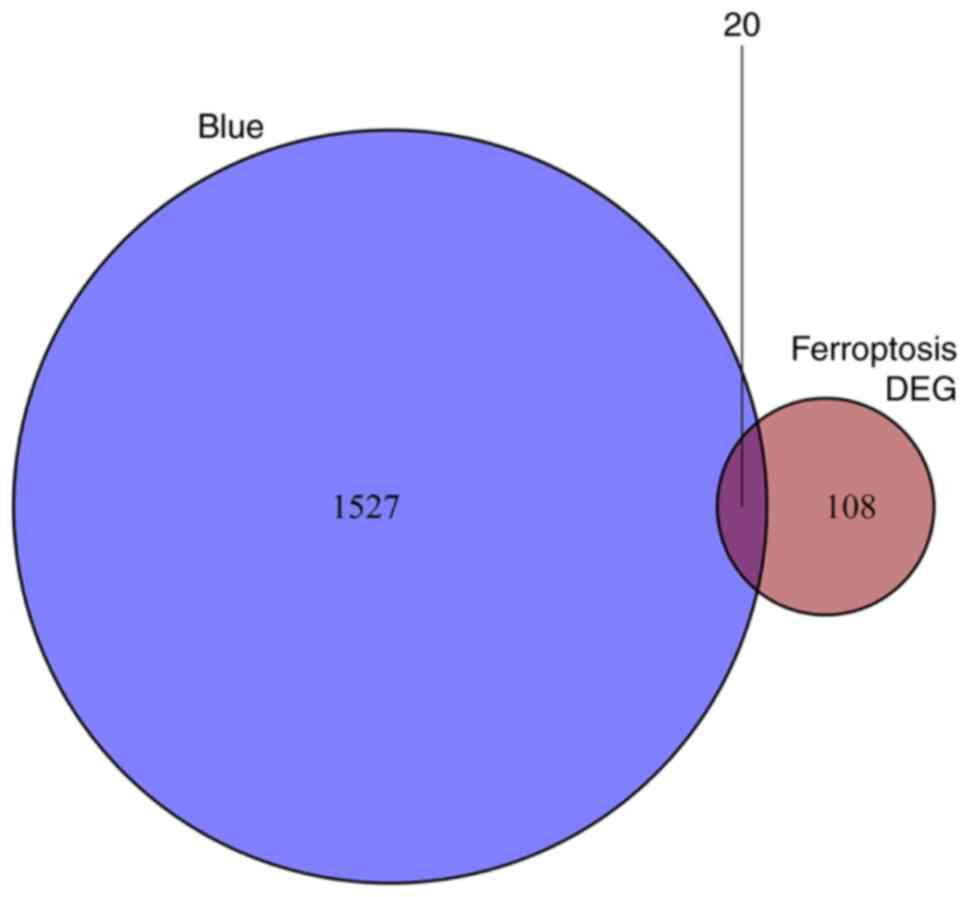
module was the most relevant module associated with MI (Fig. 4D). Thus, a total of 1,547 genes in
this module were selected for further analysis.
GO and KEGG enrichment analysis of
ferroptosis-related genes
Blue module genes and ferroptosis-related DEGs were
overlapped to obtain 20 ferroptosis-related genes (Fig. 5). The 20 genes are TGFBR1, ZEB1,
SNX4, IREB2, ATG5, KRAS, SLC38A1, FANCD2, ATM, MAPK8, MAP3K5,
FBXW7, MAPK9, EMC2, PIK3CA, SIRT1, KLHL24, OXSR1, GABPB1 and
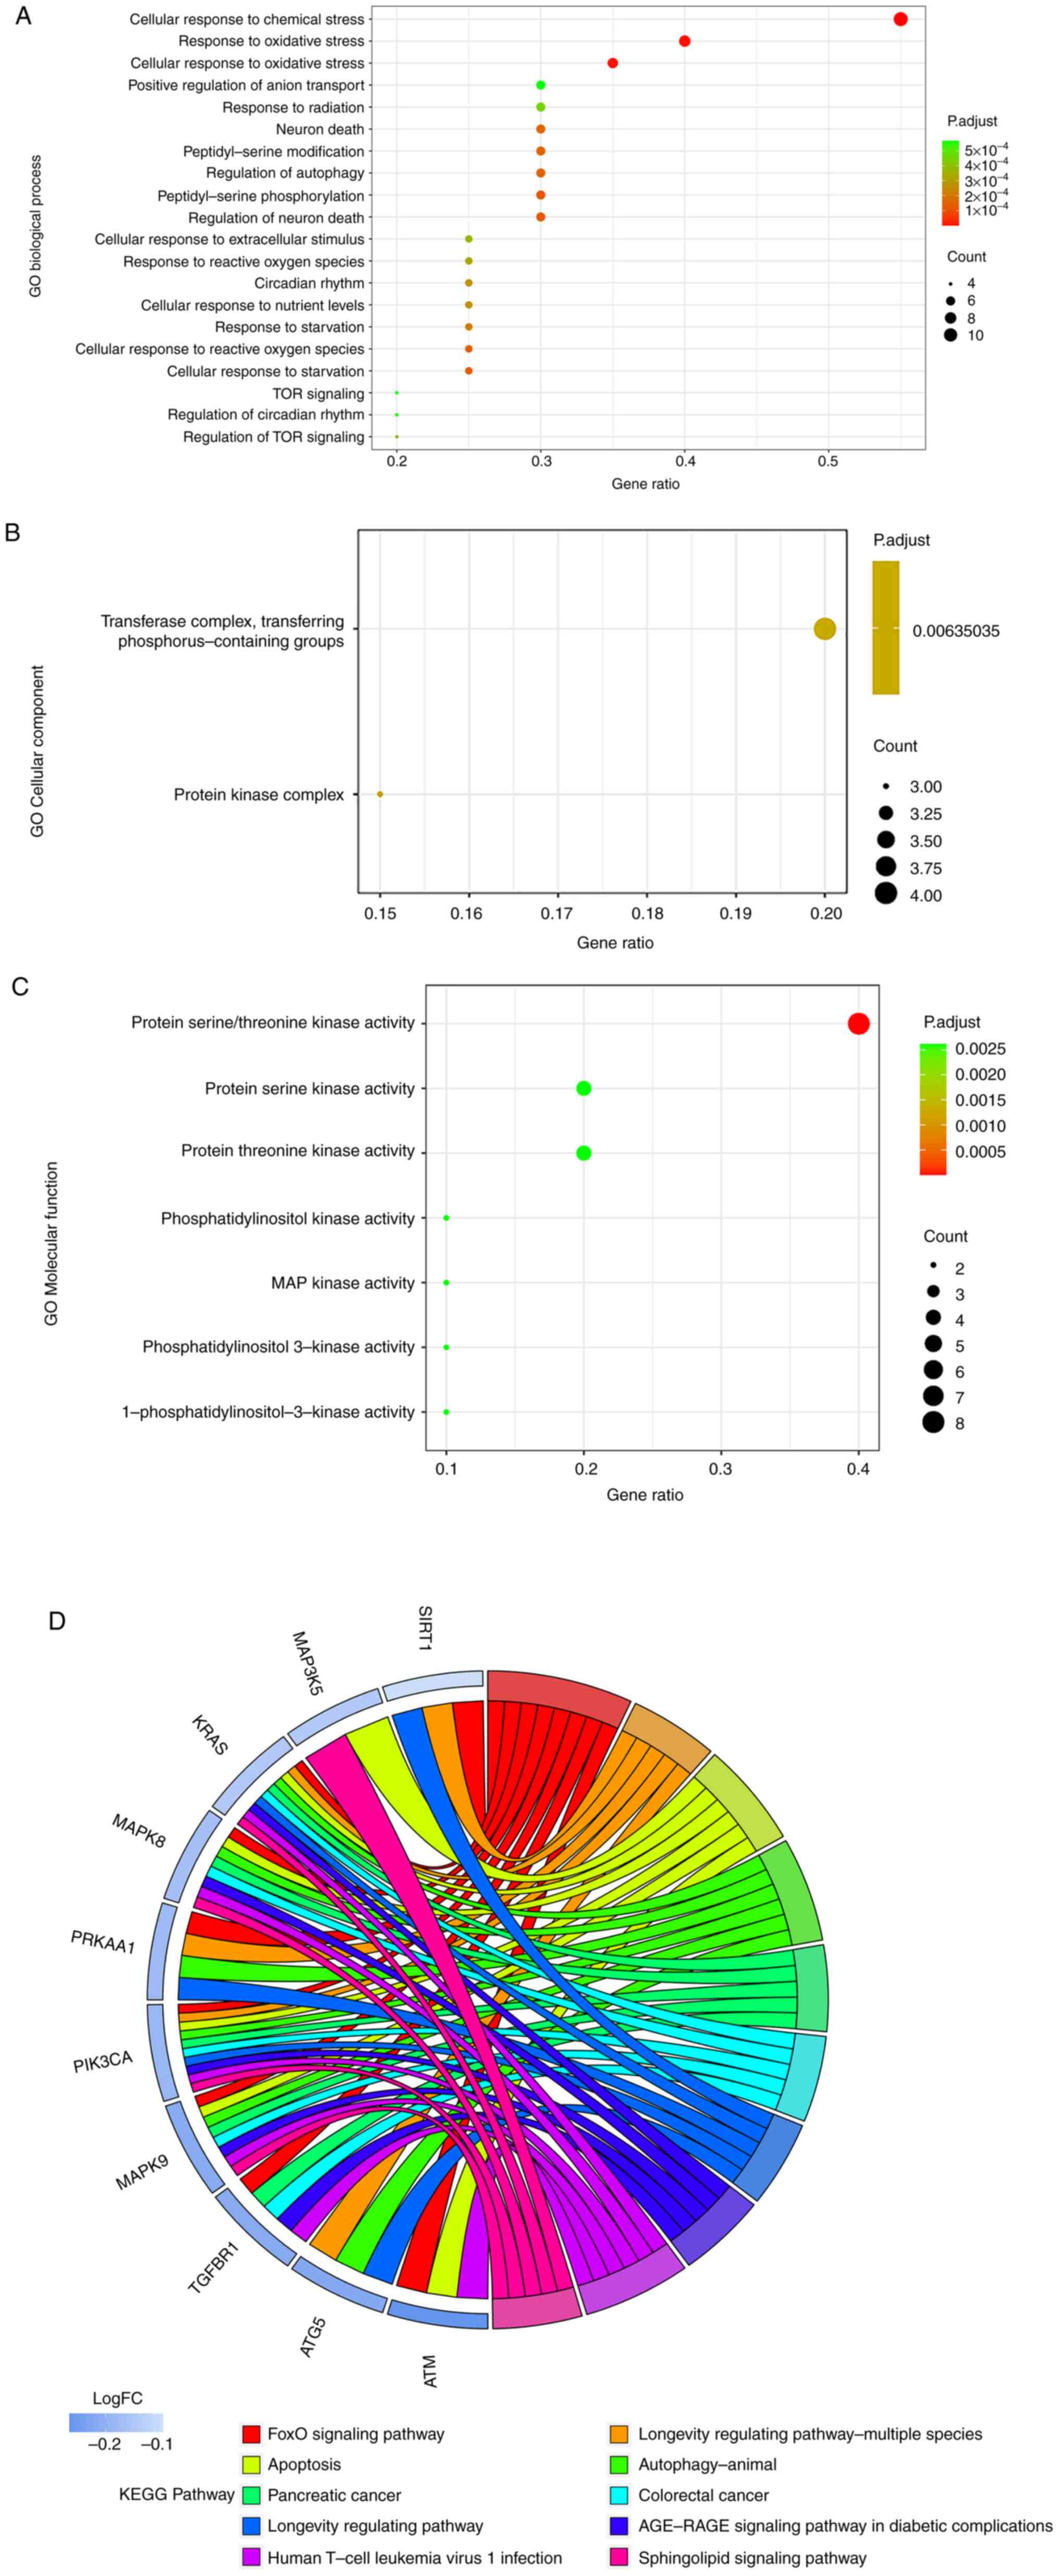
PRKAA1. It was observed that for GO-BP they were mainly enriched in
‘cellular response to chemical stress’, ‘response to oxidative
stress’ and ‘cellular response to oxidative stress’ (Fig. 6A). For GO-CC, the genes were mainly
enriched in ‘transferase complex, transferring
phosphorus-containing groups’ and ‘protein kinase complex’
(Fig. 6B). Finally, regarding
GO-MF, the genes were mainly enriched in ‘protein serine/threonine
kinase activity’,‘protein serin kinase activity’ and ‘protein
threonine kinase activity’ (Fig.
6C). Moreover, KEGG analysis revealed that those genes were
mainly involved in the ‘FoxO signaling pathway’, ‘Longevity
regulating pathway-multiple species’ and ‘Apoptosis’ (Fig. 6D).
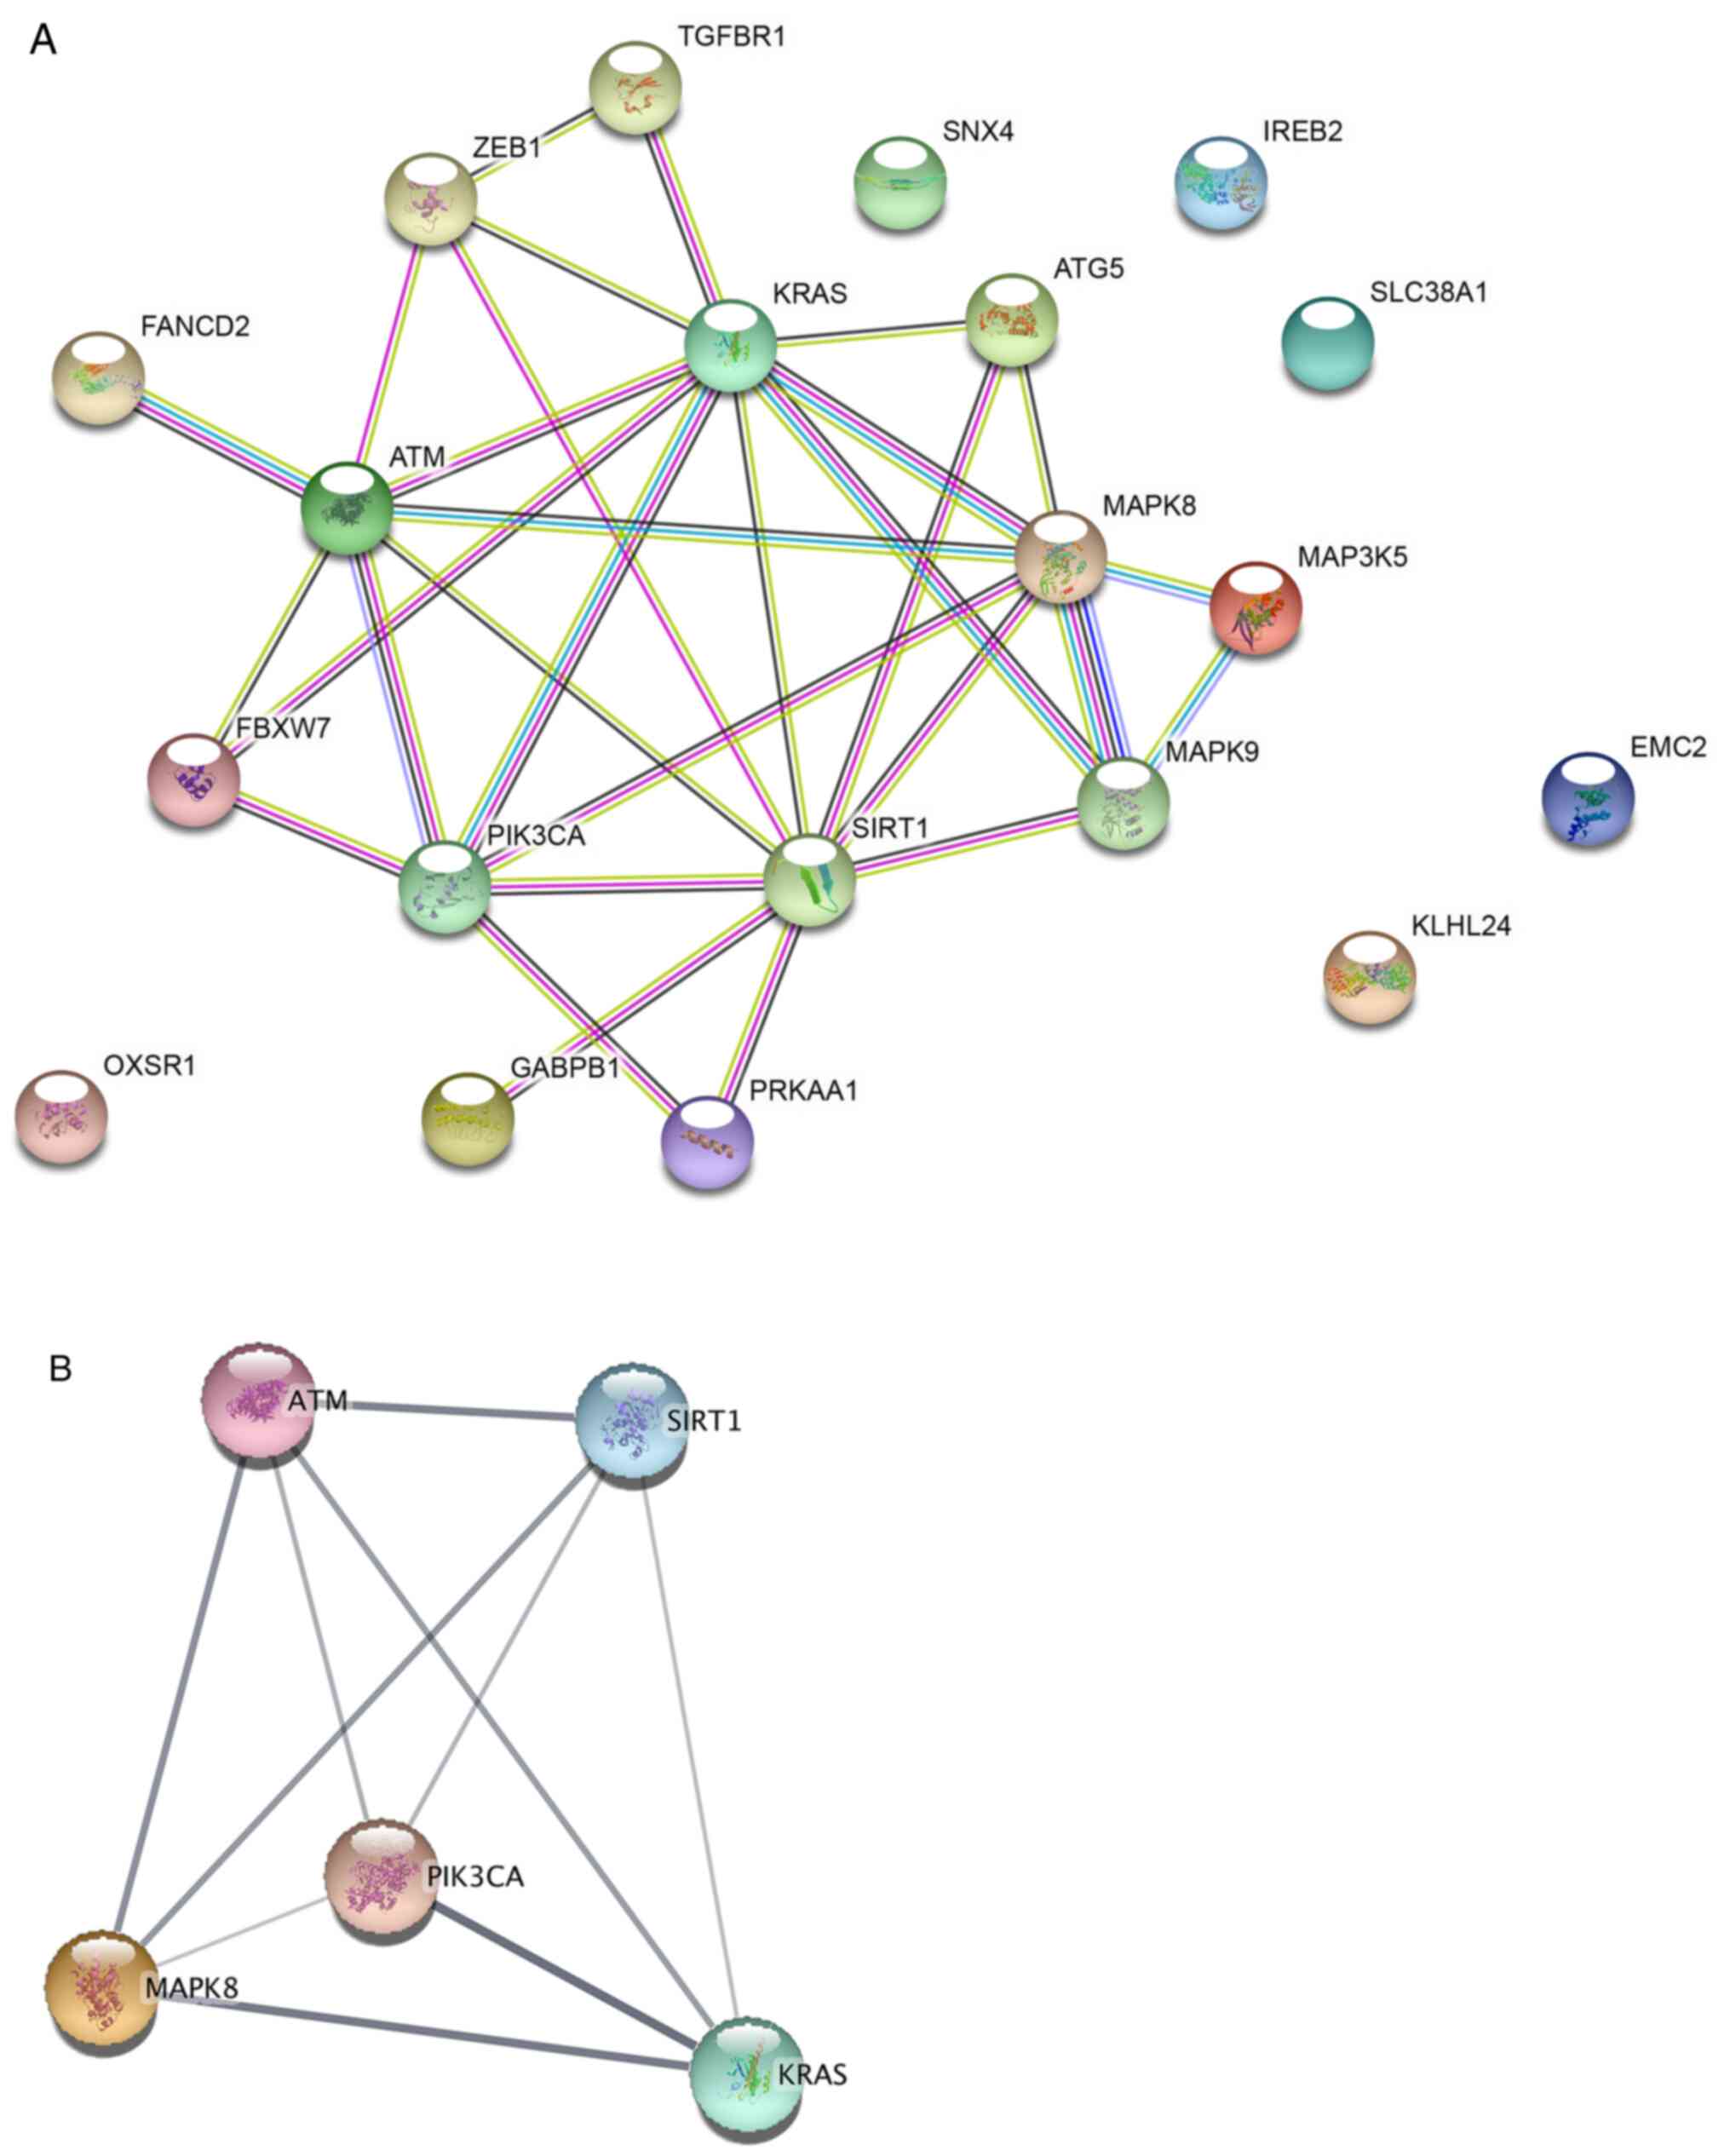
PPI network construction and module
analysis
To further study the interaction of the 20
ferroptosis-related genes, a PPI network was constructed using the
STRING database. A total of six of the 20 genes were not related to
other molecules and did not form a molecular network. With a
confidence of >0.4 and hiding the disconnected nodes, a
visualized PPI network was created using Cytoscape (Fig. 7A). Using the MCODE plugin, five
genes in the key module were selected as hub genes, namely ATM,
PIK3CA, MAPK8, KRAS and SIRT1 (Fig.
7B).
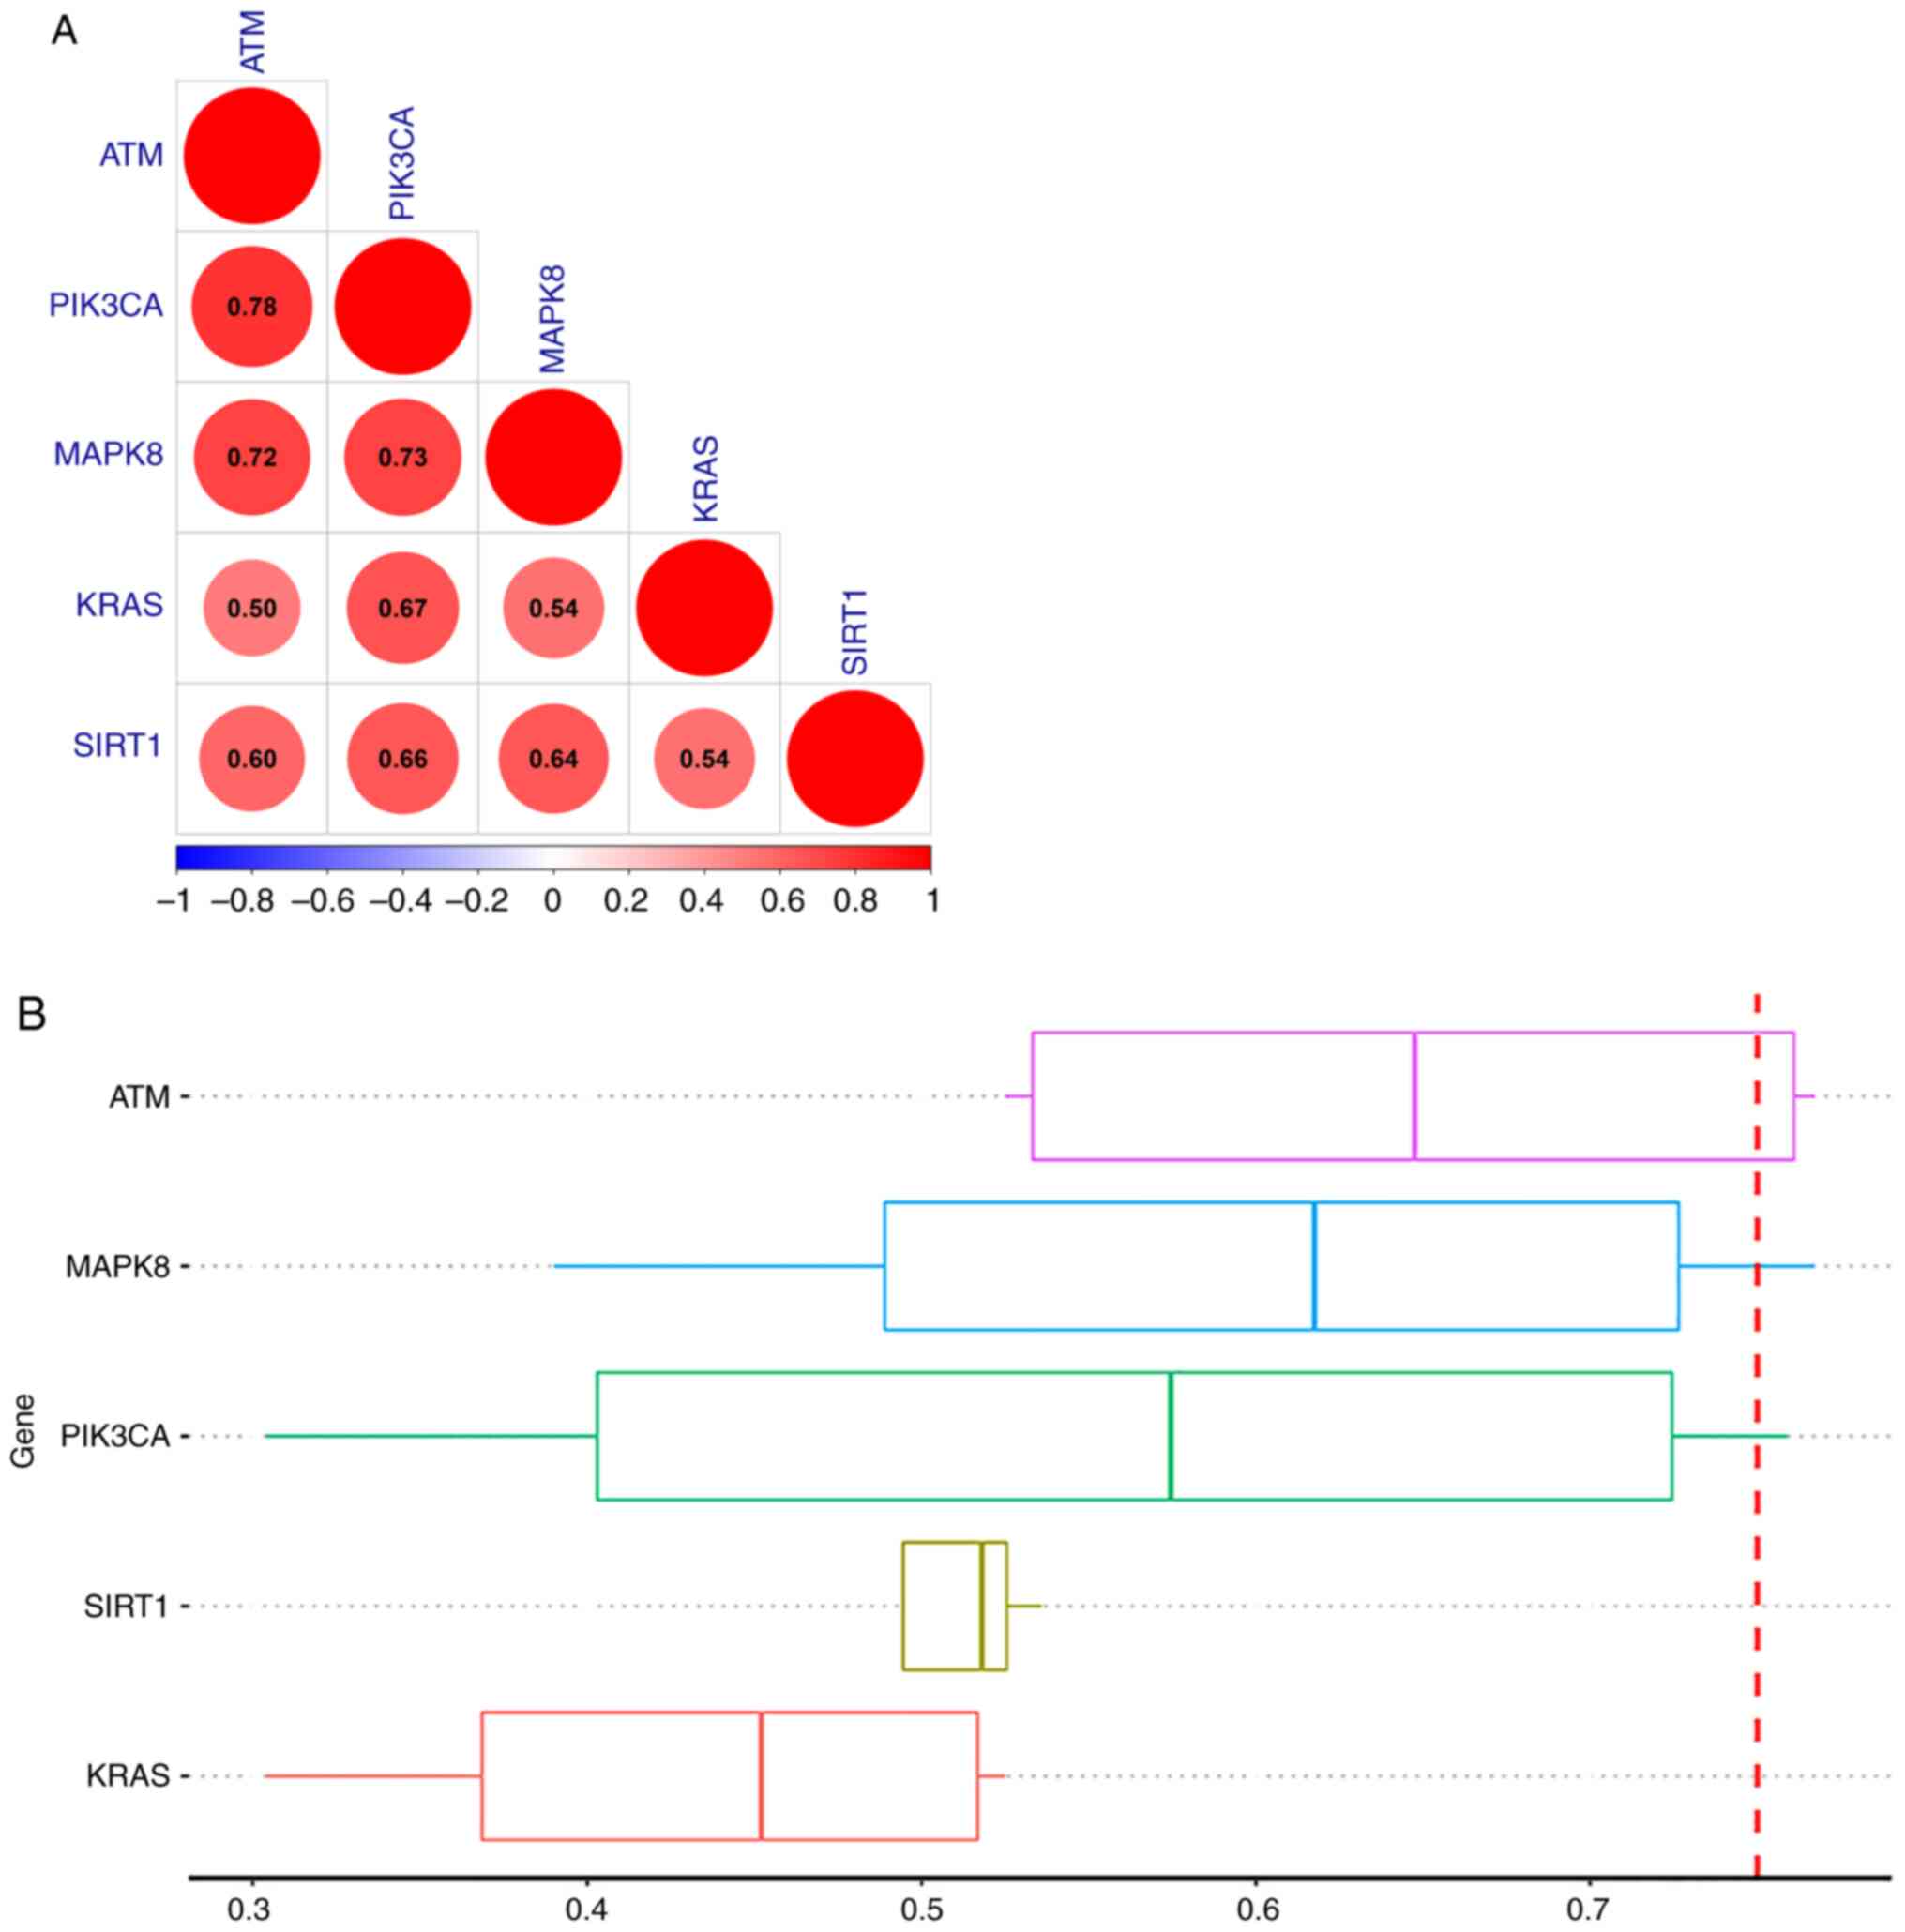
Analysis of interaction effect and
functional similarity of hub genes
Analysis of the interactome of the hub genes
revealed that ATM and PIK3CA had the highest correlation (Fig. 8A). Proteins were ranked by their
average functional similarity relationships among proteins within
the interactome. ATM, MAPK8 and PIK3CA were the three top-ranked
proteins potentially playing key roles in MI (Fig. 8B).
Multi-factor regulation network
construction
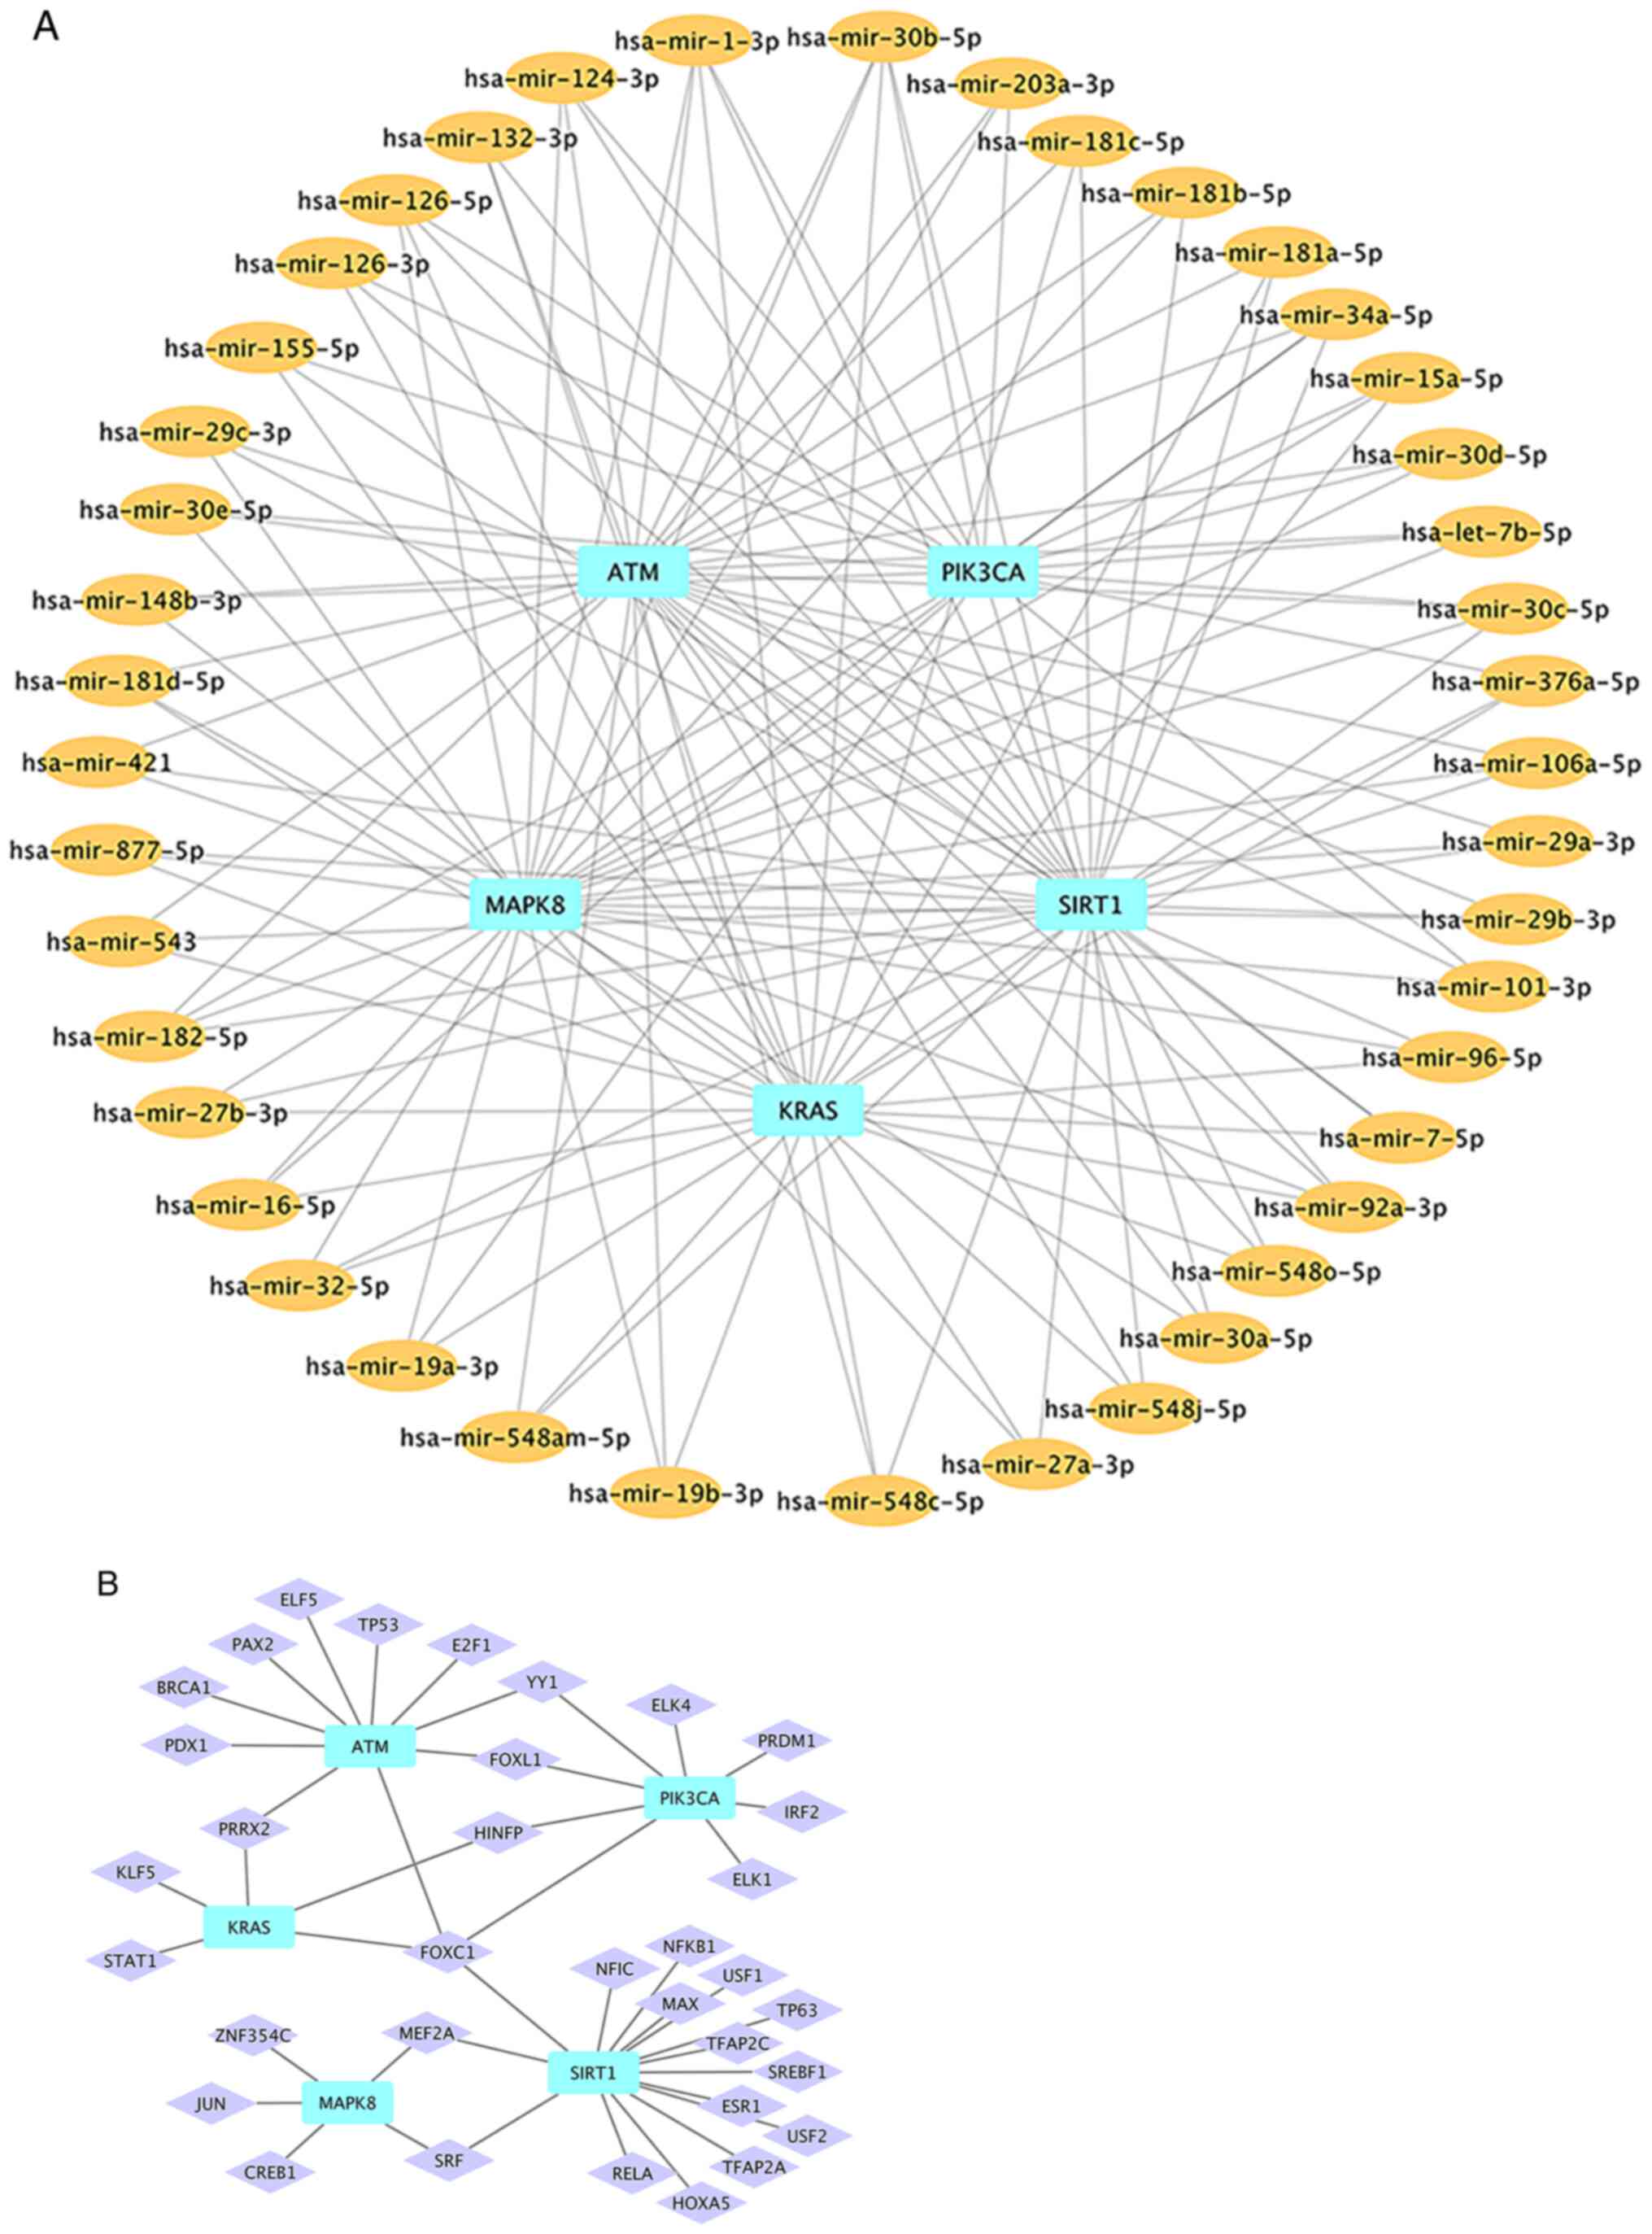
Based on the results from miRNet database,
miRNAs-hub gene (Fig. 9A) and
TFs-hub gene (Fig. 9B) networks
were constructed using Cytoscape software. In order to facilitate
the selection of key miRNAs, miRNAs targeting ≥3 hub genes were
selected for network analysis. Finally, the network included five
hub genes, 43 miRNAs and 34 TFs.
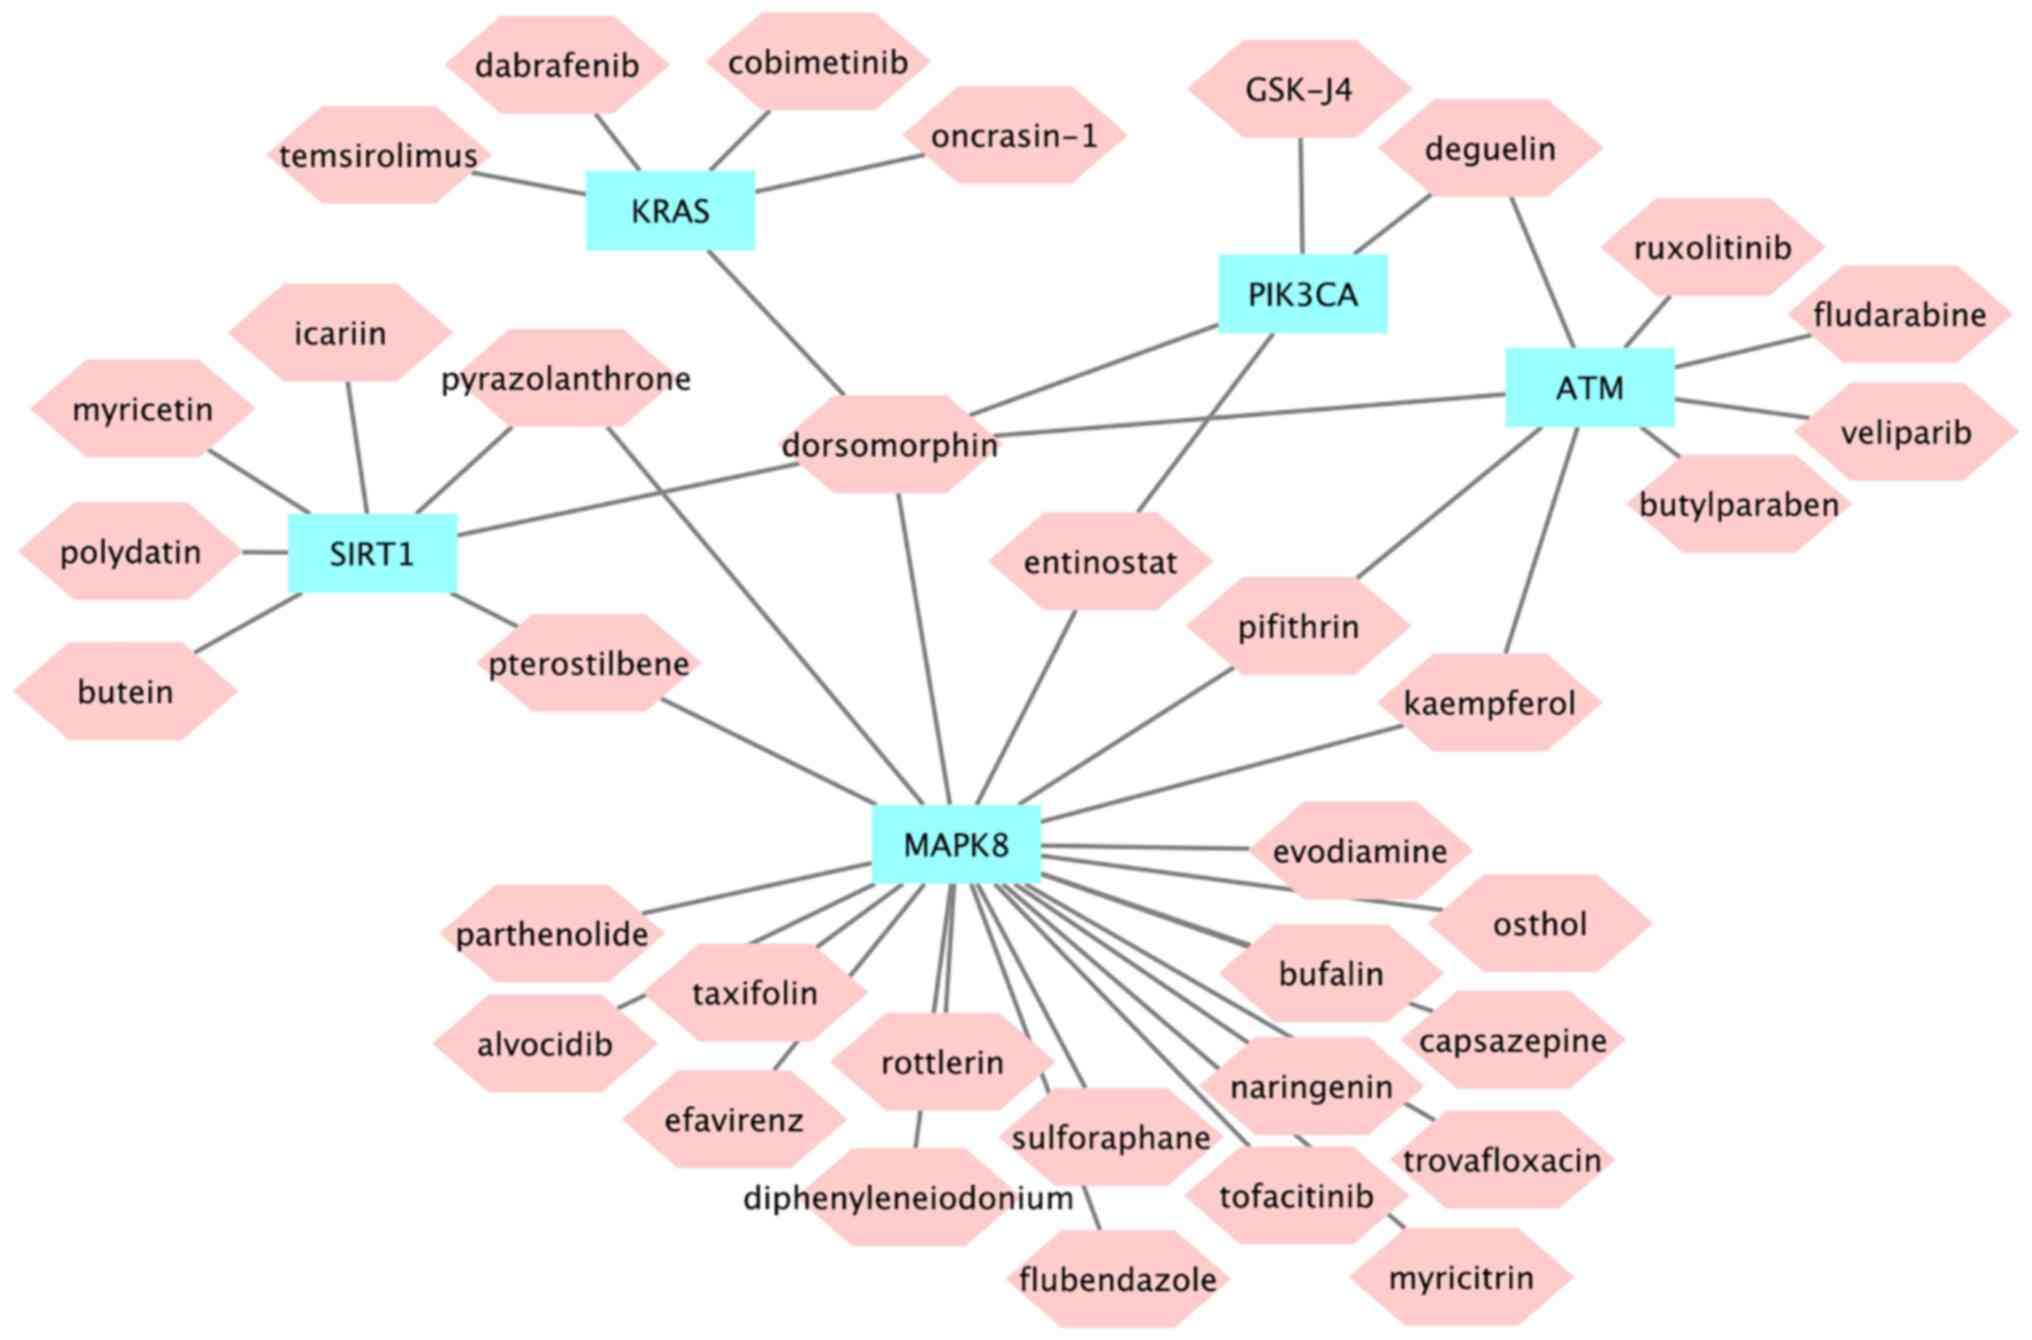
Drug prediction
The Connectivity Map (CMap) database was used to
search for potential drugs associated with MI (41,42).
Based on the interaction information of genes and drugs in the CTD
database, the association between potential drugs and hub genes was
obtained Among them, dorsomorphin is a small-molecule drug may act
on five hub genes (Fig. 10).
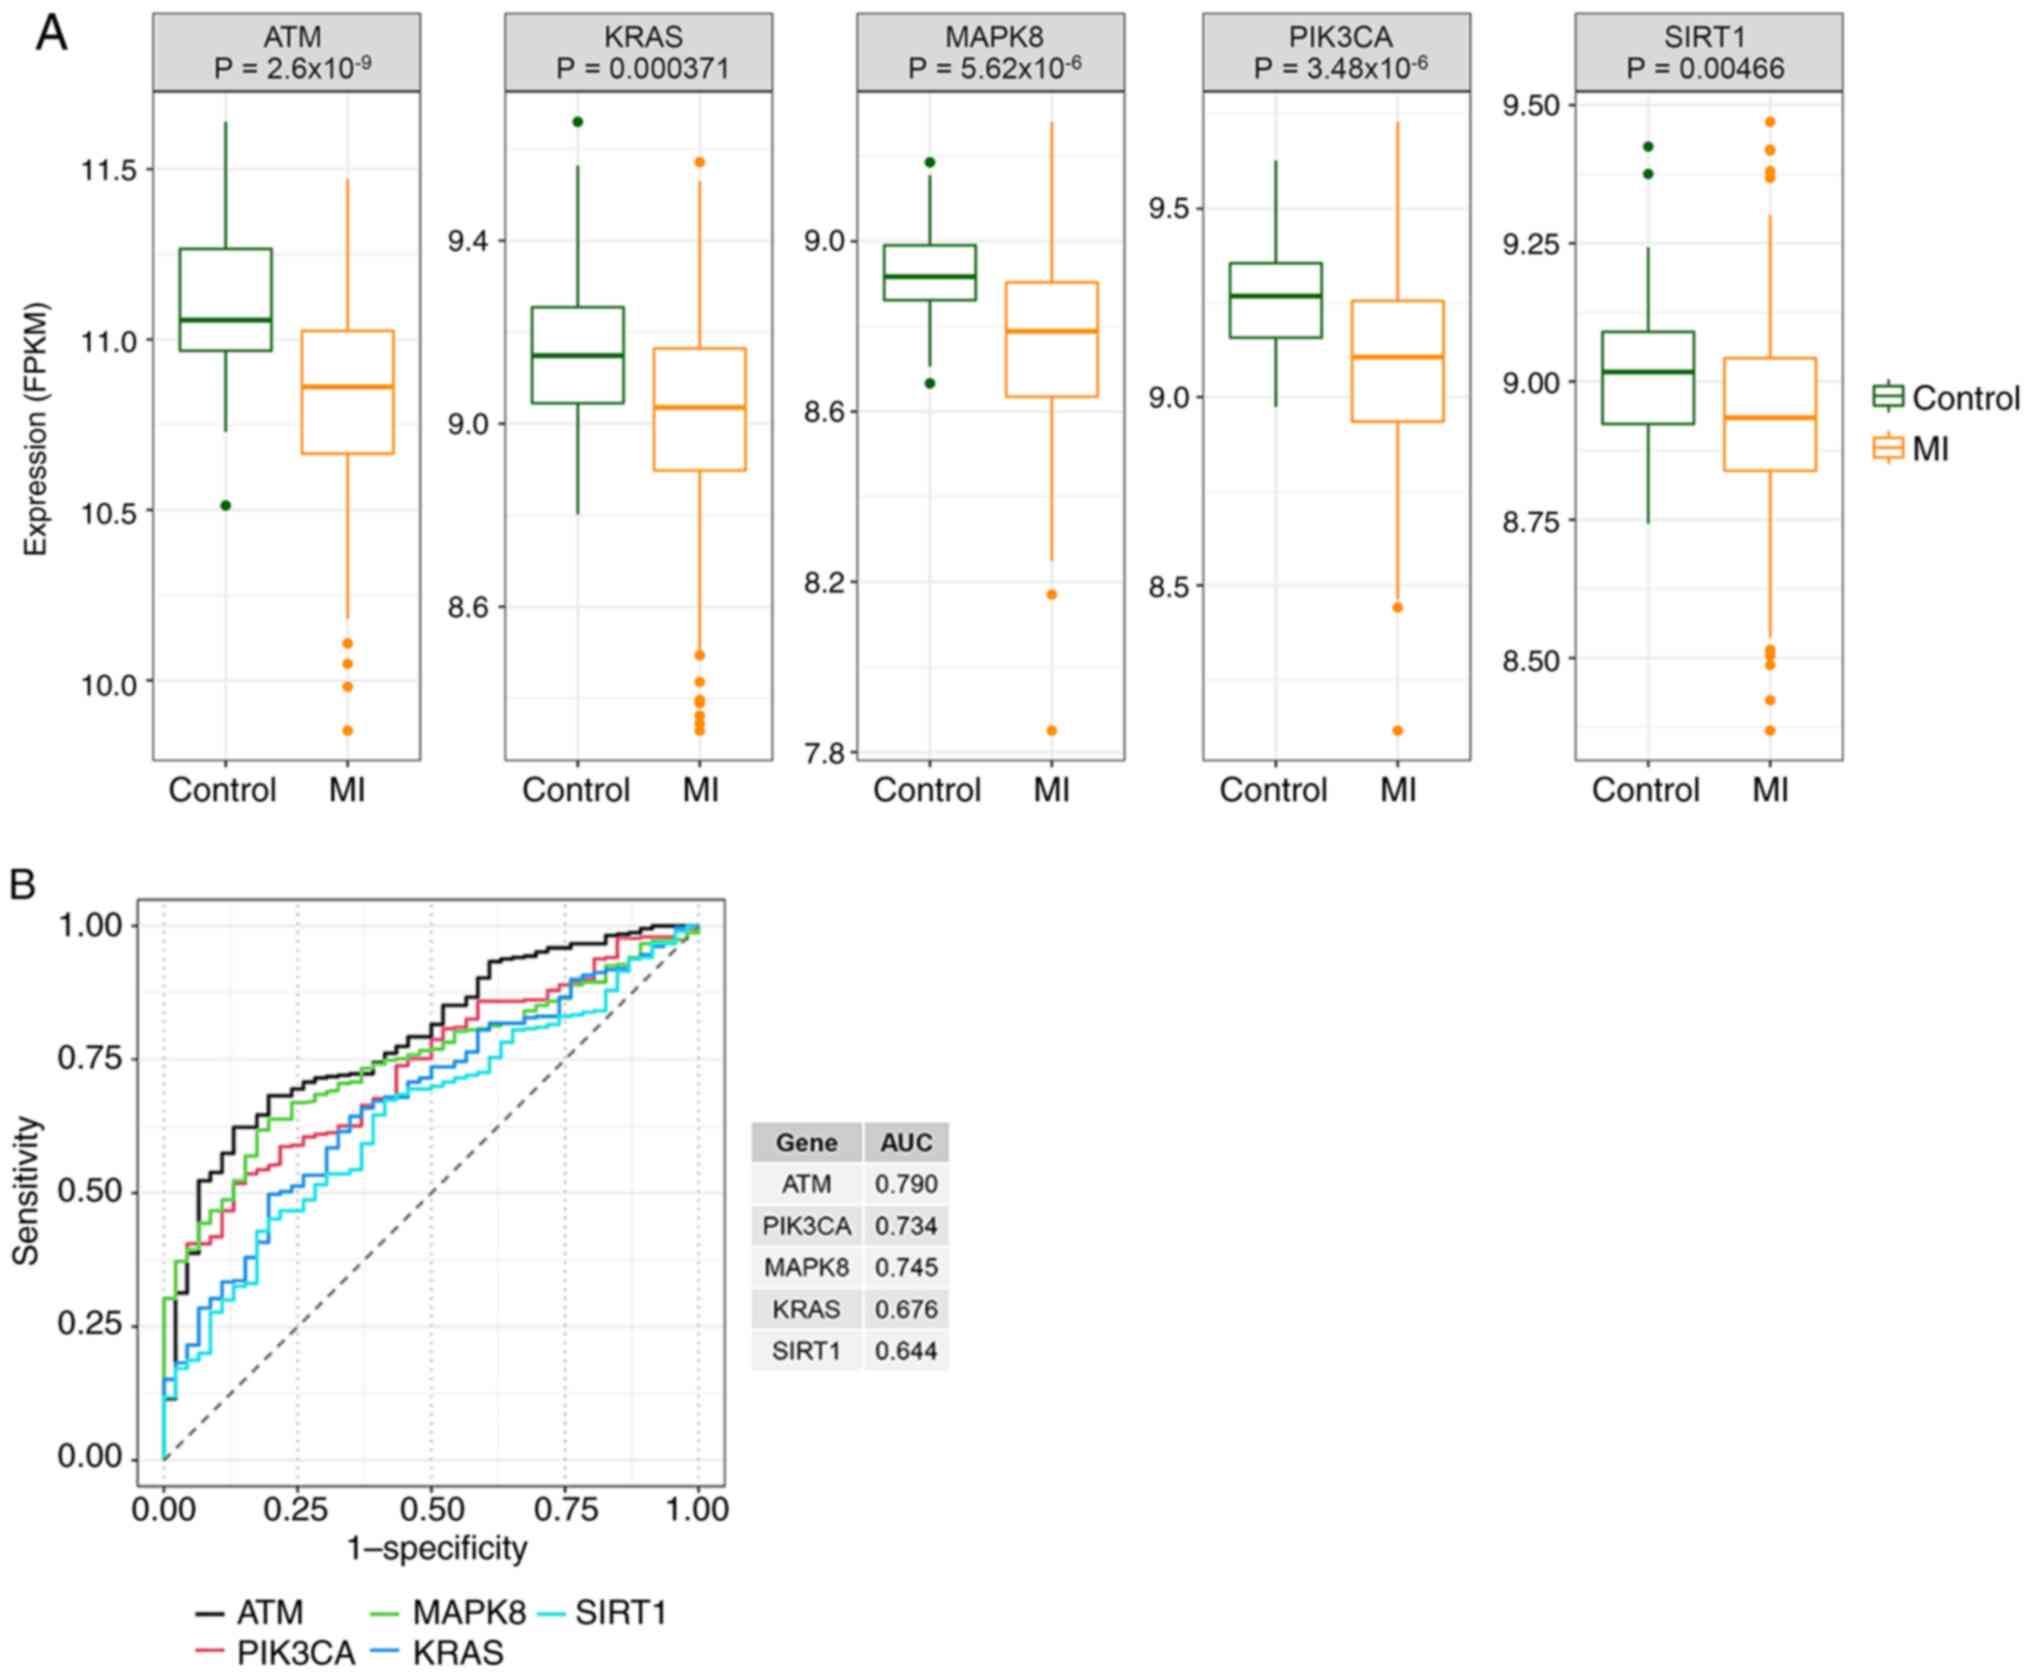
Evaluation of the diagnostic
performance of hub genes in GSE59867
The expression of hub genes in MI and control
samples was detected, and it was found that the expression of hub
genes was downregulated in MI (Fig.
11A). The diagnostic values of hub genes were further evaluated
by ROC curves. It was found that ATM, PIK3CA and MAPK8 had high
accuracy with AUC values of >0.7 (Fig. 11B).
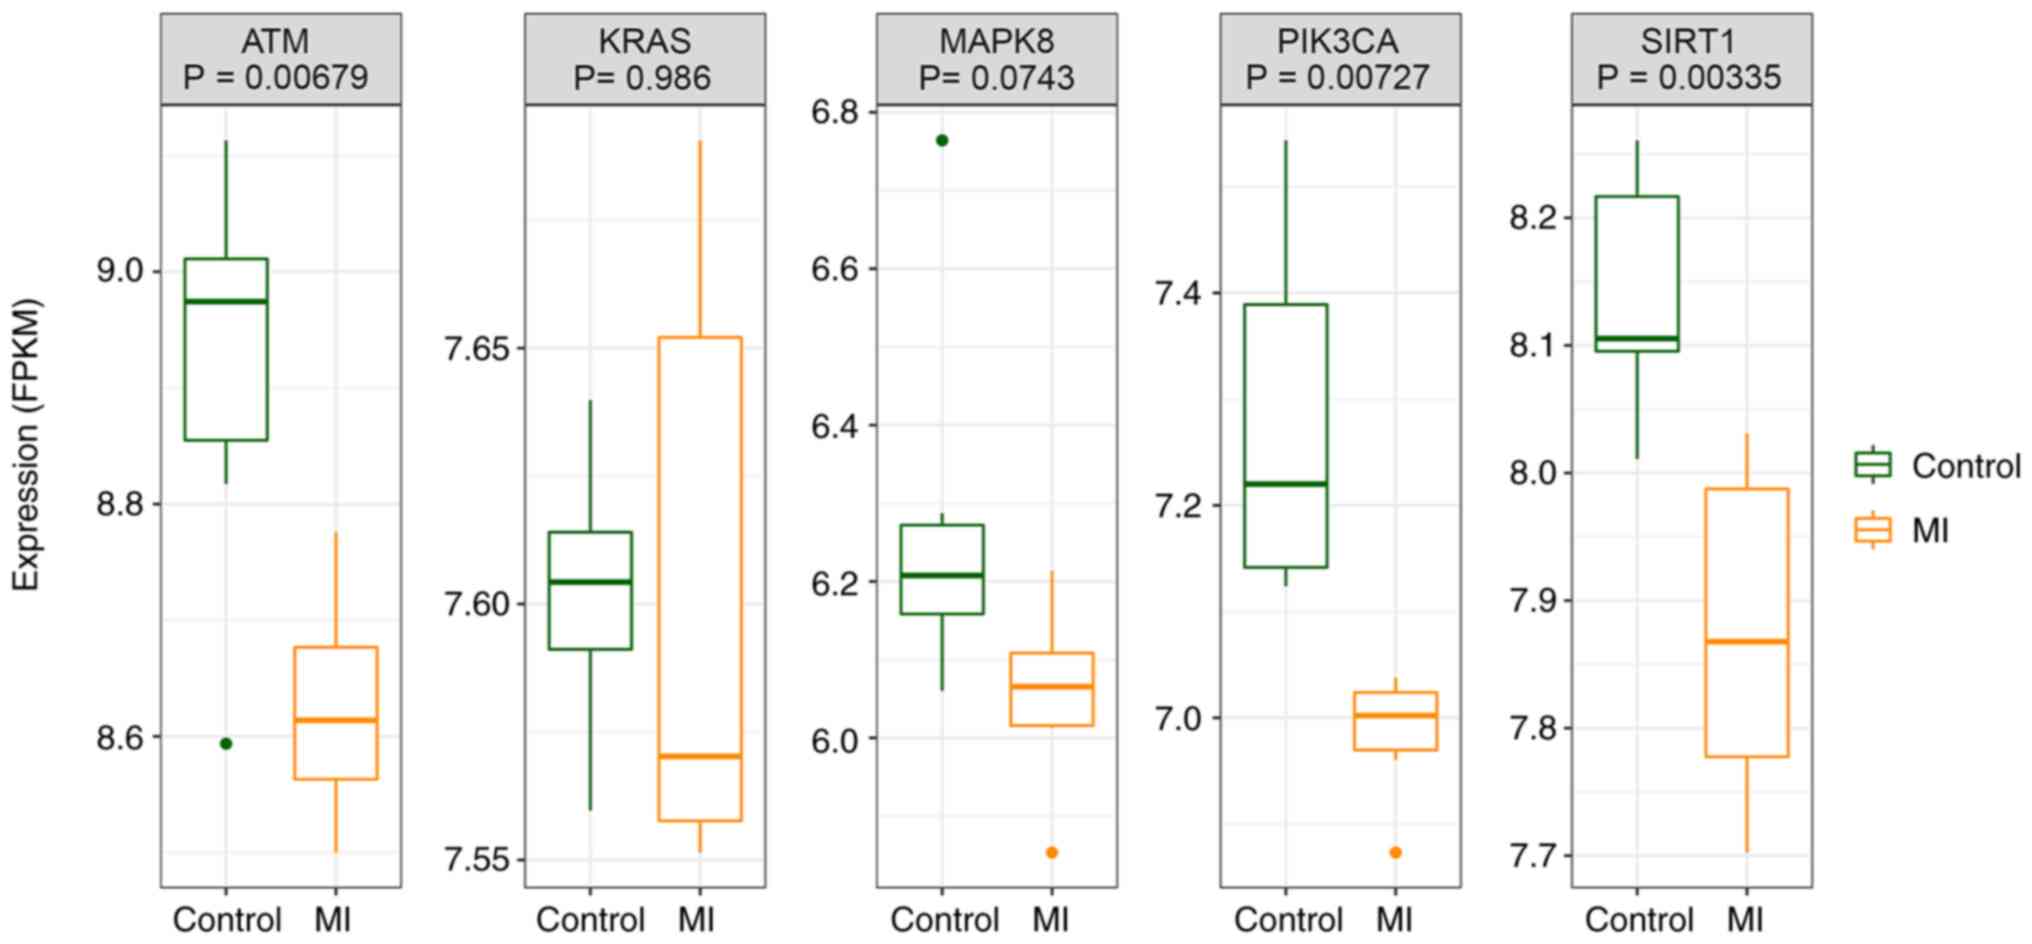
Expression of hub genes in
GSE141512
The expression of hub genes was verified in the
GSE141512 dataset, and it was found that the expression of all hub
genes was downregulated in the MI group compared with the control.
ATM, PIK3CA and SIRT1 genes showed significant differences in the
expression between the MI and control groups (Fig. 12).
Baseline characteristics of study
subjects
In patients with CCS, there is no necrosis of the
myocardium. Therefore, the CCS group was used as the normal control
group. Moreover, the basic conditions between the MI and CCS
groups, such as age, past medical history and medication history,
were similar. A total of 10 participants were recruited in the
present study and were separated into two groups, MI (n=5) and
controls (n=5). Comparison between groups showed that the levels of
high-sensitivity cTnI, creatine kinase-MB and low-density
lipoprotein-cholesterol were statistically different between the
two groups (P<0.05). The demographic, clinical features,
medication history and laboratory data of all participants are
shown in Table II.
| Table IIDemographics, clinical features,
medication history and laboratory data of all participants. |
Table II
Demographics, clinical features,
medication history and laboratory data of all participants.
| Variable | Control (n=5) | MI (n=5) | P-value |
|---|
| Demographic
features | | | |
|
Age,
yearsa | 59.20±10.66 | 58.00±10.32 | 0.861 |
|
Male
sexc | 3 (60.00) | 4 (80.00) | >0.999 |
| Cardiovascular risk
factors | | | |
|
Hypertensionc | 2 (40.00) | 3 (60.00) | >0.999 |
|
Dyslipidemiac | 2 (40.00) | 4 (80.00) | 0.524 |
|
Diabetes
mellitusc | 2 (40.00) | 3 (60.00) | >0.999 |
|
Current
smokingc | 3 (60.00) | 4 (80.00) | >0.999 |
| Vital signs on
admission | | | |
|
SBP,
mmHgb | 131.00
(129.00-134.00) | 134.00
(131.00-152.00) | 0.293 |
|
DBP,
mmHga | 78.60±11.39 | 85.60±16.04 | 0.449 |
|
Heart rate,
beats/mina | 80.40±20.03 | 76.80±13.77 | 0.749 |
| Echocardiographic
findings | | | |
|
LVEF,
%a | 57.40±6.35 | 46.80±8.64 | 0.058 |
| Laboratory
findings | | | |
|
hs-cTnI,
ng/mlb | 0.08
(0.05-0.10) | 30.00
(24.50-30.00) | 0.011 |
|
CKMB,
U/la | 2.48±0.88 | 11.66±3.48 | 0.003 |
|
NT-pro-BNP,
pg/mlb | 101.00
(86.00-201.00) | 1,106.0
(151.00-3,245.00) | 0.296 |
|
TC,
mmol/la | 3.86±0.70 | 4.67±0.87 | 0.142 |
|
TG,
mmol/la | 1.15±0.11 | 1.04±0.34 | 0.517 |
|
LDL-C,
mmol/la | 2.39±0.44 | 3.41±0.79 | 0.036 |
|
HDL-C,
mmol/la | 0.95±0.06 | 0.96±0.09 | 0.869 |
| Medication
history | | | |
|
Aspirinc | 1 (20.00) | 2 (40.00) | >0.999 |
|
Clopidogrelc | 1 (20.00) | 1 (20.00) | >0.999 |
|
Statinc | 1 (20.00) | 3 (60.00) | 0.524 |
|
ACEI/ARBc | 2 (40.00) | 2 (40.00) | >0.999 |
|
β
blockerc | 2 (40.00) | 2 (40.00) | >0.999 |
|
CCBc | 1 (20.00) | 2 (40.00) | >0.999 |
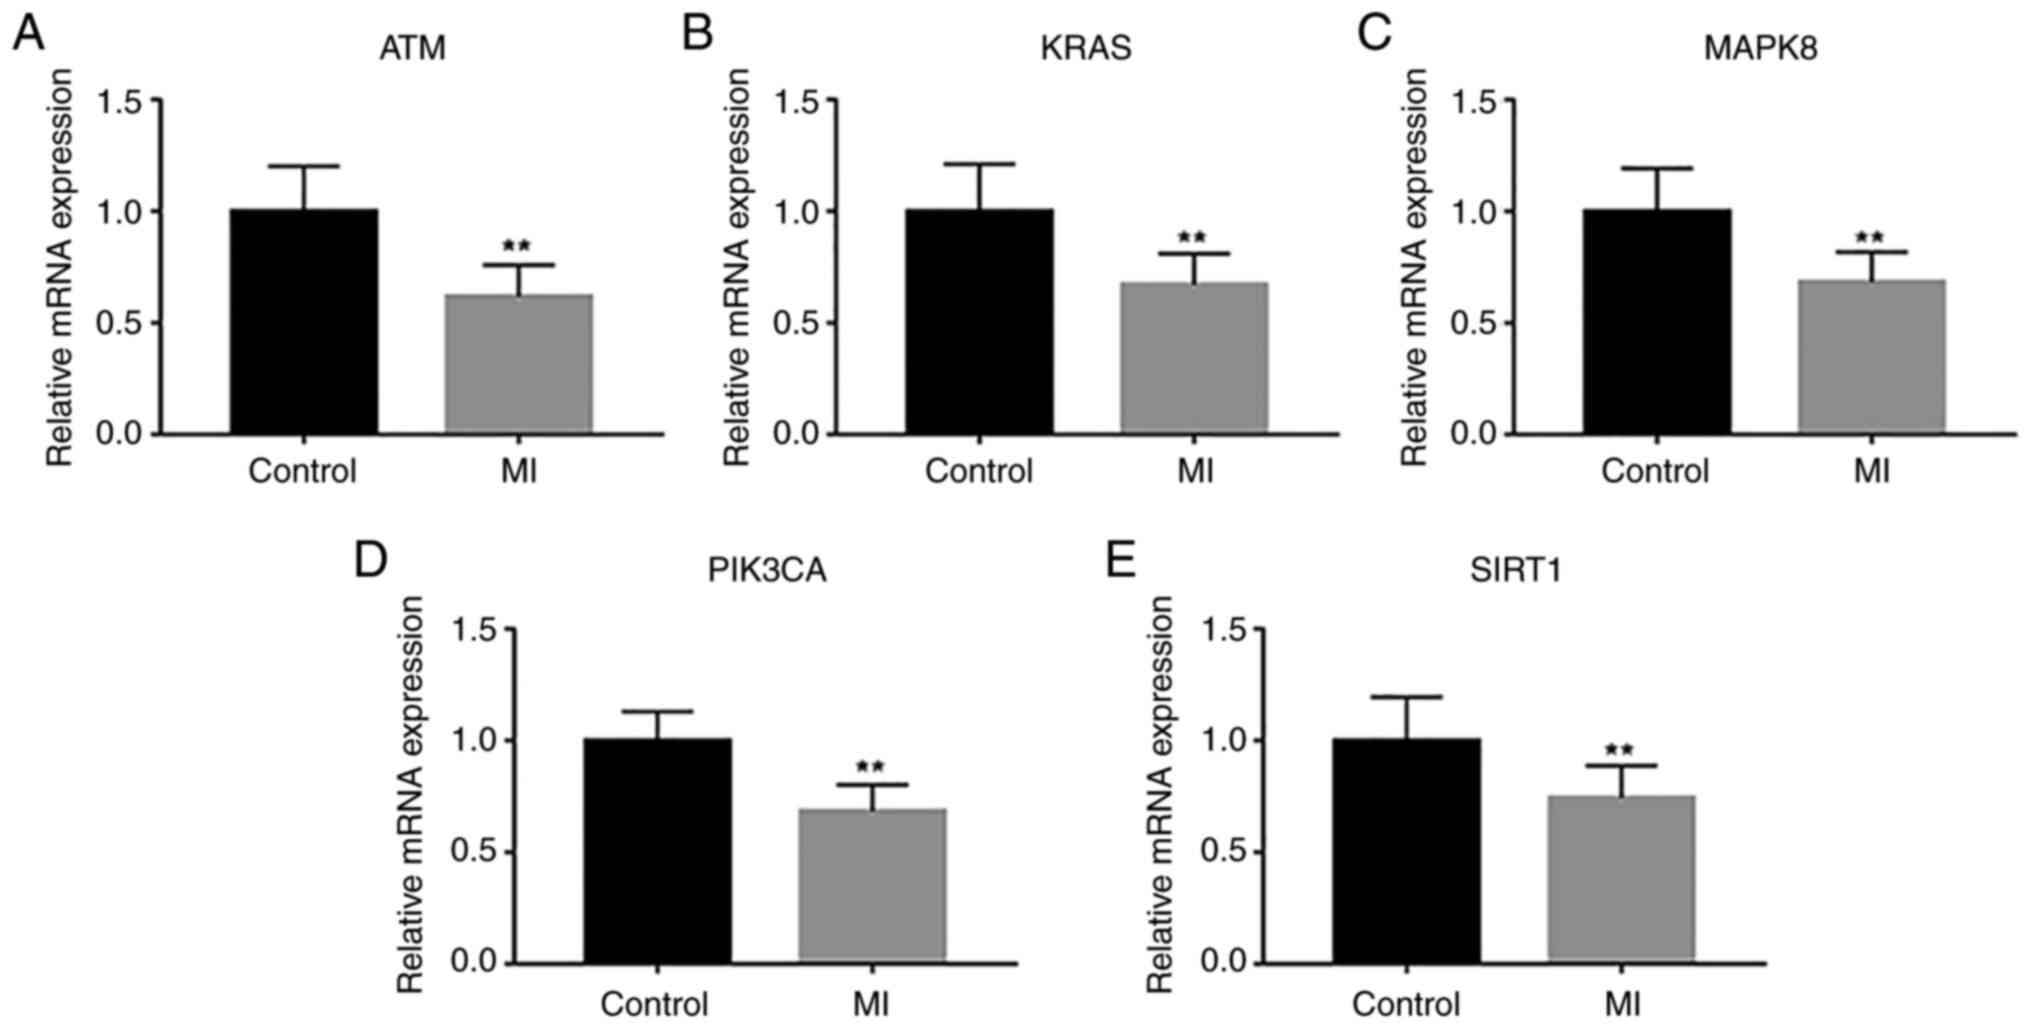
Validation of the hub genes
RT-qPCR was used to detect the transcriptional
changes of all overlapped hub genes in peripheral blood from the
controls and patients with MI. The results indicated that the
expression levels of all hub genes were decreased in the MI group
in comparison with those in controls (Fig. 13).
Discussion
In the current study, five hub genes associated with
ferroptosis in patients with MI were screened by comprehensive
bioinformatics analysis, namely ATM, KRAS, MAPK8, PI3KCA and SIRT1.
miRNAs and transcription factors targeting the hub genes were
selected to construct the corresponding regulatory network, as well
as potential therapeutic drugs for MI targeting of the hub genes.
Subsequently, using the GSE141512 validation set, the five hub
genes were all confirmed as lowly-expressed genes in the MI group.
Of these, the inter-group differences of ATM, PI3KCA and SIRT1 were
statistically significant. Finally, it was verified that gene
expression was decreased in patients with MI and CCS.
GSEA enrichment analysis was also performed for the
10,286 identified DEGs. The intersection of DEGs and
ferroptosis-related genes revealed 128 ferroptosis-related DEGs.
Intersecting with the candidate genes for MI screened using WGCNA,
20 ferroptosis-related genes were identified. Next, the 20 genes
were subjected to GO and KEGG enrichment analysis. GO analysis
revealed that ‘cellular response to chemical stress’ and ‘response
to oxidative stress’ were the most significant BPs, while the 20
most influential genes had roles in ‘peptidyl-serine’ modification,
‘protein serine/threonine kinase activity’ and ‘regulation of TOR
signaling’. KEGG analysis indicated that these genes were mainly
enriched in ‘FoxO signaling pathway’, ‘Autophagy-animal’,
‘Apoptosis’ and ‘Longevity regulating pathway-multiple species’.
Furthermore, the recent study has shown that the sources of
cellular stress damage can be divided into physicochemical (for
example, radiation or toxins) and pathological (for example,
hypoxia and infection) (43). Cell
stress can cause rapid ROS accumulation, which further aggravates
myocardial injury (44). ROS is
involved in a variety of coronary diseases that occur under
oxidative stress (45). It can
affect DNA integrity by inducing mutations, modify protein
structure by acting on enzymes and cause lipid peroxidation
(46,47). lipid peroxidation is involved in
apoptosis, autophagy and ferroptosis, which results in
cardiomyocyte dysfunction and death. The underlying mechanism
involves excessive ROS attacking the biofilm, which induces a lipid
peroxidation chain reaction, and subsequently causes various types
of cell death (48). To the best
of our knowledge, there are no reports on the FoxO signaling
pathway and ferroptosis, and most reports on mammalian target of
rapamycin (mTOR) signaling and ferroptosis have focused on tumors.
The mTOR and GPX4 signaling pathways mutually regulate
autophagy-dependent ferroptosis of pancreatic cancer cells
(49). Baba et al (50) demonstrated a protective effect of
rapamycin-targeted therapy on iron excess and ferroptosis of
cardiomyocytes using mTOR-knockout mice and found that it inhibited
ROS production. In summary, previous studies on the biological
processes that were identified in MI indicate that the 20 key
ferroptosis-related genes identified in the present study may
affect the occurrence of ferroptosis by regulating ROS production
and ultimately MI (51-53).
To further explore the key genes affecting MI, the
core modules were screened by PPI network analysis and five hub
genes associated with ferroptosis were obtained, namely ATM,
PIK3CA, SIRT1, KRAS and MAPK8. Low expression of ATM, PI3KCA and
SIRT1 was observed in the GSE141512 validation set. In addition,
low expression of the five genes was also observed in serum samples
collected from patients with MI compared with the CCS (control)
group. Reduced expression of ATM may protect cells from ferroptosis
induced by the GPX4 inhibitor at different concentrations. With
respect to the underlying mechanism, ATM inhibition may rescue
ferroptosis by increasing the expression of iron regulators
involved in iron storage and export. The coordinated changes of
these iron regulators during ATM inhibition results in the
reduction of labile iron to prevent iron-dependent ferroptosis
(54,55). ATM is an important kinase in
response to DNA damage and one of its downstream targets, p53, is
associated with the regulation of ferroptosis (56). PIK3CA plays an important role in
cell growth and survival, and it reduces the inflammatory response
following MI through pyruvate dehydrogenase kinase 1/AKT signal
transduction (57). The PIK3CA
gene regulated by miR-375 is a key gene involved in the MI disease
module (58). The expression of
SIRT1 decreases gradually after MI and it inhibits
ferroptosis-induced cardiomyocyte death through the p53/SLC7A11
axis. The increase in SIRT1 contributes to enhanced cardiomyocyte
viability and reduced ferroptosis-induced cell death in
vitro (13). MAPK8 has been
shown to play an important role in the occurrence of recurrent
cardiovascular events (59). There
are numerous reports on the KRAS gene and tumor-associated diseases
(60-62),
suggesting that KRAS promotes tumor progression; however, there are
few reports on the role of the KRAS gene in MI. Cells undergoing
ferroptosis release KRAS (63),
but the relationship of MI with the KRAS gene requires further
study.
ROC curve analysis can be used to evaluate MI
biomarkers. The AUC for ATM, PIK3CA and MAPK8 were all >0.7. Of
these, ATM presented the best discrimination performance, with an
AUC of 0.790. TF-target and miRNA-target networks relevant to the
hub genes were constructed, which highlighted 43 miRNAs and 34 TFs.
Finally, the potential small-molecule drugs that could reverse this
disease were investigated using the CMap database, which revealed
36 potential small-molecule drugs. Among them, dorsomorphin is a
small-molecule drug that can act on all five hub genes.
Dorsomorphin is a selective inhibitor of AMP-activated protein
kinase (64), which has not been
well-studied in MI. Therefore, its role should be the subject of
future studies.
The present study had the following strengths: i)
The GSE59867 dataset included data from 390 MI samples and 46
healthy individuals, with a large sample size and high reliability
of results; ii) verification was done twice using the GSE141512
dataset and by collecting and evaluating patient blood samples; and
iii) for the first time, bioinformatics analysis was used to
identify the hub genes of ferroptosis and MI. However, the
identified marker genes and pathways require further verification
to provide conclusive evidence for targeted therapy; if the protein
expression of these genes can be further analyzed, more evidence
will be available to determine the effect of each gene on
ferroptosis and MI.
In conclusion, the current study identified five
putative genes relevant to ferroptosis and numerous genes
associated with MI, which provides a basis for exploring the
regulatory and intervening mechanisms of MI.
Acknowledgements
Not applicable.
Funding
Funding: Funding for the present study was obtained from the
Shandong Province Famous and Old Traditional Chinese Medicine
Expert Inheritance Studio Construction Project (grant no. 201992),
the Shandong Traditional Chinese Medicine Science and Technology
Project (grant nos. 2020Q010 and 2021M180) and the Natural Science
Foundation of Shandong Province (grant no. ZR2021LZY038).
Availability of data and materials
The datasets used and/or analyzed during the current
study are available from the corresponding author on reasonable
request.
Authors' contributions
YHJ, WZW and YTX confirm the authenticity of all the
raw data. YHJ, WZW and YTX were responsible for the
conceptualization, methodology and design of the research, as well
as writing and preparing the original draft. SYW and ZW were
responsible for the bioinformatic data collection and analysis. JZ,
YL, LZ and CL were responsible for the experimental data
acquisition and analysis. JZ and YL were responsible for the
software validation and result interpretation. CL was responsible
for the figure preparation. All authors have read and approved the
final manuscript.
Ethics approval and consent to
participate
The present study was approved by the Ethics
Committee of Dezhou Municipal Hospital (Dezhou, China; approval no.
2022-L-06; January 17, 2022) and complied with The Declaration of
Helsinki. Written informed consent was obtained from all
subjects.
Patient consent for publication
Not applicable.
Competing interests
The authors declare that they have no competing
interests.
References
|
1
|
Camacho X, Nedkoff L, Wright FL, Nghiem N,
Buajitti E, Goldacre R, Rosella LC, Seminog O, Tan EJ, Hayes A, et
al: Relative contribution of trends in myocardial infarction event
rates and case fatality to declines in mortality: An international
comparative study of 1·95 million events in 80·4 million people in
four countries. Lancet Public Health. 7:e229–e239. 2022.PubMed/NCBI View Article : Google Scholar
|
|
2
|
Thygesen K, Alpert JS, Jaffe AS, Simoons
ML, Chaitman BR, White HD, Thygesen K, Alpert JS, White HD, Jaffe
AS, et al: Third universal definition of myocardial infarction. J
Am Coll Cardiol. 60:1581–1598. 2012.PubMed/NCBI View Article : Google Scholar
|
|
3
|
Thygesen K, Alpert JS, Jaffe AS, Chaitman
BR, Bax JJ, Morrow DA and White HD: Fourth universal definition of
myocardial infarction (2018). J Am Coll Cardiol. 72:2231–2264.
2018.PubMed/NCBI View Article : Google Scholar
|
|
4
|
Collet JP, Thiele H, Barbato E, Barthélémy
O, Bauersachs J, Bhatt DL, Dendale P, Dorobantu M, Edvardsen T,
Folliguet T, et al: 2020 ESC guidelines for the management of acute
coronary syndromes in patients presenting without persistent
ST-segment elevation. Eur Heart J. 42:1289–1367. 2021.PubMed/NCBI View Article : Google Scholar
|
|
5
|
Ibanez B, James S, Agewall S, Antunes MJ,
Bucciarelli-Ducci C, Bueno H, Caforio A, Crea F, Goudevenos JA,
Halvorsen S, et al: 2017 ESC guidelines for the management of acute
myocardial infarction in patients presenting with ST-segment
elevation: The task force for the management of acute myocardial
infarction in patients presenting with ST-segment elevation of the
European society of cardiology (ESC). Eur Heart J. 39:119–177.
2018.PubMed/NCBI View Article : Google Scholar
|
|
6
|
Spione F, Arevalos V, Gabani R, Sabaté M
and Brugaletta S: Coronary microvascular angina: A state-of-the-art
review. Front Cardiovasc Med. 9(800918)2022.PubMed/NCBI View Article : Google Scholar
|
|
7
|
Jiang X, Stockwell BR and Conrad M:
Ferroptosis: Mechanisms, biology and role in disease. Nat Rev Mol
Cell Biol. 22:266–282. 2021.PubMed/NCBI View Article : Google Scholar
|
|
8
|
Wang J, Liu Y, Wang Y and Sun L: The
cross-link between ferroptosis and kidney diseases. Oxid Med Cell
Longev. 2021(6654887)2021.PubMed/NCBI View Article : Google Scholar
|
|
9
|
Chen C, Wang D, Yu Y, Zhao T, Min N, Wu Y,
Kang L, Zhao Y, Du L, Zhang M, et al: Legumain promotes tubular
ferroptosis by facilitating chaperone-mediated autophagy of GPX4 in
AKI. Cell Death Dis. 12(65)2021.PubMed/NCBI View Article : Google Scholar
|
|
10
|
Zhao L, Zhou X, Xie F and Zhang L, Yan H,
Huang J, Zhang C, Zhou F, Chen J and Zhang L: Ferroptosis in cancer
and cancer immunotherapy. Cancer Commun (Lond). 42:88–116.
2022.PubMed/NCBI View Article : Google Scholar
|
|
11
|
Wu X, Li Y, Zhang S and Zhou X:
Ferroptosis as a novel therapeutic target for cardiovascular
disease. Theranostics. 11:3052–3059. 2021.PubMed/NCBI View Article : Google Scholar
|
|
12
|
Li W, Li W, Leng Y, Xiong Y and Xia Z:
Ferroptosis is involved in diabetes myocardial ischemia/reperfusion
injury through endoplasmic reticulum stress. DNA Cell Biol.
39:210–225. 2020.PubMed/NCBI View Article : Google Scholar
|
|
13
|
Ma S, Sun L, Wu W, Wu J, Sun Z and Ren J:
USP22 protects against myocardial ischemia-reperfusion injury via
the SIRT1-p53/SLC7A11-dependent inhibition of ferroptosis-induced
cardiomyocyte death. Front Physiol. 11(551318)2020.PubMed/NCBI View Article : Google Scholar
|
|
14
|
Jelinek A, Heyder L, Daude M, Plessner M,
Krippner S, Grosse R, Diederich WE and Culmsee C: Mitochondrial
rescue prevents glutathione peroxidase-dependent ferroptosis. Free
Radic Biol Med. 117:45–57. 2018.PubMed/NCBI View Article : Google Scholar
|
|
15
|
Chen HY, Xiao ZZ, Ling X, Xu RN, Zhu P and
Zheng SY: ELAVL1 is transcriptionally activated by FOXC1 and
promotes ferroptosis in myocardial ischemia/reperfusion injury by
regulating autophagy. Mol Med. 27(14)2021.PubMed/NCBI View Article : Google Scholar
|
|
16
|
Fang X, Wang H, Han D, Xie E, Yang X, Wei
J, Gu S, Gao F, Zhu N, Yin X, et al: Ferroptosis as a target for
protection against cardiomyopathy. Proc Natl Acad Sci USA.
116:2672–2680. 2019.PubMed/NCBI View Article : Google Scholar
|
|
17
|
Fan Z, Cai L, Wang S, Wang J and Chen B:
Baicalin prevents myocardial ischemia/reperfusion injury through
inhibiting ACSL4 mediated ferroptosis. Front Pharmacol.
12(628988)2021.PubMed/NCBI View Article : Google Scholar
|
|
18
|
Eling N, Reuter L, Hazin J, Hamacher-Brady
A and Brady NR: Identification of artesunate as a specific
activator of ferroptosis in pancreatic cancer cells. Oncoscience.
2:517–532. 2015.PubMed/NCBI View Article : Google Scholar
|
|
19
|
Linkermann A, Skouta R, Himmerkus N, Mulay
SR, Dewitz C, De Zen F, Prokai A, Zuchtriegel G, Krombach F, Welz
PS, et al: Synchronized renal tubular cell death involves
ferroptosis. Proc Natl Acad Sci U S A. 111:16836–16841.
2014.PubMed/NCBI View Article : Google Scholar
|
|
20
|
Maciejak A, Kiliszek M, Michalak M, Tulacz
D, Opolski G, Matlak K, Dobrzycki S, Segiet A, Gora M and Burzynska
B: Gene expression profiling reveals potential prognostic
biomarkers associated with the progression of heart failure. Genome
Med. 7(26)2015.PubMed/NCBI View Article : Google Scholar
|
|
21
|
Osmak G, Baulina N, Koshkin P and Favorova
O: Collapsing the list of myocardial infarction-related
differentially expressed genes into a diagnostic signature. J
Transl Med. 18(231)2020.PubMed/NCBI View Article : Google Scholar
|
|
22
|
Barrett T, Wilhite SE, Ledoux P,
Evangelista C, Kim IF, Tomashevsky M, Marshall KA, Phillippy KH,
Sherman PM, Holko M, et al: NCBI GEO: Archive for functional
genomics data sets-update. Nucleic Acids Res. 41:D991–D995.
2013.PubMed/NCBI View Article : Google Scholar
|
|
23
|
Tian Q, Zhou Y, Zhu L, Gao H and Yang J:
Development and validation of a ferroptosis-related gene signature
for overall survival prediction in lung adenocarcinoma. Front Cell
Dev Biol. 9(684259)2021.PubMed/NCBI View Article : Google Scholar
|
|
24
|
Chan B: Data analysis using R programming.
Adv Exp Med Biol. 1082:47–122. 2018.PubMed/NCBI View Article : Google Scholar
|
|
25
|
Love MI, Huber W and Anders S: Moderated
estimation of fold change and dispersion for RNA-seq data with
DESeq2. Genome Biol. 15(550)2014.PubMed/NCBI View Article : Google Scholar
|
|
26
|
Qian L, Xia Z, Zhang M, Han Q, Hu D, Qi S,
Xing D, Chen Y and Zhao X: Integrated bioinformatics-based
identification of potential diagnostic biomarkers associated with
diabetic foot ulcer development. J Diabetes Res.
2021(5445349)2021.PubMed/NCBI View Article : Google Scholar
|
|
27
|
Langfelder P and Horvath S: WGCNA: An R
package for weighted correlation network analysis. BMC
Bioinformatics. 9(559)2008.PubMed/NCBI View Article : Google Scholar
|
|
28
|
The Gene Ontology Consortium. Expansion of
the gene ontology knowledgebase and resources. Nucleic Acids Res.
45:D331–D338. 2017.PubMed/NCBI View Article : Google Scholar
|
|
29
|
Kanehisa M and Goto S: KEGG: Kyoto
encyclopedia of genes and genomes. Nucleic Acids Res. 28:27–30.
2000.PubMed/NCBI View Article : Google Scholar
|
|
30
|
Szklarczyk D, Franceschini A, Wyder S,
Forslund K, Heller D, Huerta-Cepas J, Simonovic M, Roth A, Santos
A, Tsafou KP, et al: STRING v10: Protein-protein interaction
networks, integrated over the tree of life. Nucleic Acids Res.
43:D447–D452. 2015.PubMed/NCBI View Article : Google Scholar
|
|
31
|
Shannon P, Markiel A, Ozier O, Baliga NS,
Wang JT, Ramage D, Amin N, Schwikowski B and Ideker T: Cytoscape: A
software environment for integrated models of biomolecular
interaction networks. Genome Res. 13:2498–2504. 2003.PubMed/NCBI View Article : Google Scholar
|
|
32
|
Robin X, Turck N, Hainard A, Tiberti N,
Lisacek F, Sanchez JC and Müller M: pROC: An open-source package
for R and S+ to analyze and compare ROC curves. BMC Bioinformatics.
12(77)2011.PubMed/NCBI View Article : Google Scholar
|
|
33
|
Zhang Y, Shen B, Zhuge L and Xie Y:
Identification of differentially expressed genes between the colon
and ileum of patients with inflammatory bowel disease by gene
co-expression analysis. J Int Med Res.
48(300060519887268)2020.PubMed/NCBI View Article : Google Scholar
|
|
34
|
Han Y, Yu G, Sarioglu H,
Caballero-Martinez A, Schlott F, Ueffing M, Haase H, Peschel C and
Krackhardt AM: Proteomic investigation of the interactome of FMNL1
in hematopoietic cells unveils a role in calcium-dependent membrane
plasticity. J Proteomics. 78:72–82. 2013.PubMed/NCBI View Article : Google Scholar
|
|
35
|
Davis AP, Grondin CJ, Johnson RJ, Sciaky
D, Wiegers J, Wiegers TC and Mattingly CJ: Comparative
toxicogenomics database (CTD): Update 2021. Nucleic Acids Res.
49:D1138–D1143. 2021.PubMed/NCBI View Article : Google Scholar
|
|
36
|
Chang L, Zhou G, Soufan O and Xia J:
miRNet 2.0: Network-based visual analytics for miRNA functional
analysis and systems biology. Nucleic Acids Res. 48:W244–W251.
2020.PubMed/NCBI View Article : Google Scholar
|
|
37
|
Diamond GA: A clinically relevant
classification of chest discomfort. J Am Coll Cardiol. 1:574–575.
1983.PubMed/NCBI View Article : Google Scholar
|
|
38
|
Montalescot G, Sechtem U, Achenbach S,
Andreotti F, Arden C, Budaj A, Bugiardini R, Crea F, Cuisset T, Di
Mario C, et al: 2013 ESC guidelines on the management of stable
coronary artery disease: The task force on the management of stable
coronary artery disease of the European society of cardiology. Eur
Heart J. 34:2949–3003. 2013.PubMed/NCBI View Article : Google Scholar
|
|
39
|
Fihn SD, Gardin JM, Abrams J, Berra K,
Blankenship JC, Dallas AP, Douglas PS, Foody JM, Gerber TC,
Hinderliter AL, et al: 2012 ACCF/AHA/ACP/AATS/PCNA/SCAI/STS
guideline for the diagnosis and management of patients with stable
ischemic heart disease: A report of the American college of
cardiology foundation/American heart association task force on
practice guidelines, and the American college of physicians,
American association for thoracic surgery, preventive
cardiovascular nurses association, society for cardiovascular
angiography and interventions, and society of thoracic surgeons.
Circulation. 126:e354–e471. 2012.PubMed/NCBI View Article : Google Scholar
|
|
40
|
Livak KJ and Schmittgen TD: Analysis of
relative gene expression data using real-time quantitative PCR and
the 2(-Delta Delta C(T)) method. Methods. 25:402–408.
2001.PubMed/NCBI View Article : Google Scholar
|
|
41
|
Lamb J, Crawford ED, Peck D, Modell JW,
Blat IC, Wrobel MJ, Lerner J, Brunet JP, Subramanian A, Ross KN, et
al: The connectivity map: Using gene-expression signatures to
connect small molecules, genes, and disease. Science.
313:1929–1935. 2006.PubMed/NCBI View Article : Google Scholar
|
|
42
|
Wen W, Wu P, Zhang Y, Chen Z, Sun J and
Chen H: Comprehensive analysis of NAFLD and the therapeutic target
identified. Front Cell Dev Biol. 9(704704)2021.PubMed/NCBI View Article : Google Scholar
|
|
43
|
Contessotto P and Pandit A: Therapies to
prevent post-infarction remodelling: From repair to regeneration.
Biomaterials. 275(120906)2021.PubMed/NCBI View Article : Google Scholar
|
|
44
|
Zhou T, Chuang CC and Zuo L: Molecular
characterization of reactive oxygen species in myocardial
ischemia-reperfusion injury. Biomed Res Int.
2015(864946)2015.PubMed/NCBI View Article : Google Scholar
|
|
45
|
Khosravi M, Poursaleh A, Ghasempour G,
Farhad S and Najafi M: The effects of oxidative stress on the
development of atherosclerosis. Biol Chem. 400:711–732.
2019.PubMed/NCBI View Article : Google Scholar
|
|
46
|
Ravingerová T, Kindernay L, Barteková M,
Ferko M, Adameová A, Zohdi V, Bernátová I, Ferenczyová K and Lazou
A: The molecular mechanisms of iron metabolism and its role in
cardiac dysfunction and cardioprotection. Int J Mol Sci.
21(7889)2020.PubMed/NCBI View Article : Google Scholar
|
|
47
|
Kura B, Bacova BS, Kalocayova B, Sykora M
and Slezak J: Oxidative stress-responsive MicroRNAs in heart
injury. Int J Mol Sci. 21(358)2020.PubMed/NCBI View Article : Google Scholar
|
|
48
|
Su LJ, Zhang JH, Gomez H, Murugan R, Hong
X, Xu D, Jiang F and Peng ZY: Reactive oxygen species-induced lipid
peroxidation in apoptosis, autophagy, and ferroptosis. Oxid Med
Cell Longev. 2019(5080843)2019.PubMed/NCBI View Article : Google Scholar
|
|
49
|
Liu Y, Wang Y, Liu J, Kang R and Tang D:
Interplay between MTOR and GPX4 signaling modulates
autophagy-dependent ferroptotic cancer cell death. Cancer Gene
Ther. 28:55–63. 2021.PubMed/NCBI View Article : Google Scholar
|
|
50
|
Baba Y, Higa JK, Shimada BK, Horiuchi KM,
Suhara T, Kobayashi M, Woo JD, Aoyagi H, Marh KS, Kitaoka H and
Matsui T: Protective effects of the mechanistic target of rapamycin
against excess iron and ferroptosis in cardiomyocytes. Am J Physiol
Heart Circ Physiol. 314:H659–H668. 2018.PubMed/NCBI View Article : Google Scholar
|
|
51
|
Shen Y, Chen X, Chi C, Wang H, Xue J, Su
D, Wang H, Li M, Liu B and Dong Q: Smooth muscle cell-specific
knockout of FBW7 exacerbates intracranial atherosclerotic stenosis.
Neurobiol Dis. 132(104584)2019.PubMed/NCBI View Article : Google Scholar
|
|
52
|
Ji Y, Luo J, Zeng J, Fang Y, Liu R, Luan F
and Zeng N: Xiaoyao pills ameliorate depression-like behaviors and
oxidative stress induced by olfactory bulbectomy in rats via the
activation of the PIK3CA-AKT1-NFE2L2/BDNF signaling pathway. Front
Pharmacol. 12(643456)2021.PubMed/NCBI View Article : Google Scholar
|
|
53
|
Park S, Shin J, Bae J, Han D, Park SR,
Shin J, Lee SK and Park HW: SIRT1 alleviates LPS-induced IL-1β
production by suppressing NLRP3 inflammasome activation and ROS
production in trophoblasts. Cells. 9(728)2020.PubMed/NCBI View Article : Google Scholar
|
|
54
|
Chen PH, Wu J, Ding CC, Lin CC, Pan S,
Bossa N, Xu Y, Yang WH, Mathey-Prevot B and Chi JT: Kinome screen
of ferroptosis reveals a novel role of ATM in regulating iron
metabolism. Cell Death Differ. 27:1008–1022. 2020.PubMed/NCBI View Article : Google Scholar
|
|
55
|
Shimada K, Skouta R, Kaplan A, Yang WS,
Hayano M, Dixon SJ, Brown LM, Valenzuela CA, Wolpaw AJ and
Stockwell BR: Global survey of cell death mechanisms reveals
metabolic regulation of ferroptosis. Nat Chem Biol. 12:497–503.
2016.PubMed/NCBI View Article : Google Scholar
|
|
56
|
Smith J, Tho LM, Xu N and Gillespie DA:
The ATM-Chk2 and ATR-Chk1 pathways in DNA damage signaling and
cancer. Adv Cancer Res. 108:73–112. 2010.PubMed/NCBI View Article : Google Scholar
|
|
57
|
Garikipati V, Verma SK, Jolardarashi D,
Cheng Z, Ibetti J, Cimini M, Tang Y, Khan M, Yue Y, Benedict C, et
al: Therapeutic inhibition of miR-375 attenuates post-myocardial
infarction inflammatory response and left ventricular dysfunction
via PDK-1-AKT signalling axis. Cardiovasc Res. 113:938–949.
2017.PubMed/NCBI View Article : Google Scholar
|
|
58
|
Baulina N, Osmak G, Kiselev I, Matveeva N,
Kukava N, Shakhnovich R, Kulakova O and Favorova O: NGS-identified
circulating miR-375 as a potential regulating component of
myocardial infarction associated network. J Mol Cell Cardiol.
121:173–179. 2018.PubMed/NCBI View Article : Google Scholar
|
|
59
|
Liao J, Chen Z, He Q, Liu Y and Wang J:
Differential gene expression analysis and network construction of
recurrent cardiovascular events. Mol Med Rep. 13:1746–1764.
2016.PubMed/NCBI View Article : Google Scholar
|
|
60
|
Tang D, Kroemer G and Kang R: Oncogenic
KRAS blockade therapy: Renewed enthusiasm and persistent
challenges. Mol Cancer. 20(128)2021.PubMed/NCBI View Article : Google Scholar
|
|
61
|
Wang X, Wang J, Chen F, Zhong Z and Qi L:
Detection of K-ras gene mutations in feces by magnetic nanoprobe in
patients with pancreatic cancer: A preliminary study. Exp Ther Med.
15:527–531. 2018.PubMed/NCBI View Article : Google Scholar
|
|
62
|
Huang L, Guo Z, Wang F and Fu L: KRAS
mutation: From undruggable to druggable in cancer. Signal Transduct
Target Ther. 6(386)2021.PubMed/NCBI View Article : Google Scholar
|
|
63
|
Dai E, Han L, Liu J, Xie Y, Kroemer G,
Klionsky DJ, Zeh HJ, Kang R, Wang J and Tang D: Autophagy-dependent
ferroptosis drives tumor-associated macrophage polarization via
release and uptake of oncogenic KRAS protein. Autophagy.
16:2069–2083. 2020.PubMed/NCBI View Article : Google Scholar
|
|
64
|
Jaschke N, Kleymann A, Hofbauer LC, Göbel
A and Rachner TD: Dorsomorphin: A novel inhibitor of Dickkopf-1 in
breast cancer. Biochem Biophys Res Commun. 524:360–365.
2020.PubMed/NCBI View Article : Google Scholar
|