Introduction
Lung cancer is the most prevalent and lethal
malignancy in the world, with lung adenocarcinoma (LUAD) being the
predominant pathological subtype (1). Despite significant advances in early
diagnostic and therapeutic approaches, the 5-year overall survival
(OS) rate remains <20% (2).
Platinum-based chemotherapy is currently the most important
adjuvant therapy for patients with advanced lung cancer (3). However, adverse reactions and drug
resistance limit the ultimate efficacy of chemotherapy (4). Therefore, novel strategies are in
demand to supplement conventional therapeutic strategies (5). Over the past decade, knowledge on the
molecular features of cancer has been steadily accumulating thanks
to advances in genomic technology (6). Consequently, the preferred treatment
strategy for advanced non-small cell lung cancer is shifting from
traditional histopathology-based chemotherapy to individualized and
precise treatment regimens based on oncogenic factors (7). Although the biomarkers and
therapeutic targets previously identified have contributed to the
diagnosis and treatment of LUAD, a demand remains for novel genetic
data for optimizing treatment protocols due to its biological
complexity and poor prognosis (8).
To explore common biomarkers associated with cancer that can be
used for treatment, diagnosis and assessment of prognosis, large
quantities of cancer microarray and high-throughput sequence data
has been reported and become available over recent years (8,9). In
addition, to overcome the limitations caused by small sample sizes,
differential platform data and standards, bioinformatics are
becoming increasingly popular in the field of cancer biology, which
have yielded valuable information (8).
Cyclins are a class of proteins that control cell
cycle progression by activating CDK enzymes (10). The cyclin gene family is comprised
of 31 members according to the HUGO Gene Nomenclature Committee
(https://www.genenames.org/data/genegroup/#!/group/473).
Through bioinformatics technology, it was found that certain genes
in certain cyclin families are significantly overexpressed in LUAD,
but there is a lack of further experiments to verify their
expression and specific molecular mechanisms (11). Although numerous studies have
previously reported that cyclins serve important roles in the
development of a variety of tumors (12,13),
the specific genes in the cyclin family that are associated with
the development of LUAD remain largely unexplored.
Based on the RNA microarray data of GSE33532,
GSE40791 and GSE19188, the present study used bioinformatics
methods to search for differentially expressed genes (DEGs) between
LUAD and adjacent normal lung tissue. A protein-protein interaction
(PPI) network was then established to screen for key genes enriched
in the cyclin gene family. Online databases were implemented to
validate the expression, PPI and clinical relevance of the hub
genes. The purpose of the present study was to search for genes in
the cyclin family that are associated with LUAD in addition to
their potential upstream regulators. It is anticipated that this
information could reveal potential targets for subsequent
experimental validation.
Materials and methods
Microarray data source
In the present study, the microarray datasets were
searched and downloaded from Gene Expression Omnibus (GEO) using
the following criteria: i) Choose Affymetrix array under GPL570
platform; ii) the tissue source was from human LUAD samples and
adjacent normal samples; and iii) study containing ≥20 LUAD and 20
normal samples. Finally, three datasets based on the GPL570
platform were selected, namely GSE19188, GSE33532 and GSE40791.
Specifically, GSE19188 included 40 LUAD samples and 65 adjacent
normal lung tissue samples (14),
whereas GSE33532 included 40 LUAD samples and 20 adjacent normal
lung tissue samples (15).
GSE40791 included 94 LUAD samples and 100 adjacent normal lung
tissue samples (16).
Microarray data analysis
The gene expression matrix and associated annotation
files of the three aforementioned datasets were downloaded from the
GEO database before the probe matrix in the expression profiling
following the array was converted into a gene matrix through ‘affy’
package of R software (17). Under
the R environment (version 4.0.3; https://www.r-project.org/), using the ‘affy’ package
(17), the raw gene expression
matrix was background corrected and normalized and the ‘limma’
package (18) was used to screen
out the DEGs between the LUAD and normal samples |log2
fold change|>1 and P<0.05 were applied as the threshold for
this screen.
Screening DEGs using robust rank
aggregation (RRA) analysis
The RRA method is a tool that can be used for
integrating data from multiple microarray studies with minimal
inconsistencies to robustly identify DEGs (19,20).
First, a list of the upregulated DEGs and downregulated DEGs by
fold change in expression between the LUAD and normal samples was
obtained from each dataset. Using the ‘RRA’ package (19), all lists of ranked genes from each
dataset were integrated. Genes with an adjusted score <0.05 were
significant DEGs.
Gene ontology (GO) and Kyoto
encyclopedia of genes and genomes (KEGG) enrichment analysis
Enrichment analysis of GO and KEGG has been
extensively utilized for deciphering microarray data to further
understanding into the biological functions of each gene (21). In the present study, the
‘ClusterProfiler’ package (22)
was used to analyze the GO and KEGG enrichment of the DEGs under
the R environment (version 4.0.3).
PPI network establishment and module
identification
Using the Search Tool for the Retrieval of
Interacting Genes/Proteins (STRING; https://cn.string-db.org/, version 11.5) (23), a PPI network of DEGs was
constructed to predict interactions among the proteins. A
comprehensive score threshold ≥0.4 was considered to indicate a
statistically significant interaction. In addition, the Cytoscape
software (version 6.3; http://www.cytoscape.org/) (24) was used to further analyze and
visualize the PPI network. Within Cytoscape, the ‘NetworkAnalyzer’
plugin was used to analyze the PPI network, whereas the ‘MCODE’
plugin was used to screen the functional module (25,26).
The parameters set for screening the function module were as
follows: MCODE score >5; degree cut-off=2; node score
cut-off=0.2; Max depth=100; and k-score=2.
Screening for hub genes through
co-expression and external databases
The enriched gene family was selected according to
the gene module screened by Cytoscape. An expression correlation
matrix was then made for the family genes in the three datasets,
before genes with high positive correlation (R>0.6; P<0.05)
were selected to be key genes according to Pearson's methods.
Subsequently, three datasets (GSE33532, GSE40791 and
GSE19188) and the Gene Set Cancer Analysis (GSCA; http://bioinfo.life.hust.edu.cn/GSCA/#/)
database were utilized to verify the expression of the key genes.
The Gene Expression Profiling Interactive Analysis (GEPIA;
http://gepia.cancer-pku.cn/index.html) database was
used to assess the correlation in the expression of key genes,
which genes that sufficiently correlate with each other (R>0.7;
P<0.001) were selected as hub genes (27). The BioCarta (https://maayanlab.cloud/Harmonizome/) database was
used to screen for the commonly predicted upstream transcription
factors of the hub genes (28).
Key genes in the cyclin family and their predicted upstream
transcription factors were the ultimate hub genes of the present
study.
Identifying and analyzing the hub
genes
In the present study, the UALCAN database
(http://ualcan.path.uab.edu/) (29) was used to compare the expression of
hub genes in LUAD samples and normal samples, in addition to
assessing the association between the expression of hub genes and
tumor stage and prognosis of patients with LUAD. In addition, the
GEPIA database was used for the OS analysis of hub genes to explore
their prognostic values (27).
Cells and cell culture
The LUAD cell line Beas-2B was cultured in
high-glucose DMEM medium (cat. no. 23-10-013-CV; Corning, Inc.),
the LUAD cell line A549 was cultured in high-glucose F12K medium
(cat. no. 21127022; Thermo Fisher Scientific, Inc.), and the human
bronchial epithelial cell line 16-HBE and LUAD cell line H1299 cell
line were cultured in high-glucose RPMI-1640 medium (cat. no.
10-040-CV; Corning, Inc.). All mediums contained 10% FBS (cat. no.
10091148; Gibco; Thermo Fisher Scientific, Inc.), 100 U/ml
penicillin and 100 µg/ml streptomycin and cells were incubated
routinely in a cell incubator containing 5% CO2 at 37˚C.
The three cell lines were purchased from FuHeng Cell Center
(https://www.fudancell.com/). Cells at
logarithmic growth phrases were used for subsequent
experiments.
Reverse transcription-quantitative PCR
(RT-qPCR)
According to the manufacturer's protocol, the
TRIzol® reagent (cat. no. 15596026; Invitrogen; Thermo
Fisher Scientific, Inc.) to isolate total RNA from the 16-HBE,
A549, Beas-2B and H1299 cells. Reverse transcription was performed
using super script first strand synthesis system cat. no. 18080051;
Invitrogen; Thermo Fisher Scientific, Inc.) with oligo (DT) 20
primer and 5.0 µg RNA to synthesize the first strand of cDNA. Using
GAPDH as the endogenous control, the primers were synthesized by
Beijing Tsingke Biotechnology Co., Ltd. Primer sequences are
provided in Table SI. Master qPCR
mix (2X TSINGKE® SYBR Green I; cat. no. 4367659;
Invitrogen; Thermo Fisher Scientific, Inc.) was used to detect
mRNAs level according to the manufacturer's protocol (initial
denaturation: 95˚C for 3 min; followed by 40 cycles of denaturation
at 95˚C for 10 sec, annealing at 55˚C for 10 sec and extension at
72˚C for 30 sec.). Application of the 2-ΔΔCq method was
used to calculate the relative expression level of mRNA (30).
Western blot analysis
The protein samples lysate for western blot were
collected from 16-HBE, Beas-2B, A549 and H1299 cell lines with RIPA
lysis buffer (cat. no. P0013B; Beyotime Institute of Biotechnology)
containing protease inhibitor cocktail. Concentrations of protein
samples were detected using the BCA Protein Assay Kit (cat. no.
A53225; Thermo Fisher Scientific, Inc.) and 20 µg protein lysate
was loaded in 10% SDS-PAGE gel respectively and transferred to PVDF
membrane (Bio-Rad Laboratories, Inc.). After blocking in 5% non-fat
milk dissolved in TBST buffer for 60 min at room temperature, the
membranes were washed 3 times by TBST containing 1% Tween 20 (cat.
no. P1379; Sigma-Aldrich; Merck KGaA) and then incubated with the
following 5% BSA-diluted (cat. no. ST2254; Beyotime Institute of
Biotechnology) primary antibodies: CCNA2 (1:1,000; cat. no.
18202-1-AP), CCNB1 (1:1,000; cat. 28603-1-AP), CCNB2 (1:1,000; cat.
no. 21644-1-AP; all from ProteinTech Group, Inc.) and ACTB
(1:10,000; cat. no. AC026; Abclonal Biotech Co., Ltd.) for 6-8 h at
4˚C; the HRP-linked secondary antibodies (1:20,000; cat. no.
SA00001-2; ProteinTech Group, Inc.) were used to probe the primary
antibodies for 1 h at room temperature. Finally, the immunoreactive
protein bands were visualized by ECL kit (cat. no. WBKLS0500;
MilliporeSigma), and the images were obtained by scanning using a
fluorescence imager (Typhoon FLA 7000; Cytiva). The quantification
of blot bands was calculated using ImageJ (Version. 1.52; National
Institutes of Health).
Immunohistochemistry of hub genes
In total, 10 pairs of LUAD and adjacent normal
tissues were collected from the Second Hospital of Shandong
University (Jinan, China) from 2021/01/01 to 2021/12/31, with
complete pathological data. The age of the patients was 61.2±6.3
years, including 4 women and 6 men. The present study was approved
[approval no. KYLL-2020(KJ)P-0099] by the Medical Ethics Committee
of the Second Hospital of Shandong University (Jinan, China).
Written informed consent was obtained from all participants. The
human LUAD specimens were formalin-fixed and paraffin-embedded for
24 h at 4˚C and cut into 4-µm thin slices. The IHC staining kit
(cat. no. PV-6000; ZSGB-BIO) was used for the experiment according
to the manufacturer's instructions. DAB (cat. no. ZLI-9017;
ZSGB-BIO) was used for staining (37˚C for 90 sec). The final
immunostaining images were obtained using a NanoZoomer Digital
Pathology scanner (NanoZoomer S60; Hamamatsu Photonics K.K.).
Protein expression was analyzed by calculating the integrated
optical density (IOD/area) of each stained region using Image-Pro
Plus version 6.0 (Media Cybernetics, Inc.).
Diagnostic model and evaluation of hub
genes
To evaluate the diagnostic efficacy of the hub genes
for LUAD, the three data sets GSE33532, GSE40791 and GSE19188 were
combined. The raw expression data were then normalized by Affy
package (17) using robust
multi-array average (RMA), before the inter-batch differences were
removed and the data were integrated into a large expression
matrix. The percentage of normal tissue in all samples was
calculated, and the cut-off value was selected according to the
percentage of normal tissue in the sample. Those whose expression
value was higher than the cut-off value were regarded as high
expression samples, and those whose expression value was lower than
the cut-off value were regarded as low expression samples. The
expression of samples was converted from numerical variables to
factor variables for subsequent analysis. This integrated
expression matrix was used as the training set. To verify the
diagnostic efficacy, two external datasets were also selected,
namely GSE10072(31) and
GSE75037(32) for external data
validation. GSE10072 belongs to the same GPL570 platform as the
three datasets used for the training set. The raw data of GSE10072
were analyzed after RMA normalization. By contrast, the GSE75037
dataset belongs to the GPL6884 platform. To verify the
applicability of the data from other platforms, the matrix
expression data from this dataset were chosen for analysis. The
training set contains 179 LUAD samples and 185 normal tissue
samples in total. The external validation set GSE10072 contains 58
LUAD samples and 49 normal tissue samples. The external validation
set GSE75037 contains 83 LUAD samples and 83 normal tissue
samples.
MASS package (33)
and glm function (34) were used
for forward stepwise logistic regression analysis of hub gene, and
the appropriate genes were selected and included into the effect
variables. Then glm function was used to conduct logistic
regression analysis on the key genes included in the effect
variables. Finally, rms package (35) was used to construct nomograph of
regression analysis results.
A ROC curve for this model was constructed using the
‘pROC package’ (36). ROC curves
were generated for the training set and two validation sets to
distinguish patients with LUAD from healthy individuals. Area under
the ROC curve (AUC) and confidence intervals were calculated to
assess the predictive values of the selected hub genes for LUAD
diagnosis. Finally, the diagnostic efficacy of the nomograms was
evaluated further and validated using calibration plots and
decision curve analysis (DCA) plots through rms package (35).
Statistical analysis
Statistical comparisons were performed using SPSS
25.0 (IBM Corp.). The Pearson correlation coefficient between
cyclin family genes was calculated using R (https://www.R-project.org/). In the GEPIA database,
Pearson's method was used to analyze the expression correlation
between hub genes in TCGA datasets. GEPIA used the Kaplan-Meier
method to estimate the OS associated with gene expression levels.
GEPIA uses the Mantel-Cox test for hypothesis testing. The cox
proportional hazard ratio and the 95% confidence interval
information are shown in the survival plot. One-way ANOVA was used
to analyze whether the results of western blotting and RT-qPCR were
statistically different. In the multiple comparisons post hoc test,
Dunnett's test was used to compare the non-small cell lung cancer
cell lines A549, Beas-2B and H1299 with the control cell line
16-HBE, respectively. In the results of immunohistochemical study,
paired t-test was used to analyze whether the staining results of
hub gene in normal adjacent tissues and tumor tissues were
statistically different. The significance of the difference between
the two groups was estimated by UALCAN using the t-test, but the
statistical analysis method used for the comparison of multiple
groups was not described. P<0.05 was considered to indicate a
statistically significant difference.
Results
Analysis of LUAD microarray data
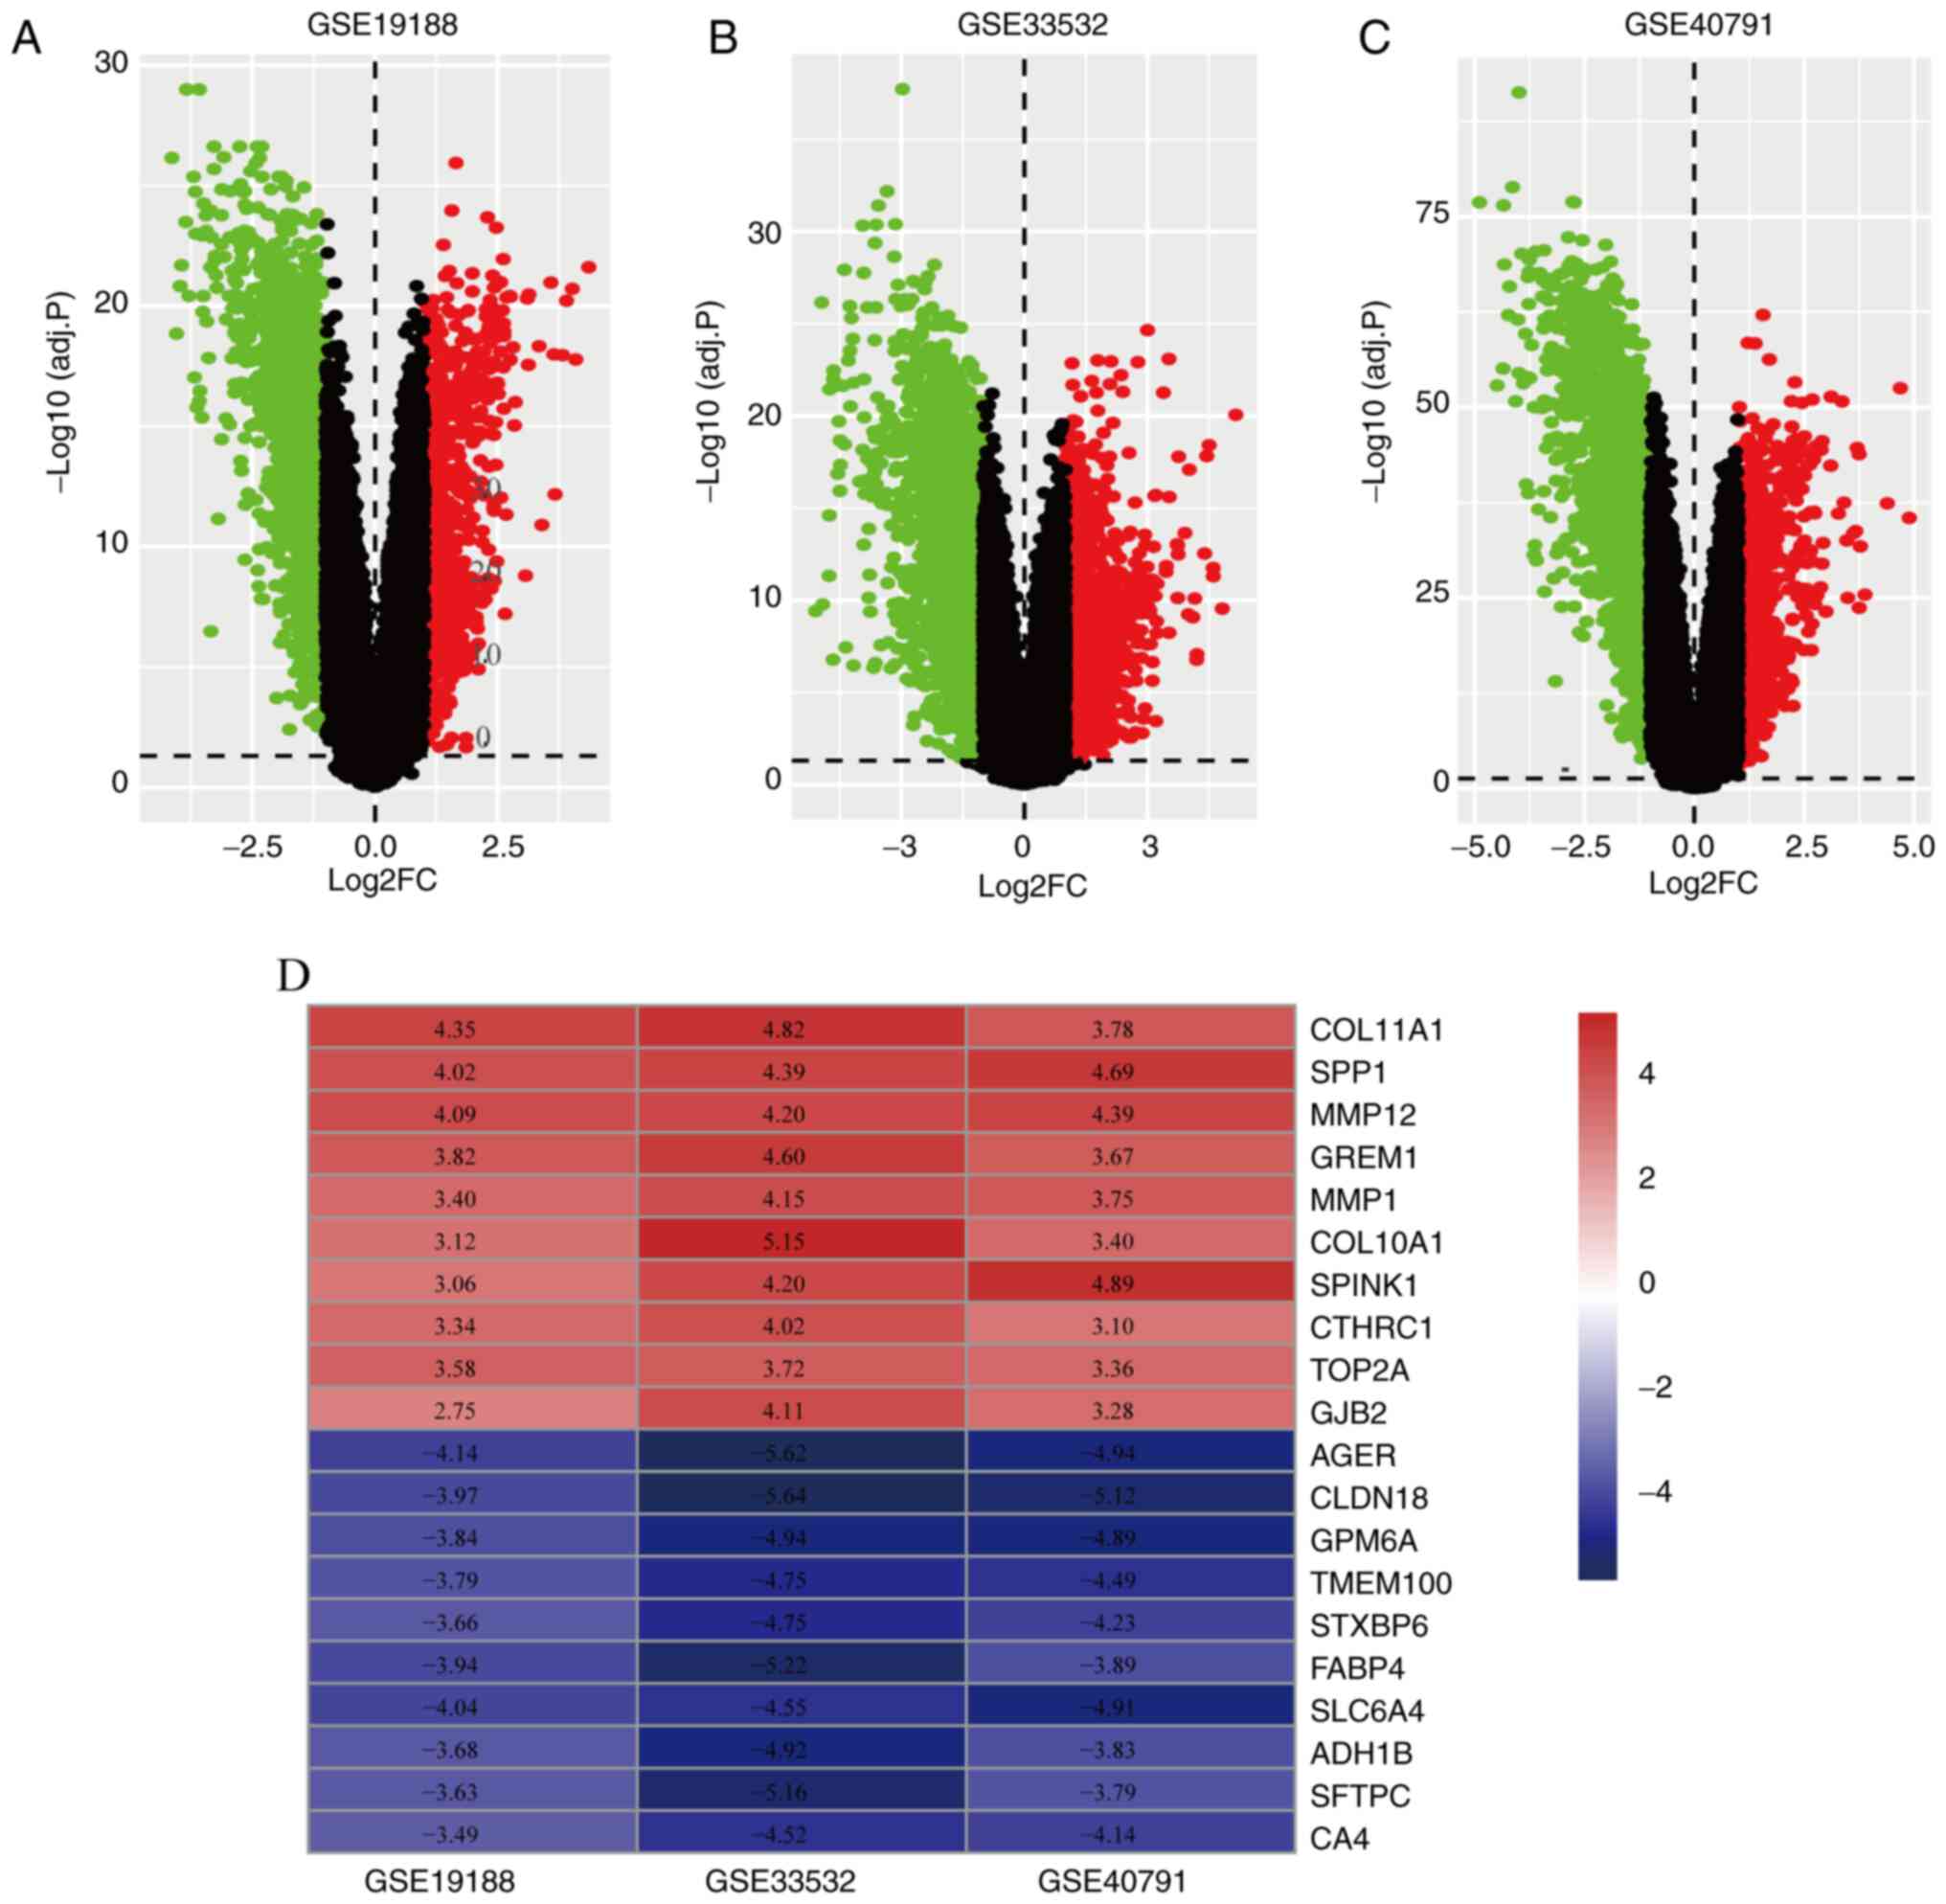
In the present study, GSE19188, GSE33532 and
GSE40791 were included for analysis, with a total of 179 LUAD
samples and 185 normal samples. These three microarray datasets
were first standardized by quantiles to mitigate individual
differences among samples. A total of 1,883, 3,079 and 2,258 DEGs
were screened from the GSE19188, GSE33532 and GSE40791 datasets,
respectively (Fig. 1A-C).
RRA-integrated analysis and
identification of DEGs
The RRA method assumes that the number of ranked
each gene is known (19). The
smaller the RRA score, the higher the gene ranks in term of the
credibility of differential expression. Finally, 556 significant
DEGs were screened by the integrated analysis, including 203
significantly upregulated genes and 353 significantly downregulated
genes. A heatmap containing the top 10 up- and downregulated genes
is shown in Fig. 1D.
Functional and pathway enrichment
analysis of the DEGs
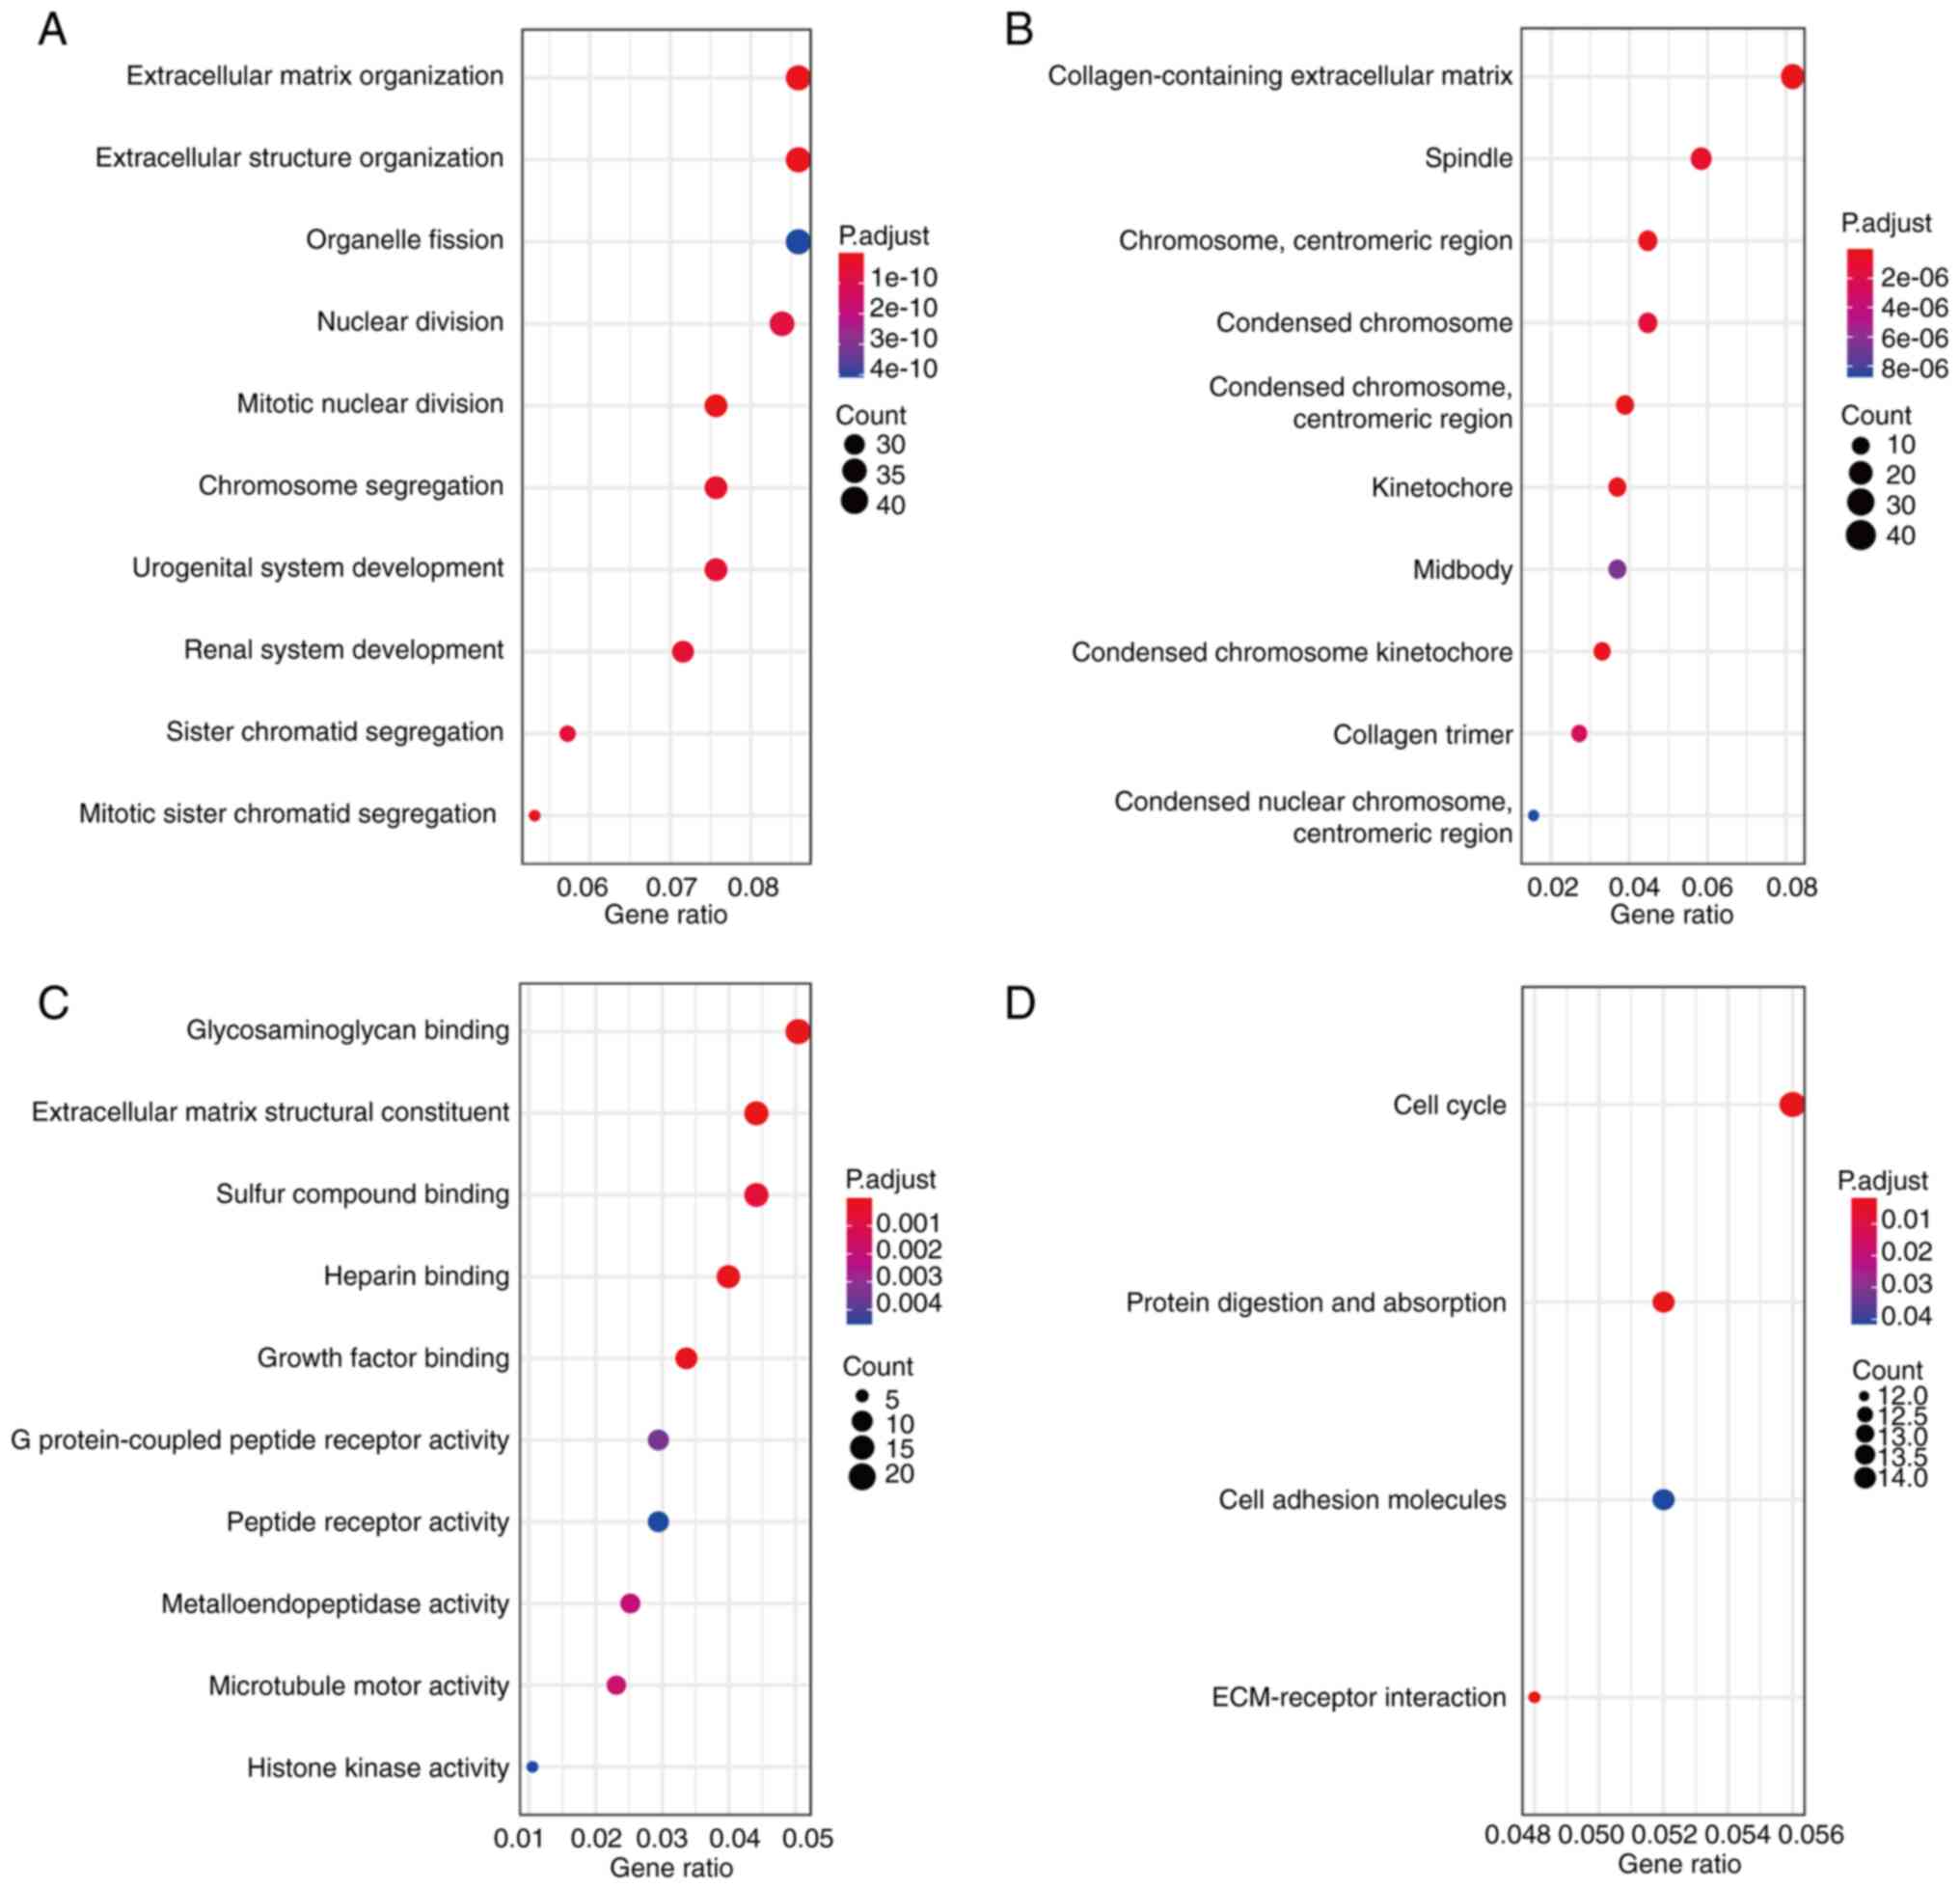
GO analysis revealed that biological processes of
the significant DEGs were associated with the cell cycle, including
‘mitotic nuclear division’, ‘extracellular matrix organization’,
‘extracellular structure organization’, ‘mitotic sister chromatid
segregation’ and ‘chromosome segregation’ (Fig. 2A). Significantly enriched cellular
components included ‘collagen-containing extracellular matrix’,
‘condensed chromosome’ and ‘centromeric region’ (Fig. 2B). In addition, the molecular
functions that were significantly enriched include ‘extracellular
matrix structural constituent’, ‘glycosaminoglycan binding’ and
‘growth factor binding’ (Fig. 2C).
KEGG analysis revealed that DEGs were significantly enriched in
‘ECM-receptor interaction’, ‘protein digestion and absorption’,
‘cell cycle’ and ‘cell adhesion molecules’ (Fig. 2D).
PPI network of DEGs and module
identification
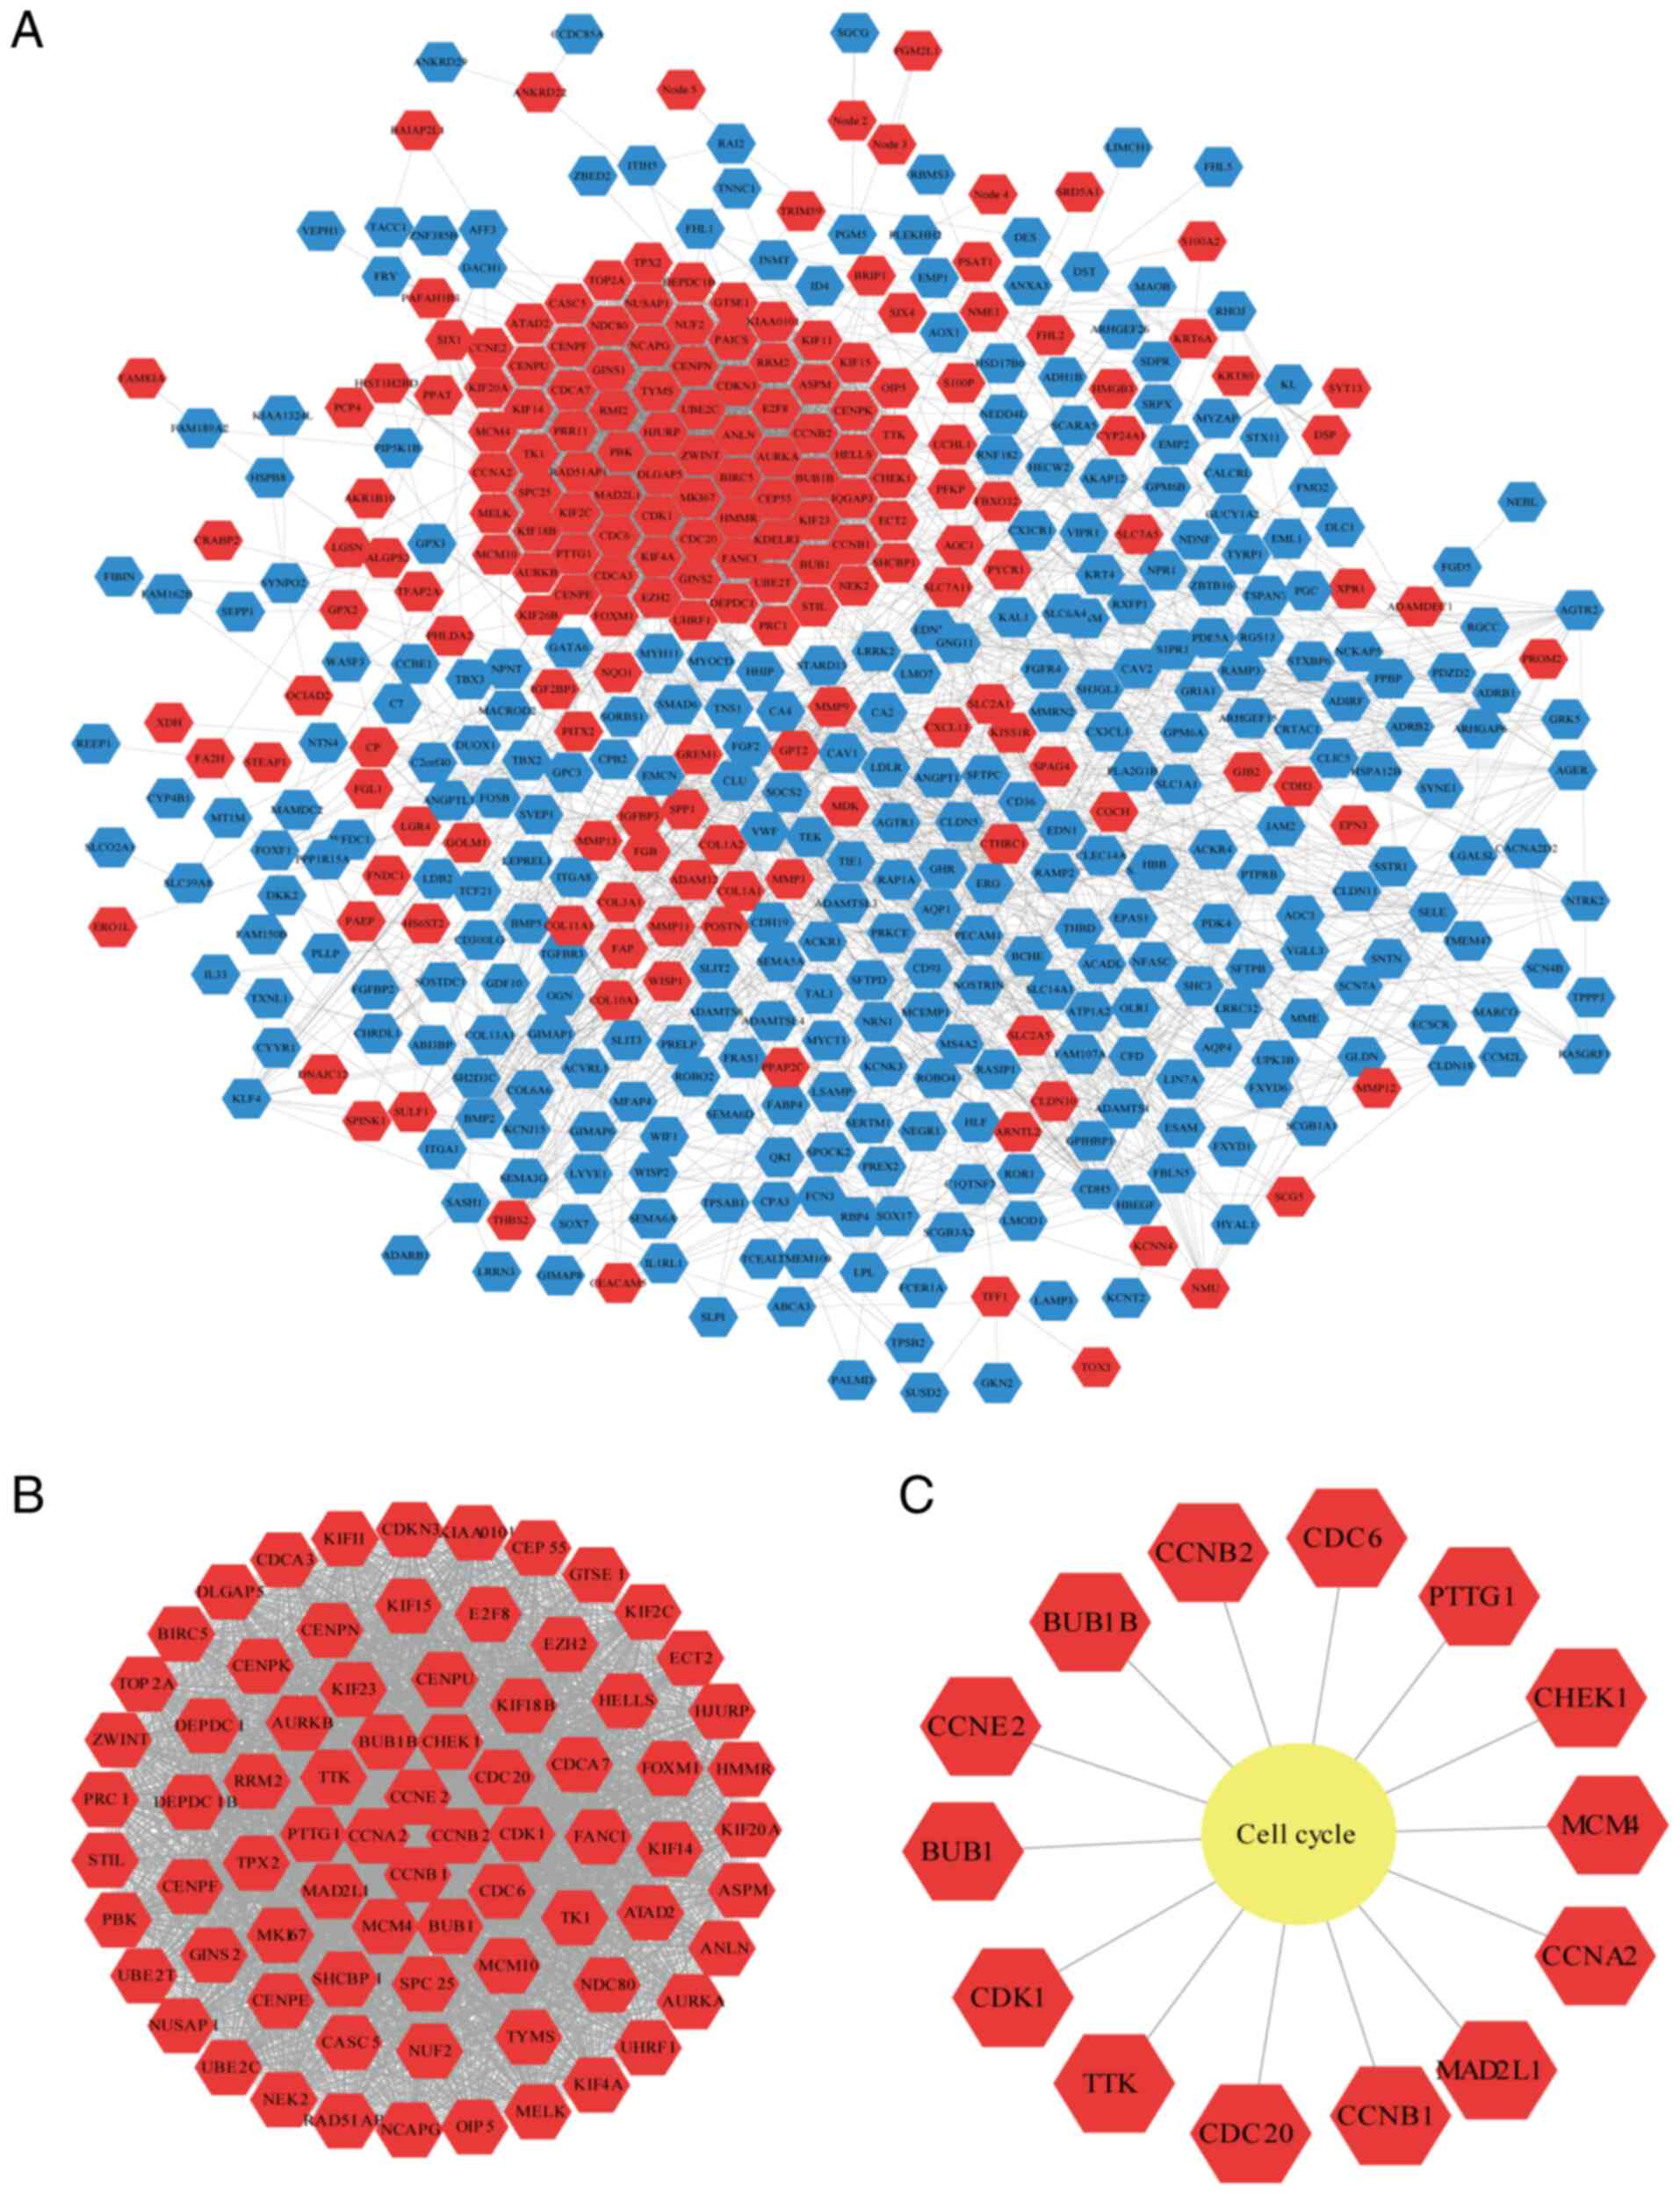
A total of 499 nodes and 4,311 edges were found in
the PPI network (Fig. 3A). Using
the ‘Networkanalyzer’ plugin, the basic parameters of the PPI
network were obtained, where the clustering coefficient was 0.342,
the network density was 0.035 and the network centralization was
0.147. Using the Cytoscape plugin ‘MCODE’, the most critical module
was acquired from the PPI network, which contains 76 nodes and 2631
edges (Fig. 3B). The most
significantly enriched pathway for module 1 is cell cycle (Fig. 3C).
Screening for key genes in the cyclin
family
A total of four cyclin family genes (CCNA2, CCNB1,
CCNB2 and CCNE2) were clustered in module 1. To analyze the cyclin
family genes, a cyclin family gene expression correlation matrix
was made for the three datasets. The results revealed that
CCNE1, CCNE2, CCNB1, CCNB2,
CCNA2 and CCNF correlated with each other (Fig. 4A-C). The expression of six cyclin
family genes was then analyzed in the three datasets: CCNE1, CCNE2,
CCNB1, CCNB2 and CCNA2 were all highly expressed in the three data
sets, while CCNF was only highly expressed in GSE33532, while there
was no significant difference in the other two data sets (Fig. 4D). The expression profile of
CCNE1, CCNE2, CCNB1, CCNB2,
CCNA2 and CCNF was subsequently analyzed in various
tumors using the GSCA database. It was found that the expression of
most if not all the genes examined were upregulated in multiple
human tumors, including LUAD, breast and colon cancer (Fig. 4E).
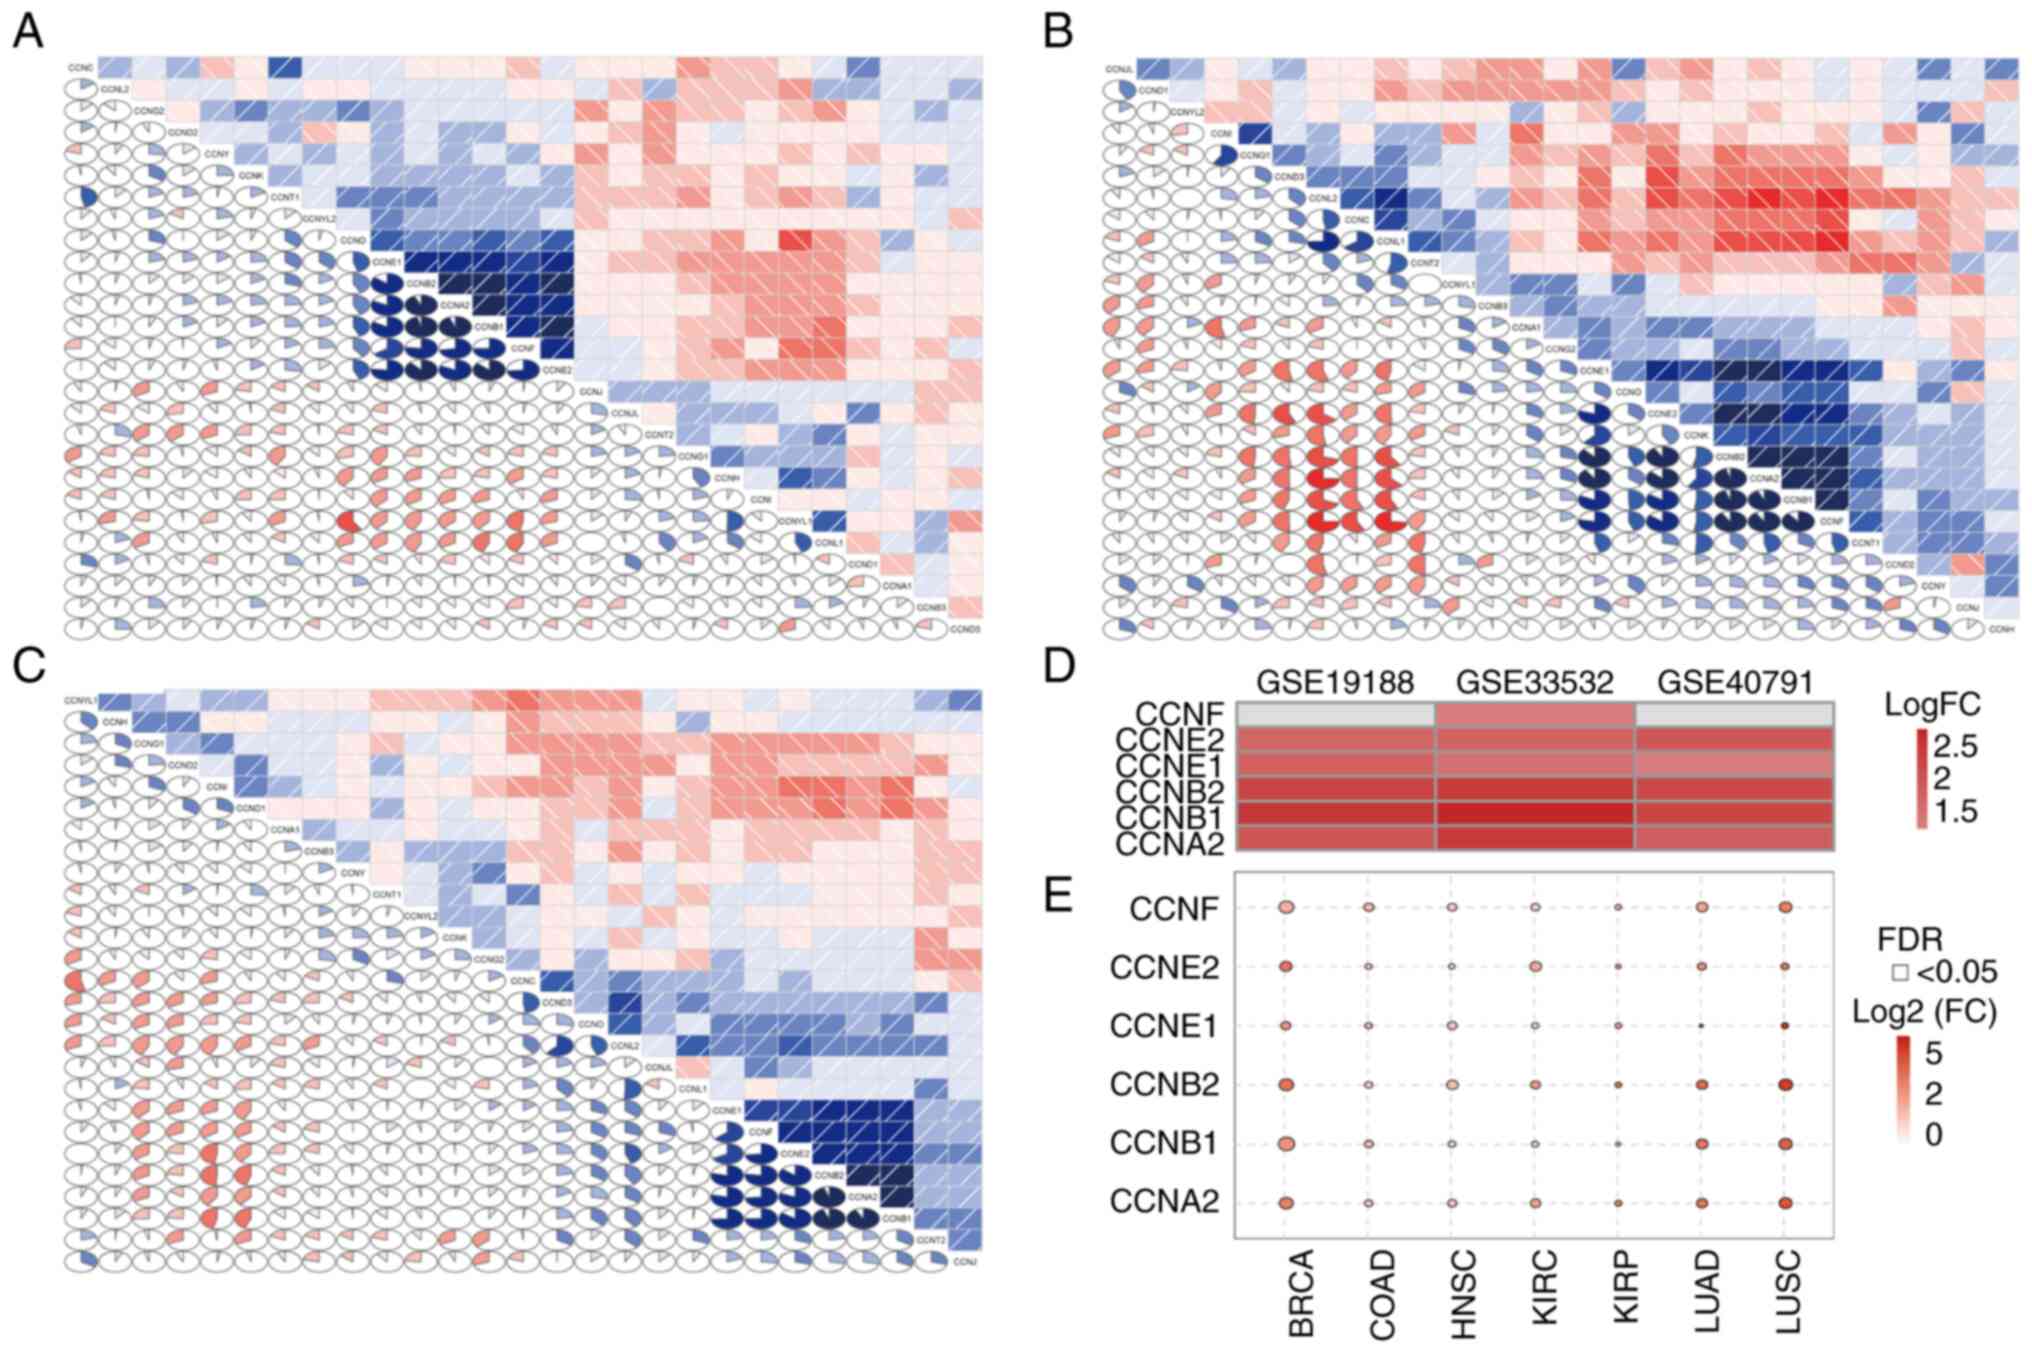 | Figure 4Cyclin family gene expression
profile. Correlation matrix of the expression levels of all genes
in the cyclin family in the (A) GSE19188, (B) GSE33532 and (C)
GSE40791 datasets. (D) Expression of sex cyclin family genes
(CCNE1, CCNE2, CCNB1, CCNB2,
CCNA2 and CCNF) in the three datasets. (E) Expression
of sex cyclin family genes in various tumors according to the Gene
Set Cancer Analysis database. BRCA, breast invasive carcinoma;
COAD, colon adenocarcinoma; HNSC, head and neck squamous cell
carcinoma; KIRC, kidney renal clear cell carcinoma; KIRP, kidney
renal papillary cell carcinoma; LUAD, lung adenocarcinoma; LUSC,
lung squamous cell carcinoma. |
Analysis of hub gene
co-expression
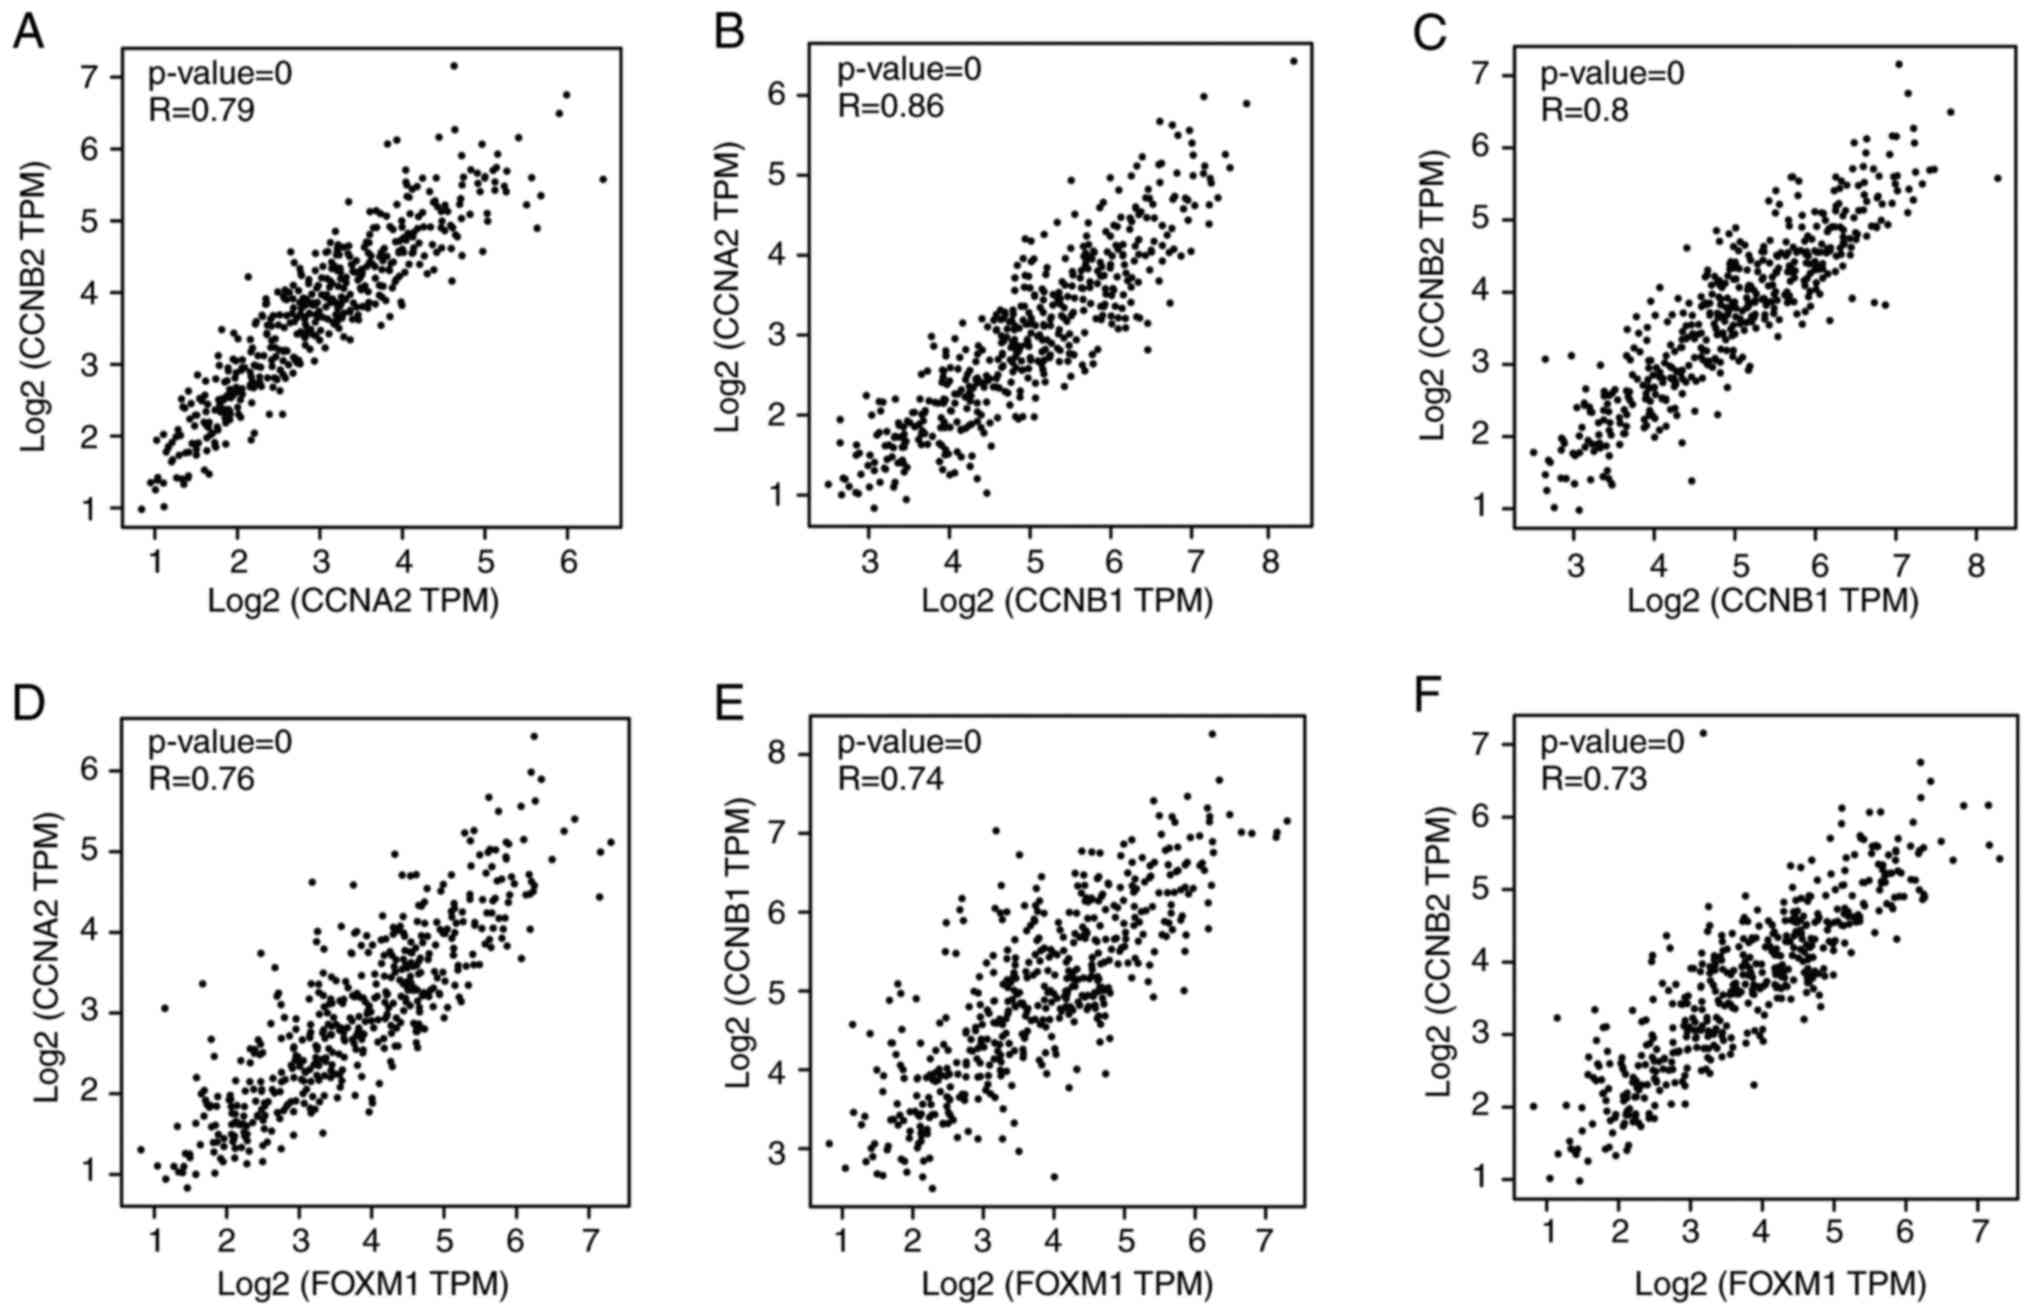
To investigate the correlation in the expression of
the six cyclin family genes, the GEPIA online tool was used to
obtain the Pearson's rank coefficient results among these genes.
According to the pairwise gene expression correlation analysis,
GEPIA revealed significant positive correlation among CCNB1,
CCNB2 and CCNA2 expression (Fig. 5A-C). The BioCarta database was next
used to screen for possible upstream transcription factors of
CCNB2, CCNB1 and CCNA2. FOXM1 was
predicted to be their common upstream transcription factor. In
addition, FOXM1 was also found to be an upregulated gene
clustered in module 1 (Fig. 3B).
According to the GEPIA database, FOXM1 also appeared to be a
co-expressed gene with the three cyclins (Fig. 5D-F). Therefore, these four genes
were chosen to be hub genes for further verification.
Expression of hub genes and their
prognostic value
The UALCAN database is based on The Cancer Genome
Atlas data (29). Therefore, this
online tool was used to assess the expression profile of the hub
genes. The expression of these hub genes was found to be higher in
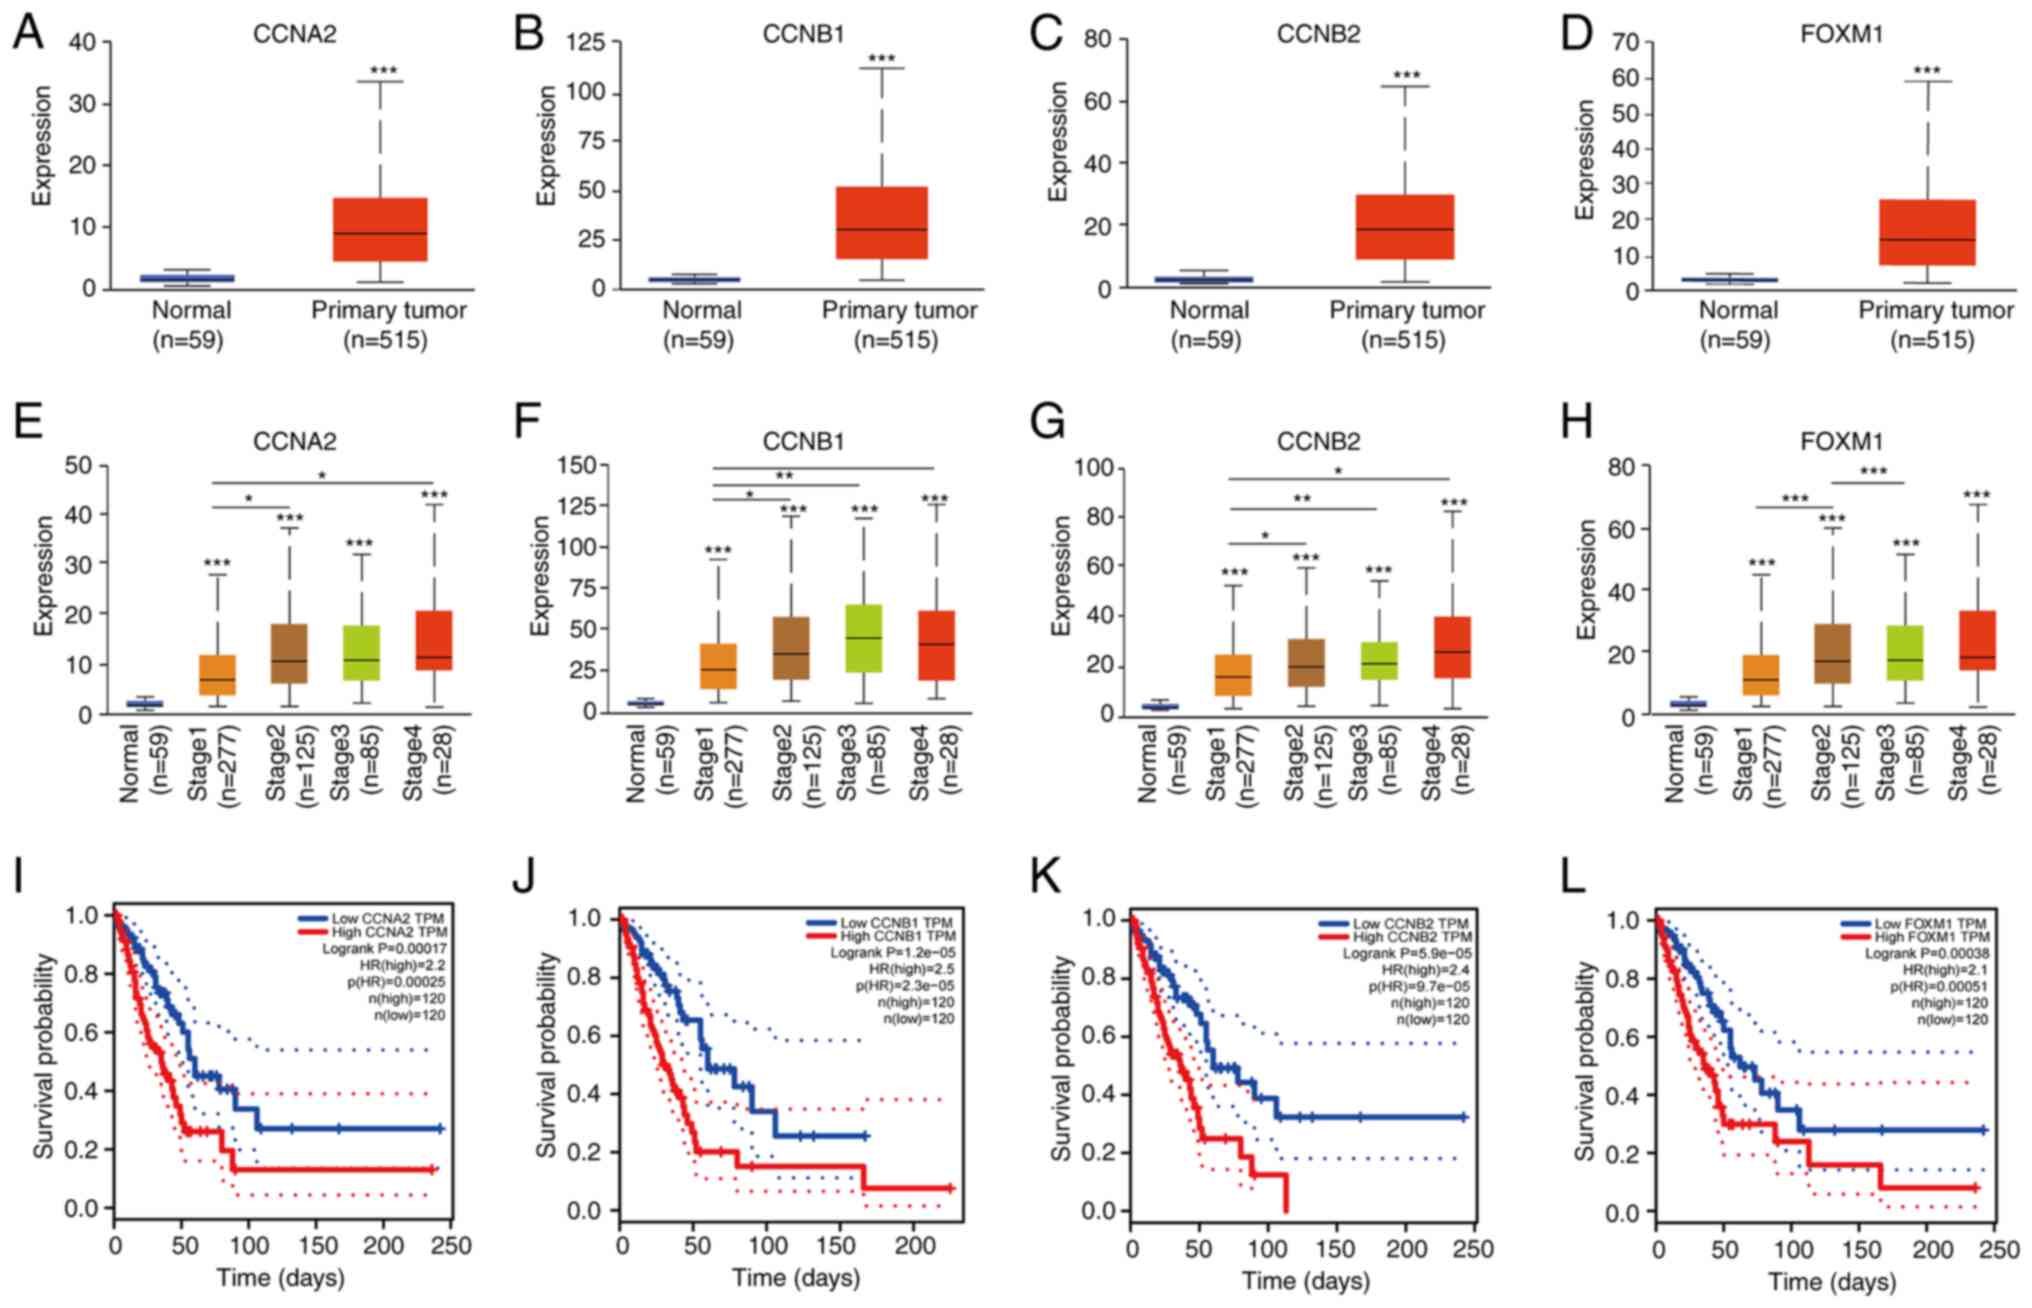
the LUAD samples compared with that in the normal samples (Fig. 6A-D). The association between hub
gene expression and tumor stage was next assessed (Fig. 6E-H). All four hub genes were
revealed to be expressed in tumors of different stages, but the
levels were higher in advanced LUAD compared with those in their
early-stage counterparts. The GEPIA website was next used to assess
the prognostic value of these hub genes in the clinical setting,
where a total of 240 patients with LUAD were included from the
database available for overall survival (OS) analysis. Higher
expression of all these hub genes was associated with more
unfavorable OS among patients with LUAD (Fig. 6I-L).
Validation of hub gene expression in
vitro
RT-qPCR was used to verify the mRNA expression
levels of these genes in the cell lines. The results showed that
the mRNA expression of the hub genes was significantly higher in
the two non-small cell lung cancer cell lines Beas-2B and H1299
compared with human bronchial epithelial cell line 16-HBE, and the
expression of four hub genes was upregulated in A549 cell line, in
which there was a significantly high expression in CCNB1 and CCNB2
(Fig. 7A-D, Table SII, Table SIII, Table SIV and Table SV). Subsequently, western blotting
revealed that the CCNA2, CCNB1 and CCNB2 were also highly expressed
in the three non-small cell lung cancer cell lines A549, Beas-2B
and H1299 compared with human bronchial epithelial cell line 16-HBE
(Fig. 7E, Table SVI, Table SVII and Table SVIII). According to the
immunohistochemistry staining images of the hub genes in 10 pairs
of human LUAD tissues and adjacent normal tissues, their expression
in tumors was found to be significantly higher compared with that
in the adjacent normal tissues (Fig.
7F-G).
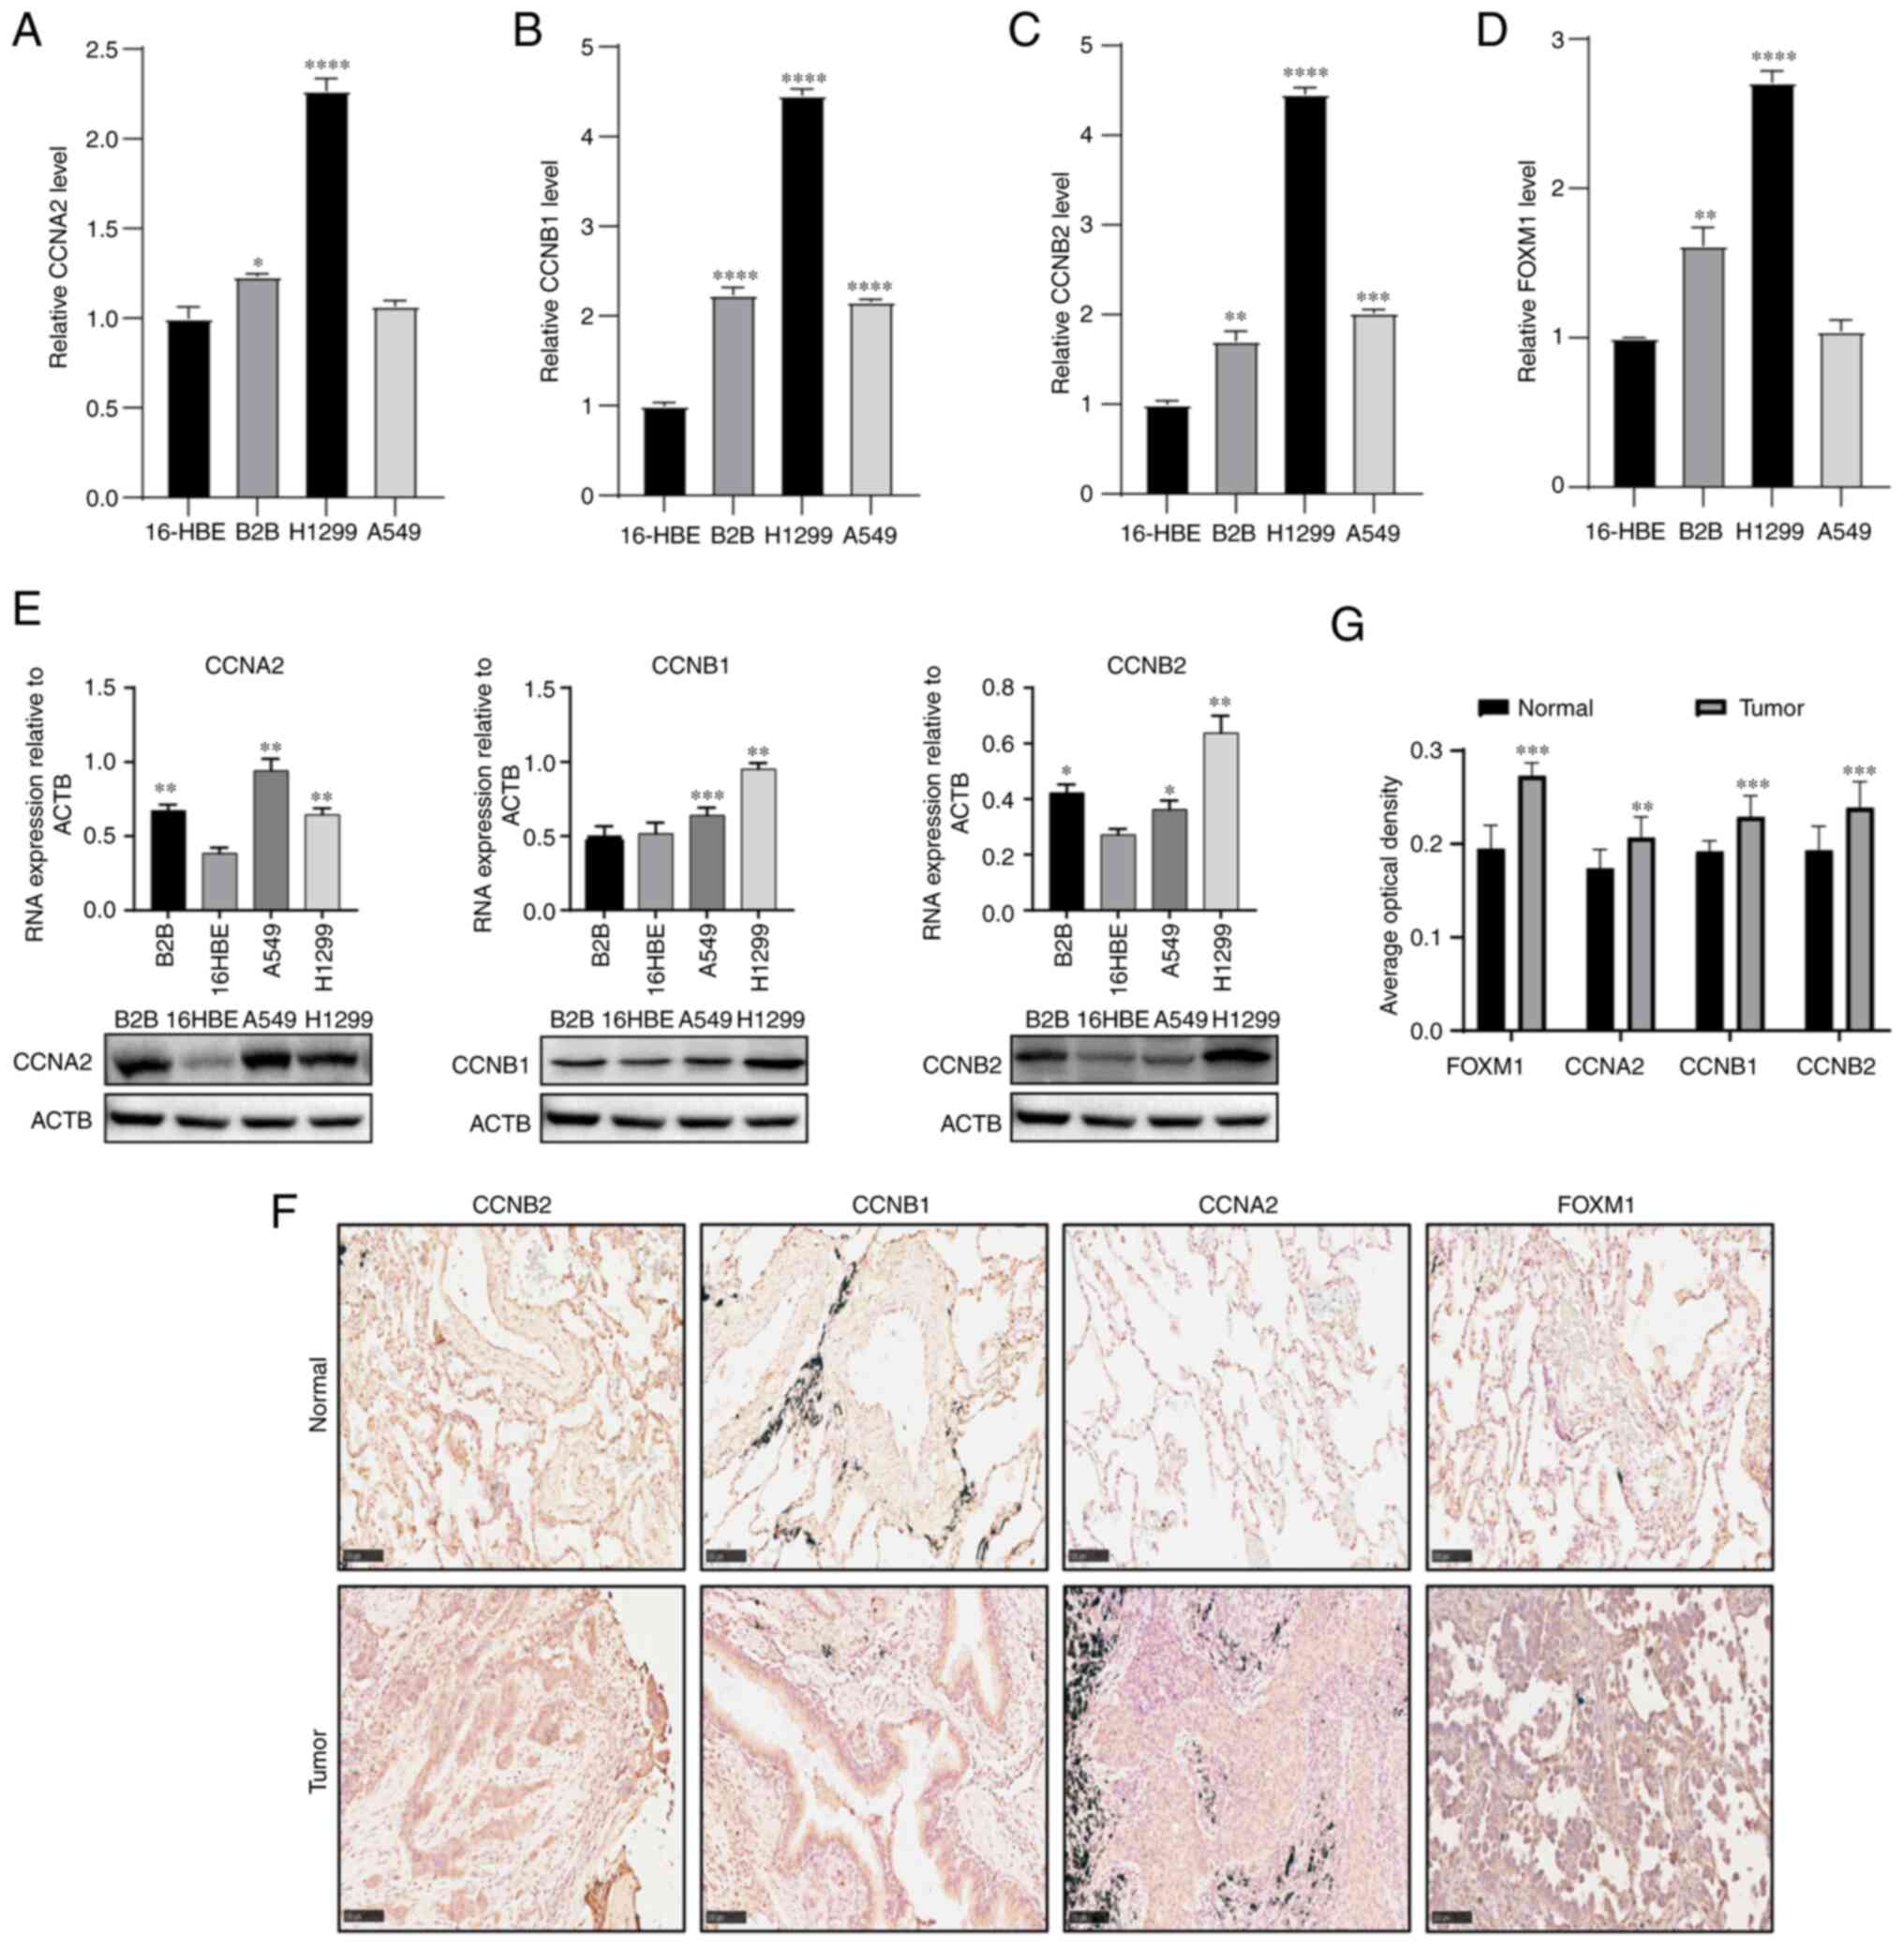 | Figure 7Expression of hub genes in LUAD cells
and tissues. The expression levels of (A) CCNA2, (B) CCNB1, (C)
CCNB2 and (D) FOXM1 mRNA in the non-small cell lung cancer cell
lines A549, Beas-2B and H1299 and the control cell line 16-HBE were
validated by reverse transcription-quantitative PCR. (E) Western
blot analysis was used to detect the expression of CCNA2, CCNB1 and
CCNB2 in LUAD cell lines; ACTB was used as loading control. Each
column represents the mean ± SD from independent experiment. (F)
Immunohistochemistry was used to analyze the expression of hub
genes in LUAD and adjacent normal tissues (magnification, x200;
scale bar, 100 µm). (G) Image-Pro Plus version 6.0 was used to
calculate the integral optical density/area and analyze the hub
gene protein expression level. Statistical analysis of results in
panels A-E was performed using one-way ANOVA, and comparisons
between groups were performed using Dunnett's test. Statistical
analysis of results in panel F was performed using t-test.
*P<0.05, **P<0.01,
***P<0.001 and ****P<0.0001 compared
with 16-HBE. LUAD, lung adenocarcinoma; CCN, cyclin. |
Diagnostic model and evaluation of hub
genes
The diagnostic efficacy of all hub genes was
assessed by constructing multi-factorial logistic regression models
from the training set, where CCNB1, CCNB2 and
FOXM1 were statistically significant (Table SIX). CCNB1, CCNB2
and FOXM1 were analyzed further after their inclusion as
possible effect variables (Table
SX). All hub genes were found to be statistically
significant.
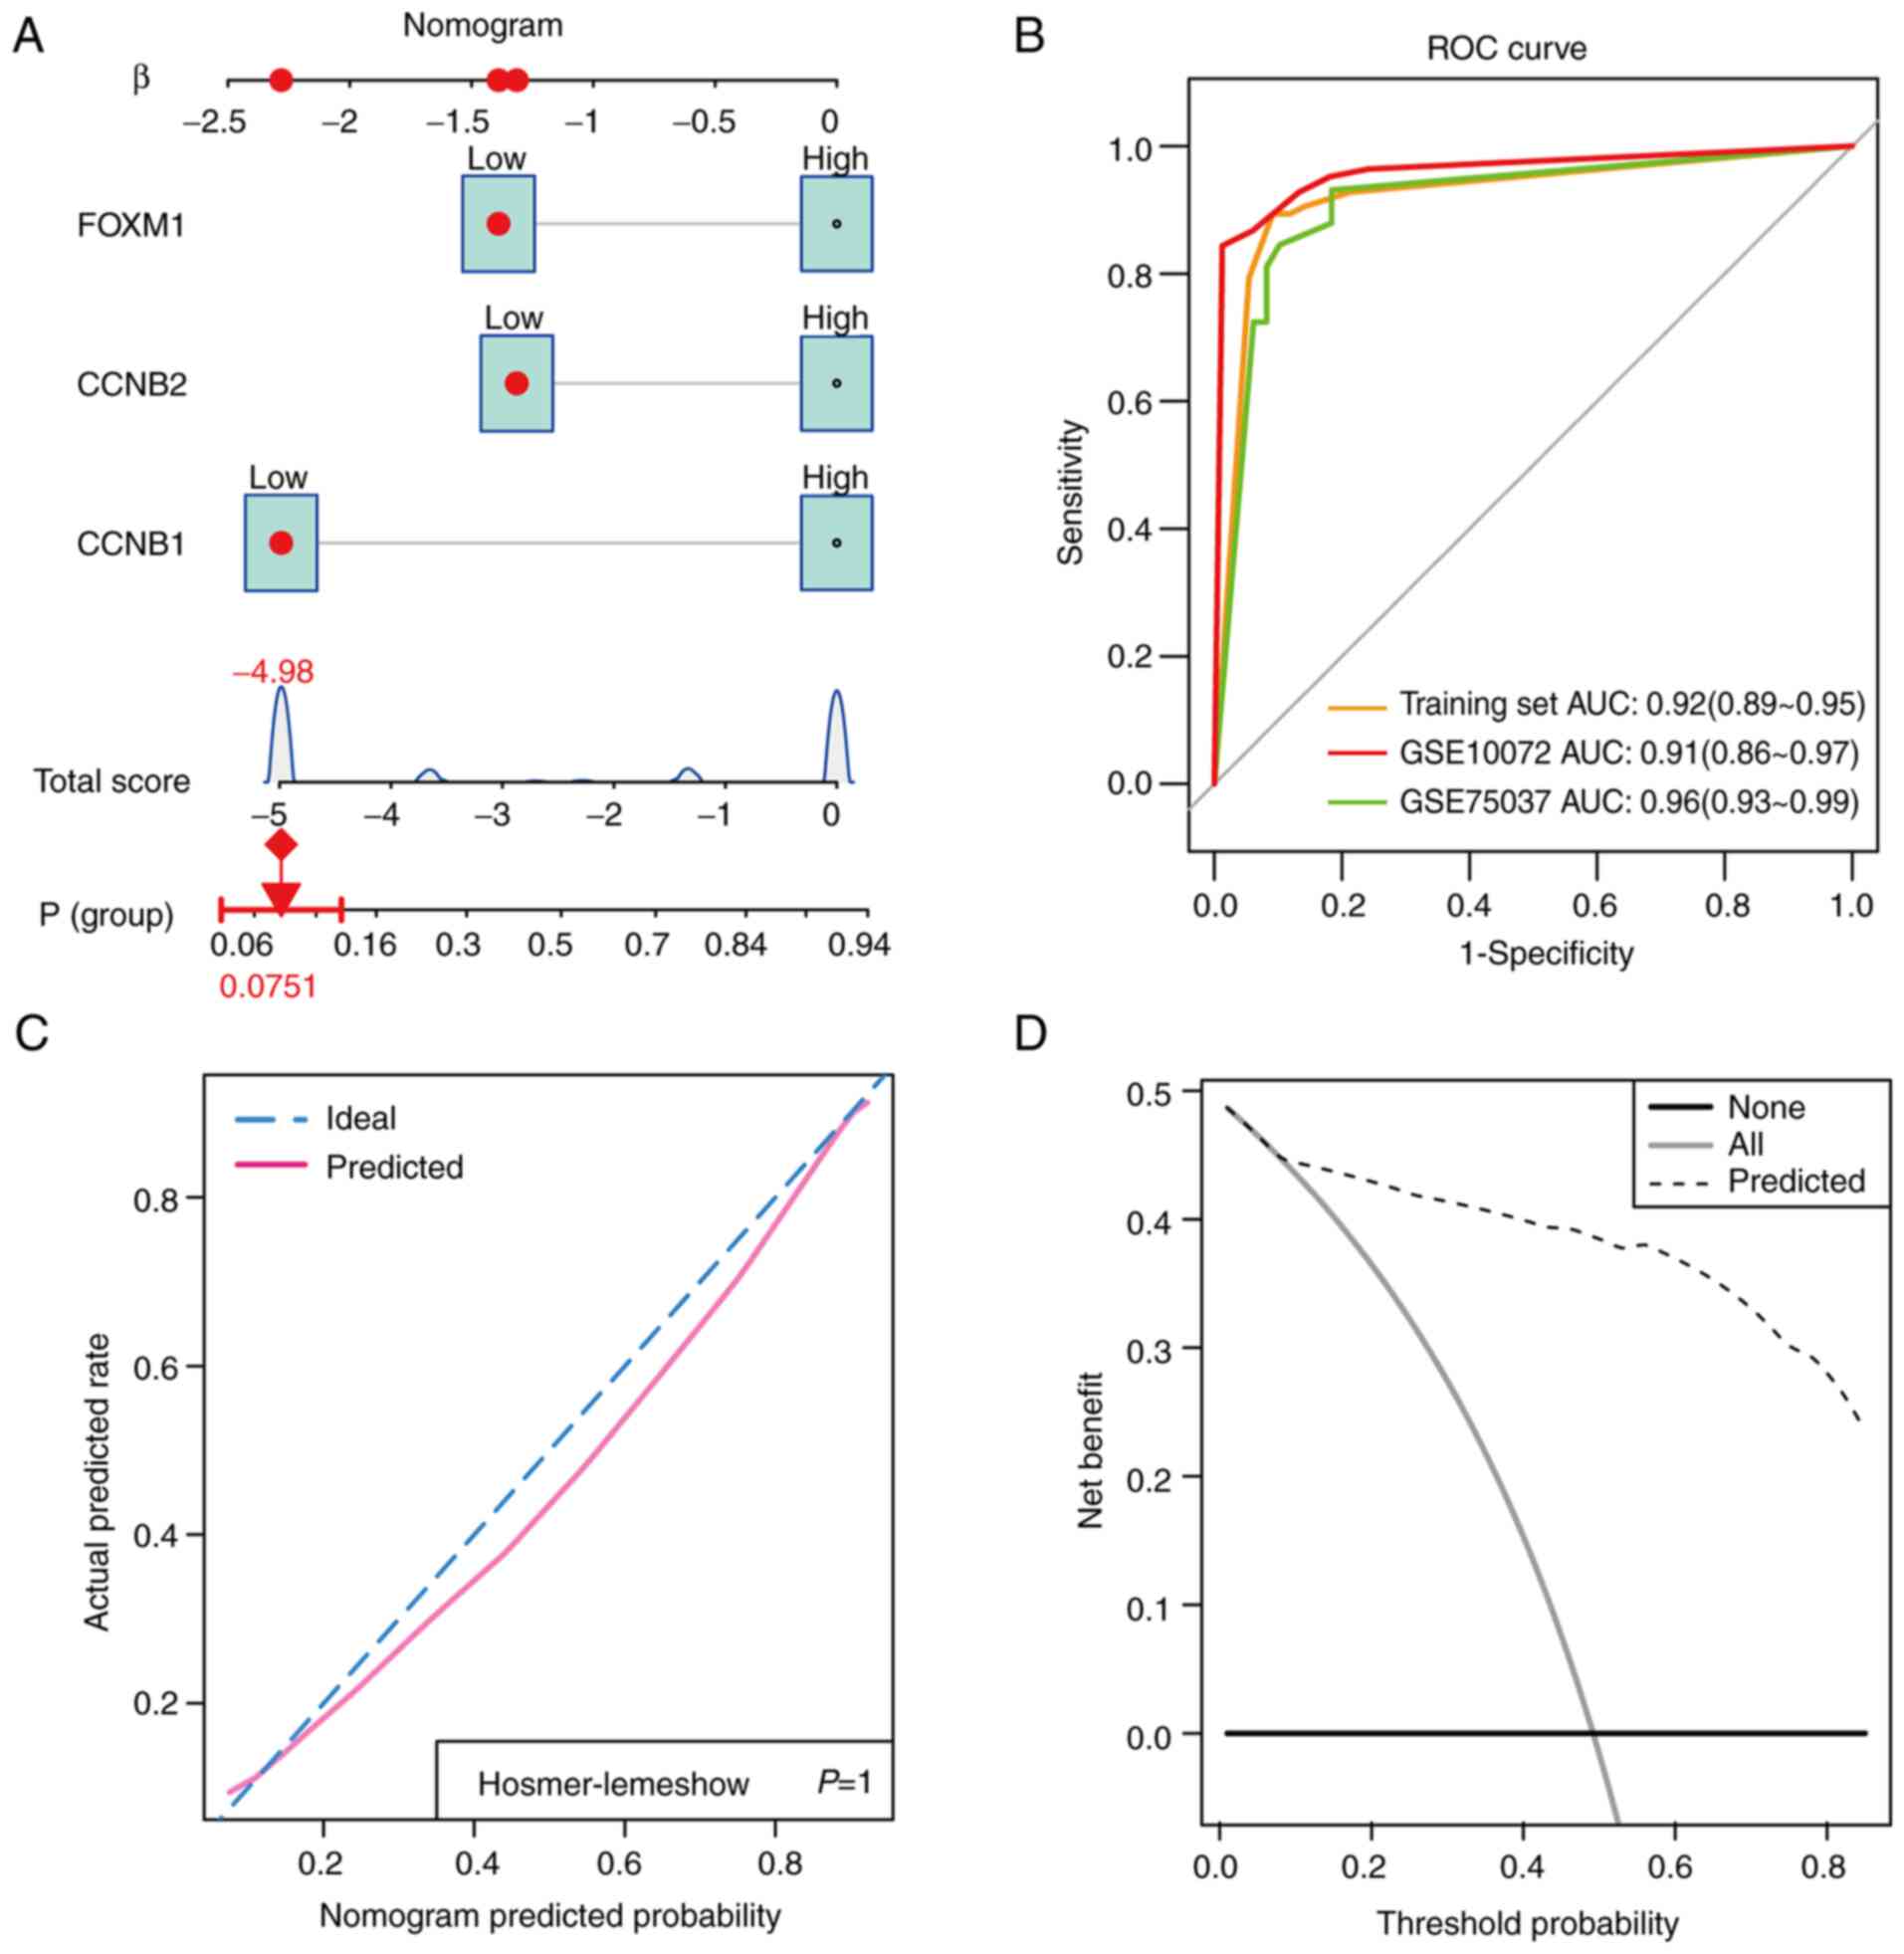
Since the expression levels of CCNB1,
CCNB2 and FOXM1 appeared to be predictors of LUAD,
the nomogram plots were constructed to assess their diagnostic
efficacy (Fig. 8A). ROC analysis
was subsequently applied to evaluate the potential diagnostic value
of these hub genes in LUAD. The results showed that CCNB1,
CCNB2 and FOXM1 had AUC values of 0.92 (95%
confidence interval=0.89-0.95) in the training set, 0.91 (95%
confidence interval=0.86-0.97) in the GSE10072 validation set for
the diagnosis of LUAD and 0.96 (95% confidence interval=0.93-0.99)
in the GSE75037 validation set (Fig.
8B). This suggested that CCNB1, CCNB2 and
FOXM1 are viable biomarkers for LUAD diagnosis (Fig. 8B). The calibration plot also
revealed consistent predictive accuracy for the diagnosis of LUAD
using the hub genes (Fig. 8C). DCA
plot results revealed that clinical benefit could be obtained by
developing clinical strategies based on this nomogram (Fig. 8D).
Discussion
Dysregulation in cell cycle control can lead to
tumor progression. Cyclins are cell cycle regulators that are
associated with numerous types of cancer (12,13).
However, it remains unclear the role and possible regulatory
mechanism of cyclins in LUAD.
In the present study, expression profiling and
functional enrichment analysis revealed that four significant DEGs,
namely CCNA2, CCNB1, CCNB2 and CCNE2,
were highly expressed in module 1. An expression correlation matrix
containing 31 cyclin family genes in three datasets also showed
that six genes (CCNE1, CCNE2, CCNB1,
CCNB2, CCNA2 and CCNF) are significantly
co-expressed. Further analysis of their expression in the datasets
and pan-tumor data demonstrated that they were significantly
overexpressed in a variety of tumors, such as breast cancer and
colon cancer. Further co-expression analysis also revealed that the
correlation among the expression levels of CCNA2,
CCNB1 and CCNB2 was particularly striking. In
addition, FOXM1 was predicted to be their upstream
transcription factor according to the BioCarta database, where the
co-expression results reported significant co-expression between
FOXM1 and the three cyclin family genes. Since further study
revealed that FOXM1 was also enriched in module 1, it was included
as one of the hub genes for further analysis and validation.
Using online databases, the high expression of hub
genes was found in LUAD. Furthermore, the expression of
CCNA2, CCNB1, CCNB2 and FOXM1 was found
to be higher in patients with advanced LUAD compared with that with
early-stage LUAD. Kaplan-Meier analysis revealed that patients with
higher levels of hub gene expression had poorer prognoses,
suggesting that they are viable prognostic indicators of LUAD. In
terms of biological function, the hub genes were enriched in the
cell cycle, DNA damage, DNA repair, invasion and proliferation
according to the single-cell pan-tumor function enrichment study.
These results may provide phenotypic directions for further
experimental verification. On protein level, results from
immunohistochemical analysis also confirmed the higher protein
expression levels of hub genes in LUAD compared with those in
normal tissues. To validate the results on a cellular level, the
mRNA and protein expression of these hub genes were found to be
upregulated in the cancer cell lines Beas-2B and H1299 compared
with those in the control cell line 16-HBE. Immunohistochemistry
results also showed that the hub genes are expressed highly in LUAD
tissues.
The protein encoded by CCNB1 is a
mitosis-associated regulatory protein (37). It functions as a controller of
mitosis entry (38). CCNB1
recombines with Cdk1, which divides the nuclear envelope to allow
the mitotic spindle to enter the chromosome. The role of CCNB1 is
to facilitate entry from the G2 phase to the M phase
(39). CCNB1 overexpression can
lead to uncontrolled cell proliferation by binding Cdk1(40). Previous studies have shown that the
expression level of CCNB1 was increased in a variety of solid
tumors, including breast and colorectal, where the survival rate of
patients with cancer with higher CCNB1 expression was lower
(41). In pituitary adenomas, the
upregulated CCNB1 expression has been reported to serve an
important role in the pathological development of the disease,
suggesting that it can be used as a marker to evaluate tumor
invasiveness (42). In another
study, Chen et al (43)
previously revealed that higher expression levels of CCNB1 promoted
the proliferation, migration and invasion of gastric cancer cells
(43). In terms of the mechanism,
inhibiting the expression of CCNB1 can inhibit the proliferation of
pancreatic cancer cells through the p53 signaling pathway (44).
CCNB2 is a B-type cyclin (45). Qian et al (46) previously found that the higher
expression of CCNB2 is associated with the progression and poor
prognosis of non-small-cell lung cancer (46). In addition, CCNB2 has been reported
to be expressed highly in bladder cancer, where inhibiting CCNB2
expression can inhibit tumor invasion and metastasis (47). CCNB2 was also revealed to affect
the CCNB2/polo-like kinase pathway to promote cell proliferation
and migration in hepatocellular carcinoma (48). In another recent study, Wang et
al (49) found that
microRNA-335-5p may be a negative upstream regulator of CCNB2 to
inhibit the proliferation of LUAD cells.
CCNA2 belongs to a highly conserved cyclin family
(50). CCNA2 has been found to be
expressed highly in pancreatic cancer, where its expression levels
were positively associated with tumor stage and poorer prognosis
(51). In non-small-cell lung
cancer, higher expression levels of CCNA2 have been proposed to be
a biomarker of poor prognosis (52). In addition, higher expression of
CCNA2 in patients with stage I non-small-cell lung cancer may
indicate a worse prognosis and higher recurrence rates (53). Mechanistically, tanshinone has been
shown to inhibit the progression of LUAD by regulating the
expression of CCNA2(54). Several
bioinformatics studies also previously revealed that CCNA2 is a
potential therapeutic target and prognostic marker of breast and
gastric tumors (55,56).
FOXM1 is a member of the FOX transcription factor
family that serves an important role in cell proliferation,
differentiation and survival (57,58).
Several studies have shown that higher expression levels of FOXM1
are closely associated with poorer prognosis in small cell lung
cancer (58,59). In terms of mechanism, FOXM1 can
regulate cell cycle progression and improve the invasiveness of
bladder cancer (60). Furthermore,
FOXM1 can be indirectly recruited to the homologous region element
of the cell cycle gene through the Myb-MuvB complex, which enables
it to specifically control the expression of CCNB1 and
CCNB2 during the G2/M phase of the cell cycle
(61). A previous study showed
that higher expression of FOXM1 can increase the expression of
CCNB1, where FOXM1 mainly mediates its biological function through
inhibiting the activation of the p53 pathway by recruiting
CBP/P300(62). Chai et al
(63) previously found that the
FOXM1/CCNB1 axis can promote the proliferation of liver cancer
cells, which can be reversed by blocking this axis.
Nomograms have been widely applied for predicting
prognosis and outcome in a clinical setting by combining multiple
risk factors (35). In the present
study, CCNB1, CCNB2 and FOXM1 were found to be
predictors of LUAD. By combining the variables, a nomogram was then
plotted. This nomogram appeared to be effective for in malignancy
prediction with an AUC of 0.92, where it yielded superior findings
in both external validation datasets, with AUCs of 0.91 and 0.96
for GSE10072 and GSE75037, respectively.
In the training set and validation set, all the AUC
values of the present diagnostic model were >0.9. Therefore,
according to this nomogram, the diagnostic evaluation of LUAD based
on the expression levels of CCNB1, CCNB2 and
FOXM1 yielded high accuracy and specificity. These three
genes therefore have potential as biomarkers for the diagnosis of
LUAD.
However, many limitations remain associated with the
present study. Although the present study found that the higher
expression of CCNB1, CCNB2 and CCNA2 is
associated with poorer prognosis in LUAD, high expression of other
cyclin family genes (CCNA2, CCNB1, CCNE1, CCNF and CCNJL) was
associated with superior prognosis in colon cancer (64). Therefore, the prognostic impact of
using the expression of genes in the cyclin family will likely be
dependent on the type of tumors, which remains a topic of further
study. In addition, the specific mechanistic role of these four hub
genes on LUAD remain to be verified by in vitro or in
vivo experiments.
In conclusion, in the present study bioinformatics
analysis identified that FOXM1, CCNB1, CCNB2
and CCNA2 have hub genes that may the important for the
development and prognosis of LUAD. In addition, the expression of
these hub genes was found to be increased in Beas-2B and H1299 cell
lines compared with those in the control cell line 16-HBE.
Therefore, CCNB1, CCNB2 and FOXM1 may have
potential diagnostic and prognostic value for LUAD in the
future.
Supplementary Material
Primer pairs of 4 hub genes.
Multiple comparisons test results of
reverse transcription-quantitative PCR for cyclin A2.
Multiple comparisons test results of
reverse transcription-quantitative PCR for cyclin B1.
Multiple comparisons test results of
reverse transcription-quantitative PCR for cyclin B2.
Multiple comparisons test results of
reverse transcription-quantitative PCR for FOXM1.
Multiple comparisons test results of
western blot analysis for cyclin A2.
Multiple comparisons test results of
western blot analysis for cyclin B1.
Multiple comparisons test results of
western blot analysis for cyclin B2.
Multi-factorial logistic regression of
CCNB2, CCNB1, CCNA2 and FOXM1.
multi-factorial logistic regression of
CCNB2, CCNB1 and FOXM1
Acknowledgements
Not applicable.
Funding
Funding: No funding was received.
Availability of data and materials
The data generated and/or analyzed during the
current study are available in the GEO database under accession
number (GSE19188, GSE33532, GSE40791, GSE10072 and GSE75037) or at
the following URLs: https://www.ncbi.nlm.nih.gov/geo/query/acc.cgi?acc=GSE19188;
https://www.ncbi.nlm.nih.gov/geo/query/acc.cgi?acc=GSE33532;
https://www.ncbi.nlm.nih.gov/geo/query/acc.cgi?acc=GSE40791;
https://www.ncbi.nlm.nih.gov/geo/query/acc.cgi?acc=GSE10072;
https://www.ncbi.nlm.nih.gov/geo/query/acc.cgi?acc=GSE75037.
Authors' contributions
XZ and XY confirm the authenticity of all the raw
data. XZ provided the funding support of the study and designed
this project. XY wrote the manuscript, and analyzed and interpreted
the data. HG and ZT organized all the figures and interpreted data.
YZ and PL performed tissue culture, RT-qPCR and western blot
experiments, and revised the manuscript, figures and table. All
authors read and approved the final manuscript.
Ethics approval and consent to
participate
The present study was approved [approval no.
KYLL-2020(KJ)P-0099] by the Medical Ethics Committee of the Second
Hospital of Shandong University (Jinan, China). Written informed
consent was obtained from all participants.
Patient consent for publication
Not applicable.
Competing interests
The authors declare that they have no competing
interests.
References
|
1
|
Torre LA, Siegel RL and Jemal A: Lung
cancer statistics. Adv Exp Med Biol. 893:1–19. 2016.PubMed/NCBI View Article : Google Scholar
|
|
2
|
Boolell V, Alamgeer M, Watkins DN and
Ganju V: The evolution of therapies in non-small cell lung cancer.
Cancers (Basel). 7:1815–1846. 2015.PubMed/NCBI View Article : Google Scholar
|
|
3
|
Zenke Y, Tsuboi M, Chiba Y, Tsujino K,
Satouchi M, Sawa K, Shimizu J, Daga H, Fujimoto D, Mori M, et al:
Effect of second-generation vs third-generation chemotherapy
regimens with thoracic radiotherapy on unresectable stage III
non-small-cell lung cancer: 10-year follow-up of a WJTOG0105 phase
3 randomized clinical trial. JAMA Oncol. 7:904–909. 2021.PubMed/NCBI View Article : Google Scholar
|
|
4
|
Min HY and Lee HY: Mechanisms of
resistance to chemotherapy in non-small cell lung cancer. Arch
Pharm Res. 44:146–164. 2021.PubMed/NCBI View Article : Google Scholar
|
|
5
|
Lu X, Zhou D, Hou B, Liu QX, Chen Q, Deng
XF, Yu ZB, Dai JG and Zheng H: Dichloroacetate enhances the
antitumor efficacy of chemotherapeutic agents via inhibiting
autophagy in non-small-cell lung cancer. Cancer Manag Res.
10:1231–1241. 2018.PubMed/NCBI View Article : Google Scholar
|
|
6
|
Zhang Z, Zhang C, Yang Z, Zhang G, Wu P,
Luo Y, Zeng Q, Wang L, Xue Q, Zhang Y, et al: m6A regulators as
predictive biomarkers for chemotherapy benefit and potential
therapeutic targets for overcoming chemotherapy resistance in
small-cell lung cancer. J Hematol Oncol. 14(190)2021.PubMed/NCBI View Article : Google Scholar
|
|
7
|
Pang Z, Chen X, Wang Y, Wang Y, Yan T, Wan
J and Du J: Comprehensive analyses of the heterogeneity and
prognostic significance of tumor-infiltrating immune cells in
non-small-cell lung cancer: Development and validation of an
individualized prognostic model. Int Immunopharmacol.
86(106744)2020.PubMed/NCBI View Article : Google Scholar
|
|
8
|
Riess JW, Gandara DR, Frampton GM, Madison
R, Peled N, Bufill JA, Dy GK, Ou SI, Stephens PJ, McPherson JD, et
al: Diverse EGFR exon 20 insertions and co-occurring molecular
alterations identified by comprehensive genomic profiling of NSCLC.
J Thorac Oncol. 13:1560–1568. 2018.PubMed/NCBI View Article : Google Scholar
|
|
9
|
Zhang F, Wang J, Ma M, Xu Y, Lu X and Wei
S: Genomic alteration profiles of lung cancer and their
relationship to clinical features and prognosis value using
individualized genetic testing. J Thorac Dis. 13:5007–5015.
2021.PubMed/NCBI View Article : Google Scholar
|
|
10
|
Jirawatnotai S, Dalton S and
Wattanapanitch M: Role of cyclins and cyclin-dependent kinases in
pluripotent stem cells and their potential as a therapeutic target.
Semin Cell Dev Biol. 107:63–71. 2020.PubMed/NCBI View Article : Google Scholar
|
|
11
|
Gong K, Zhou H, Liu H, Xie T, Luo Y, Guo
H, Chen J, Tan Z, Yang Y and Xie L: Identification and integrate
analysis of key biomarkers for diagnosis and prognosis of non-small
cell lung cancer based on bioinformatics analysis. Technol Cancer
Res Treat. 20(15330338211060202)2021.PubMed/NCBI View Article : Google Scholar
|
|
12
|
Thoma OM, Neurath MF and Waldner MJ:
Cyclin-dependent kinase inhibitors and their therapeutic potential
in colorectal cancer treatment. Front Pharmacol.
12(757120)2021.PubMed/NCBI View Article : Google Scholar
|
|
13
|
Susanti NMP and Tjahjono DH:
Cyclin-dependent kinase 4 and 6 inhibitors in cell cycle
dysregulation for breast cancer treatment. Molecules.
26(4462)2021.PubMed/NCBI View Article : Google Scholar
|
|
14
|
Hou J, Aerts J, den Hamer B, van Ijcken W,
den Bakker M, Riegman P, van der Leest C, van der Spek P, Foekens
JA, Hoogsteden HC, et al: Gene expression-based classification of
non-small cell lung carcinomas and survival prediction. PLoS One.
5(e10312)2010.PubMed/NCBI View Article : Google Scholar
|
|
15
|
Quek K, Li J, Estecio M, Zhang J, Fujimoto
J, Roarty E, Little L, Chow CW, Song X, Behrens C, et al: DNA
methylation intratumor heterogeneity in localized lung
adenocarcinomas. Oncotarget. 8:21994–22002. 2017.PubMed/NCBI View Article : Google Scholar
|
|
16
|
Zhang Y, Foreman O, Wigle DA, Kosari F,
Vasmatzis G, Salisbury JL, van Deursen J and Galardy PJ: USP44
regulates centrosome positioning to prevent aneuploidy and suppress
tumorigenesis. J Clin Invest. 122:4362–4374. 2012.PubMed/NCBI View Article : Google Scholar
|
|
17
|
Gautier L, Cope L, Bolstad BM and Irizarry
RA: Affy-analysis of Affymetrix GeneChip data at the probe level.
Bioinformatics. 20:307–315. 2004.PubMed/NCBI View Article : Google Scholar
|
|
18
|
Ritchie ME, Phipson B, Wu D, Hu Y, Law CW,
Shi W and Smyth GK: limma powers differential expression analyses
for RNA-sequencing and microarray studies. Nucleic Acids Res.
43(e47)2015.PubMed/NCBI View Article : Google Scholar
|
|
19
|
Kolde R, Laur S, Adler P and Vilo J:
Robust rank aggregation for gene list integration and
meta-analysis. Bioinformatics. 28:573–580. 2012.PubMed/NCBI View Article : Google Scholar
|
|
20
|
Yan S, Wang W, Gao G, Cheng M, Wang X,
Wang Z, Ma X, Chai C and Xu D: Key genes and functional
coexpression modules involved in the pathogenesis of systemic lupus
erythematosus. J Cell Physiol. 233:8815–8825. 2018.PubMed/NCBI View Article : Google Scholar
|
|
21
|
Sherman BT, Hao M, Qiu J, Jiao X, Baseler
MW, Lane HC, Imamichi T and Chang W: DAVID: A web server for
functional enrichment analysis and functional annotation of gene
lists (2021 update). Nucleic Acids Res. 50 (W1):W216–W221.
2022.PubMed/NCBI View Article : Google Scholar : (Epub ahead of
print).
|
|
22
|
Yu G, Wang LG, Han Y and He QY:
clusterProfiler: An R package for comparing biological themes among
gene clusters. OMICS. 16:284–287. 2012.PubMed/NCBI View Article : Google Scholar
|
|
23
|
Szklarczyk D, Morris JH, Cook H, Kuhn M,
Wyder S, Simonovic M, Santos A, Doncheva NT, Roth A, Bork P, et al:
The STRING database in 2017: Quality-controlled protein-protein
association networks, made broadly accessible. Nucleic Acids Res.
45 (D1):D362–D368. 2017.PubMed/NCBI View Article : Google Scholar
|
|
24
|
Shannon P, Markiel A, Ozier O, Baliga NS,
Wang JT, Ramage D, Amin N, Schwikowski B and Ideker T: Cytoscape: A
software environment for integrated models of biomolecular
interaction networks. Genome Res. 13:2498–2504. 2003.PubMed/NCBI View Article : Google Scholar
|
|
25
|
Bader GD and Hogue CW: An automated method
for finding molecular complexes in large protein interaction
networks. BMC Bioinformatics. 4(2)2003.PubMed/NCBI View Article : Google Scholar
|
|
26
|
Assenov Y, Ramírez F, Schelhorn SE,
Lengauer T and Albrecht M: Computing topological parameters of
biological networks. Bioinformatics. 24:282–284. 2008.PubMed/NCBI View Article : Google Scholar
|
|
27
|
Tang Z, Li C, Kang B, Gao G, Li C and
Zhang Z: GEPIA: A web server for cancer and normal gene expression
profiling and interactive analyses. Nucleic Acids Res. 45
(W1):W98–W102. 2017.PubMed/NCBI View Article : Google Scholar
|
|
28
|
Rouillard AD, Gundersen GW, Fernandez NF,
Wang Z, Monteiro CD, McDermott MG and Ma'ayan A: The harmonizome: A
collection of processed datasets gathered to serve and mine
knowledge about genes and proteins. Database (Oxford).
2016(baw100)2016.PubMed/NCBI View Article : Google Scholar
|
|
29
|
Chandrashekar DS, Bashel B, Balasubramanya
SAH, Creighton CJ, Ponce-Rodriguez I, Chakravarthi BVSK and
Varambally S: UALCAN: A Portal for facilitating tumor subgroup gene
expression and survival analyses. Neoplasia. 19:649–658.
2017.PubMed/NCBI View Article : Google Scholar
|
|
30
|
Livak KJ and Schmittgen TD: Analysis of
relative gene expression data using real-time quantitative PCR and
the 2(-Delta Delta C(T)) method. Methods. 25:402–408.
2001.PubMed/NCBI View Article : Google Scholar
|
|
31
|
Landi MT, Dracheva T, Rotunno M, Figueroa
JD, Liu H, Dasgupta A, Mann FE, Fukuoka J, Hames M, Bergen AW, et
al: Gene expression signature of cigarette smoking and its role in
lung adenocarcinoma development and survival. PLoS One.
3(e1651)2008.PubMed/NCBI View Article : Google Scholar
|
|
32
|
Girard L, Rodriguez-Canales J, Behrens C,
Thompson DM, Botros IW, Tang H, Xie Y, Rekhtman N, Travis WD,
Wistuba II, et al: An expression signature as an aid to the
histologic classification of non-small cell lung cancer. Clin
Cancer Res. 22:4880–4889. 2016.PubMed/NCBI View Article : Google Scholar
|
|
33
|
Venables WN and Ripley BD: Modern applied
statistics with S. 4th edition. Statistics and Computing, 2002.
|
|
34
|
Dobson AJ: An introduction to generalized
linear models, second edition. Chapman & Hall/crc, 2001.
|
|
35
|
Harrell FE Jr: Regression modeling
strategies: With applications to linear models, logistic
regression, and survival analysis. Springer, 2010.
|
|
36
|
Robin X, Turck N, Hainard A, Tiberti N,
Lisacek F, Sanchez JC and Müller M: pROC: An open-source package
for R and S+ to analyze and compare ROC curves. BMC Bioinformatics.
12(77)2011.PubMed/NCBI View Article : Google Scholar
|
|
37
|
Eichhorn JM, Kothari A and Chambers TC:
Cyclin B1 overexpression induces cell death independent of mitotic
arrest. PLoS One. 9(e113283)2014.PubMed/NCBI View Article : Google Scholar
|
|
38
|
Gavet O and Pines J: Progressive
activation of CyclinB1-Cdk1 coordinates entry to mitosis. Dev Cell.
18:533–543. 2010.PubMed/NCBI View Article : Google Scholar
|
|
39
|
Chang CC, Hung CM, Yang YR, Lee MJ and Hsu
YC: Sulforaphane induced cell cycle arrest in the G2/M phase via
the blockade of cyclin B1/CDC2 in human ovarian cancer cells. J
Ovarian Res. 6(41)2013.PubMed/NCBI View Article : Google Scholar
|
|
40
|
Chu R, Terrano DC and Chambers TC:
Cdk1/cyclin B plays a key role in mitotic arrest-induced apoptosis
by phosphorylation of Mcl-1, promoting its degradation and freeing
Bak from sequestration. Biochem Pharmacol. 83:199–206.
2012.PubMed/NCBI View Article : Google Scholar
|
|
41
|
Ye C, Wang J, Wu P, Li X and Chai Y:
Prognostic role of cyclin B1 in solid tumors: A meta-analysis.
Oncotarget. 8:2224–2232. 2017.PubMed/NCBI View Article : Google Scholar
|
|
42
|
Zhao P, Zhang P, Hu W, Wang H, Yu G, Wang
Z, Li C, Bai J and Zhang Y: Upregulation of cyclin B1 plays
potential roles in the invasiveness of pituitary adenomas. J Clin
Neurosci. 43:267–273. 2017.PubMed/NCBI View Article : Google Scholar
|
|
43
|
Chen EB, Qin X, Peng K, Li Q, Tang C, Wei
YC, Yu S, Gan L and Liu TS: HnRNPR-CCNB1/CENPF axis contributes to
gastric cancer proliferation and metastasis. Aging (Albany NY).
11:7473–4791. 2019.PubMed/NCBI View Article : Google Scholar
|
|
44
|
Zhang H, Zhang X, Li X, Meng WB, Bai ZT,
Rui SZ, Wang ZF, Zhou WC and Jin XD: Effect of CCNB1 silencing on
cell cycle, senescence, and apoptosis through the p53 signaling
pathway in pancreatic cancer. J Cell Physiol. 234:619–631.
2018.PubMed/NCBI View Article : Google Scholar
|
|
45
|
Sarafan-Vasseur N, Lamy A, Bourguignon J,
Le Pessot F, Hieter P, Sesboüé R, Bastard C, Frébourg T and Flaman
JM: Overexpression of B-type cyclins alters chromosomal
segregation. Oncogene. 21:2051–2057. 2002.PubMed/NCBI View Article : Google Scholar
|
|
46
|
Qian X, Song X, He Y, Yang Z, Sun T, Wang
J, Zhu G, Xing W and You C: CCNB2 overexpression is a poor
prognostic biomarker in Chinese NSCLC patients. Biomed
Pharmacother. 74:222–227. 2015.PubMed/NCBI View Article : Google Scholar
|
|
47
|
Lei CY, Wang W, Zhu YT, Fang WY and Tan
WL: The decrease of cyclin B2 expression inhibits invasion and
metastasis of bladder cancer. Urol Oncol. 34:237.e1–e10.
2016.PubMed/NCBI View Article : Google Scholar
|
|
48
|
Li R, Jiang X, Zhang Y, Wang S, Chen X, Yu
X, Ma J and Huang X: Cyclin B2 overexpression in human
hepatocellular carcinoma is associated with poor prognosis. Arch
Med Res. 50:10–17. 2019.PubMed/NCBI View Article : Google Scholar
|
|
49
|
Wang X, Xiao H, Wu D, Zhang D and Zhang Z:
miR-335-5p regulates cell cycle and metastasis in lung
adenocarcinoma by targeting CCNB2. Onco Targets Ther. 13:6255–6263.
2020.PubMed/NCBI View Article : Google Scholar
|
|
50
|
Lees EM and Harlow E: Sequences within the
conserved cyclin box of human cyclin A are sufficient for binding
to and activation of cdc2 kinase. Mol Cell Biol. 13:1194–1201.
1993.PubMed/NCBI View Article : Google Scholar
|
|
51
|
Jiang P, Zhang M, Gui L and Zhang K:
Expression patterns and prognostic values of the cyclin-dependent
kinase 1 and cyclin A2 gene cluster in pancreatic adenocarcinoma. J
Int Med Res. 48(300060520930113)2020.PubMed/NCBI View Article : Google Scholar
|
|
52
|
Brcic L, Heidinger M, Sever AZ, Zacharias
M, Jakopovic M, Fediuk M, Maier A, Quehenberger F, Seiwerth S and
Popper H: Prognostic value of cyclin A2 and B1 expression in lung
carcinoids. Pathology. 51:481–486. 2019.PubMed/NCBI View Article : Google Scholar
|
|
53
|
Ko E, Kim Y, Cho EY, Han J, Shim YM, Park
J and Kim DH: Synergistic effect of Bcl-2 and cyclin A2 on adverse
recurrence-free survival in stage I non-small cell lung cancer. Ann
Surg Oncol. 20:1005–1012. 2013.PubMed/NCBI View Article : Google Scholar
|
|
54
|
Li Z, Zhang Y, Zhou Y, Wang F, Yin C, Ding
L and Zhang S: Tanshinone IIA suppresses the progression of lung
adenocarcinoma through regulating CCNA2-CDK2 complex and AURKA/PLK1
pathway. Sci Rep. 11(23681)2021.PubMed/NCBI View Article : Google Scholar
|
|
55
|
Wang Y, Zhong Q, Li Z, Lin Z, Chen H and
Wang P: Integrated profiling identifies CCNA2 as a potential
biomarker of immunotherapy in breast cancer. Onco Targets Ther.
14:2433–2448. 2021.PubMed/NCBI View Article : Google Scholar
|
|
56
|
Lee Y, Lee CE, Oh S, Kim H, Lee J, Kim SB
and Kim HS: Pharmacogenomic analysis reveals CCNA2 as a predictive
biomarker of sensitivity to polo-like kinase I inhibitor in gastric
cancer. Cancers (Basel). 12(1418)2020.PubMed/NCBI View Article : Google Scholar
|
|
57
|
Priller M, Pöschl J, Abrão L, von Bueren
AO, Cho YJ, Rutkowski S, Kretzschmar HA and Schüller U: Expression
of FoxM1 is required for the proliferation of medulloblastoma cells
and indicates worse survival of patients. Clin Cancer Res.
17:6791–6801. 2011.PubMed/NCBI View Article : Google Scholar
|
|
58
|
Liu B, Su F, Lin R, Teng H and Ju Y:
Overexpression of forkhead box M1 is associated poor survival in
patients with nonsmall cell lung cancer. J Cancer Res Ther. 14
(Suppl):S1121–S1123. 2018.PubMed/NCBI View Article : Google Scholar
|
|
59
|
Liang SK, Hsu CC, Song HL, Huang YC, Kuo
CW, Yao X, Li CC, Yang HC, Hung YL, Chao SY, et al: FOXM1 is
required for small cell lung cancer tumorigenesis and associated
with poor clinical prognosis. Oncogene. 40:4847–4858.
2021.PubMed/NCBI View Article : Google Scholar
|
|
60
|
Yi L, Wang H, Li W, Ye K, Xiong W, Yu H
and Jin X: The FOXM1/RNF26/p57 axis regulates the cell cycle to
promote the aggressiveness of bladder cancer. Cell Death Dis.
12(944)2021.PubMed/NCBI View Article : Google Scholar
|
|
61
|
Chen X, Müller GA, Quaas M, Fischer M, Han
N, Stutchbury B, Sharrocks AD and Engeland K: The forkhead
transcription factor FOXM1 controls cell cycle-dependent gene
expression through an atypical chromatin binding mechanism. Mol
Cell Biol. 33:227–236. 2013.PubMed/NCBI View Article : Google Scholar
|
|
62
|
Li S, Liu N, Piao J, Meng F and Li Y:
CCNB1 expedites the progression of cervical squamous cell carcinoma
via the regulation by FOXM1. Onco Targets Ther. 13:12383–12395.
2020.PubMed/NCBI View Article : Google Scholar
|
|
63
|
Chai N, Xie HH, Yin JP, Sa KD, Guo Y, Wang
M, Liu J, Zhang XF, Zhang X, Yin H, et al: FOXM1 promotes
proliferation in human hepatocellular carcinoma cells by
transcriptional activation of CCNB1. Biochem Biophys Res Commun.
500:924–929. 2018.PubMed/NCBI View Article : Google Scholar
|
|
64
|
Li J, Zhou L, Liu Y, Yang L, Jiang D, Li
K, Xie S, Wang X and Wang S: Comprehensive analysis of cyclin
family gene expression in colon cancer. Front Oncol.
11(674394)2021.PubMed/NCBI View Article : Google Scholar
|