Introduction
Osteosarcoma is the most prevalent primary malignant
bone cancer worldwide, characterized by early lung metastasis and
poor prognosis, which poses threats to adolescents and young adults
(coinciding with rapid bone growth) due to complications and distal
metastasis (1,2). Despite progress in modern treatment
for osteosarcoma, including chemotherapy, surgery, neoadjuvant
therapy and combination therapy, the cure rate is poor and the
5-year survival rate of patients with osteosarcoma remains <30%
due to the highly aggressive behaviors of osteosarcoma cells and
propensity to metastasize (3,4).
Therefore, it is imperative to uncover the molecular mechanisms
responsible for osteosarcoma occurrence to discover a novel and
effective target for therapeutic intervention.
Apolipoprotein C1 (APOC1), located at 19q13.32, is a
member of the apolipoprotein C family. As a component of
triglyceride-rich and high-density lipoproteins, APOC1 serves a
significant role in lipid transport and metabolism (5,6). The
key role of APOC1 in the occurrence and development of numerous
cancers has been highlighted by an increasing number of studies
(7-9).
For example, APOC1 has been reported as a novel prognostic
biomarker in colorectal cancer for its inhibitory effects on
progression of colorectal cancer (7). Shi et al (8) demonstrated the pro-carcinogenic
effects of APOC1 in the pathogenesis of cervical cancer. By
suppressing cell proliferation, migration and invasion, APOC1
silencing has an inhibitory effect on the progression of esophageal
cancer (9). APOC1 expression is
continuously upregulated in osteosarcoma tissue samples during the
occurrence and metastasis of osteosarcoma, as demonstrated by the
analysis of gene expression profiles (10). However, the specific effects of
APOC1 on the development of osteosarcoma remain to be
elucidated.
As an important regulator of mitochondrial
metabolism and cell death, MTCH2 expression is upregulated in
clinical osteosarcoma samples (11,12).
MTCH2 is a suppressor of oxidative phosphorylation (OXPHOS), and
the metabolic switch from OXPHOS to glycolysis is a hallmark of
osteosarcoma (13,14). Under aerobic conditions, most
normal differentiated cells generate energy by mitochondrial OXPHOS
(15). By contrast, most cancer
cells undergo glycolysis even in the presence of sufficient oxygen,
which stimulates tumor cells to gain sufficient energy for
proliferation and distant metastasis; this phenomenon was first
reported by Otto Warburg and is known as the Warburg effect
(16-18).
Upregulation of OXPHOS and inhibition of glycolysis can restrain
proliferation of osteosarcoma cells (19). Therefore, it was hypothesized that
APOC1 could interact with MTCH2 to promote the Warburg effect and
malignant development of osteosarcoma cells.
In the present study, the effects of APOC1 on the
proliferation, apoptosis, invasion and migration of osteosarcoma
cells were investigated. Whether APOC1 affects the progression of
osteosarcoma by binding to MTCH2 was also investigated. The present
study aimed to provide new insights into the pathogenesis of
osteosarcoma and identify novel targets for the treatment of this
disease.
Materials and methods
Bioinformatics tools
The Biological General Repository for Interaction
Datasets (BioGRID) (20) and
Search Tool for the Retrieval of Interacting Genes/Proteins
(STRING) databases (21) were
employed to predict the interaction between APOC1 and MTCH2.
Cell culture
Human osteosarcoma (HOS, SAOS-2, 143B and U2OS) and
the human osteoblast cell line hFOB1.19 were obtained from the Type
Culture Collection of the Chinese Academy of Sciences. HOS, SAOS-2,
143B and U2OS cells were cultured using RPMI-1640 medium (HyClone;
Cytiva) and hFOB1.19 cells were cultivated in DMEM (HyClone;
Cytiva) in a humid atmosphere with 5% CO2 at 37˚C. All
media were mixed with 10% fetal bovine serum (FBS; Gibco; Thermo
Fisher Scientific, Inc.).
Cell transfection
For transfection, short hairpin RNAs (shRNAs)
targeting APOC1 (sh-APOC1-1, 5'-TTCAGAAAGTGAAGGAGAAAC-3' and
sh-APOC1-2, 5'-GTCTCCAGTGCCTTGGATAAG-3'), corresponding negative
control (sh-NC, 5'-UUCUCCGAACGUGUCACGUTT-3'), MTCH2 pcDNA3.1
plasmid (Oe-MTCH2; cat. no. NM_001317231.2) and the empty vector
control (Oe-NC) were supplied by Guangzhou RiboBio Co., Ltd. SAOS-2
cells were cultured in 6-well plates to 70% confluence at 37˚C.
Subsequently, transfection with a final concentration of 50 nM
shRNA and/or 15 nM overexpression vectors was performed using the
Lipofectamine® 2000 (Invitrogen; Thermo Fisher
Scientific, Inc.) for 48 h at 37˚C as per the manufacturer's
instructions. At 48 h after transfection, transfection efficiency
was evaluated by reverse transcription-quantitative PCR (RT-qPCR)
and western blot analysis.
Cell viability assay
The viability of SAOS-2 cells was tested using Cell
Counting Kit-8 (CCK-8; Beijing Solarbio Science & Technology
Co., Ltd.) assay according to the manufacturer's protocol.
Following transfection, SAOS-2 cells were plated in 96-well plates
at a density of 1x10⁴ cells/well for 24, 48 and 72 h at
37˚C. Then, at the end of each incubation time point, the 10 µl
CCK-8 solution was added to each well. The absorbance at 450 nm was
detected using a microplate reader (Agilent Technologies, Inc.)
following incubation with CCK-8 solution for 4 h.
Colony formation assay
The proliferation of SAOS-2 cells after transfection
was determined by colony formation assay. Briefly, SAOS-2 cells
(500 cells/well) were seeded in 6-well plates. Following incubation
in RPMI-1640 medium at 37˚C for 2 weeks, cells were fixed with
methanol at room temperature for 30 min and stained with 0.5%
crystal violet solution for 30 min at room temperature. Colonies
(>50 cells) were counted manually in five fields of view using
an inverted light microscope (Olympus Corporation; magnification,
x10).
Cell apoptosis analysis
TUNEL assay kit (Invitrogen; Thermo Fisher
Scientific, Inc.) was used to assess cell apoptosis according to
the manufacturer's instructions. Fixation and permeabilization of
SAOS-2 cells were performed with 4% paraformaldehyde at room
temperature for 15 min and 0.25% Triton-X 100 for 20 min at room
temperature, respectively. Subsequently, cells were labeled with
TUNEL at 37˚C for 1 h, mounted with Vectashield® mounting medium
containing 1 mg/ml DAPI at 37˚C for 10 min away from light.
Finally, images of the positive apoptotic cells were acquired with
a fluorescence microscope (Olympus Corporation; magnification,
x200) in five random fields and quantified by ImageJ software
(v1.8.0; National Institutes of Health).
Transwell invasion assay
To evaluate invasion of SAOS-2 cells, the upper
chamber of a Transwell chamber (Becton, Dickinson and Company) with
an 8-µm pore size was pre-coated with Matrigel (Corning, Inc.) at
37˚C for 1 h. A total of 5x10⁴ cells suspended in
serum-free RPMI-1640 medium (HyClone; Cytiva) were seeded in the
upper chamber. The lower chamber was filled with 600 µl RPMI-1640
medium (HyClone; Cytiva) containing 10% FBS (Gibco; Thermo Fisher
Scientific, Inc.). After 24 h at 37˚C, invaded cells were fixed
using 4% paraformaldehyde at room temperature for 30 min and
stained with 0.1% crystal violet at room temperature for 20 min.
Images of invasive cells were taken by a light microscope (Olympus
Corporation) at a magnification of x100.
Wound healing assay
The migratory ability of SAOS-2 cells was assessed
via wound healing assay. Transfected SAOS-2 cells were incubated in
6-well plates using serum-free RPMI-1640 medium (HyClone; Cytiva)
at 37˚C for 24 h until cells reached 90% confluence. Subsequently,
uniform wounds were scraped with a 200-µl sterile tip across the
monolayer of cells. PBS was used to remove cell debris. Then, the
medium was replaced with serum-free RPMI-1640 medium (HyClone;
Cytiva) and cells were cultured at 37˚C for 24 h. Images at 0 and
24 h after wounding were captured by a light microscope (Olympus
Corporation) at a magnification of x100. The distance of cell
migration was quantified using the following equation: Migration
(%)=[(0 h average scratch distance-24 h average scratch distance)/0
h average scratch distance] x100.
Co-immunoprecipitation (Co-IP)
assay
SAOS-2 cells were lysed in RIPA buffer (Protech
Technology Enterprise Co., Ltd.) including protease inhibitors at
4˚C to obtain the protein. Subsequently, samples (250 µl) were
incubated overnight at 4˚C with IgG (1:50; cat. no. ab172730;
Abcam), anti-APOC1 (1:40; ab198288; Abcam) or anti-MTCH2 antibodies
(1:50; 16888-1-AP; Proteintech). A total of 30 µl protein A/G
magnetic beads (MilliporeSigma) was added and incubated overnight
at 4˚C. The beads were washed with PBS and immunoprecipitants were
assessed via western blotting.
Measurement of glucose metabolism
Seahorse XF Cell Mito Stress Test kit (Agilent
Technologies, Inc.) was used to determine the O2
consumption rate (OCR) and Seahorse XF Glycolysis Stress Test kit
was used to examine the extracellular acidification rate (ECAR), as
previously described (19). The
transfected SAOS-2 cells (1x10⁵) were plated onto a
Seahorse XF-96 cell culture microplate. Cells were next
equilibrated with XF Base media (Agilent Technologies Deutschland
GmbH) at 37˚C for 1 h in an incubator lacking CO2 and
then serum-starved for 1 h in glucose-free media-containing
treatments (Invitrogen; Thermo Fisher Scientific, Inc.). A total of
1 mM oligomycin, 1 mM p-trifluoromethoxy carbonyl cyanide
phenylhydrazone (MilliporeSigma), 2 mM antimycin A (MilliporeSigma)
and 2 mM rotenone (MilliporeSigma) were added to each well at 37˚C
overnight to detect the OCR. For the measurement of ECAR, each well
contained 10 mM glucose, 1 mM oligomycin (MilliporeSigma) and 80 mM
2-deoxyglucose (MilliporeSigma) at 37˚C overnight. A Seahorse XF-96
analyzer (Agilent Technologies, Inc.) was used to detect the
samples and data were assessed using Seahorse XFe24 Wave version
2.2 software (Agilent Technologies, Inc.).
Detection of lactate production
The generation of lactate in SAOS-2 cells in a
96-well plate at a density of 5x10³ cells per well
following transfection was examined using a lactate assay kit (cat.
no. A020-2-2; Nanjing Jiancheng Bioengineering Institute),
according to the manufacturer's protocol. All values were
normalized to cellular protein level.
Phosphofructokinase (PFK), pyruvate
kinase (PK) and hexokinase (HK) activity measurement
Cells were seeded into 6-well plates at a density of
2x10⁶ cells/well. By using PFK (cat. no. A129-1-1), PK
(cat. no. A076-1-1) and HK (cat. no. A077-3-1) assay kit provided
by Nanjing Jiancheng Bioengineering Institute, the levels of PFK,
PK and HK were estimated according to the manufacturer's
protocols.
RT-qPCR
Total RNA was isolated from HOS, SAOS-2, 143B, U2OS
and hFOB1.19 cells using TRIzol® (Invitrogen; Thermo
Fisher Scientific, Inc.). RNA quality was assessed using a
NanoDrop™ 2000 spectrophotometer (Thermo Fisher Scientific, Inc.).
RNA samples with A260/A280 ratio between 1.8 and 2.0 were used in
RT to synthesize complementary DNA (cDNA). RT was performed to
generate cDNA using the PrimeScript RT reagent kit (Takara
Biotechnology Co., Ltd.), according to the manufacturer's protocol.
The detection of mRNA expression was performed in an ABI 7500
system (Applied Biosystems; Thermo Fisher Scientific, Inc.) with a
QuantiNova® SYBR® Green PCR kit (Qiagen
GmbH). The following thermocycling conditions were used: Initial
denaturation at 95˚C for 10 min; followed by 35 cycles of
denaturation at 95˚C for 15 sec, annealing at 60˚C for 1 min and
extension of 10 min at 65˚C. Primers pairs used in the present
study were as follows: APOC1 forward, 5'-CTGAGTGGGGAAAGGGACTA-3'
and reverse, 5'-GGAGGGGCACTCTCTCAATC-3'; MTCH2 forward,
5'-AAAGTGCTCATCCAGGTGGG-3' and reverse, 5'-ACCACAGTTGTTGACAGCCA-3'
and GAPDH forward, 5'-GGAGCGAGATCCCTCCAAAAT-3' and reverse,
5'-GGCTGTTGTCATACTTCTCATGG-3'. Results were represented as fold
induction using the 2-ΔΔCq method (22). Primers were commercially
synthesized by Shanghai GenePharma Co., Ltd. GAPDH served as an
internal reference.
Western blot analysis
Protein was extracted from HOS, SAOS-2, 143B, U2OS
and hFOB1.19 cells using RIPA lysis buffer (Beyotime Institute of
Biotechnology) and protein concentrations were quantified using a
BCA kit (Beyotime Institute of Biotechnology). An equal amount of
cell extract (35 µg/lane) was electrophoresed on 12% SDS-PAGE. The
proteins were transferred to PVDF membranes (MilliporeSigma). Next,
the membranes were blocked for 1 h at room temperature in 5%
lipid-free milk solution. Following incubation with primary
antibodies diluted in TBS-0.1% Tween-20 (TBST) overnight at 4˚C,
the membranes were washed thrice with 0.1% TBST for 10 min each and
incubated with goat anti-rabbit horseradish peroxidase-conjugated
secondary antibody (cat. no. 7074; 1:5,000; Cell Signaling
Technology, Inc.) for 1 h at room temperature. ECL reagent (Pierce;
Thermo Fisher Scientific, Inc.) and the enhanced chemiluminescence
detection system (MilliporeSigma) were used to perform
visualization. Protein bands on the membrane were quantified using
ImageJ Software (v1.8.0; National Institutes of Health). GAPDH was
used as the loading control. The following primary antibodies were
used: Anti-APOC1 (cat. no. ab198288; 1:1,000; Abcam), anti-MTCH2
(cat. no. 16888-1-AP; 1:1,000; ProteinTech Group, Inc.), anti-Bcl-2
(cat. no. 4223T; 1:1,000; Cell Signaling Technology, Inc.),
anti-Bax (cat. no. 41162S; 1:1,000; Cell Signaling Technology,
Inc.), anti-cleaved-caspase 3 (cat. no. 9664T; 1:1,000; Cell
Signaling Technology, Inc.), anti-caspase 3 (cat. no. 14220T;
1:1,000; Cell Signaling Technology, Inc.), anti-matrix
metallopeptidase (MMP)2 (cat. no. 40994S; 1:1,000; Cell Signaling
Technology, Inc.), anti-MMP9 (cat. no. 13667T; 1:1,000; Cell
Signaling Technology, Inc.) and anti-GAPDH (cat. no. 5174T;
1:1,000; Cell Signaling Technology, Inc.) antibodies were
utilized.
Statistical analysis
Data from three independent replicates are presented
as the mean ± standard deviation and were analyzed using GraphPad
Prism version 8.0 (GraphPad Software, Inc.). Unpaired student's
t-test was used to analyze the means of two groups. One-way ANOVA
followed by Tukey's post-hoc test was used for comparisons between
>2 groups. P<0.05 was considered to indicate a statistically
significant difference.
Results
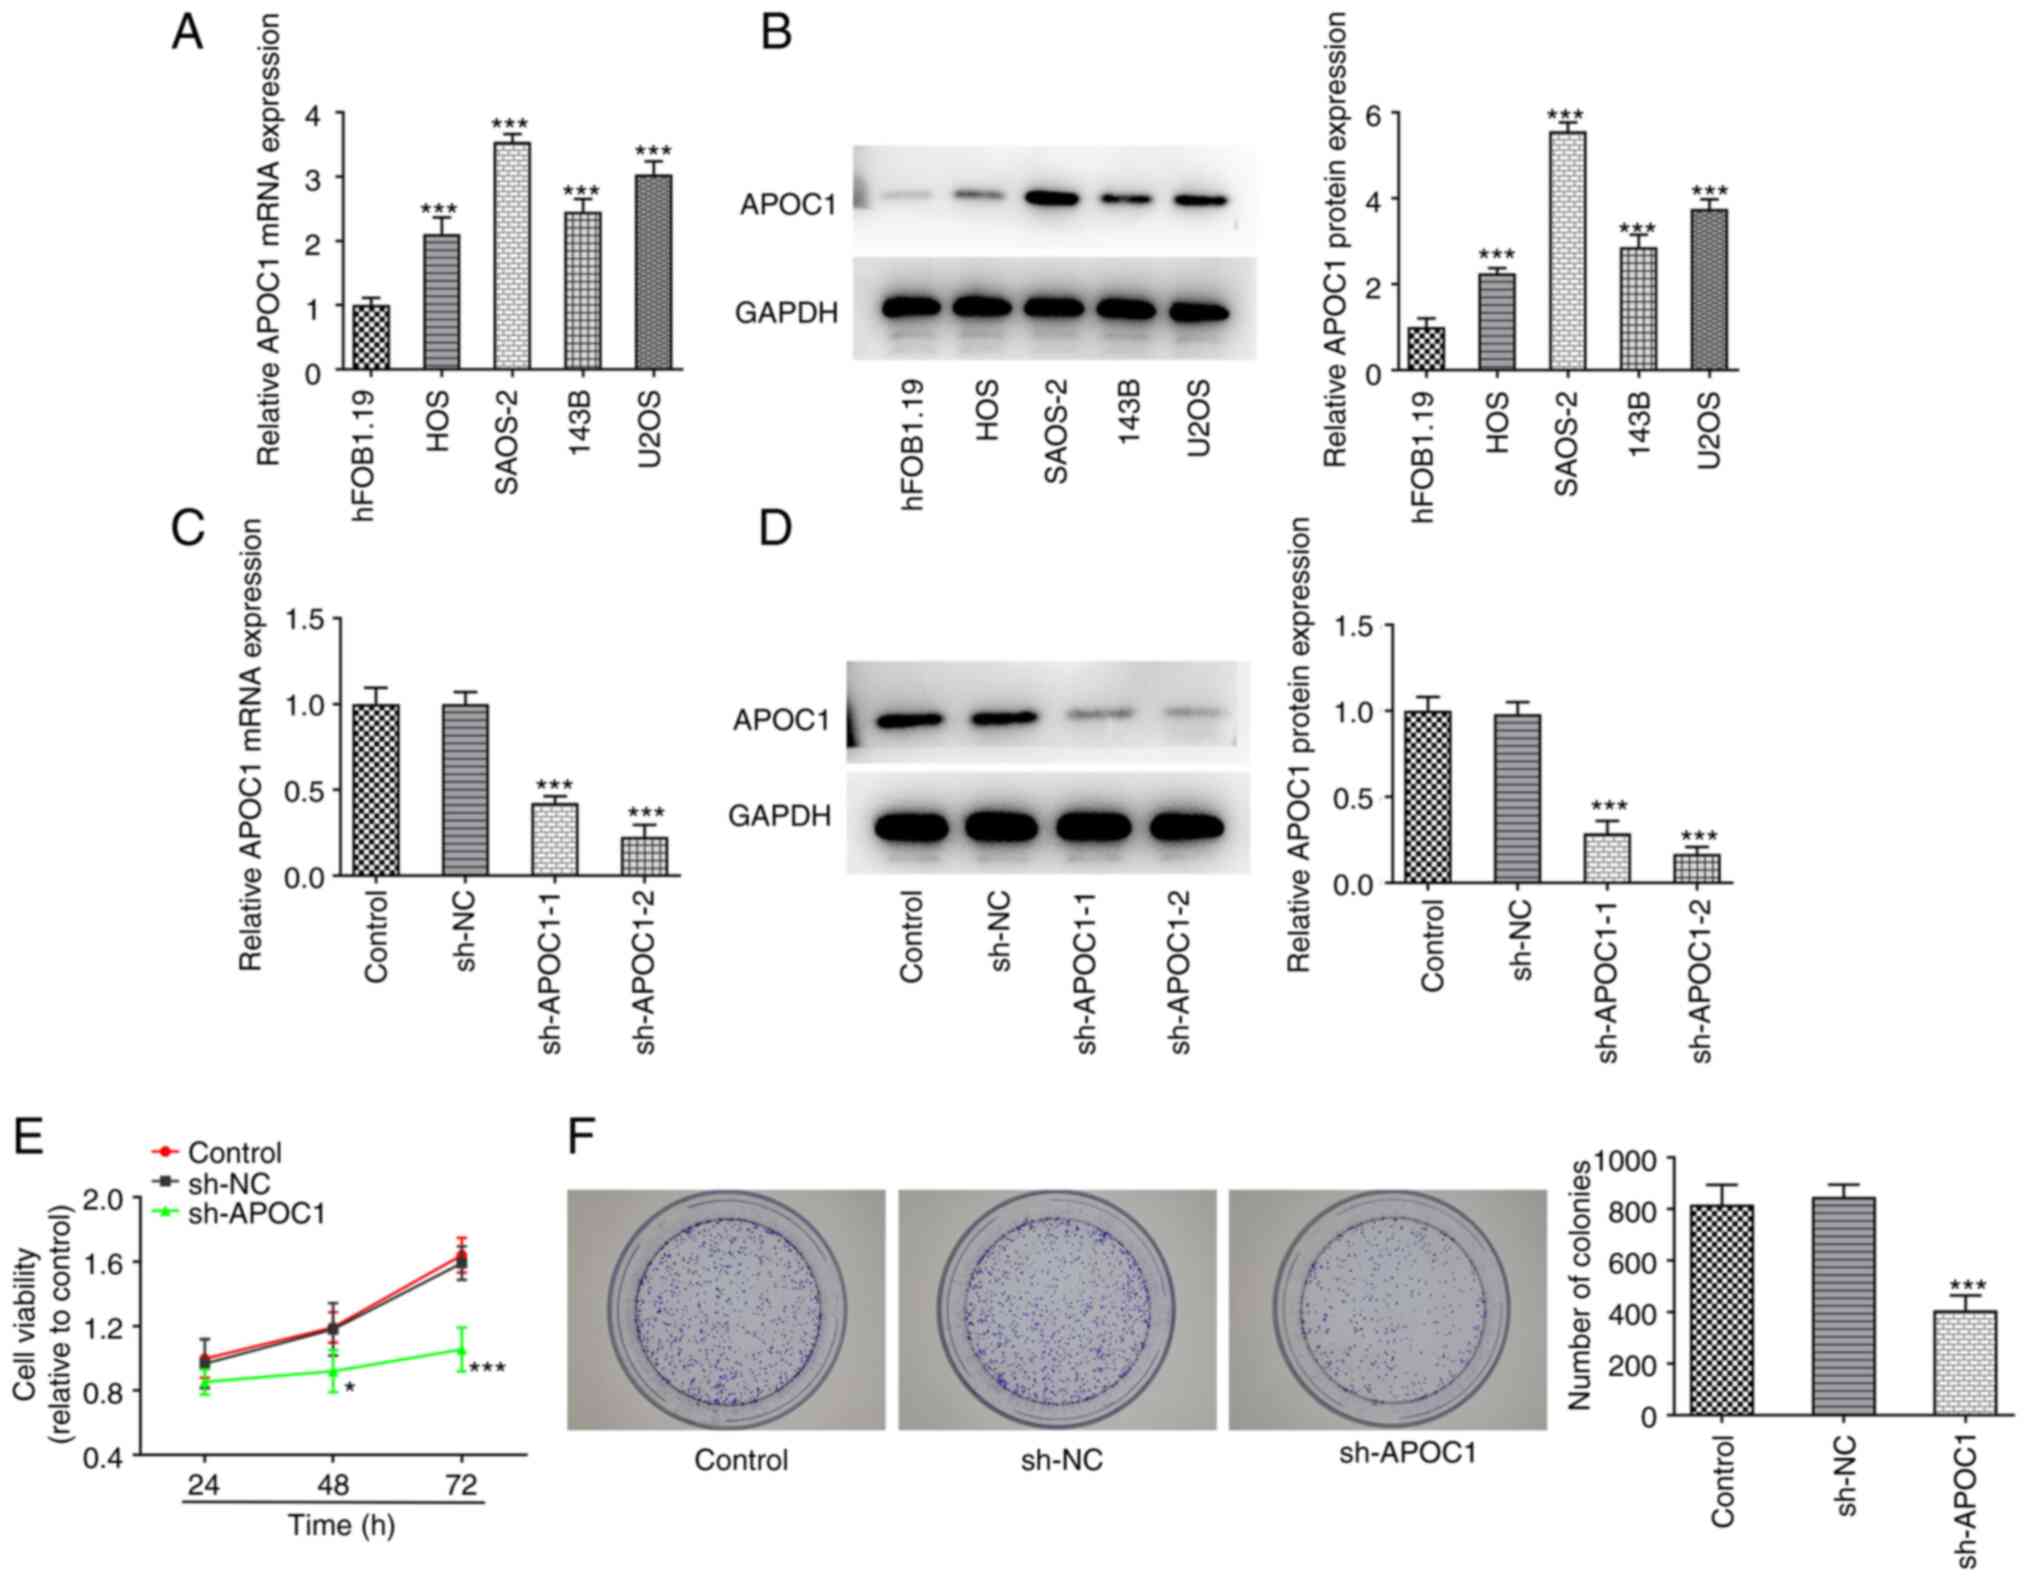
APOC1 is highly expressed in
osteosarcoma cells and APOC1 silencing inhibits proliferation and
promotes apoptosis of osteosarcoma cells
Osteosarcoma (HOS, SAOS-2, 143B and U2OS) and human
osteoblast cell line hFOB1.19 were used to evaluate expression of
APOC1. APOC1 expression was significantly upregulated in these
osteosarcoma cell lines compared with the hFOB1.19 cell line
(Fig. 1A and B). The highest APOC1 expression was
exhibited in SAOS-2 cells. Therefore, this cell line was selected
for subsequent experiments. APOC1 was silenced to investigate the
role of APOC1 in the proliferation and apoptosis of SAOS-2 cells.
APOC1 expression was significantly downregulated in both sh-APOC1-1
and sh-APOC1-2 groups when compared with the sh-NC group (Fig. 1C and D). sh-APOC1-2 possessed the better
knockdown efficiency and was selected for subsequent experiments.
Results of the CCK-8 assay suggested that the activity of SAOS-2
cells was significantly decreased after APOC1 silencing compared
with the sh-NC group at 48 and 72 h (Fig. 1E). Consistently, colony formation
assay indicated that APOC1 deletion inhibited cell proliferation
compared with the sh-NC group (Fig.
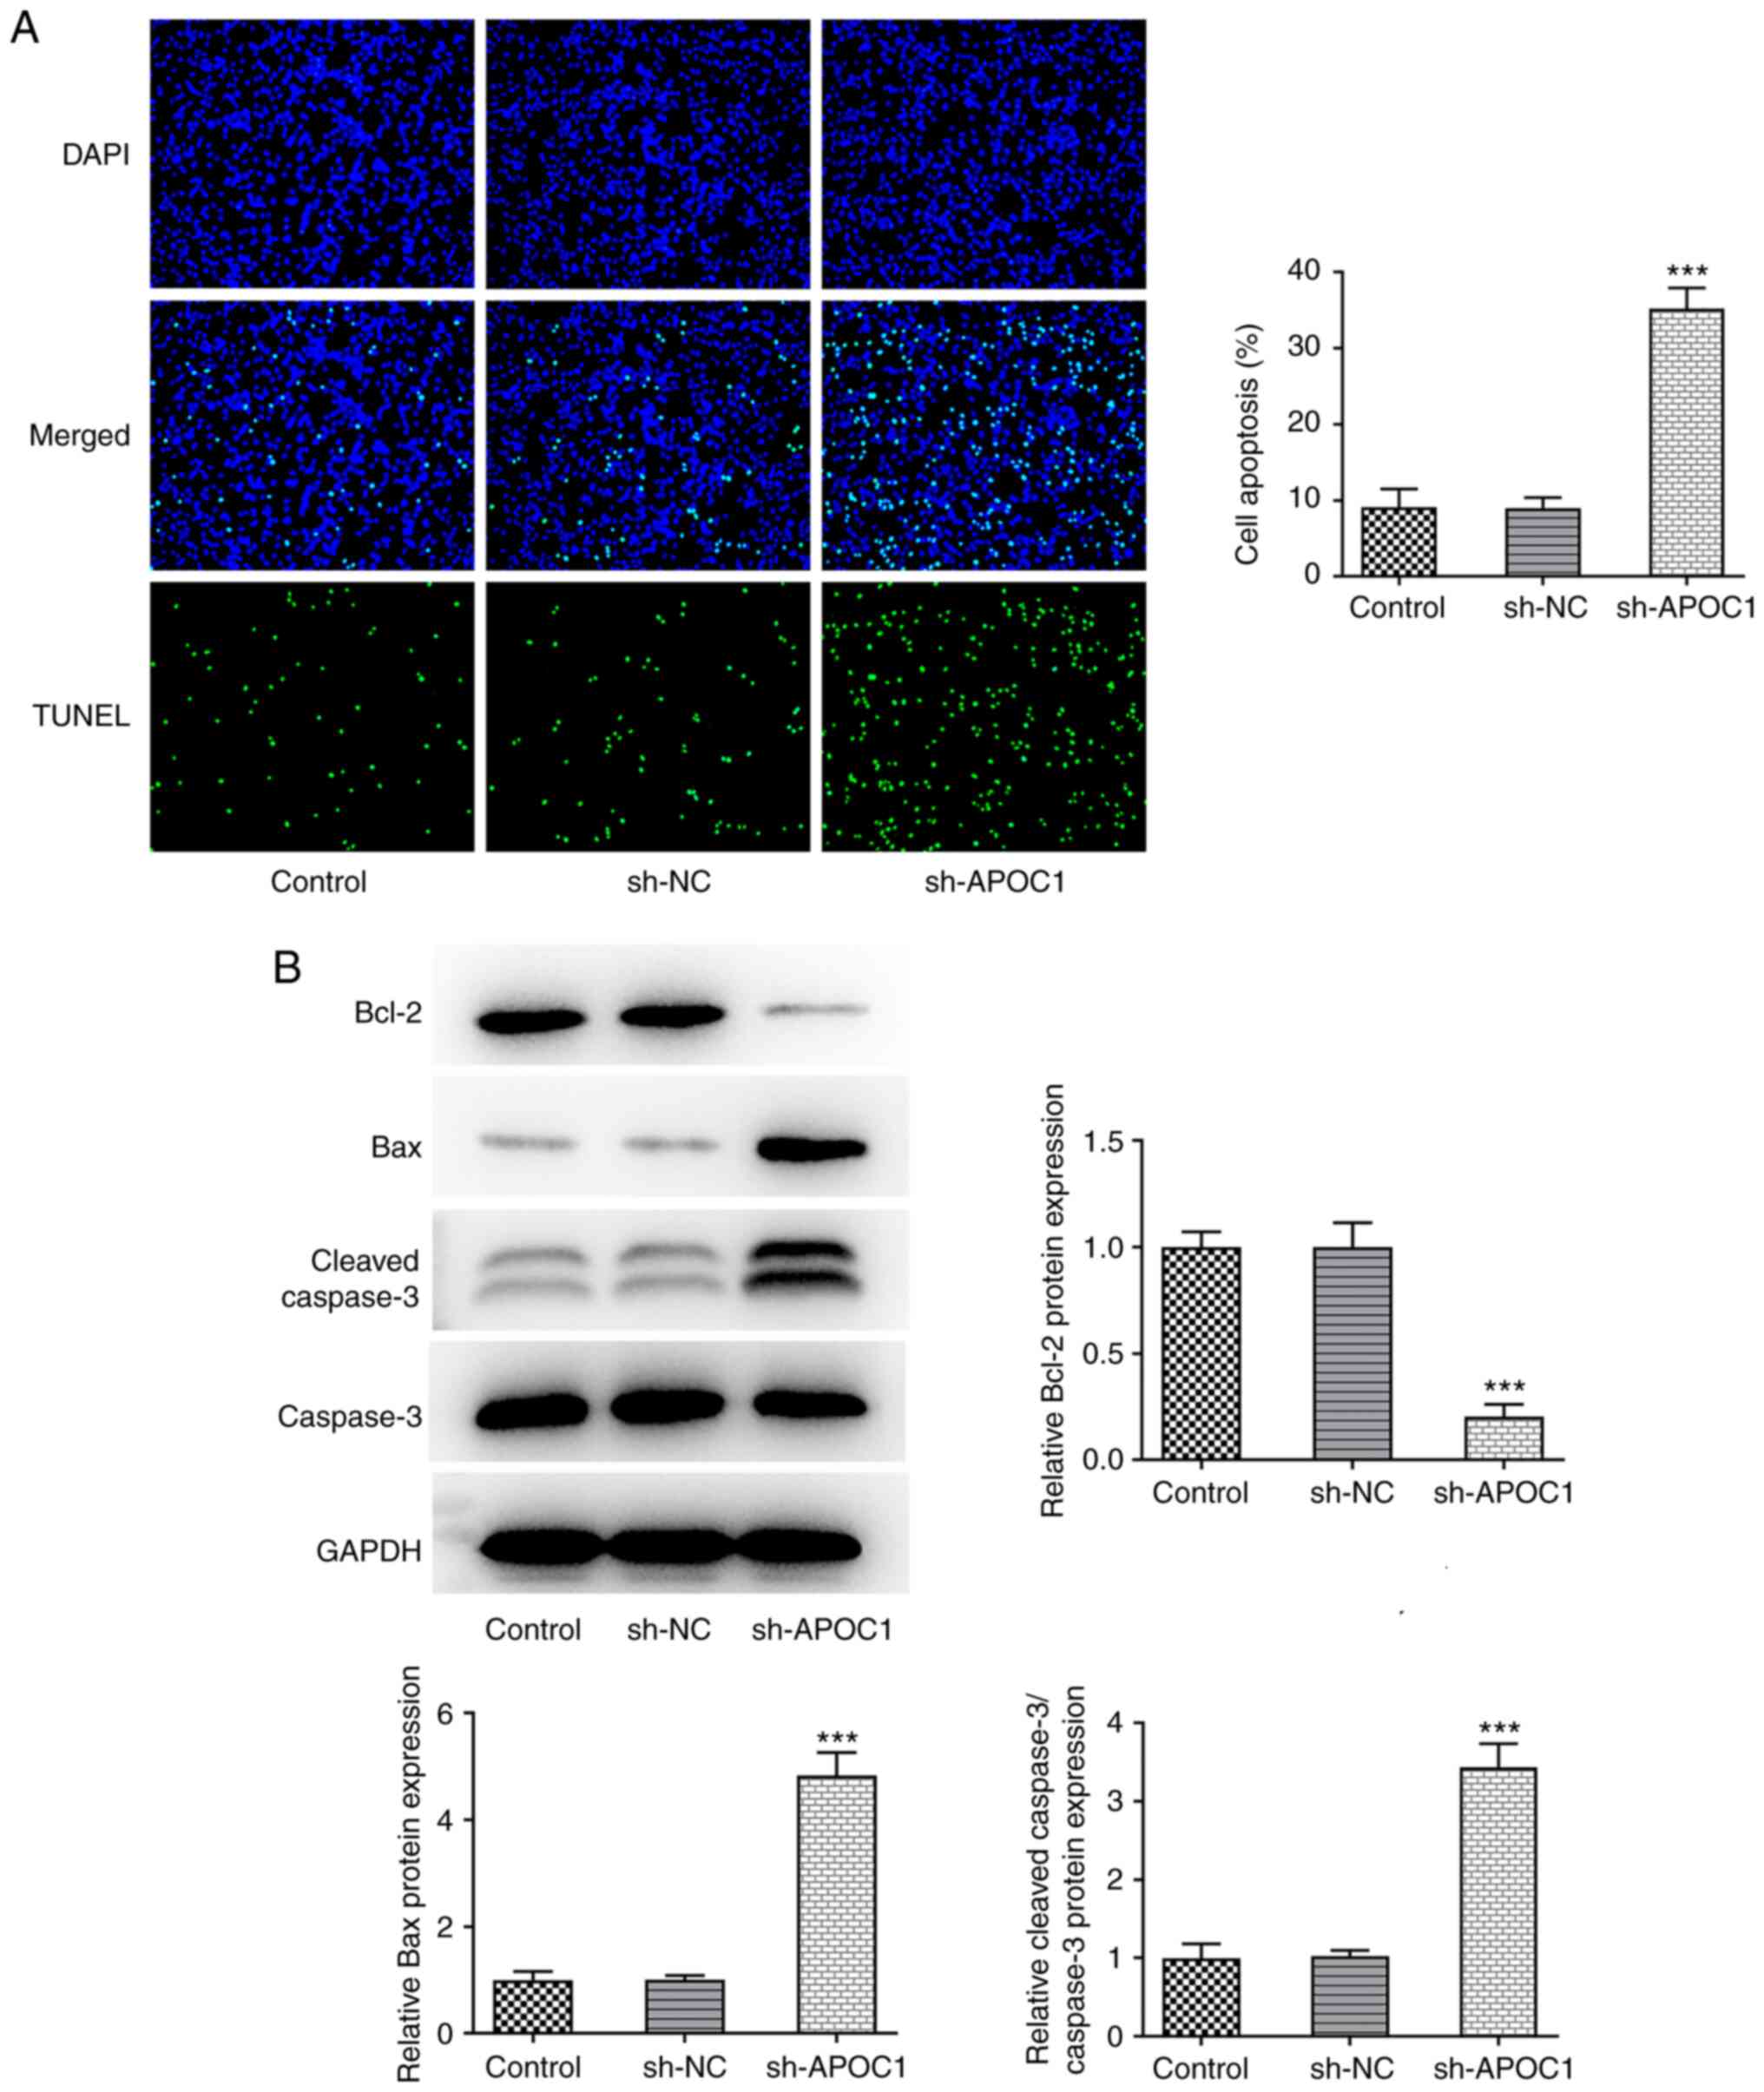
1F). SAOS-2 cells transfected with sh-APOC1 showed increased
apoptotic capacity compared with those transfected with sh-NC
(Fig. 2A). Western blot analysis
suggested that APOC1 silencing led to significant downregulation of
Bcl-2 expression and upregulation in Bax and cleaved-caspase 3
expression (Fig. 2B). The
aforementioned data revealed that APOC1 knockdown suppressed the
proliferation and increased apoptosis of osteosarcoma cells.
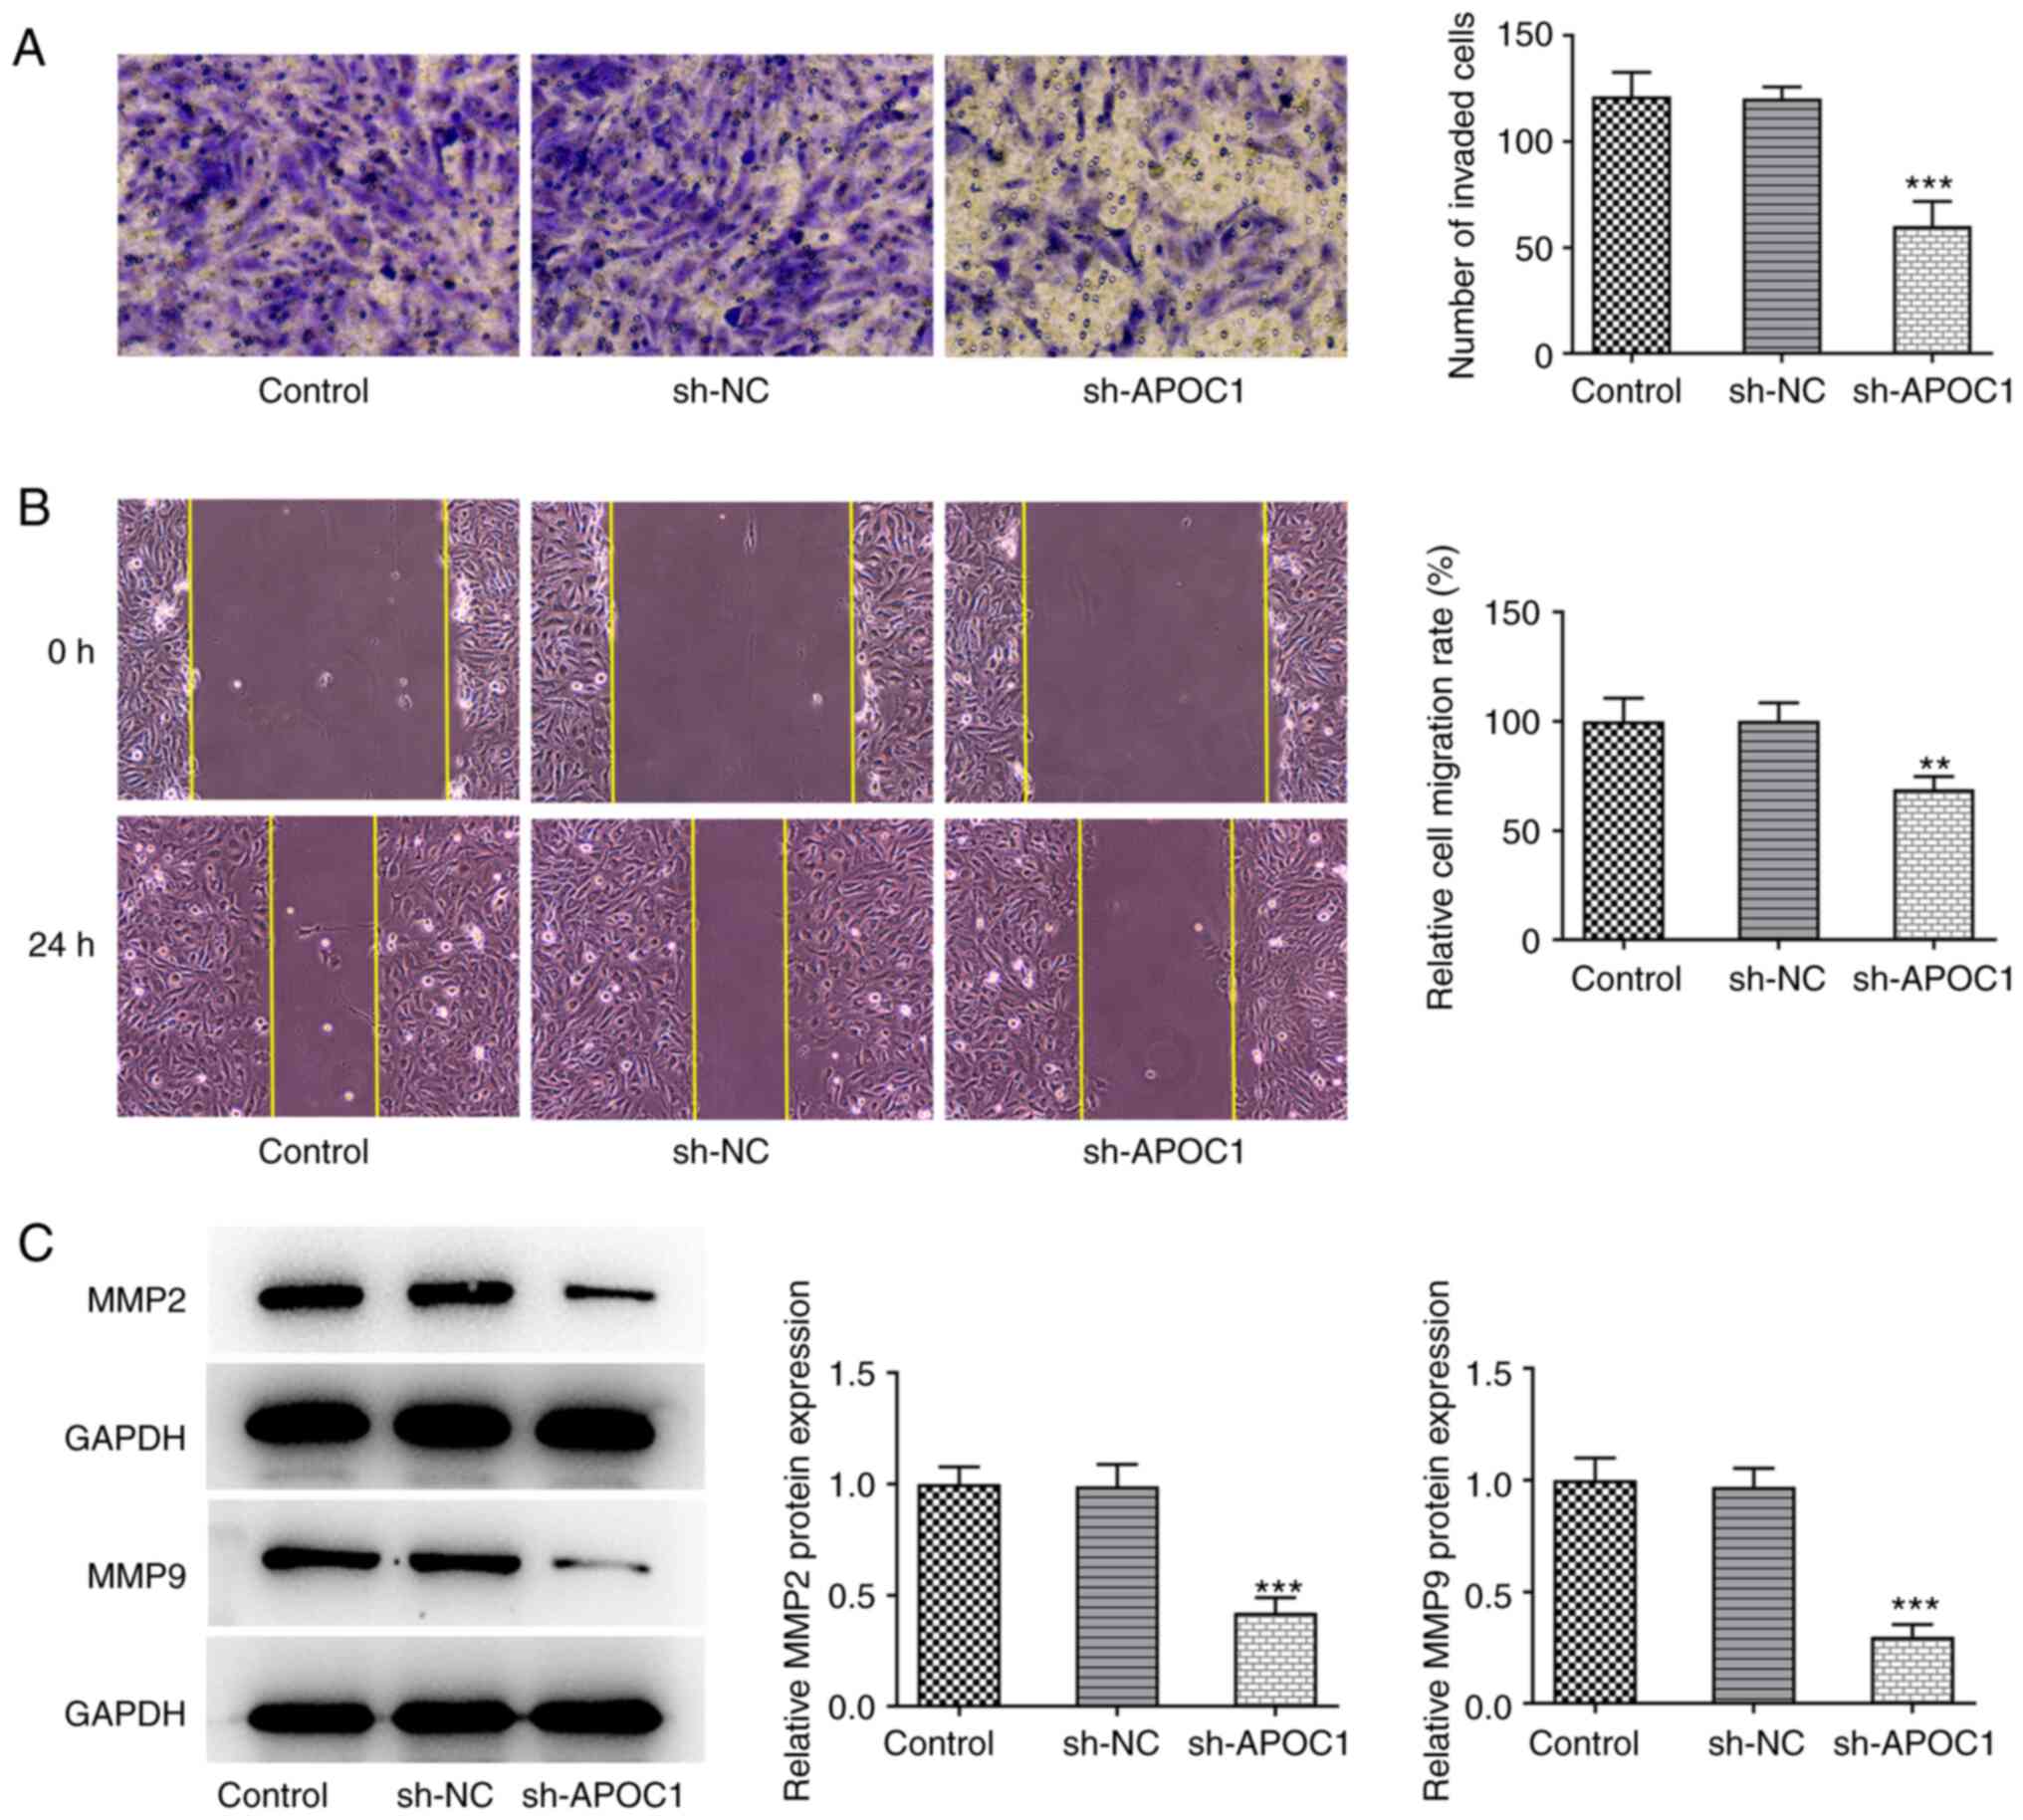
APOC1 silencing suppresses invasion
and migration of osteosarcoma cells
Transwell and wound healing assays were used to
determine the invasive and migratory ability of SAOS-2 cells
following APOC1 deletion. APOC1 knockdown significantly inhibited
the invasion and migration of SAOS-2 cells relative to the sh-NC
group (Fig. 3A and B). Expression of migration-associated
proteins MMP2 and MMP9 was also downregulated in cells transfected
with sh-APOC1 (Fig. 3C). These
findings indicated that APOC1 deletion inhibited invasion and
migration of osteosarcoma cells.
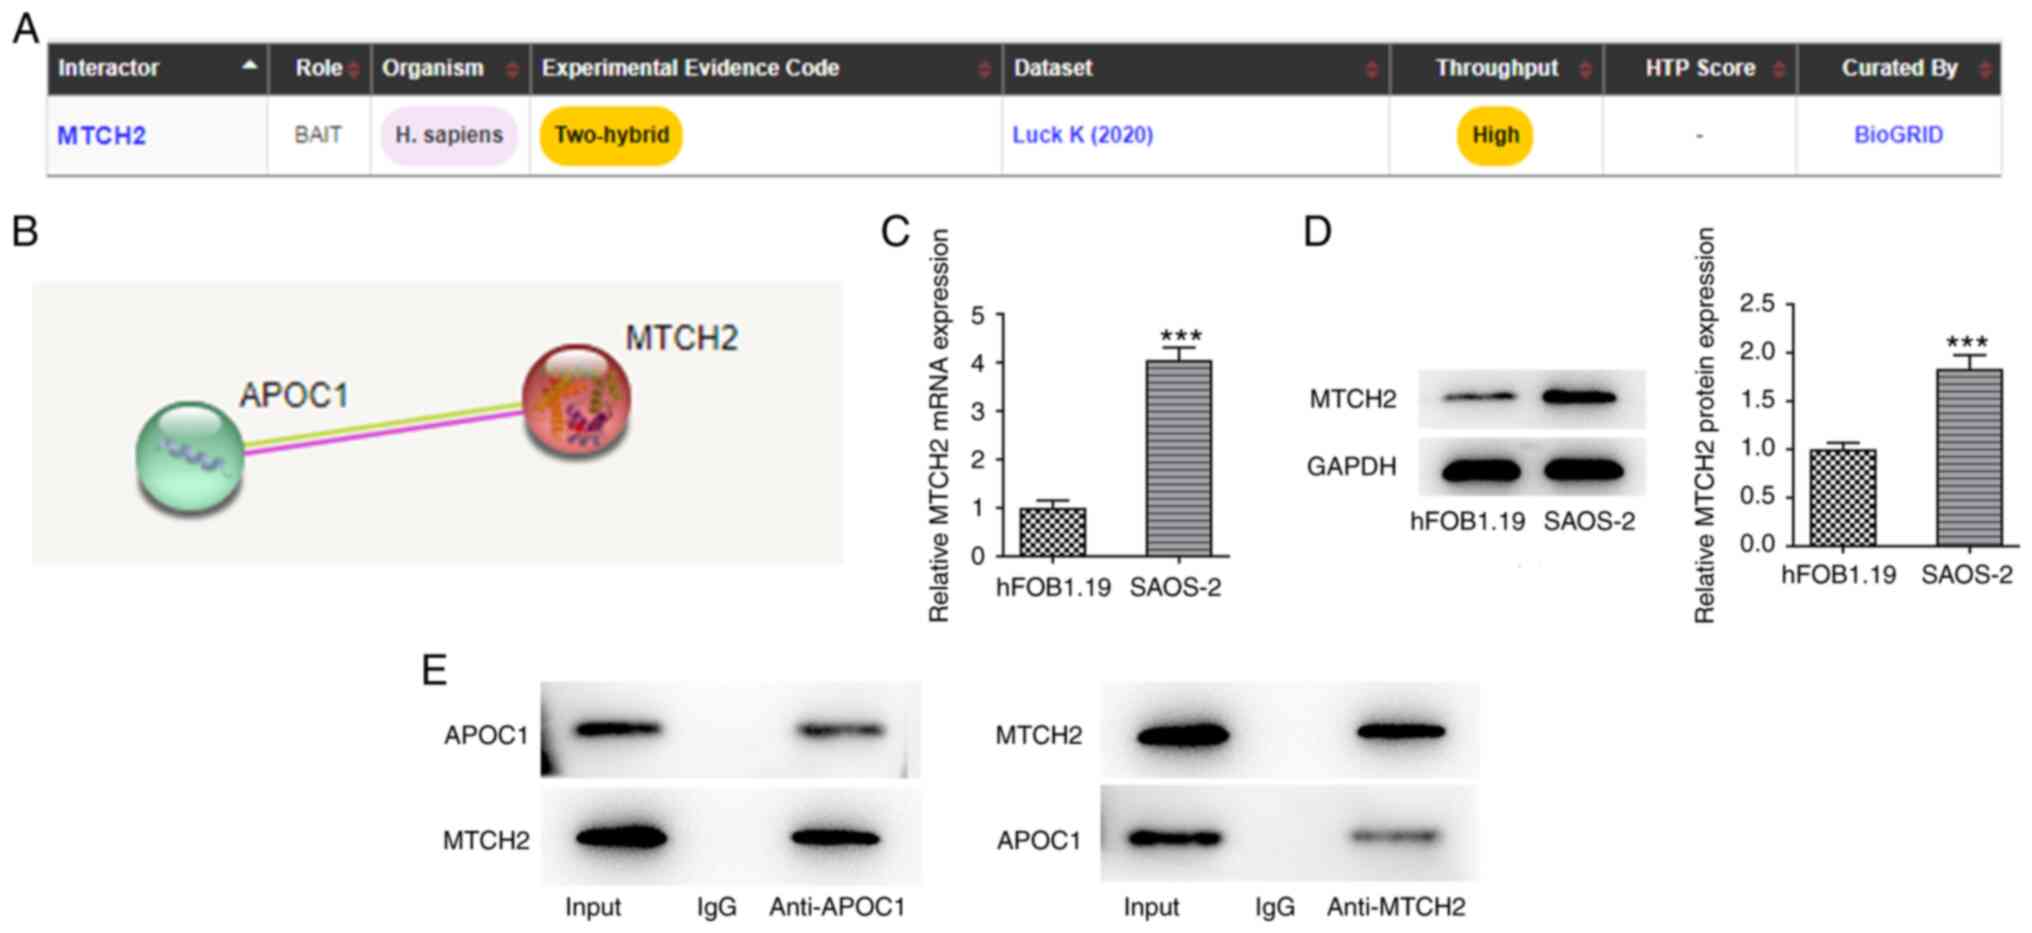
APOC1 interacts with MTCH2 in
osteosarcoma cells
To explore the potential mechanism by which APOC1
regulates malignant biological behaviors of osteosarcoma cells,
BioGRID and STRING databases were used to analyze the proteins that
may interact with APOC1. MTCH2 was noted to interact with APOC1
(Fig. 4A and B). Compared with hFOB1.19 cells,
significantly elevated MTCH2 mRNA and protein expression levels
were observed in SAOS-2 cells (Fig.
4C and D). APOC1 could bind
with MTCH2 (Fig. 4E). These
results validated the prediction that APOC1 interacted with MTCH2
in osteosarcoma.
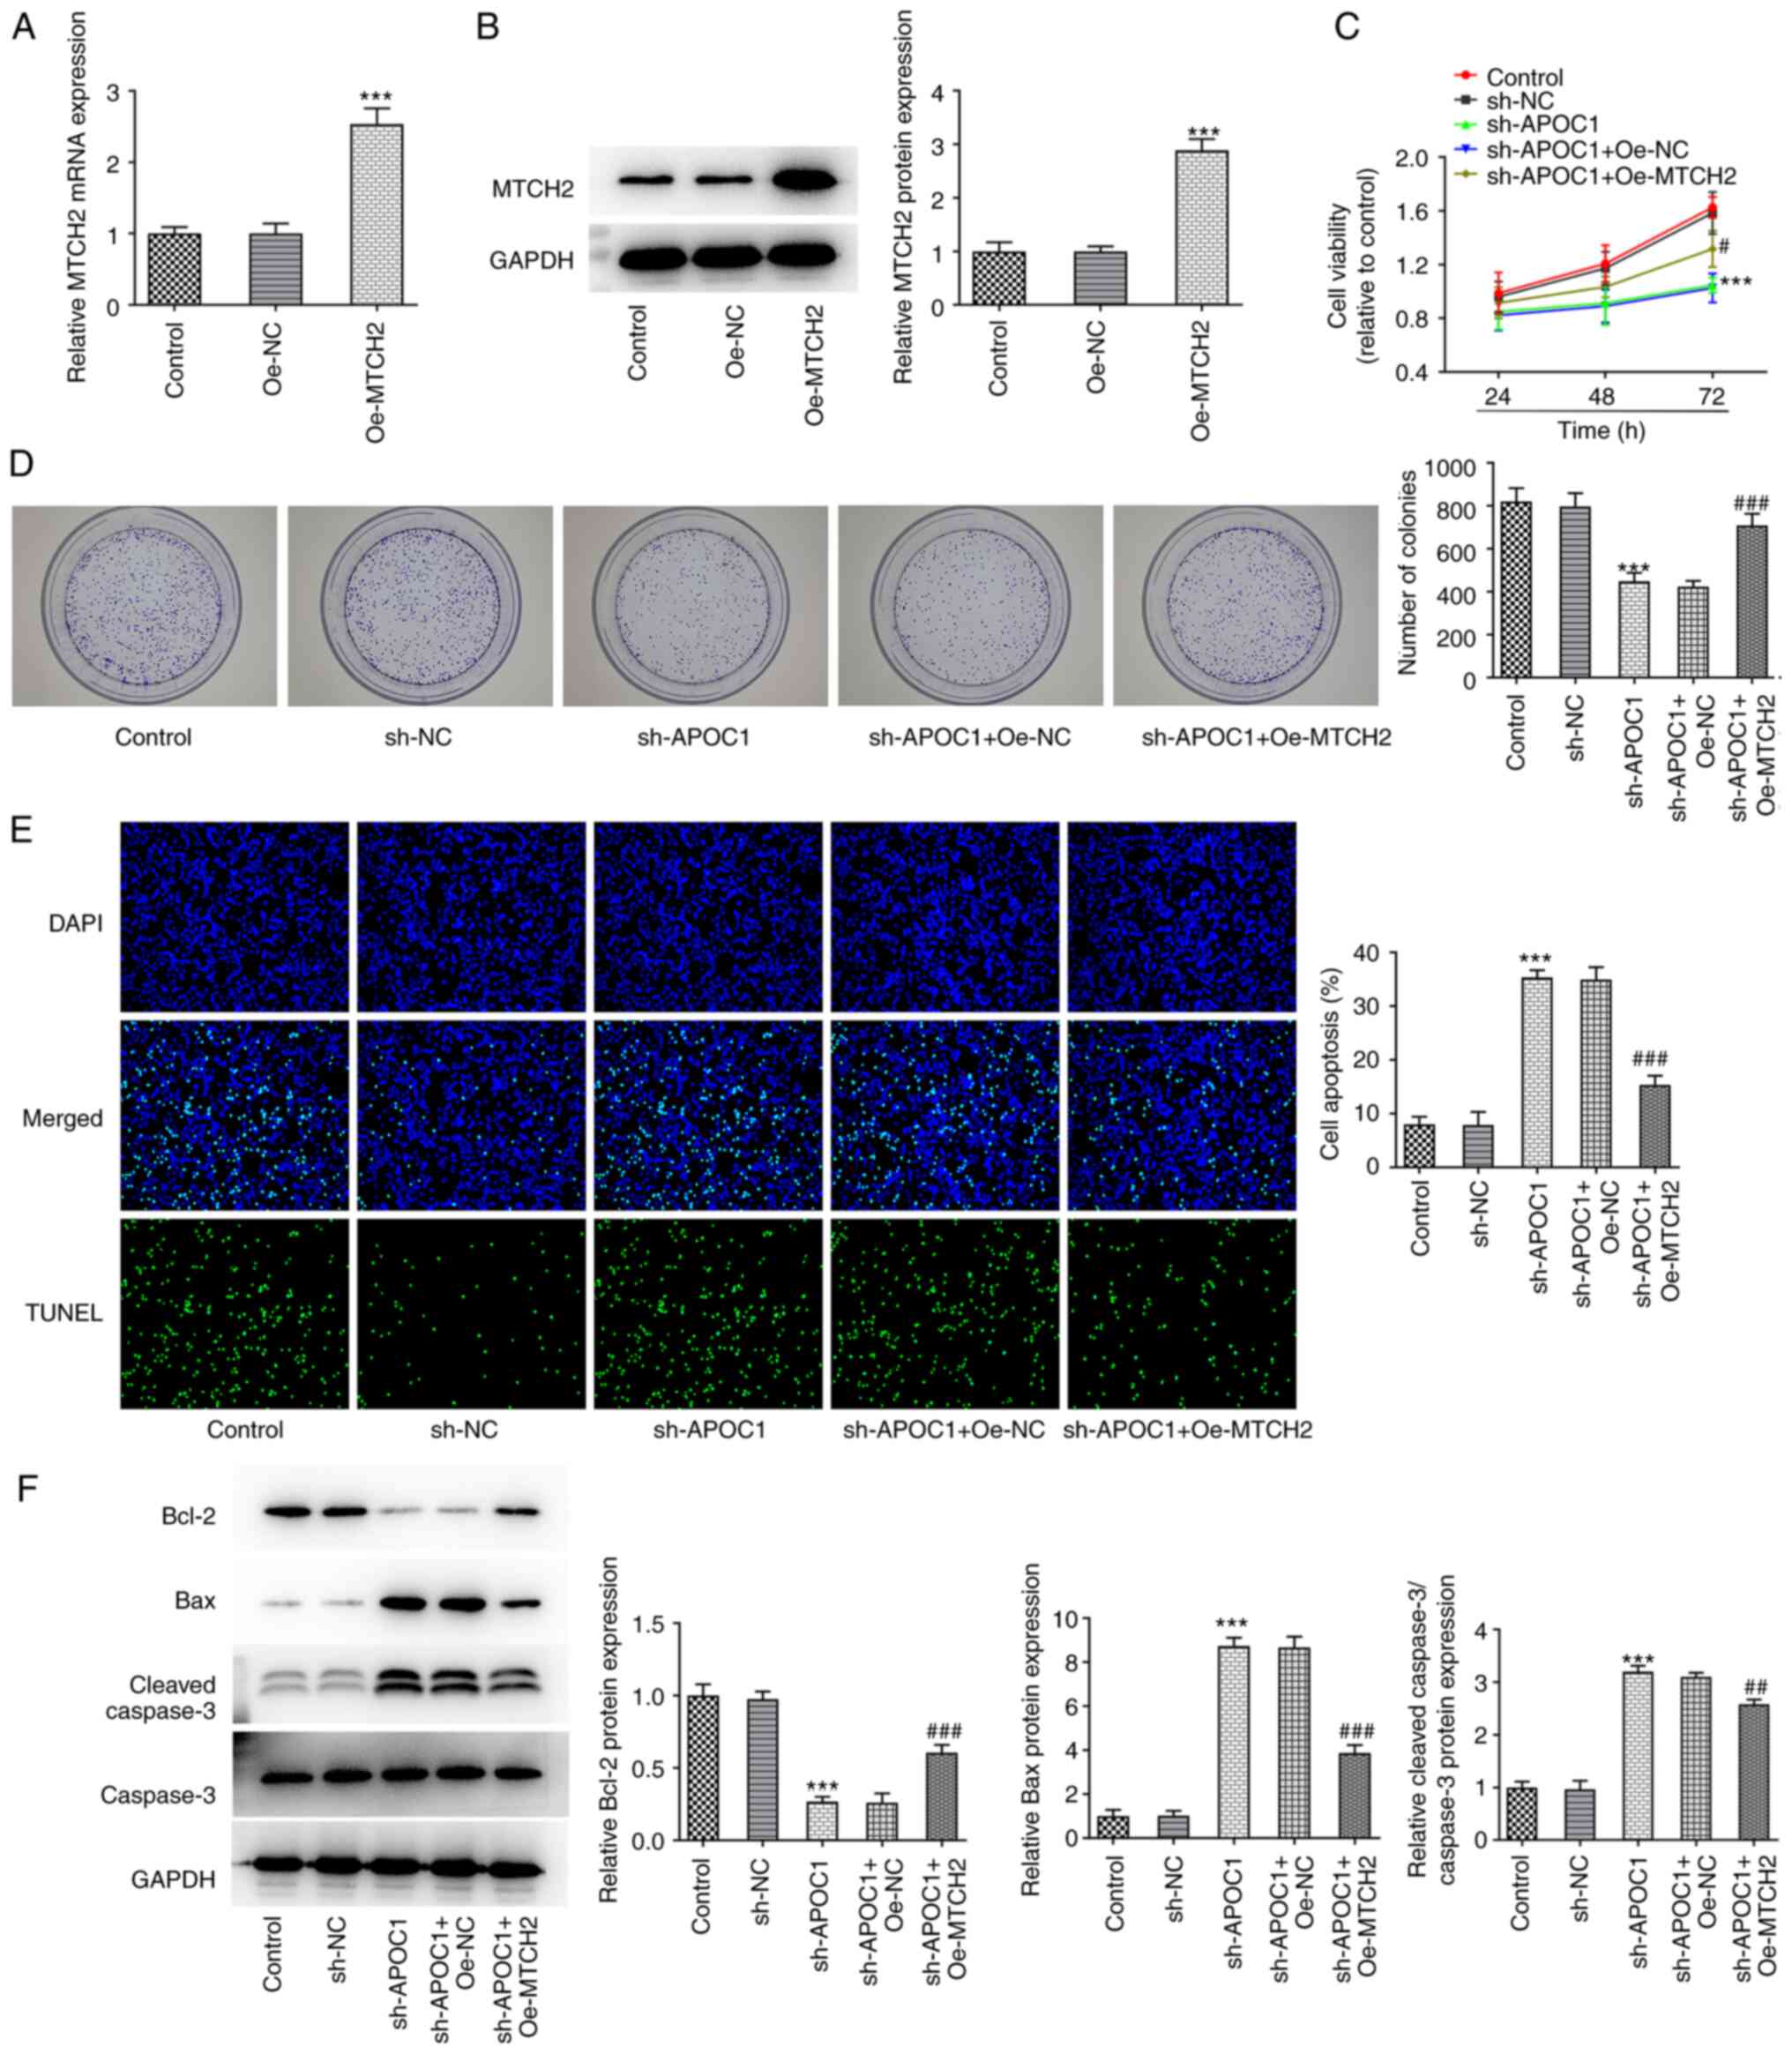
MTCH2 upregulation inhibits the effect
of APOC1 deletion on the malignant behavior of osteosarcoma
cells
The present study investigated whether the
inhibitory effect of APOC1 on osteosarcoma was achieved by
regulating MTCH2. MTCH2 was overexpressed by transfection with
MTCH2 pcDNA3.1 plasmid, resulting in significantly upregulated
MTCH2 expression (Fig. 5A and
B). Viability and cell
proliferation were elevated in SAOS-2 cells co-transfected with
sh-APOC1 and Oe-MTCH2 compared with the sh-APOC1 + Oe-NC group
(Fig. 5C and D). Additionally, TUNEL staining indicated
that MTCH2 overexpression significantly decreased the apoptosis of
SAOS-2 cells transfected with sh-APOC1 (Fig. 5E). Consistently, MTCH2 upregulation
significantly increased Bcl-2 expression and decreased Bax and
cleaved-caspase 3 expression compared with the sh-APOC1 + Oe-NC
group (Fig. 5F). Furthermore, in
the sh-APOC1 + Oe-MTCH2 group, the invasion and migration of SAOS-2
cells were significantly enhanced compared with the sh-APOC1 +
Oe-NC group, coupled with significantly upregulated MMP2 and MMP9
expression (Fig. 6A-C). Together,
these findings confirmed that APOC1 regulated development of
osteosarcoma by binding to MTCH2.
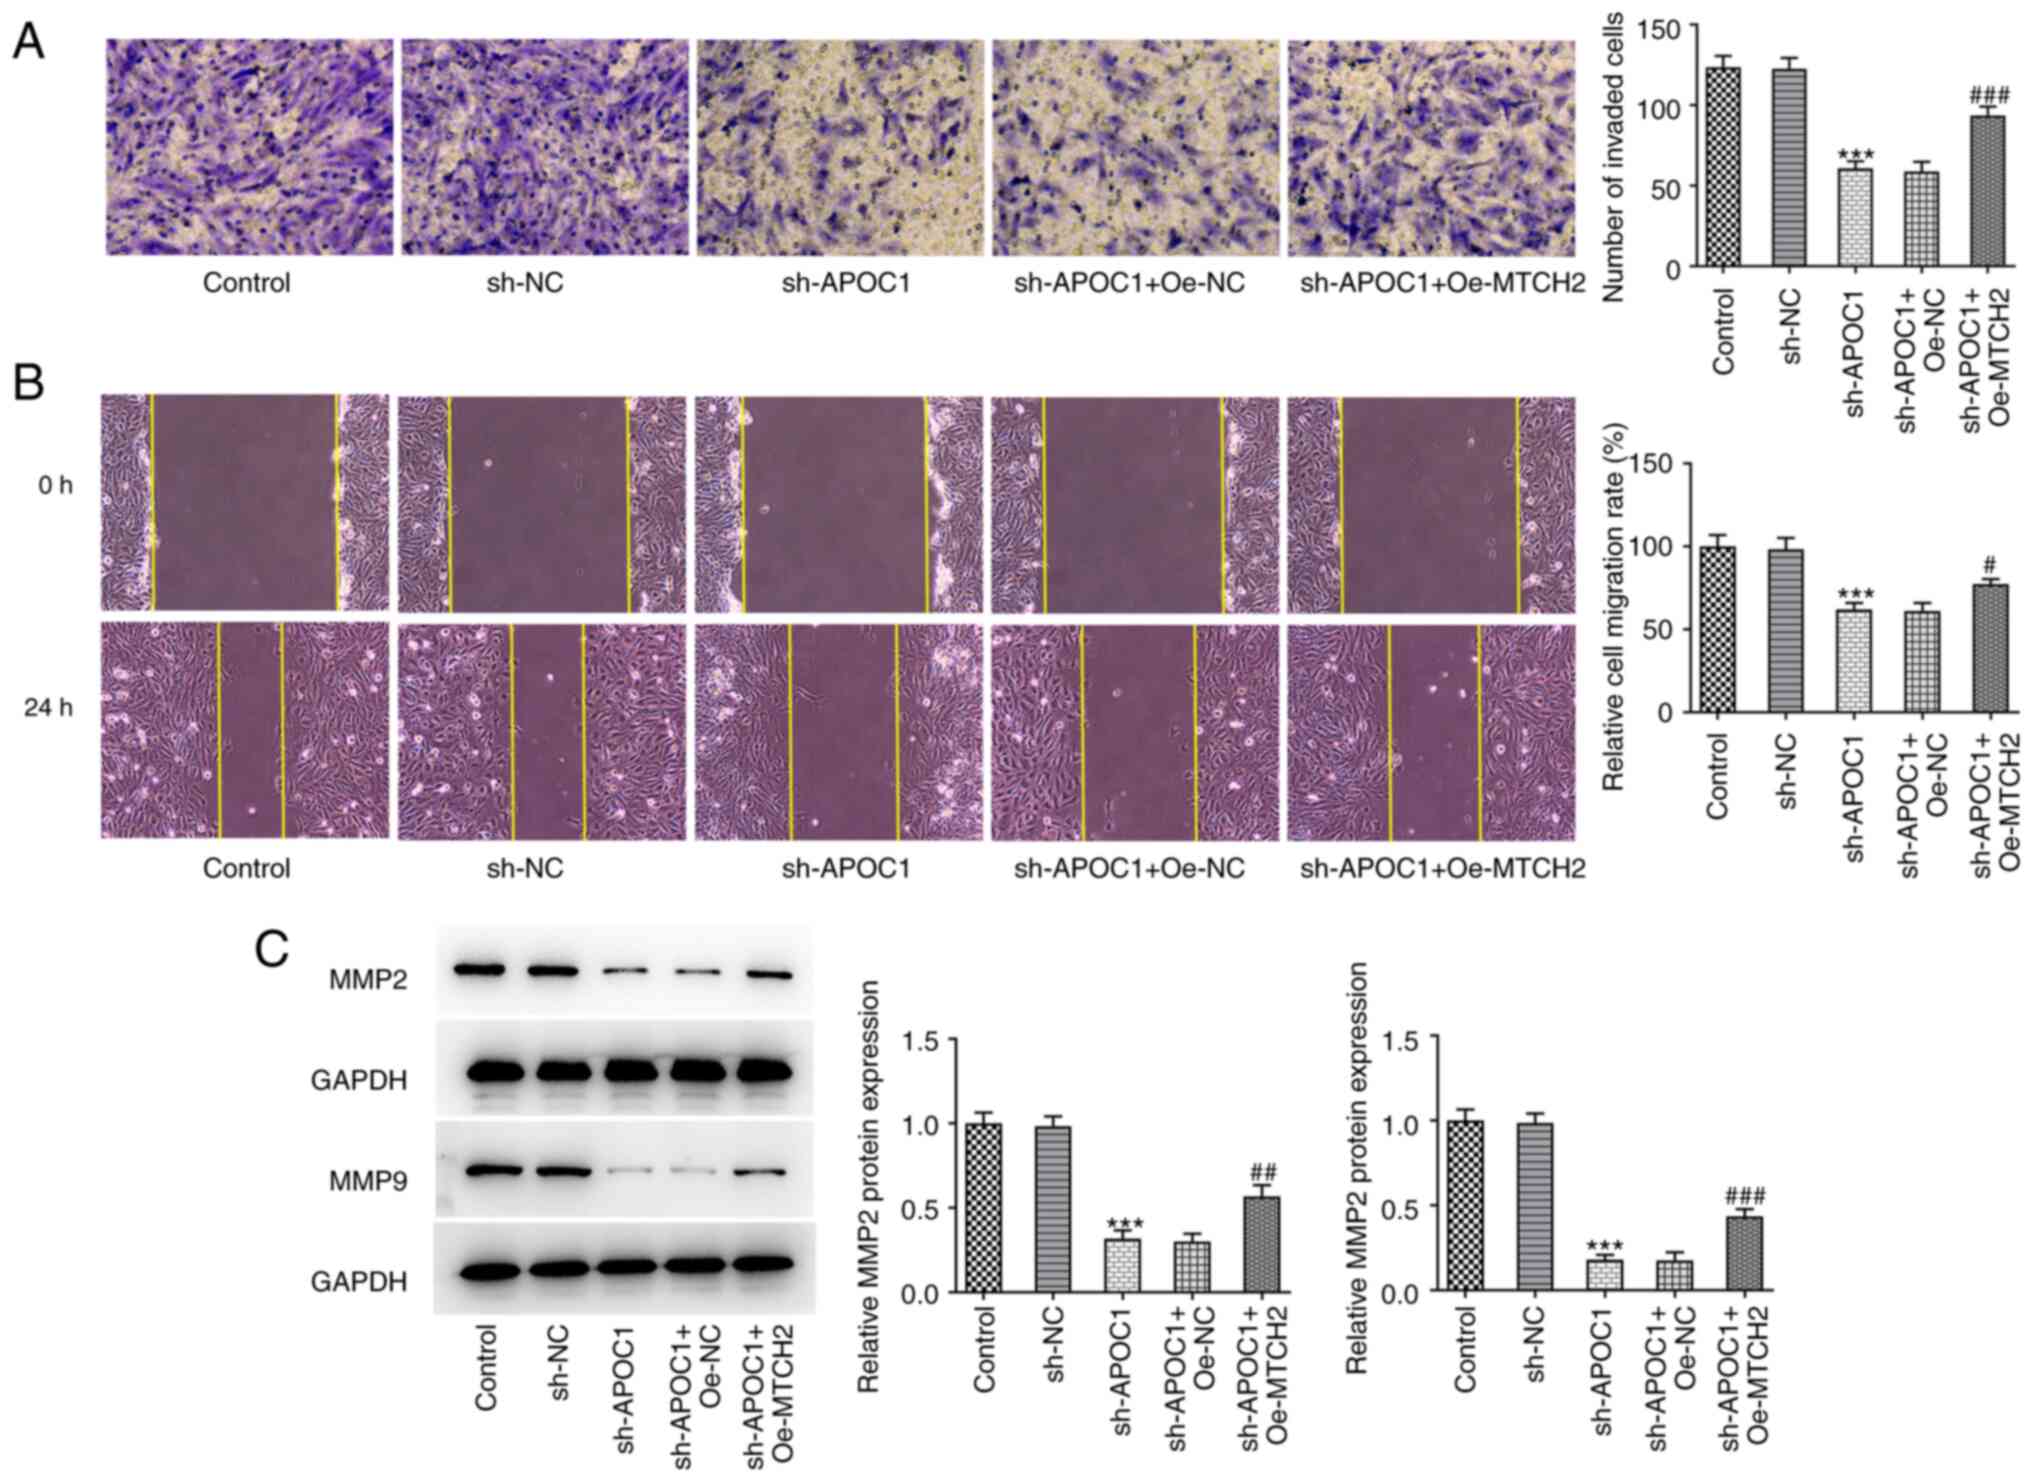 | Figure 6MTCH2 overexpression attenuates the
effects of APOC1 knockdown on invasion and migration of
osteosarcoma cells. (A) Invasion of SAOS-2 cells was evaluated by
Transwell assay. Magnification, x100. (B) Wound healing assay was
used for measurement of cell migration. Magnification, x100. (C)
Expression of MMP2 and MMP9 was determined using western blotting.
***P<0.001 vs. sh-NC; #P<0.05,
##P<0.01, ###P<0.001 vs. sh-APOC1 +
Oe-NC. MTCH2, mitochondrial carrier homolog 2; APOC1,
apolipoprotein C1; MMP, matrix metallopeptidase; sh, short hairpin;
NC, negative control; Oe, overexpression. |
APOC1 silencing promotes OXPHOS and
inhibits the Warburg effect of osteosarcoma cells by regulating
MTCH2 expression
Previous studies have suggested that the Warburg
effect serves a key role in proliferation of osteosarcoma cells
(23,24). The effects of APOC1 silencing on
OXPHOS and the Warburg effect of SAOS-2 cells were analyzed.
knockdown significantly elevated the basal and maximal OCR (the
marker of OXPHOS) (25) in SAOS-2
cells compared with the sh-NC group up to 60 min (Fig. 7A). By contrast, Oe-MTCH2
transfection reversed the elevated OCR caused by APOC1 silencing.
ECAR was significantly reduced up to 60 min in SAOS-2 cells
transfected with sh-APOC1, whereas MTCH2 overexpression alleviated
this effect (Fig. 7B). APOC1
knockdown led to decreased lactate production in SAOS-2 cells
relative to the sh-NC group, which was reversed by Oe-MTCH2
transfection (Fig. 7C). Activities
of key enzymes involved in glycolysis, including HK, PFK and PK,
were significantly decreased in SAOS-2 cells following APOC1
silencing compared with the sh-NC group (Fig. 7D-F). Conversely, MTCH2
overexpression inhibited the impacts of APOC1 silencing alone on
levels of these key enzymes. The aforementioned observations
demonstrated that APOC1 regulated OXPHOS and the Warburg effect of
osteosarcoma cells by binding to MTCH2.
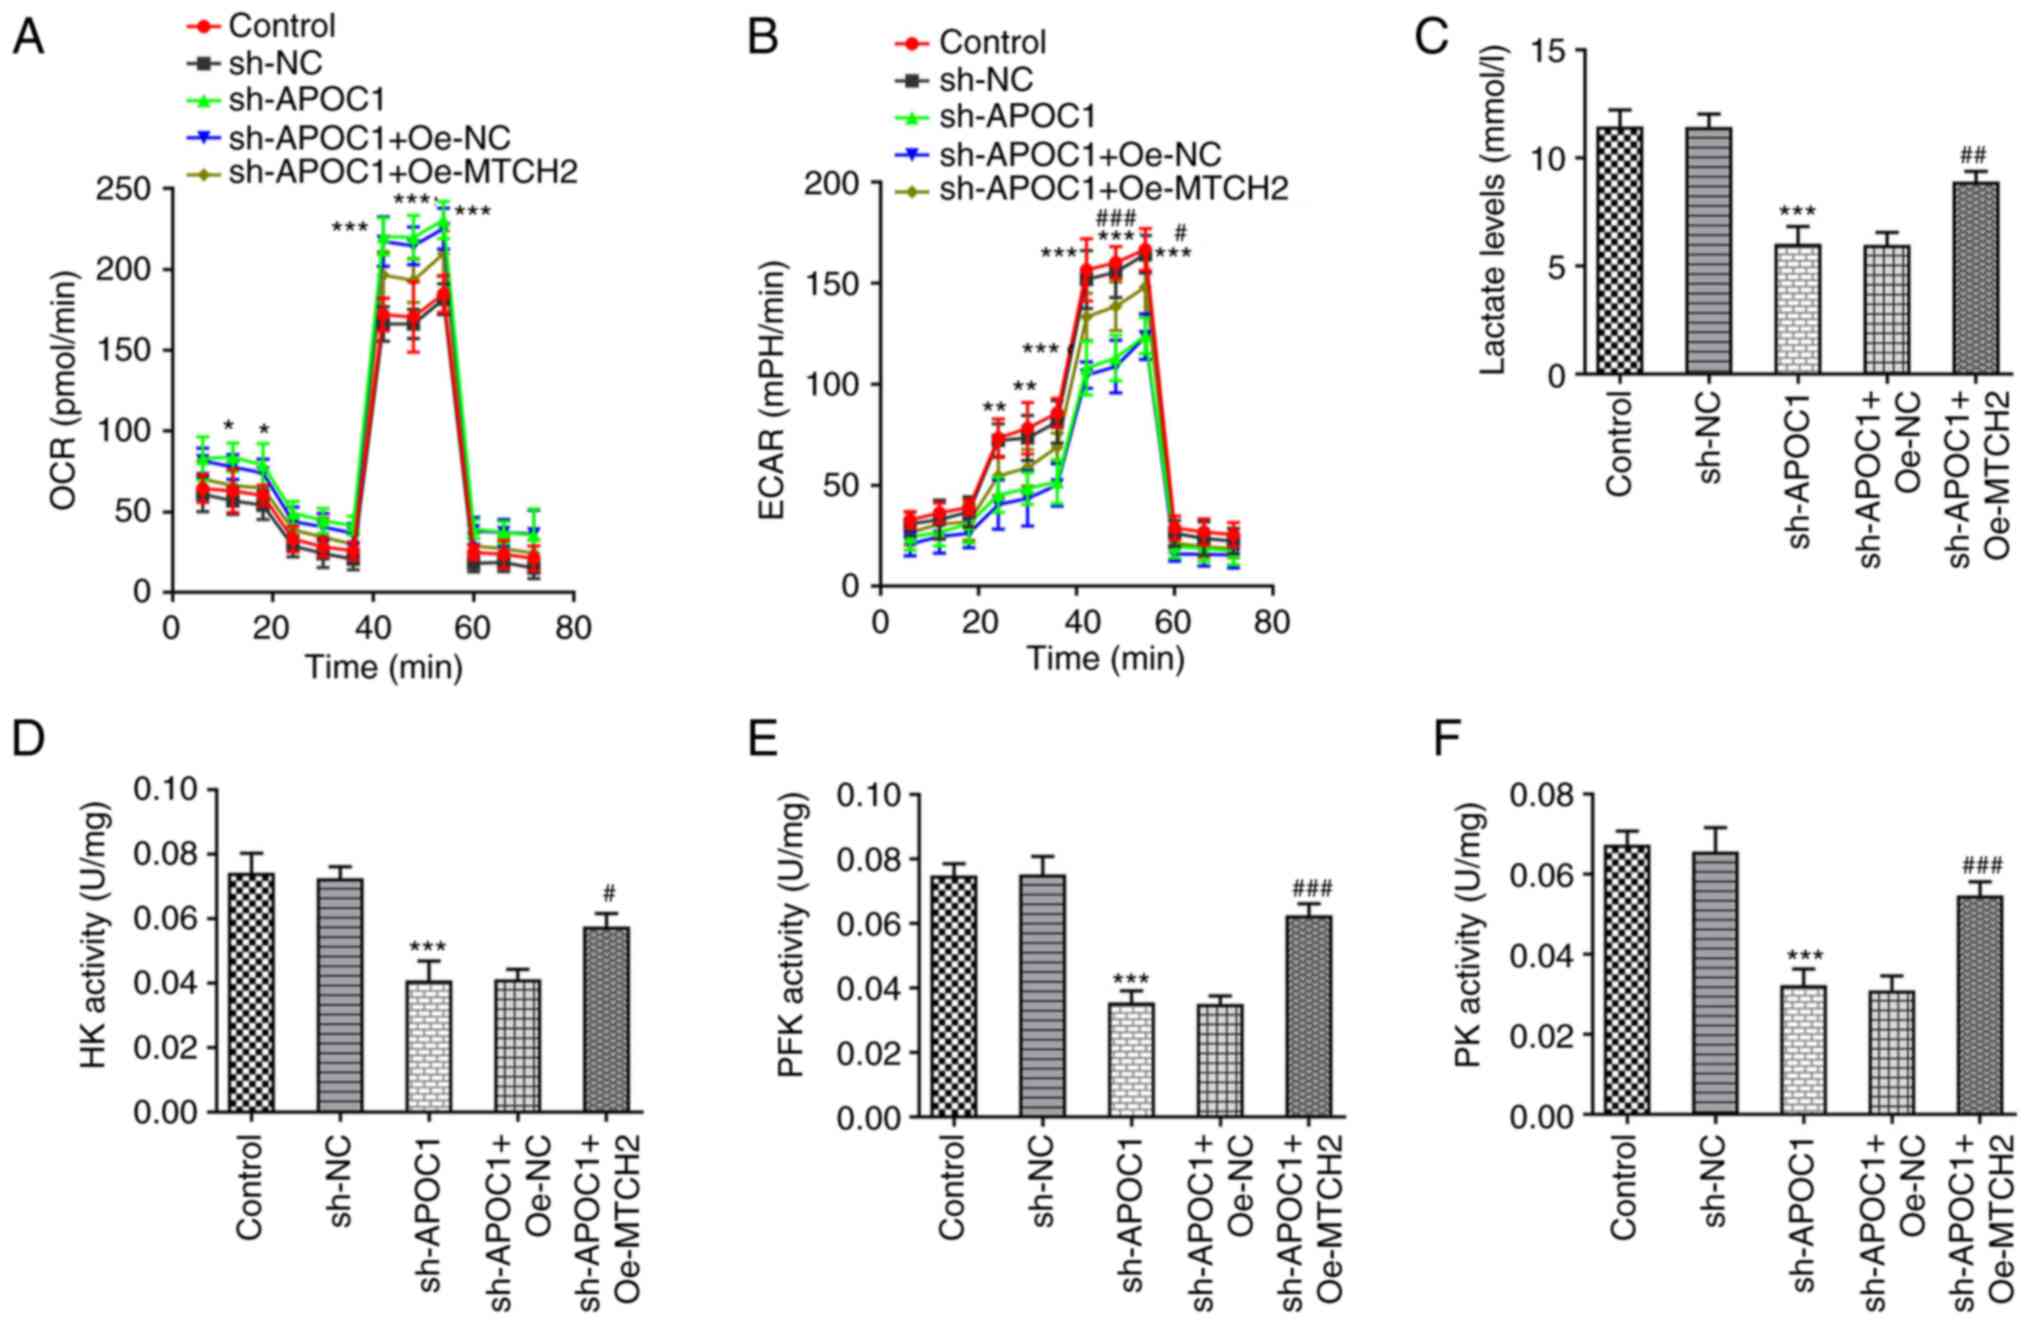 | Figure 7APOC1 silencing promotes oxidative
phosphorylation and inhibits the Warburg effect of osteosarcoma
cells by regulating MTCH2 expression. (A) OCR of SAOS-2 cells was
detected using the Seahorse XF Cell Mito Stress Test kit. (B) ECAR
was assessed using the Seahorse XF Glycolysis Stress Test kit. (C)
Lactate production was tested using lactate assay kit.
Corresponding commercially available kits were used to measure the
activity of (D) HK, (E) PFK and (F) PK. *P<0.05,
**P<0.01, ***P<0.001 vs. sh-NC;
#P<0.05, ##P<0.01,
###P<0.001 vs. sh-APOC1 + Oe-NC. APOC1,
apolipoprotein C1; MTCH2, mitochondrial carrier homolog 2; OCR,
O2 consumption rate; ECAR, extracellular acidification
rate; HK, hexokinase; PFK, phosphofructokinase; PK, pyruvate
kinase; sh, short hairpin; NC, negative control; Oe,
overexpression. |
Discussion
Although osteosarcoma, a high-mortality cancerous
tumor located at the end of the metaphysis, can affect people of
any age, it is typically diagnosed in children and adolescents
(26). New therapies are urgently
needed because of the poor 5-year survival rate despite application
of current treatment strategies for osteosarcoma. The present study
investigated the role of APOC1 in the development of osteosarcoma
and its regulatory effect on MTCH2 to delineate the detailed
molecular mechanisms underlying the pathogenesis of
osteosarcoma.
APOC1 is a polypeptide of 57 amino acid residues
that is primarily synthesized in the liver and secreted into serum
in an autocrine manner (27). It
participates in lipoprotein metabolism by regulating activity of
enzymes associated with intravascular lipoprotein metabolism
(28,29). A growing body of literature has
shown that APOC1 is involved in multiple biological processes, such
as cholesterol catabolism, dendritic reorganization and membrane
remodeling (30,31). Recently, APOC1 has been reported to
be associated with occurrence and prognosis of the majority of
cancers, such as cervical cancer, renal cell carcinoma and breast
and esophageal cancer (8,9,32,33).
Takano et al (34)
demonstrated that APOC1 can maintain cell survival by inhibiting
apoptosis of pancreatic cancer cells. Downregulation of APOC1
elicits inhibitory effects on proliferation, invasion and migration
of colorectal cancer cells (7).
Similarly, Wang et al (35)
showed that APOC1 is highly expressed in clear cell renal cell
carcinoma tissue and APOC1 knockdown suppresses cell proliferation,
invasion and migration. Moreover, evidence has indicated that
knockdown of APOC1 in osteosarcoma significantly inhibits tumor
cell proliferation (36). Also, as
noted by Liu et al (10)
using the analysis of gene expression profiles, APOC1 expression is
continuously upregulated in osteosarcoma tissue samples during the
occurrence and metastasis of osteosarcoma. Bcl-2 is an integral
membrane protein that is primarily located on the outer membrane of
mitochondria and induces release of caspase-3, which serves as an
executioner to facilitate cell death (37). Proteins in the Bcl-2 family exhibit
either pro-apoptotic or anti-apoptotic activities, with Bcl-2 and
Bax serving as markers to determine cell susceptibility to
apoptosis (38,39). In addition, the Bcl-2/Bax signaling
pathway has been shown to participate in apoptosis in osteosarcoma
(40,41). MMP2 and MMP9 are expressed in
cancer cells during malignant invasion and migration and are
proteolytic enzymes that degrade the extracellular matrix and
induce cancer cells to permeate the basement membrane (42). Detection of alterations in
proliferative, apoptotic, invasive and migratory abilities are
commonly used to assess the effects of novel oncogenes on tumors.
Consistent with the aforementioned studies, the present study also
found that APOC1 served as a cancer-promoting gene in osteosarcoma
and APOC1 silencing inhibited the progression of osteosarcoma by
preventing proliferation, invasion and migration and inducing
apoptosis.
By using the BioGRID and STRING databases, it was
found that MTCH2 was a potential protein that may interact with
APOC1. MTCH2 is a 33 kDa protein localized in the mitochondrial
outer membrane (43,44). Studies imply that MTCH2 is involved
in the pathogenesis of numerous types of tumors (13,45,46).
For example, CRISPR screening has identified MTCH2 as key for the
proliferation and viability of leukemia cells and MTCH2 deletion
decreases proliferation and promotes the differentiation of acute
myeloid leukemia cells (45).
Emerging evidence has shown that MTCH2 knockdown impedes invasion
and migration of glioma cells and renders cells susceptible to
temozolomide-triggered apoptosis (13). MTCH2 is significantly downregulated
in ErbB2-driven breast cancer, the induction of which attenuates
tumorigenicity and causes cell cycle arrest in breast cancer
(46). A recent study demonstrated
elevated MTCH2 expression in osteosarcoma clinical samples, which
is the first report about MTCH2 in osteosarcoma (12). In line with findings by Fu et
al (12), in the present
study, MTCH2 was highly expressed in osteosarcoma cells. Co-IP
assay confirmed that APOC1 interacted with MTCH2 in SAOS-2 cells.
Functional experiments further revealed that MTCH2 upregulation
inhibited the impact of APOC1 deletion on the malignant behavior of
osteosarcoma cells, suggesting that APOC1 affected osteosarcoma
tumor progression via MTCH2.
Glycolysis is a key hallmark of cancerous tissues
because cancer cells use energy through glycolysis rather than the
tricarboxylic acid cycle to obtain sufficient energy to
proliferate, migrate and metastasize (21,47).
The Warburg effect, which is the metabolic shift from energy
acquisition primarily through balanced mitochondrial OXPHOS to fast
but inefficient aerobic glycolysis, is hypothesized to be an
important driver of tumor formation and proliferation (15). HK, PFK and PK, key enzymes in
glycolysis, serve important roles in glycolytic metabolism
(48,49). Osteosarcoma has a strong glycolytic
phenotype and studies have shown that aberrantly expressed
molecules, including c-Myc, SLIT2 and ROBO1, in osteosarcoma can
inhibit mitochondrial OXPHOS and promote aerobic glycolysis
(50-52).
MTCH2 is a suppressor of mitochondrial metabolism in the
hematopoietic system and MTCH2 deletion promotes mitochondrial
OXPHOS (53). The present study
showed that MTCH2 upregulation restored the impact of APOC1 on OCR,
ECAR, lactate production and HK, PFK and PK activities in SAOS-2
cells, demonstrating that APOC1 regulated OXPHOS and the Warburg
effect of osteosarcoma cells by binding to MTCH2.
However, the present study has a limitation. In the
present study, only the regulatory effect of APOC1 and MTCH2 on
progression of SAOS-2 cells was discussed. Therefore, further in
vivo experiments involving transgenic animals need to be
performed to support the present conclusions.
Taken together, the aforementioned findings
elucidated that APOC1, a potential tumor oncogenic protein,
performs its functions by binding with MTCH2. APOC1/MTCH2 may be a
novel therapeutic target for osteosarcoma treatment. The present
study may also provide novel insights into the mechanisms of
osteosarcoma carcinogenesis.
Acknowledgements
Not applicable.
Funding
Funding: No funding was received.
Availability of data and materials
The datasets used and/or analyzed during the current
study are available from the corresponding author on reasonable
request.
Authors' contributions
RL and XH designed the study. RL and HH performed
the experiments and analyzed the data. XH drafted the manuscript
and interpreted data. RL revised the manuscript for important
intellectual content. All authors have read and approved the final
manuscript. RL and XH confirm the authenticity of all the raw
data.
Ethics approval and consent to
participate
Not applicable.
Patient consent for publication
Not applicable.
Competing interests
The authors declare that they have no competing
interests.
References
|
1
|
Gianferante DM, Mirabello L and Savage SA:
Germline and somatic genetics of osteosarcoma-connecting aetiology,
biology and therapy. Nat Rev Endocrinol. 13:480–491.
2017.PubMed/NCBI View Article : Google Scholar
|
|
2
|
Whelan JS and Davis LE: Osteosarcoma,
chondrosarcoma, and chordoma. J Clin Oncol. 36:188–193.
2018.PubMed/NCBI View Article : Google Scholar
|
|
3
|
Zheng Y, Wang G, Chen R, Hua Y and Cai Z:
Mesenchymal stem cells in the osteosarcoma microenvironment: Their
biological properties, influence on tumor growth, and therapeutic
implications. Stem Cell Res Ther. 9(22)2018.PubMed/NCBI View Article : Google Scholar
|
|
4
|
Anderson ME: Update on survival in
osteosarcoma. Orthop Clin North Am. 47:283–292. 2016.PubMed/NCBI View Article : Google Scholar
|
|
5
|
Brewer HB Jr, Shulman R, Herbert P, Ronan
R and Wehrly K: The complete amino acid sequence of alanine
apolipoprotein (apoC-3), and apolipoprotein from human plasma very
low density lipoproteins. J Biol Chem. 249:4975–4984.
1974.PubMed/NCBI
|
|
6
|
Fuior EV and Gafencu AV: Apolipoprotein
C1: Its pleiotropic effects in lipid metabolism and beyond. Int J
Mol Sci. 20(5939)2019.PubMed/NCBI View Article : Google Scholar
|
|
7
|
Ren H, Chen Z, Yang L, Xiong W, Yang H, Xu
K, Zhai E, Ding L, He Y and Song X: Apolipoprotein C1 (APOC1)
promotes tumor progression via MAPK signaling pathways in
colorectal cancer. Cancer Manag Res. 11:4917–4930. 2019.PubMed/NCBI View Article : Google Scholar
|
|
8
|
Shi X, Wang J, Dai S, Qin L, Zhou J and
Chen Y: Apolipoprotein C1 (APOC1): A novel diagnostic and
prognostic biomarker for cervical cancer. Onco Targets Ther.
13:12881–12891. 2020.PubMed/NCBI View Article : Google Scholar
|
|
9
|
Guo Q, Liu XL, Jiang N, Zhang WJ, Guo SW,
Yang H, Ji YM, Zhou J, Guo JL, Zhang J and Liu HS: Decreased APOC1
expression inhibited cancer progression and was associated with
better prognosis and immune microenvironment in esophageal cancer.
Am J Cancer Res. 12:4904–4929. 2022.PubMed/NCBI
|
|
10
|
Liu J, Wu S, Xie X, Wang Z and Lei Q:
Identification of potential crucial genes and key pathways in
osteosarcoma. Hereditas. 157(29)2020.PubMed/NCBI View Article : Google Scholar
|
|
11
|
Robinson AJ, Kunji ER and Gross A:
Mitochondrial carrier homolog 2 (MTCH2): The recruitment and
evolution of a mitochondrial carrier protein to a critical player
in apoptosis. Exp Cell Res. 318:1316–1323. 2012.PubMed/NCBI View Article : Google Scholar
|
|
12
|
Fu D, Liu S, Liu J, Chen W, Long X, Chen
X, Zhou Y, Zheng Y and Huang S: iTRAQ-based proteomic analysis of
the molecular mechanisms and downstream effects of fatty acid
synthase in osteosarcoma cells. J Clin Lab Anal.
35(e23653)2021.PubMed/NCBI View Article : Google Scholar
|
|
13
|
Yuan Q, Yang W, Zhang S, Li T, Zuo M, Zhou
X, Li J, Li M, Xia X, Chen M and Liu Y: Inhibition of mitochondrial
carrier homolog 2 (MTCH2) suppresses tumor invasion and enhances
sensitivity to temozolomide in malignant glioma. Mol Med.
27(7)2021.PubMed/NCBI View Article : Google Scholar
|
|
14
|
Buzaglo-Azriel L, Kuperman Y, Tsoory M,
Zaltsman Y, Shachnai L, Zaidman SL, Bassat E, Michailovici I,
Sarver A, Tzahor E, et al: Loss of muscle MTCH2 increases
whole-body energy utilization and protects from diet-induced
obesity. Cell Rep. 14:1602–1610. 2016.PubMed/NCBI View Article : Google Scholar
|
|
15
|
Vander Heiden MG, Cantley LC and Thompson
CB: Understanding the Warburg effect: The metabolic requirements of
cell proliferation. Science. 324:1029–1033. 2009.PubMed/NCBI View Article : Google Scholar
|
|
16
|
Warburg O, Wind F and Negelein E: The
metabolism of tumors in the body. J Gen Physiol. 8:519–530.
1927.PubMed/NCBI View Article : Google Scholar
|
|
17
|
Baltazar F, Afonso J, Costa M and Granja
S: Lactate beyond a waste metabolite: Metabolic affairs and
signaling in malignancy. Front Oncol. 10(231)2020.PubMed/NCBI View Article : Google Scholar
|
|
18
|
Schwartz L, Supuran CT and Alfarouk KO:
The Warburg effect and the hallmarks of cancer. Anticancer Agents
Med Chem. 17:164–170. 2017.PubMed/NCBI View Article : Google Scholar
|
|
19
|
Zhu R, Li X and Ma Y: miR-23b-3p
suppressing PGC1α promotes proliferation through reprogramming
metabolism in osteosarcoma. Cell Death Dis. 10(381)2019.PubMed/NCBI View Article : Google Scholar
|
|
20
|
Oughtred R, Stark C, Breitkreutz BJ, Rust
J, Boucher L, Chang C, Kolas N, O'Donnell L, Leung G, McAdam R, et
al: The BioGRID interaction database: 2019 update. Nucleic Acids
Res. 47:D529–D541. 2019.PubMed/NCBI View Article : Google Scholar
|
|
21
|
Szklarczyk D, Gable AL, Lyon D, Junge A,
Wyder S, Huerta-Cepas J, Simonovic M, Doncheva NT, Morris JH, Bork
P, et al: STRING v11: Protein-protein association networks with
increased coverage, supporting functional discovery in genome-wide
experimental datasets. Nucleic Acids Res. 47:D607–D613.
2019.PubMed/NCBI View Article : Google Scholar
|
|
22
|
Livak KJ and Schmittgen TD: . Analysis of
relative gene expression data using real-time quantitative PCR and
the 2(-Delta Delta C(T)) method. Methods. 25:402–408.
2001.PubMed/NCBI View Article : Google Scholar
|
|
23
|
Kobliakov VA: The mechanisms of regulation
of aerobic glycolysis (Warburg effect) by oncoproteins in
carcinogenesis. Biochemistry (Mosc). 84:1117–1128. 2019.PubMed/NCBI View Article : Google Scholar
|
|
24
|
Abbaszadeh Z, Çeşmeli S and Biray Avcı Ç:
Crucial players in glycolysis: Cancer progress. Gene.
726(144158)2020.PubMed/NCBI View Article : Google Scholar
|
|
25
|
Sica V, Bravo-San Pedro JM, Stoll G and
Kroemer G: Oxidative phosphorylation as a potential therapeutic
target for cancer therapy. Int J Cancer. 146:10–17. 2020.PubMed/NCBI View Article : Google Scholar
|
|
26
|
Ottaviani G and Jaffe N: The epidemiology
of osteosarcoma. Cancer Treat Res. 152:3–13. 2009.PubMed/NCBI View Article : Google Scholar
|
|
27
|
Jong MC, Hofker MH and Havekes LM: Role of
ApoCs in lipoprotein metabolism: Functional differences between
ApoC1, ApoC2, and ApoC3. Arterioscler Thromb Vasc Biol. 19:472–484.
1999.PubMed/NCBI View Article : Google Scholar
|
|
28
|
Jong MC, Dahlmans VE, van Gorp PJ, van
Dijk KW, Breuer ML, Hofker MH and Havekes LM: In the absence of the
low density lipoprotein receptor, human apolipoprotein C1
overexpression in transgenic mice inhibits the hepatic uptake of
very low density lipoproteins via a receptor-associated
protein-sensitive pathway. J Clin Invest. 98:2259–2267.
1996.PubMed/NCBI View Article : Google Scholar
|
|
29
|
Muurling M, van den Hoek AM, Mensink RP,
Pijl H, Romijn JA, Havekes LM and Voshol PJ: Overexpression of
APOC1 in obob mice leads to hepatic steatosis and severe hepatic
insulin resistance. J Lipid Res. 45:9–16. 2004.PubMed/NCBI View Article : Google Scholar
|
|
30
|
Poirier J, Hess M, May PC and Finch CE:
Cloning of hippocampal poly(A) RNA sequences that increase after
entorhinal cortex lesion in adult rat. Brain Res Mol Brain Res.
9:191–195. 1991.PubMed/NCBI View Article : Google Scholar
|
|
31
|
Leduc V, Jasmin-Bélanger S and Poirier J:
APOE and cholesterol homeostasis in Alzheimer's disease. Trends Mol
Med. 16:469–477. 2010.PubMed/NCBI View Article : Google Scholar
|
|
32
|
Li YL, Wu LW, Zeng LH, Zhang ZY, Wang W,
Zhang C and Lin NM: ApoC1 promotes the metastasis of clear cell
renal cell carcinoma via activation of STAT3. Oncogene.
39:6203–6217. 2020.PubMed/NCBI View Article : Google Scholar
|
|
33
|
Zhang H, Wang Y, Liu C, Li W, Zhou F, Wang
X and Zheng J: The Apolipoprotein C1 is involved in breast cancer
progression via EMT and MAPK/JNK pathway. Pathol Res Pract.
229(153746)2022.PubMed/NCBI View Article : Google Scholar
|
|
34
|
Takano S, Yoshitomi H, Togawa A, Sogawa K,
Shida T, Kimura F, Shimizu H, Tomonaga T, Nomura F and Miyazaki M:
Apolipoprotein C-1 maintains cell survival by preventing from
apoptosis in pancreatic cancer cells. Oncogene. 27:2810–2822.
2008.PubMed/NCBI View Article : Google Scholar
|
|
35
|
Wang HJ, Ma YX, Wang AH, Jiang YS and
Jiang XZ: Expression of apolipoprotein C1 in clear cell renal cell
carcinoma: An oncogenic gene and a prognostic marker. Kaohsiung J
Med Sci. 37:419–426. 2021.PubMed/NCBI View Article : Google Scholar
|
|
36
|
Trougakos IP, So A, Jansen B, Gleave ME
and Gonos ES: Silencing expression of the clusterin/apolipoprotein
j gene in human cancer cells using small interfering RNA induces
spontaneous apoptosis, reduced growth ability, and cell
sensitization to genotoxic and oxidative stress. Cancer Res.
64:1834–1842. 2004.PubMed/NCBI View Article : Google Scholar
|
|
37
|
Delbridge AR, Grabow S, Strasser A and
Vaux DL: Thirty years of BCL-2: Translating cell death discoveries
into novel cancer therapies. Nat Rev Cancer. 16:99–109.
2016.PubMed/NCBI View Article : Google Scholar
|
|
38
|
Burlacu A: Regulation of apoptosis by
Bcl-2 family proteins. J Cell Mol Med. 7:249–257. 2003.PubMed/NCBI View Article : Google Scholar
|
|
39
|
Lowe SW and Lin AW: Apoptosis in cancer.
Carcinogenesis. 21:485–495. 2000.PubMed/NCBI View Article : Google Scholar
|
|
40
|
Hu W and Xiao Z: Formononetin induces
apoptosis of human osteosarcoma cell line U2OS by regulating the
expression of Bcl-2, Bax and MiR-375 in vitro and in vivo. Cell
Physiol Biochem. 37:933–939. 2015.PubMed/NCBI View Article : Google Scholar
|
|
41
|
Zhao S, Zhang Y, Lu X, Ding H, Han B, Song
X, Miao H, Cui X, Wei S, Liu W, et al: CDC20 regulates the cell
proliferation and radiosensitivity of P53 mutant HCC cells through
the Bcl-2/Bax pathway. Int J Biol Sci. 17:3608–3621.
2021.PubMed/NCBI View Article : Google Scholar
|
|
42
|
Huang LL, Wang Z, Cao CJ, Ke ZF, Wang F,
Wang R, Luo CQ, Lu X and Wang LT: AEG-1 associates with metastasis
in papillary thyroid cancer through upregulation of MMP2/9. Int J
Oncol. 51:812–822. 2017.PubMed/NCBI View Article : Google Scholar
|
|
43
|
Zaltsman Y, Shachnai L, Yivgi-Ohana N,
Schwarz M, Maryanovich M, Houtkooper RH, Vaz FM, De Leonardis F,
Fiermonte G, Palmieri F, et al: MTCH2/MIMP is a major facilitator
of tBID recruitment to mitochondria. Nat Cell Biol. 12:553–562.
2010.PubMed/NCBI View Article : Google Scholar
|
|
44
|
Grinberg M, Schwarz M, Zaltsman Y, Eini T,
Niv H, Pietrokovski S and Gross A: Mitochondrial carrier homolog 2
is a target of tBID in cells signaled to die by tumor necrosis
factor alpha. Mol Cell Biol. 25:4579–4590. 2005.PubMed/NCBI View Article : Google Scholar
|
|
45
|
Khan DH, Mullokandov M, Wu Y, Voisin V,
Gronda M, Hurren R, Wang X, MacLean N, Jeyaraju DV, Jitkova Y, et
al: Mitochondrial carrier homolog 2 is necessary for AML survival.
Blood. 136:81–92. 2020.PubMed/NCBI View Article : Google Scholar
|
|
46
|
Arigoni M, Barutello G, Riccardo F, Ercole
E, Cantarella D, Orso F, Conti L, Lanzardo S, Taverna D, Merighi I,
et al: miR-135b coordinates progression of ErbB2-driven mammary
carcinomas through suppression of MID1 and MTCH2. Am J Pathol.
182:2058–2070. 2013.PubMed/NCBI View Article : Google Scholar
|
|
47
|
Liu L, Chai L, Ran J, Yang Y and Zhang L:
BAI1 acts as a tumor suppressor in lung cancer A549 cells by
inducing metabolic reprogramming via the SCD1/HMGCR module.
Carcinogenesis. 41:1724–1734. 2020.PubMed/NCBI View Article : Google Scholar
|
|
48
|
Wu Z, Wu J, Zhao Q, Fu S and Jin J:
Emerging roles of aerobic glycolysis in breast cancer. Clin Transl
Oncol. 22:631–646. 2020.PubMed/NCBI View Article : Google Scholar
|
|
49
|
Li L, Ji Y, Zhang L, Cai H, Ji Z, Gu L and
Yang S: Wogonin inhibits the growth of HT144 melanoma via
regulating hedgehog signaling-mediated inflammation and glycolysis.
Int Immunopharmacol. 101(108222)2021.PubMed/NCBI View Article : Google Scholar
|
|
50
|
Sottnik JL, Lori JC, Rose BJ and Thamm DH:
Glycolysis inhibition by 2-deoxy-D-glucose reverts the metastatic
phenotype in vitro and in vivo. Clin Exp Metastasis. 28:865–875.
2011.PubMed/NCBI View Article : Google Scholar
|
|
51
|
Shen S, Yao T, Xu Y, Zhang D, Fan S and Ma
J: CircECE1 activates energy metabolism in osteosarcoma by
stabilizing c-Myc. Mol Cancer. 19(151)2020.PubMed/NCBI View Article : Google Scholar
|
|
52
|
Zhao SJ, Shen YF, Li Q, He YJ, Zhang YK,
Hu LP, Jiang YQ, Xu NW, Wang YJ, Li J, et al: SLIT2/ROBO1 axis
contributes to the Warburg effect in osteosarcoma through
activation of SRC/ERK/c-MYC/PFKFB2 pathway. Cell Death Dis.
9(390)2018.PubMed/NCBI View Article : Google Scholar
|
|
53
|
Maryanovich M, Zaltsman Y, Ruggiero A,
Goldman A, Shachnai L, Zaidman SL, Porat Z, Golan K, Lapidot T and
Gross A: An MTCH2 pathway repressing mitochondria metabolism
regulates haematopoietic stem cell fate. Nat Commun.
6(7901)2015.PubMed/NCBI View Article : Google Scholar
|