Introduction
Hypertensive glaucoma (HTG) is a progressive
disease, therefore early diagnosis and thus initiation of treatment
is very important for preserving visual function (1). At present, HTG can be detected by
measuring changes in the nerve fiber layer (RNFL), ganglion cell
complex and visual field, in addition to the observation of high
intraocular pressure (IOP) (1).
The introduction of optical coherence tomography angiography (OCTA)
has brought new possibilities to the field of glaucoma over the
past decade, by allowing the examination of peripapillary vessel
density (VD) (1).
Our previous study investigating the relationship
between IOP, RNFL and VD revealed no correlations between the
variables assessed in eyes with normal IOP (≤20 mmHg). In healthy
eyes, a moderate correlation was observed between VD and RNFL
(-0.43<r<-0.73). In pathological IOP, there was a moderate
correlation between VD and IOP (-0.34<r<0.59) and a moderate
correlation between IOP and RNFL (-0.42<r<0.59). The
correlation between VD and RNFL in eyes with IOP >20 mmHg showed
a moderate to strong correlation (0.59<r<0.87) (2).
In another previous study that examined the
relationship between pathological IOP and RNFL in individual
peripapillary segments, the highest correlation was found in
segments 1, 4, 5 and 8. This is where the axons of the
predominantly damaged retinal ganglion cells (magnocellular) enter
(3).
As not only the nerve fiber layer itself but also
the vascular component contributes to the overall RNFL, the aim of
the present study was to determine how VD in each segment
peripapillary correlated with pathological IOP. Another aim was to
exclude the contribution of the vascular component to RNFL at high
IOP values.
Patients and methods
The study consisted of 69 individuals (122 eyes)
with untreated ocular hypertension that were recruited between
January to May 2022 at Ophthalmology Clinic JL (Prague, Czech
Republic), including 32 males (6 with one eye examined and 26 with
both eyes examined; age range, 21-76 years; mean age, 55±13 years)
and 37 females (4 with one eye examined and 30 with both eyes
examined; age range, 22-75 years; mean age, 52±14 years). Their IOP
was measured to be >21 (21-36) mmHg during routine ambulatory
care and were not diagnosed with pseudoexfoliative or pigmentary
glaucoma and had the same stage of POAG. The inclusion criteria
were set as follows: Visual acuity of 1.0 with a possible
correction of ≤3 dioptres; approximately equal changes in the
visual fields [in the overall defect (OD) parameter] in all
patients compared with the physiological range and no other ocular
or neurological diseases and no prior treatment for hypertensive
glaucoma.
IOP was measured using a non-contact Ocular Response
Analyser II device (Reichert, Inc.), which was averaged from three
measurements in the same eye. VD in the radial peripapillary
capillaries region was measured using the in-built software of the
Avanti RTVue XR instrument (version 2018.0.018; Optovue, Inc.) in
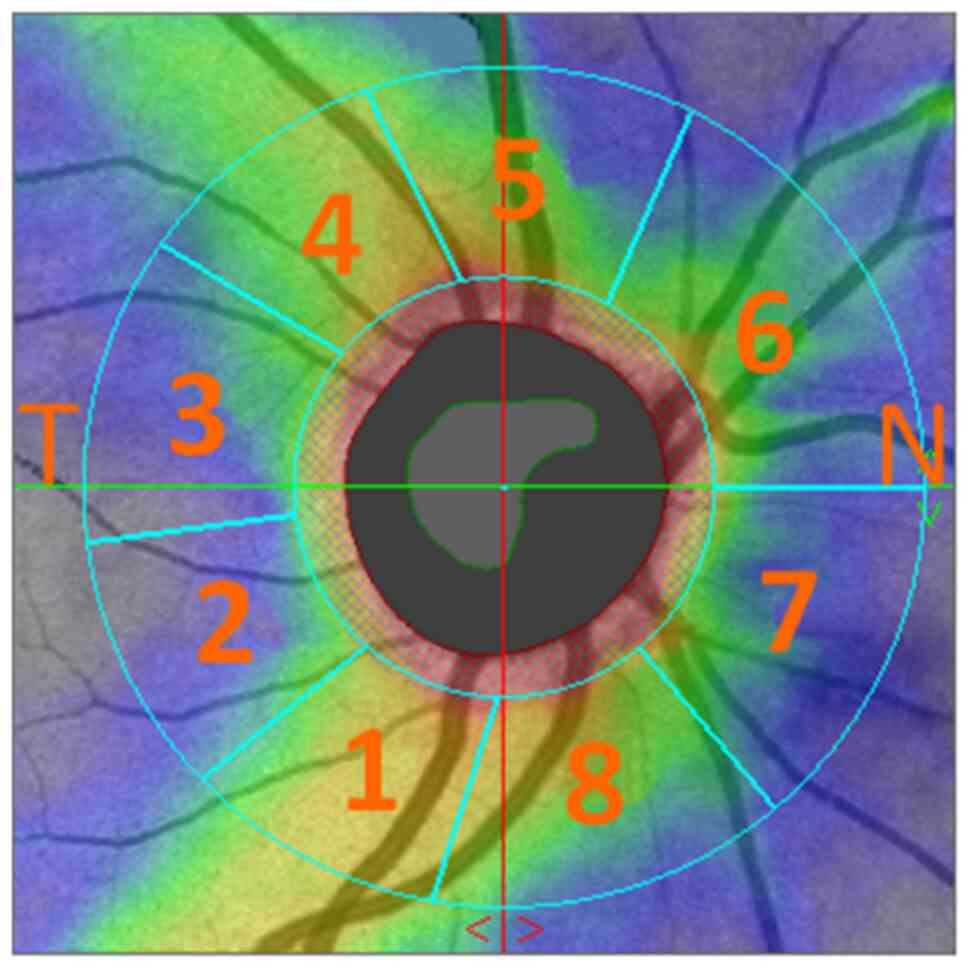
eight peripapillary segments. As presented in Fig. 1, the first image was divided and
marked to show the inferior temporal (IT; segment 1) followed by
the temporal inferior (TI; segment 2), temporal superior (TS;
segment 3), superior temporal (ST; segment 4), superior nasal (SN;
segment 5), nasal superior (NS; segment 6), nasal inferior (NI;
segment 7) and inferior nasal (IN; segment 8) segments. Examination
of all segments was performed simultaneously in a single
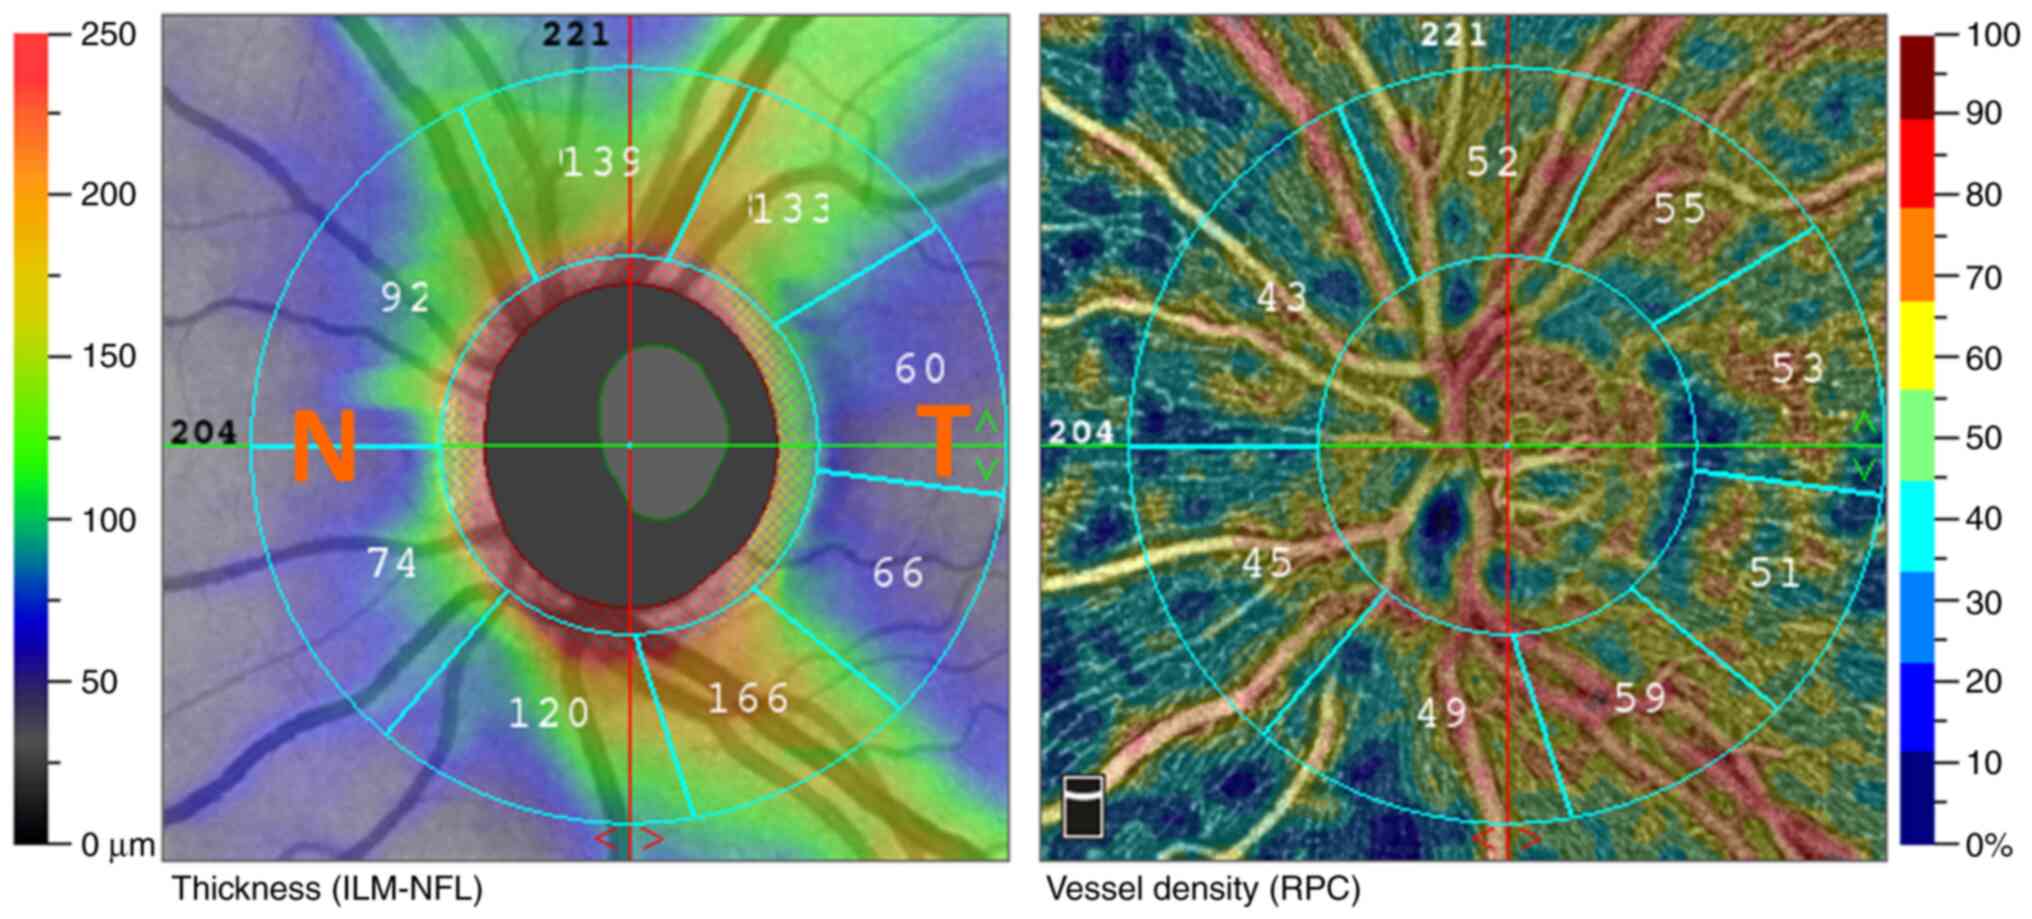
measurement. As presented in Fig.
2, similar peripapillary RNFL measurements in identical
segments were performed with the same instrument (OCT Avanti RTVue
XR instrument).
The visual field was examined using a fast threshold
glaucoma strategy that measured the visual field in range 50˚ in
nasal direction and 22˚ in temporal direction (Medmont M 700
automated perimeter; Medmont International Pty Ltd.). Therefore,
visual field OD was assessed, which also served as an identifier
for the study of unsuitable patients with visual field
abnormalities potentially affecting outcomes.
The statistics were calculated using the software
STATISTICA 13 (version 13.3.721.1; StatSoft). All quantitative data
were expressed as mean ± SD. Box-plots were used for visual
comparison of the samples. Relationships between IOP and RNFL and
IOP and VD were measured using Pearson's coefficient of
correlation. The partial correlation coefficient was used to
‘adjust’ RNFL from VD to assess the dependence between the selected
parameters and tells how the IOP value would correlate with the
thickness of nerve fibers in a given segment if all patients in
that segment had the same VD. P<0.05 was considered to indicate
a statistically significant difference.
The present study was performed according to the
Declaration of Helsinki and was approved by the internal ethics
committee of the Ophthalmology Clinic JL (approval no.
OKJL/220606/13; Prague, Czech Republic). Written informed consent
for participation was obtained from all patients.
Results
The mean values of age, IOP, OD, VD and RNFL of the
whole population used the in present study are presented in
Table I. The correlation results
between IOP and VD of all 122 eyes are included in Table II. No correlation was revealed
between IOP and OD (r=-0.08, data not shown) (3). Furthermore, the correlation matrix
showed that IOP was significantly but weakly correlated with VD in
segments 1 (r=-0.29), 4 (r=-0.33), 5 (r=-0.29), 6 (r=-0.37), 7
(r=-0.32) and 8 (r=-0.23). The strongest correlation was revealed
in segment 6, although the strength of the correlation was medium
(r=-0.37). However, the differences of correlation coefficients
among these segments were relatively small. For all segments, the
correlation with IOP was negative. Therefore, it appeared that the
higher the IOP value, the lower the VD value in each segment.
 | Table IValues of dataset age, RNFL, VD and OD
and their standard deviations. |
Table I
Values of dataset age, RNFL, VD and OD
and their standard deviations.
| Parameter | Value ± standard
deviation |
|---|
| No. of eyes
(male/female) | 122.00
(32.00/37.00) |
| Mean age, years | 45.00±6.00 |
| Mean intraocular
pressure, mmhg | 23.65±2.70 |
| Mean OD (-) | 1.93±1.19 |
| VD, % | |
|
1-IT | 56.44±6.33 |
|
2-TI | 52.85±4.02 |
|
3-TS | 55.80±3.58 |
|
4-ST | 54.44±6.00 |
|
5-SN | 49.36±8.38 |
|
6-NS | 48.30±5.13 |
|
7-NI | 46.81±5.34 |
|
8-IN | 50.66±13.43 |
| RNFL thickness,
µm | |
|
1-IT | 139.64±24.85 |
|
2-TI | 69.49±12.02 |
|
3-TS | 72.93±12.15 |
|
4-ST | 123.07±22.02 |
|
5-SN | 127.33±23.33 |
|
6-NS | 103.07±16.72 |
|
7-NI | 85.69±15.74 |
|
8-IN | 129.94±21.99 |
| Table IIPearson correlation coefficients
between IOP and RNFL, IOP and VD in each segment and partial
correlation coefficient between IOP and RNFL adjusted by VD. |
Table II
Pearson correlation coefficients
between IOP and RNFL, IOP and VD in each segment and partial
correlation coefficient between IOP and RNFL adjusted by VD.
| | Pearson's correlation
coefficient (n=122) |
|---|
| Segments | IOP vs. RNFL | IOP vs. VD | IOP vs. RNFL-VD |
|---|
| 1-IT | -0.23a (P=0.010) | -0.29a (P=0.001) | -0.13 (P=0.192) |
| 2-TI | -0.02 (P=0.790) | -0.17 (P=0.060) | -0.03 (P=0.876) |
| 3-TS | -0.04 (P=0.670) | -0.10 (P=0.259) | -0.05 (P=0.613) |
| 4-ST | -0.24a (P=0.007) | -0.33a (P=0.000) | -0.13 (P=0.189) |
| 5-SN | -0.31a (P=0.001) | -0.29a (P=0.006) | -0.32a (P=0.002) |
| 6-NS | -0.14 (P=0.117) | -0.37a (P=0.000) | -0.11 (P=0.252) |
| 7-NI | -0.06 (P=0.532) | -0.32a (P=0.000) | -0.01 (P=0.971) |
| 8-IN | -0.28a (P=0.002) | -0.23a (P=0.010) | -0.39a (P=0.001) |
Values of correlation coefficients of the RNFL and
VD parameters in each evaluated segment are presented in Table II. The values for the first were
obtained from the same set of a previous study (3). The relationship between IOP and the
observed nerve fiber segments after VD ‘cleaning’ were assessed
using partial correlation coefficients. The partial correlation
coefficient suggests how the IOP value would correlate with the
thickness of nerve fibers in a given segment if all patients had
the same VD in that segment. The partial correlation coefficient
always takes values between -1 and 1. If r comes out close to -1,
it indicates an inverse linear dependence between the variables
(the larger one variable is, the smaller the other is); if r comes
out close to +1, it indicates a direct linear dependence (the
larger one variable is, the larger the other is). If r comes
out close to 0, it indicates that the variables are linearly
independent. One is unrelated to the other and vice versa.
According to the value of the partial correlation coefficient it is
possible to distinguish: Weak (|r|<0.3), medium
(0.3<|r|<0.8) and strong (|r|>0.8) linear
dependence (correlation).
Table II reveals
that significant correlations between IOP and RNFL were found in
segments 1 (r=-0.23), 4 (r=-0.24), 5 (r=-0.31) and 8 (-0.28). As
aforementioned, the highest correlations between VD and IOP were
revealed in segments 1, 4, 5, 6,7 and 8. After VD-adjustment,
significant correlations of medium strength between IOP vs. RNFL-VD
were revealed in segments 5 (r=-0.32) and 8 (r=-0.39).
Discussion
For the early diagnosis of changes in the nerve
fiber layer, which segment in the peripapillary region of the
retina to focus on is important. Since the vascular component
contributes non-negligibly to its total thickness, the present
study sought to determine its ‘true’ value after elimination of the
VD. (2) Our previous work has
demonstrated that as IOP increases, VD decreases and the
relationship between VD and RNFL increases (2).
Accumulating evidence suggests that abnormalities in
the retinal microcirculation and ocular blood flow disturbances
contribute to the development of primary open angle glaucoma
(4-6).
However, the precise role of vascular abnormalities in the
pathogenesis of glaucoma remain poorly understood (7). The significant effect of VD on visual
field changes in HTG was also demonstrated in a previous study
(8).
Chen et al (9) previously investigated the effect of
latanoprost (a drug that lowers IOP) on VD. This study found
statistically significant increases of VD in the IT, TS, ST, SN, NI
and IN segments. This corresponds to segments 1, 3, 4, 5, 7 and 8
in the current study. Moreover, the present study similarly
revealed the greatest effect of pathological IOP on VD in segments
1, 4, 5, 6, 7 and 8. Similar findings were also observed by Shin
et al (10), where
peripapillary microvascular improvement was observed in 61.3% eyes
at 3 months after anti-glaucomatous surgery. Improvements in VD
after anti-glaucomatous surgery have also been observed by Park
et al (11). By contrast,
Zeboulon et al (12)
revealed no significant changes in the peripapillary VD of their
cases, with a mean baseline IOP of 23.7±9.5 mmHg and a mean IOP of
12.2±3.5 mmHg (≥40% reduction) at 1 month after the operation. Diaz
et al (13) previously
reported that high IOP significantly reduces the VD per unit area
in the laminar and retrolaminar regions of the optic nerve. It
should be noted that after the application of latanoprost and
timolol for glaucoma, neither the capillary density nor the
capillary volume fraction in the cribriform disc region returned to
their original values. Wang et al (14) previously found an immediate change
in VD values when IOP was experimentally increased using OCTA.
Therefore, this may be one of the reasons why vascular alterations
may occur before the degeneration of RNFL, even in patients with
normal IOP. Conversely, following RNFL atrophy, changes in VD also
occur (15). Glutamate, as the
main neurotransmitter in the visual pathway, may play a major role,
by not only acting excitotoxically on the visual analyzer cells
(16,17) but by also affecting the vascular
system (15).
In the present study, a weak correlation was found
between IOP and VD, specifically in segments 1, 4, 5, 6, 7 and 8,
where the highest degree of correlation was found in segment 6
(r=-0.37).
This is probably due to the larger number of retinal
vessels that nourish the inner retinal layers, as the upper nasal
quadrant of the retina contains the largest number of ganglion
cells (18). These results only
partially correlate with the results of our previous study
(3), where pathological IOP values
were shown to be inversely proportional to RNFL in segments 1, 4,
5, and 8. Therefore, the role of VD in RNFL loss is probably not
direct, yet the highest correlation between these parameters has
been previously observed in segment 5 (r=-0.31) according to a
review study (3).
IOP is a major risk factor for the development of
glaucoma and its progression (9,10).
After an increase in IOP, the ganglion cells of the retina are
altered, which is demonstrated by studies of different animal
models of glaucoma revealing a higher sensitivity (compared with
other parvocellular ganglion cells) to IOP in magnocellular
ganglion cells (19-21).
As described by Weber et al (22) and Naskar et al (23), the first changes after IOP
elevation begin in the ganglion cells themselves, and their axons
change later. The notion that these are predominantly magnocellular
fibers has been confirmed by Quigley et al (24), where larger diameter fibers died
faster compared with smaller fibers, although no fibre size was
completely spared at any stage of atrophy. Retinal magnocellular
cells die before their axons in hypertensive glaucoma, therefore,
our previous study investigated RNFLs in different peripapillary
segments, which revealed that their greatest atrophy is where
magnocellular fibers enter the optic disc (3). To refine their reduction, the present
study decided to ‘clean’ them from VD. Hood et al (25) demonstrated that VDs play a
significant role in RNFL thickness, and that ~13% of the total
peripapillary RNFL thickness in healthy subjects is attributable to
blood vessels. Patel et al (26) similarly revealed that blood vessels
account for 9.3% of the total RNFL thickness or area, but vary by
retinal location. On average, 17.6% of the upper and 14.2% of the
lower RNFL are vascular, whereas blood vessels comprise only 2.3%
of the areas of the temporal and nasal RNFL. Pereira et al
(27) reported that, according to
their model, the circumpapillary distribution of retinal vessels is
affected by VD in up to 70% of RNFL thickness. In addition,
Allegrini et al (28)
revealed a vascular contribution to RNFL thickness of
29.07±3.945%.
The present study also demonstrated that the
greatest effect of pathological IOP is on VD in segments 1, 4, 5,
6, 7 and 8, and for RNFL in segments 1, 4, 5 and 8. After
‘cleaning’ VD for RNFL thickness, the current study observed the
highest IOP correlations in segments 5 and 8; that is, at the
points where the strongest axons of ganglion cells, which
correspond to magnocellular cells, enter the optic disc. Therefore,
in early stages of hypertensive glaucoma, the present study
recommends focusing on RNFL assessment in the upper and lower
segments of the optic nerve disc peripapillary region. In
conclusion, the present study revealed the most significant RNFL
damage in the lower and upper segments after ‘cleaning’ from VD,
which is the location where the magnocellular fibers are found.
Acknowledgements
This endeavor would not have been possible without
the cooperation of Ophthalmology Clinic JL (V Hurkach 1296/10,
Prague, Czech Republic), where Dr Jan Lešták is the head of the
clinic and Mr Martin Fůs is the engineer of the department, and who
both performed measurements on patients.
Funding
Funding: No funding was received.
Availability of data and materials
The datasets used and/or analyzed during the current
study are available from the corresponding author on reasonable
request.
Authors' contributions
JL conceptualized and designed the study. MF and JK
designed and implemented the clinical investigations and outcome
assessment. JK provided the data analyses. MF wrote the manuscript.
MF, JK and JL confirm the authenticity of all the raw data. All
authors have read and approved the final manuscript.
Ethics approval and consent to
participate
The present study was performed according to the
Declaration of Helsinki and was approved by the internal ethics
committee of the Ophthalmology Clinic JL (approval no.
OKJL/220606/13; Prague, Czech Republic). Written informed consent
for participation was obtained from all patients.
Patient consent for publication
Not applicable.
Competing interests
The authors declare that they have no competing
interests.
References
|
1
|
Jia Y, Wei E, Wang X, Zhang X, Morrison
JC, Parikh M, Lombardi LH, Gattey DM, Armour RL, Edmunds B, et al:
Optical coherence tomography angiography of optic disc perfusion in
glaucoma. Ophthalmology. 21:1322–1332. 2014.PubMed/NCBI View Article : Google Scholar
|
|
2
|
Kral J, Lestak J and Nutterova E: OCT
angiography, RNFL and visual field at different values of
intraocular pressure. Biomed Rep. 16(36)2022.PubMed/NCBI View Article : Google Scholar
|
|
3
|
Lešták J, Fůs M and Král J: The
Relationship Between the Thickness of cpRNFL in Segments and
Intraocular Pressure. Clin Ophthalmol. 16:3673–3679.
2022.PubMed/NCBI View Article : Google Scholar
|
|
4
|
Choi J and Kook MS: Systemic and ocular
hemodynamic risk factors in glaucoma. Biomed Res Int.
2015(141905)2015.PubMed/NCBI View Article : Google Scholar
|
|
5
|
Siesky B, Harris A, Vercellin ACV,
Guidoboni G and Tsai JC: Ocular blood flow as it relates to race
and disease on glaucoma. Adv Ophthalmol Optom. 6:245–262.
2021.PubMed/NCBI View Article : Google Scholar
|
|
6
|
Lestak J, Fus M, Rybar M and Benda A: OCTA
and doppler ultrasound in primary open-angle glaucoma and
normal-tension glaucoma. Life. 13(610)2023.PubMed/NCBI View Article : Google Scholar
|
|
7
|
Nakazawa T: Ocular blood flow and
influencing factors for glaucoma. Asia Pac J Ophthalmol (Phila).
5:38–44. 2016.PubMed/NCBI View Article : Google Scholar
|
|
8
|
Lešták J, Fůs M, Benda A, Bartošová L and
Marešová K: OCT angiography and doppler ultrasound in hypertension
glaucoma. Cesk Slov Oftalmol. 77:130–133. 2021.PubMed/NCBI View
Article : Google Scholar
|
|
9
|
Chen X, Hong Y, Di H, Wu Q, Zhang D and
Zhang C: Change of retinal vessel density after lowering
intraocular pressure in ocular hypertension. Front Med (Lausanne).
8(730327)2021.PubMed/NCBI View Article : Google Scholar
|
|
10
|
Shin JW, Sung KR, Uhm KB, Jo J, Moon Y,
Song MK and Song JY: Peripapillary microvascular improvement and
lamina cribrosa depth reduction after trabeculectomy in primary
open-angle glaucoma. Invest Ophthalmol Vis Sci. 58:5993–5999.
2017.PubMed/NCBI View Article : Google Scholar
|
|
11
|
Park HL, Hong KE, Shin DY, Jung Y, Kim EK
and Park CK: Microvasculature recovery detected using optical
coherence tomography angiography and the rate of visual field
progression after glaucoma surgery. Invest Ophthalmol Vis Sci.
62(17)2021.PubMed/NCBI View Article : Google Scholar
|
|
12
|
Zéboulon P, Lévêque PM, Brasnu E, Aragno
V, Hamard P, Baudouin C and Labbé A: Effect of surgical intraocular
pressure lowering on peripapillary and macular vessel density in
glaucoma patients: An optical coherence tomography angiography
study. J Glaucoma. 26:466–472. 2017.PubMed/NCBI View Article : Google Scholar
|
|
13
|
Díaz F, Villena A, Vidal L, Moreno M,
García-Campos J and Pérez de Vargas I: Experimental model of ocular
hypertension in the rat: Study of the optic nerve capillaries and
action of hypotensive drugs. Invest Ophthalmol Vis Sci. 51:946–951.
2010.PubMed/NCBI View Article : Google Scholar
|
|
14
|
Wang X, Chen J, Kong X and Sun X:
Immediate changes in peripapillary retinal vasculature after
intraocular pressure elevation -an optical coherence tomography
angiography study. Curr Eye Res. 45:749–756. 2020.PubMed/NCBI View Article : Google Scholar
|
|
15
|
Tsuda Y, Nakahara T, Ueda K, Mori A,
Sakamoto K and Ishii K: Effect of nafamostat on
N-methyl-D-aspartate-induced retinal neuronal and capillary
degeneration in rats. Biol Pharm Bull. 35:2209–2213.
2012.PubMed/NCBI View Article : Google Scholar
|
|
16
|
Grewer C, Gameiro A, Zhang Z, Zhen T,
Braams S and Rauen T: Glutamate forward and reverrse transport:
From molecular mechanism to transporter-mediated release after
ischemia. IUBMB Life. 60:609–619. 2008.PubMed/NCBI View
Article : Google Scholar
|
|
17
|
Vorwerk CK, Gorla MS and Dreyer EB: An
experimental basis for implicating excitotoxicity in glaucomatous
optic neuropathy. Surv Ophthalmol. 43 (Suppl 1):S142–S150.
1999.PubMed/NCBI View Article : Google Scholar
|
|
18
|
Curcio CA and Allen KA: Topography of
ganglion cells in human retina. J Comp Neurol. 300:5–25.
1990.PubMed/NCBI View Article : Google Scholar
|
|
19
|
Morgan JE, Uchida H and Caprioli J:
Retinal ganglion cell death in experimental glaucoma. Br J
Ophthalmol. 84:303–310. 2000.PubMed/NCBI View Article : Google Scholar
|
|
20
|
Morgan JE: Retinal ganglion cell shrinkage
in glaucoma. J Glaucoma. 11:365–370. 2002.PubMed/NCBI View Article : Google Scholar
|
|
21
|
Shou T, Liu J, Wang W, Zhou Y and Zhao K:
Differential dendritic shrinkage of alpha and beta retinal ganglion
cells in cats with chronic glaucoma. Invest Ophthalmol Vis Sci.
44:3005–3010. 2003.PubMed/NCBI View Article : Google Scholar
|
|
22
|
Weber AJ, Kaufman PL and Hubbard WC:
Morphology of single ganglion cells in the glaucomatous primate
retina. Invest Ophthalmol Vis Sci. 39:2304–2320. 1998.PubMed/NCBI
|
|
23
|
Naskar R, Wissing M and Thanos S:
Detection of early neuron degeneration and accompanying microglial
responses in the retina of a rat model of glaucoma. Invest
Ophthalmol Vis Sci. 43:2962–2968. 2002.PubMed/NCBI
|
|
24
|
Quigley HA, Dunkelberger GR and Green WR:
Chronic human glaucoma causing selectively greater loss of large
optic nerve fibers. Ophthalmology. 95:357–363. 1988.PubMed/NCBI View Article : Google Scholar
|
|
25
|
Hood DC, Fortune B, Arthur SN, Xing D,
Salant JA, Ritch R and Liebmann JM: Blood vessel contributions to
retinal nerve fiber layer thickness profiles measured with optical
coherence tomography. J Glaucoma. 17:519–528. 2008.PubMed/NCBI View Article : Google Scholar
|
|
26
|
Patel N, Luo X, Wheat JL and Harwerth RS:
Retinal nerve fiber layer assessment: Area versus thickness
measurements from elliptical scans centered on the optic nerve.
Invest Ophthalmol Vis Sci. 52:2477–2489. 2011.PubMed/NCBI View Article : Google Scholar
|
|
27
|
Pereira I, Weber S, Holzer S, Resch H,
Kiss B, Fischer G and Vass C: Correlation between retinal vessel
density profile and circumpapillary RNFL thickness measured with
Fourier-domain optical coherence tomography. Br J Ophthalmol.
98:538–543. 2014.PubMed/NCBI View Article : Google Scholar
|
|
28
|
Allegrini D, Montesano G, Fogagnolo P,
Pece A, Riva R, Romano MR and Rossetti L: The volume of
peripapillary vessels within the retinal nerve fibre layer: An
optical coherence tomography angiography study of normal subjects.
Br J Ophthalmol. 102:611–621. 2018.PubMed/NCBI View Article : Google Scholar
|