Introduction
Cyclosporin A (CSA) is a potent immunosuppressant
(ISD) that has been widely used in organ transplantation and
autoimmune disorders. Long-term use of CSA may lead to several
adverse effects, such as hypertension, hyperlipidemia,
hepatotoxicity, and in particular, neurotoxicity (1,2).
Furthermore, due to the narrow therapeutic window and large
inter-individual variability, regular blood concentration
monitoring of CSA with subsequent dosage adjustment to maximize
treatment efficacy and reduce adverse effects is crucial.
Currently, CSA blood concentrations, including both
trough and peak concentrations, which can be as high as 6,000 ng/ml
in certain patients, are monitored primarily through detection
methods including high-performance liquid chromatography (HPLC),
liquid chromatography-tandem mass spectrometry (LC-MS/MS), and
immunoassays.
Among these methods, LC-MS/MS has long been regarded
as the gold standard for the detection of ISD drug concentrations,
as other methods have limitations. The greatest challenges with
immunoassays are the non-specific matrix effects and
cross-reactions between immunoassay antibodies and drug
metabolites, which reduce the specificity, accuracy, and
sensitivity of immunoassays (3).
Although HPLC is less affected by cross-reacting metabolites, CSA
lacks chromophores and functional groups that can be used to
prepare derivatives and must be monitored at a short wavelength of
210 nm (4), at which several other
substances also absorb. Therefore, pretreatment is necessary for
whole blood samples to enrich and purify CSA as much as
possible.
LC-MS/MS combines the separation efficiency of HPLC
with the high sensitivity of MS, although ease of use remains a
challenge. Certain LC-MS/MS methods require cumbersome pretreatment
steps, commonly using a multi-step protein precipitation procedure,
liquid-liquid extraction methods, and solid-phase extraction
(5-9).
Both the time and cost of sample pretreatment and the long
separation time together limit the throughput of LC-MS/MS,
especially for those with a single liquid chromatography system
with a long running time. Furthermore, the isotope abundance
contributions of some internal standards with fewer isotopes, for
example, CSA-d4 (3,10,11)
also pose a challenge to accuracy (12). The aim of this study was to develop
a high throughput LC-MS/MS method with a simple sample preparation
method and high quantitative value for the detection of CSA in
whole blood, using CSA A-d12 as the internal standard, to provide a
method with high clinical application value to promote
individualized precision drug monitoring.
Materials and methods
Reagents and specimen preparation
CSA was calibrated using a 6-point calibration curve
with 6Plus1 Multilevel ISD calibrators in whole blood
(Chromsystems) with concentrations of 23.40, 128.40, 294.00,
471.00, 745.00, and 1,890.00 ng/ml, which were also used for
linearity validation. Internal quality controls (QCs) were
evaluated using Bio-Rad Lyphochek Whole Blood ISD Controls levels
1, 2, 4, and level 5 were added when there was a high-concentration
sample (Bio-Rad Laboratories, Inc.). CSA Standard (CAS 59865-13-3,
≥95%) was provided by MilliporeSigma, and
[2H12]-Cyclosporin A (CSA-d12, AlsaChim) with
a purity of 98% 2H was used as an internal standard
(IS). Formic acid and zinc sulfate were obtained from
MilliporeSigma (analytical grade). Other solvents and reagents were
HPLC grade. Ultrapure water of 18.2 MΩ cm resistivity was obtained
from a Milli-Q (MilliporeSigma) water purification system.
Samples were pretreated by mixing 20 µl EDTA
anti-coagulated whole blood with 400 µl sample pretreatment reagent
consisting of 0.05 M zinc sulfate and 30.0 ng/ml CSA-d12 in 50%
methanol/water. Samples were vortexed vigorously for more than 20
sec and mixed for 5 min in a 55-well oscillator. After centrifuging
for 5 min at 10,000 x g at 4˚C, the obtained supernatant was used
for analysis.
Instruments and parameters
LC-MS/MS analysis was performed on an LC-20AXR
(Shimadzu Corporation) tandem AB SCIEX API4000 plus LC-MS/MS
instrument (Applied Biosystems) at Guangzhou KingMed Center for
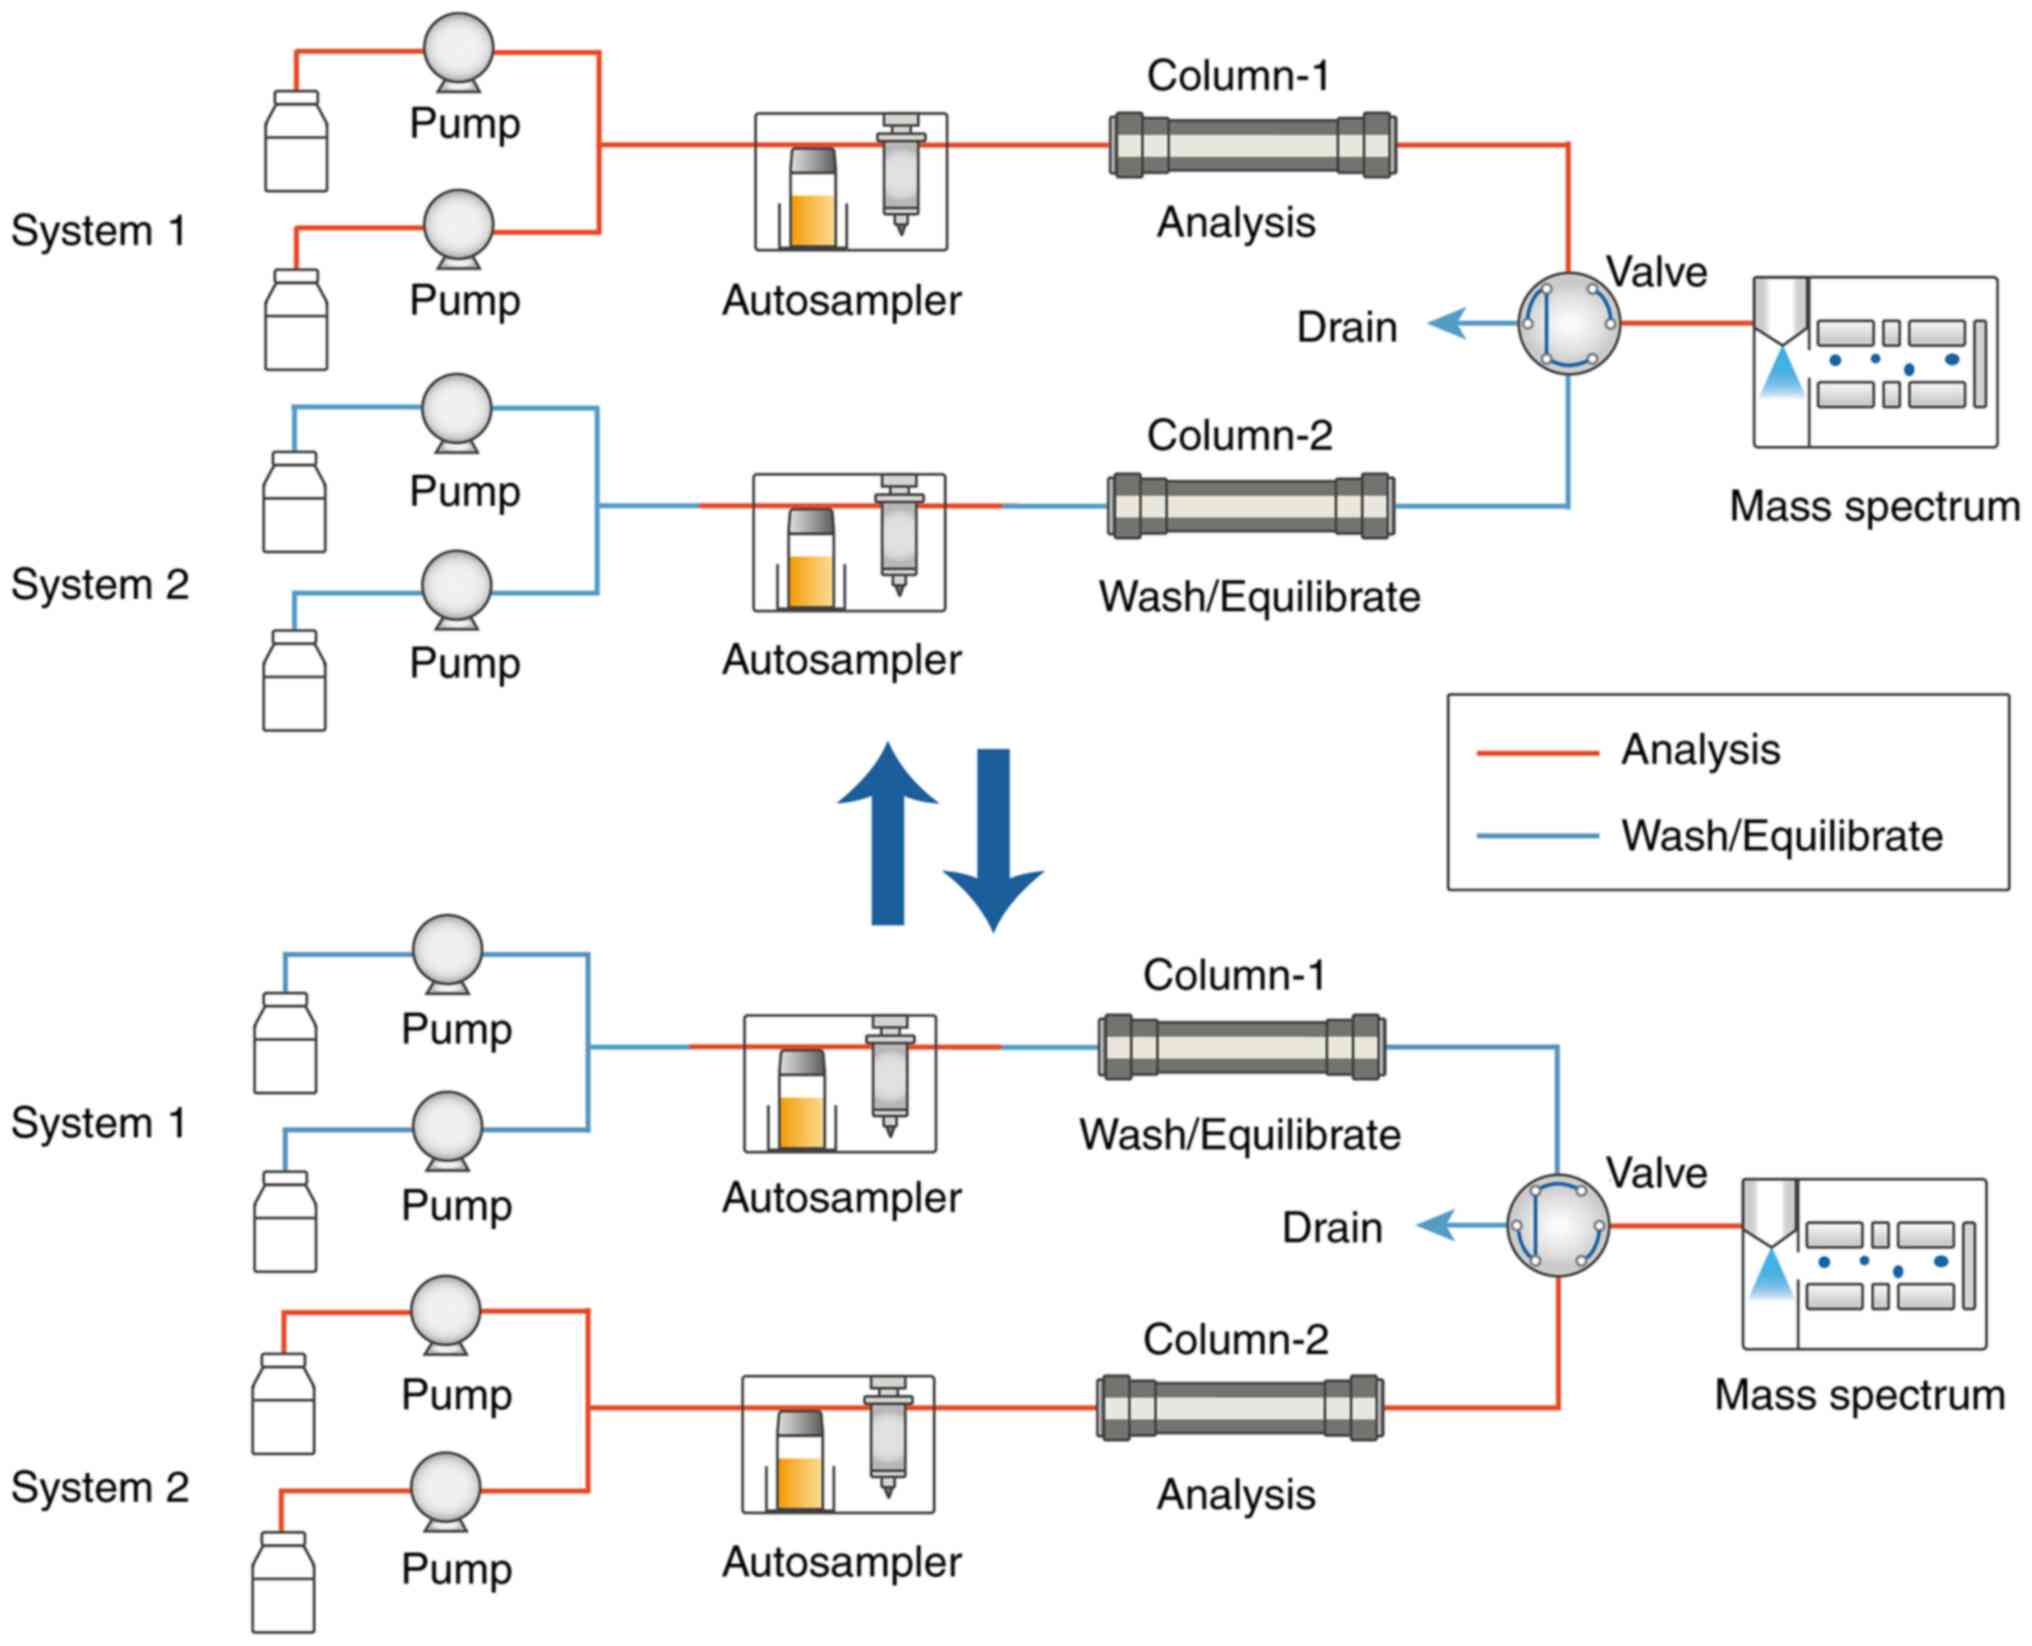
Clinical Laboratory Co., Ltd. (Guangzhou, China). Two HPLC systems
were paralleled via a six-port switching valve mounted on an MPX
driver (Fig. 1). The system was
controlled and data was processed using the Analyst software (AB
SCIEX, version 1.6.2), followed by quantitative analysis using the
MultiQuant software (AB SCIEX, version 3.0.1) with the default
integration parameters except for a 0.05 min baseline sub. window
and a weighting factor of 1/x for area linear regression.
Chromatographic separation was achieved on a C18
column (MilliporeSigma, 2.1x50 mm, 2.7 µm particles) with a C18
SecurityGuard column (Phenomenex, 2x2.1 mm) at 60˚C. A gradient
elution program was set at a flow rate of 0.5 ml/min from 60%
buffer B and changed to 100% buffer B (buffer A: 2 mM ammonia
acetate and 0.1% formic acid in water; buffer B: methanol) at 1.5
min for 1.0 min. From 2.51 to 3.5 min the gradient was changed and
kept at 60% buffer B to stabilize the column for the next injection
(Table I). The injection volume
was 10 µl.
 | Table IThe gradient elution used for
LC-MS/MS detection of CSA |
Table I
The gradient elution used for
LC-MS/MS detection of CSA
| Step | Analysis time
(min) | Flow rate
(ml/min) | Mobile phase A
% | Mobile phase B
% |
|---|
| 1 | 0 | 0.5 | 40 | 60 |
| 2 | 1.5 | 0.5 | 0 | 100 |
| 3 | 2.5 | 0.5 | 0 | 100 |
| 4 | 2.51 | 0.5 | 40 | 60 |
| 5 | 3.5 | 0.5 | 40 | 60 |
Through the paralleled HPLC systems, during the 1.5
min interval from 0.8 to 2.3 min, the LC was set to the mass
spectrometer, and another sample could be detected during the
remaining time (Fig. 1). The
autosampler needed an additional 0.4 min per sample for injection.
In this way, within 4.3 min, two samples were detected, thus
allowing for a shorter analysis time for each sample of 2.15 min,
thus improving the instrument throughput.
An electrospray ionization source was used in
positive ion mode (Applied Biosystems). Precursor/production pairs
were used (1,219.9/1203.0 m/z for CSA and 1,232.0/1,215.2 m/z for
CSA-d12) in multiple reaction monitoring (MRM) mode with a dwell
time of 120 msec. Qualitative ion pairs were also monitored
(1,221.0/1,204.0 m/z for CSA and 1,233.0/1,216.1 m/z for CSA-d12)
with a dwell time of 60 msec. MRM pairs were processed at 60, 6,
30, and 20 V for declustering potential, entrance potential,
collision energy, and collision cell exit potential, respectively.
The curtain gas, collision gas, nebulizer gas, and auxiliary gas
were set at 25, 5, 50, and 60 psi, respectively. The ion spray
voltage was 5,500 V, and the source temperature was 400˚C.
Method validation
The modified LC-MS/MS assay was evaluated according
to the guidelines in the CLSI LC-MS C62-A documentation and the
International Association of Therapeutic Drug Monitoring and
Clinical Toxicology (IATDMCT) expert consensus group (12,13).
HPLC-MS, affinity chrome-mediated immunoassay (ACMIA),
chemiluminescent microparticle immunoassay (CMIA),
electrochemiluminescence immunoassay (ECLIA), and cloned enzyme
donor immunoassay (CEDIA) were performed as described previously
(6,14-16).
Inter-day and intra-day precision
Whole blood samples at three concentration levels
were used to assess the intra-day precision and inter-day precision
(n=20 for each concentration). Intra-day precision was processed on
the same day and day-to-day variability was assessed by analysis of
two sets of samples on 10 different days. The acceptance criterion
for total imprecision was based on the recommendation of the
IATDMCT expert consensus group of ≤10% (13).
Linearity and sensitivity
A total of six samples of each concentration were
measured in duplicate on 3 different days. Whilst 23.40, 128.40,
294.00, 471.00, 745.00, and 1,890.00 ng/ml were obtained from the
6-point calibration curve (Chromsystems), 5.85 and 7.80 ng/ml were
obtained by dilution from 23.40 ng/ml by the blank point. The
acceptance criterion was defined as a regression deviation <10%
and the calibration curve had to have a correlation coefficient (r)
of 0.99 or better. The lowest concentration that met the above
criteria and had a signal-to-noise ratio >10 was accepted as the
lower limit of quantitation (LLoQ).
The clinical reportable range was determined
according to the linear range and the maximum dilution multiple. A
high-concentration sample was diluted 2, 4, or 8 times with
homogeneous drug-free whole blood (EDTA anticoagulant). Sample
concentrations after dilution should be within the linear range and
not threefold below the LLoQ. Taking the concentrations before
dilution as references, the dilution multiple was determined by
analyzing five replicates of patient samples before and after
dilution separately. The recovery of the diluted samples should
range from 85 to 115%, and the deviation of five duplicates should
be <15%.
Accuracy and recovery
A total of six external quality assessment (EQA)
samples [Laboratory of the Government Chemist (LGC) Institution]
under the ISD program (CICTAC-Cyclosporin) were detected to assess
the method's accuracy. A bias within ±25% and a Z score under ±3
was considered acceptable.
In recovery experiments, three concentration levels
of whole blood samples were spiked with low, moderate, and high
concentrations of standard solutions separately to calculate
recoveries. All the spiked and unspiked samples were analyzed with
three replicates. The spiked recovery, which refers to (spiked
sample concentration - unspiked sample concentration)/standard
spiked value, should be within 85-115%.
Matrix specificity and matrix
effect
Matrix specificity was validated by evaluation of
the presence of any peaks in the corresponding position for the CSA
and CSA-d12 when the blank matrix (the point of STD-0 in the
standard curve) and the blank patient samples were detected.
The matrix effect is independent of the presence of
the analyte and influences the accurate quantification for CSA
(10). In this matrix admixing
experiment, the matrix effect between whole blood patient sample
and QC or calibration was evaluated. Standard solutions (a and b:
commercial QC at low and high concentrations respectively, Bio-Rad
Laboratories, Inc; c-f: matrices at blank, low, moderate, and high
concentrations of the calibration respectively, Chromsystems
Instruments & Chemicals GmbH), patient samples, and mixed
samples (standard solutions mixed with six samples A-F from
different patients separately in different proportions) were
prepared. The matrix effect was evaluated through the analysis of
three replicates of the three different matrix samples above
separately. The deviation between the response of the mixed samples
and the response average of the patient samples and standard
solutions should be <20%.
A post-column infusion experiment was processed to
evaluate the matrix, in which the analytes dissolved in solvent
(1.0 mg/l CSA or CSA-d12 in 50% methanol/water) was directly
infused into the mass spectrometer using a syringe pump (30 µl/min)
to gain a stable total ion count (TIC). Then three different
extracted matrix samples were separately injected concurrently by
the HPLC system. There should be no decrease or increase in TIC of
the direct infusion observed at the time point when the matrix
components are eluted from the column.
Carryover
Carryover was evaluated through repeated (n=3)
injections of samples with low concentration (C1, LLoQ),
immediately followed by high concentration [C2, upper (U)LoQ] and
low concentration (C3, LLoQ) injections. The acceptance criterion
was ≤20% carryover, which was calculated using the following
formula: Bias=(C3 mean-C1 mean)/C1 mean x100%.
Clinical application of the LC-MS/MS
method. Subjects
This modified method was used for the detection of
CSA concentrations in 41 nephrotic patients (33 with nephrotic
syndrome and 8 with kidney transplants) who were treated with CSA
between April 2016 and July 2021 in the Guangdong Provincial
Hospital of Chinese Medicine (Guangdong, China). Among these
patients, 10 were women and 31 were men, with an age range of 17-78
years, a median age of 44 years and an mean age of 43.46±16.54
years. EDTA anticoagulated whole blood was collected from patients
before the morning CSA dose using the aforementioned LC-MS/MS
method to obtain the CSA trough concentration. Patient information,
such as clinical diagnosis, CSA trough concentration, laboratory
indicators, and drug combinations were recorded. This study was
approved by the Ethics Committee of Guangdong Provincial Hospital
of Chinese Medicine (approval no. ZE2020-240-01). Written informed
consent was obtained from all participants.
Definitions
Chronic kidney disease (CKD) was graded on the basis
of the estimated glomerular filtration rate (eGFR) according to the
KDIGO guidelines (17): CKD1, eGFR
≥90 ml/min/1.73 m2; CKD2, eGFR 60-90 ml/min/1.73
m2; CKD3, eGFR 30-59 ml/min/1.73 m2; CKD4,
eGFR 15-29 ml/min/1.73 m2; CKD5, eGFR <15 ml/min/1.73
m2.
Statistical analysis
Statistical analyses were performed using MedCalc
version 20.0.22 (MedCalc Software bvba), SPSS Statistics version
20.0 (IBM Corp.), and GraphPad Prism version 8.3 (GraphPad
Software, Inc.). The results of proficiency testing were evaluated
using Passing-Bablok regression and Bland-Altman plots. Continuous
data are presented as the mean ± SD for the normally distributed
data or otherwise as the median (range). For intergroup
comparisons, normally distributed data were analyzed using a Welch
one-way ANOVA test with a Games-Howell post hoc test. Non-normally
distributed data were assessed using a Mann-Whitney U test or a
Kruskal-Wallis test. P<0.05 was considered to indicate a
statistically significant difference.
Results
Method validation
The retention times for CSA and CSA-d12 were 1.74
and 1.71 min (0.94 and 0.91 min for the MS monitoring period),
respectively. For the blank matrix and blank patient sample, no
peak was detectable in the corresponding position. A
high-concentration sample (1,692.87 ng/ml) and a low-concentration
sample (10.10 ng/ml) were used to assess carryover. And
cross-contamination between samples was negligible.
A total of six whole blood samples were analyzed to
assess precision, three of these were tested as 20 parallels in 1
day and the remaining three samples were analyzed in duplicate, one
run per day over 10 days (Table
II). For the two HPLC systems, the total imprecision was
<3.64%, which met the goal of ≤10% for all concentrations.
| Table IIValidation results. |
Table II
Validation results.
| Performance
metrics | HPLC system 1 | HPLC system 2 |
|---|
| Intra-day | 84.34±1.36
ng/ml | 1.62% | 83.26±1.07
ng/ml | 1.29% |
| (CV%, n=20) | 541.51±8.51
ng/ml | 1.57% | 530.14±8.68
ng/ml | 1.64% |
| | 1,279.68±16.83
ng/ml | 1.32% | 1,249.94±17.89
ng/ml | 1.43% |
| Inter-day | 83.72±2.58
ng/ml | 3.08% | 83.41±2.20
ng/ml | 2.64% |
| (CV%, n=20) | 467.41±17.03
ng/ml | 3.64% | 464.04±13.86
ng/ml | 2.99% |
| | 1,774.72±47.63
ng/ml | 2.68% | 1,770.31±39.66
ng/ml | 2.24% |
| Linearity
(n=6) | 5.85-1,890.00
ng/ml | | 5.85-1,890.00
ng/ml | |
| Dilution (n=5) | | | | |
| High concentration
sample | 1,841.90±18.56
ng/ml | | 1,831.10±21.87
ng/ml | |
| 2 times
(Recoveries): | 881.29±16.30
ng/ml | 95.69±1.77% | 881.71±7.56
ng/ml | 96.30±0.83% |
| 4 times
(Recoveries): | 459.28±19.08
ng/ml | 99.74±4.14% | 448.42±15.26
ng/ml | 97.96±3.33% |
| 8 times
(Recoveries): | 232.07±3.22
ng/ml | 100.79±1.40% | 229.90±8.76
ng/ml | 100.44±3.83% |
| Carryover (Bias,
n=3) | | 0.8% | | 1.7% |
| Accuracy
(Recoveries, n=9) | 54.04 ng/ml | 95.53±4.25% |
| | 104.49 ng/ml | 95.64±5.65% |
| | 511.73 ng/ml | 95.11±1.92% |
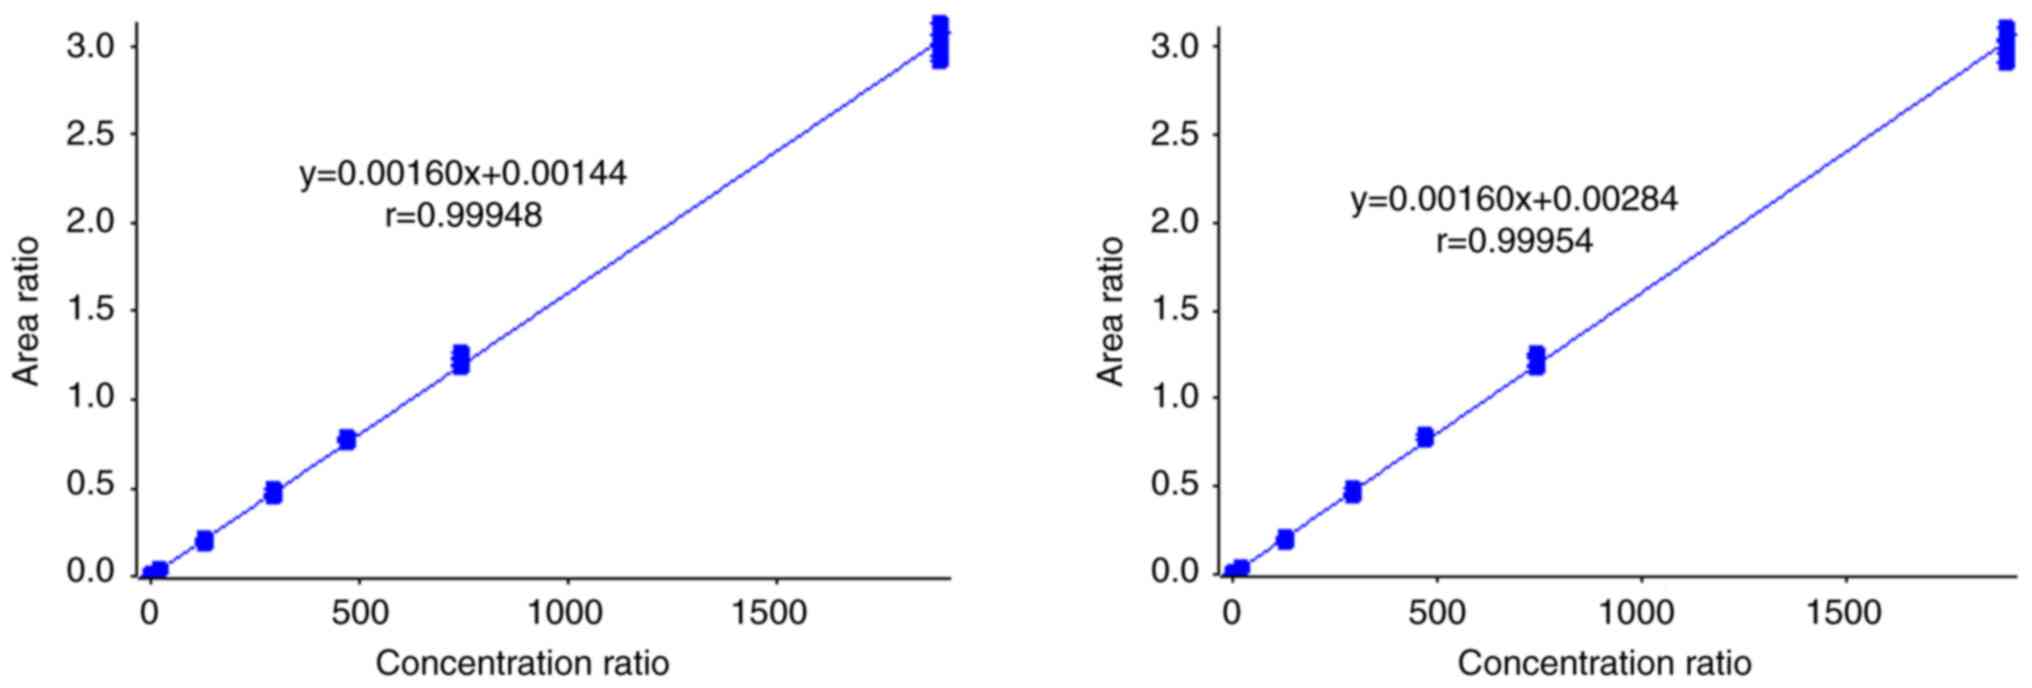
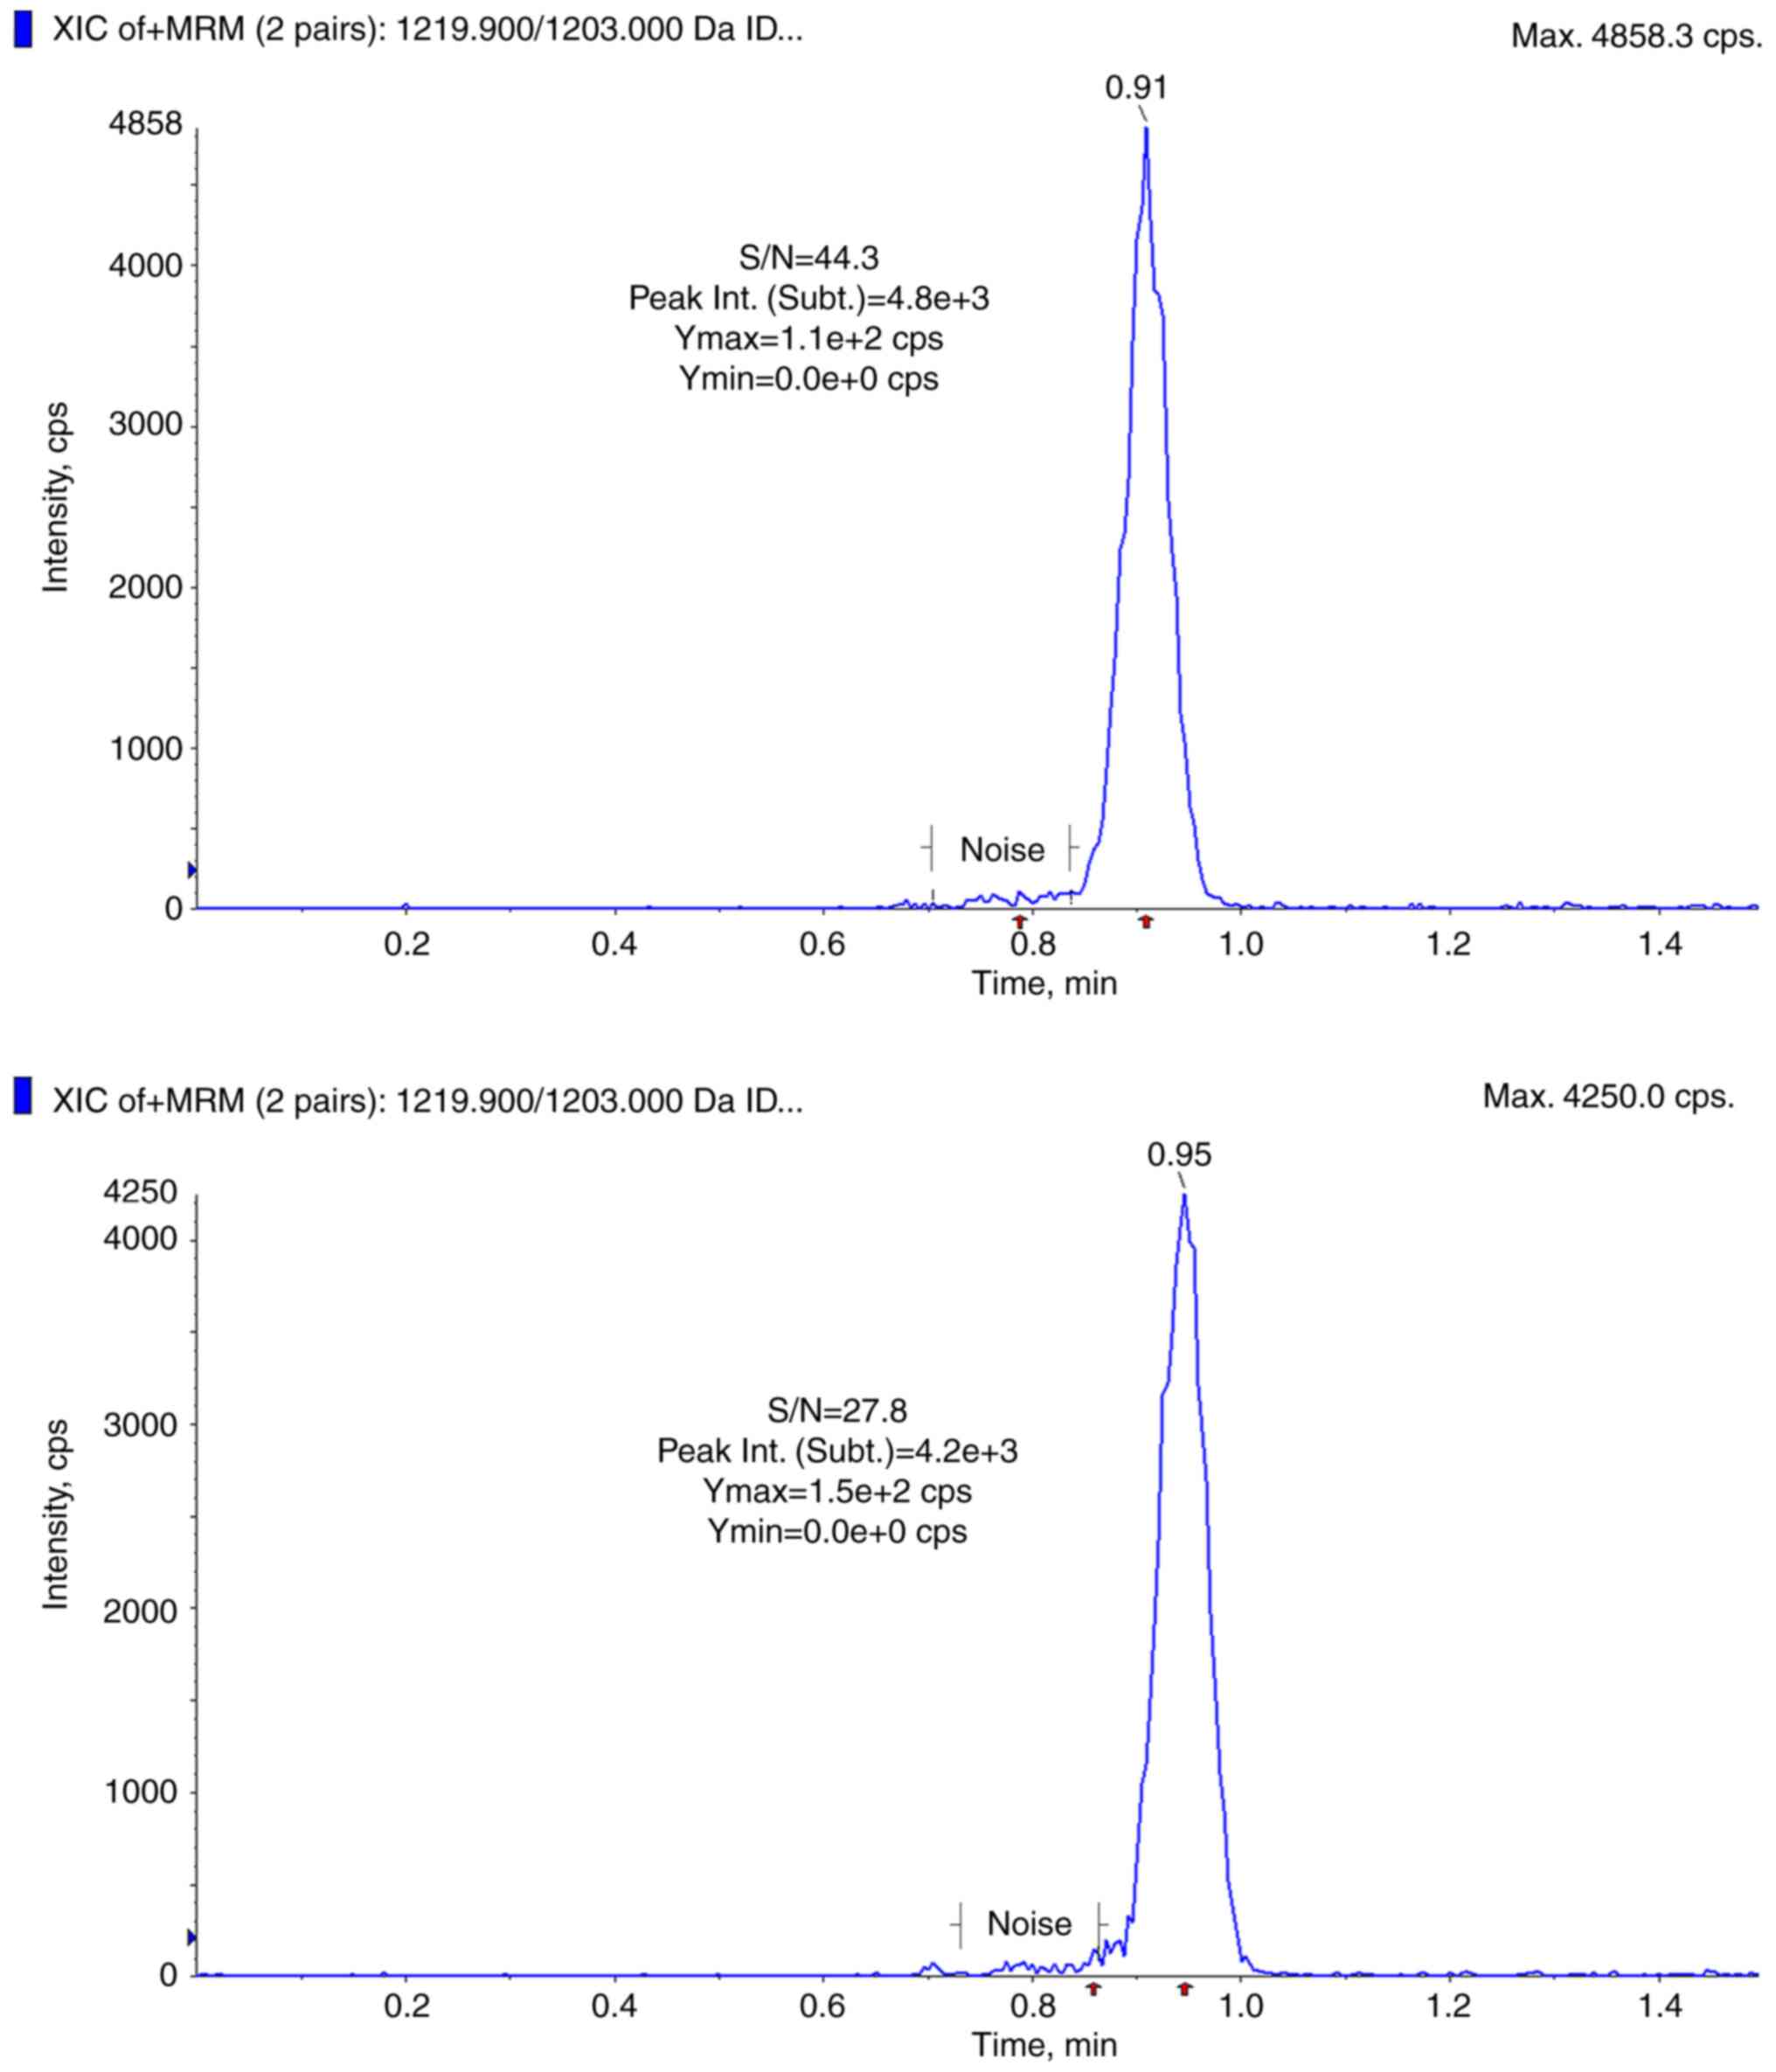
The method showed good correlation in the linear
range of 5.85-1,890.00 ng/ml (weighting 1/x, Fig. 2) with an r >0.99, and the LLoQ
was set to 5.85 ng/ml (Fig. 3).
The linear regression equation was y=0.0016x+0.00144 (r=0.99948)
for HPLC system 1, and y=0.0016x+0.00284 (r=0.99954) for HPLC
system 2. The dilution performance was assessed by diluting a
high-concentration sample with homogeneous drug-free whole blood
(EDTA anticoagulant) 2, 4, or 8 times. Dilution recoveries were
within the pre-defined acceptance limits and the deviation of five
duplicates was <4.15%. Hence, the sample could be quantified by
dilution when the concentration of the analyte exceeded the ULoQ
(1,890.00 ng/ml), which meant that this method could obtain
quantitative results for samples with concentrations between 5.85
and 15,120 ng/ml.
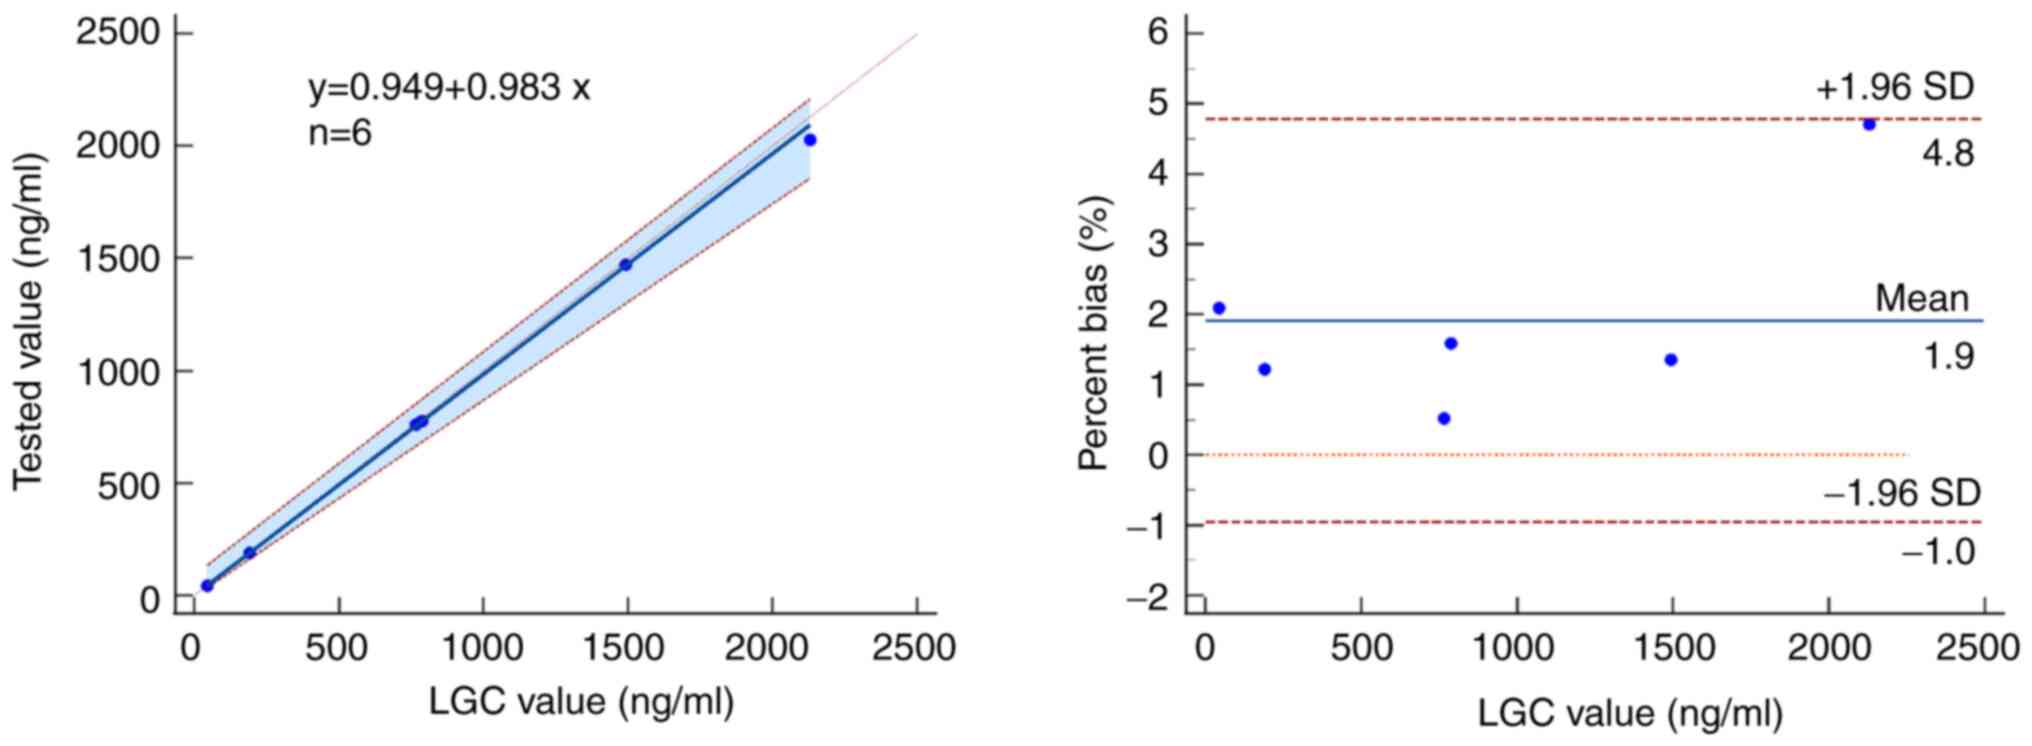
A total of six EQA samples were in good agreement
with the results from the LGC institution (44.05-2,129.50 ng/ml)
and met the acceptable range for the LC-MS/MS method (bias
<±4.71%, Z scores <±0.57%, Fig.
4).
A total of three concentration levels of whole blood
samples (59.73±0.63, 124.87±1.79, and 365.21±0.78 ng/ml) were
spiked with low, moderate, and high concentrations of standard
solutions (54.04, 104.49, and 511.73 ng/ml) separately, and the
spiked recoveries ranged from 89.4-104.7%.
Post-column infusion experiments showed no
observable decrease or increase in the TIC of the direct infusion
when the matrix components were eluted from the column (Fig. 5). For the matrix admixing
experiment, standard solutions and patient samples were mixed in a
1:4 ratio. The deviations of the mean responses ranged from
-1.9-5.5%, thus meeting the acceptance criterion of <20% and
confirming no relative matrix effect.
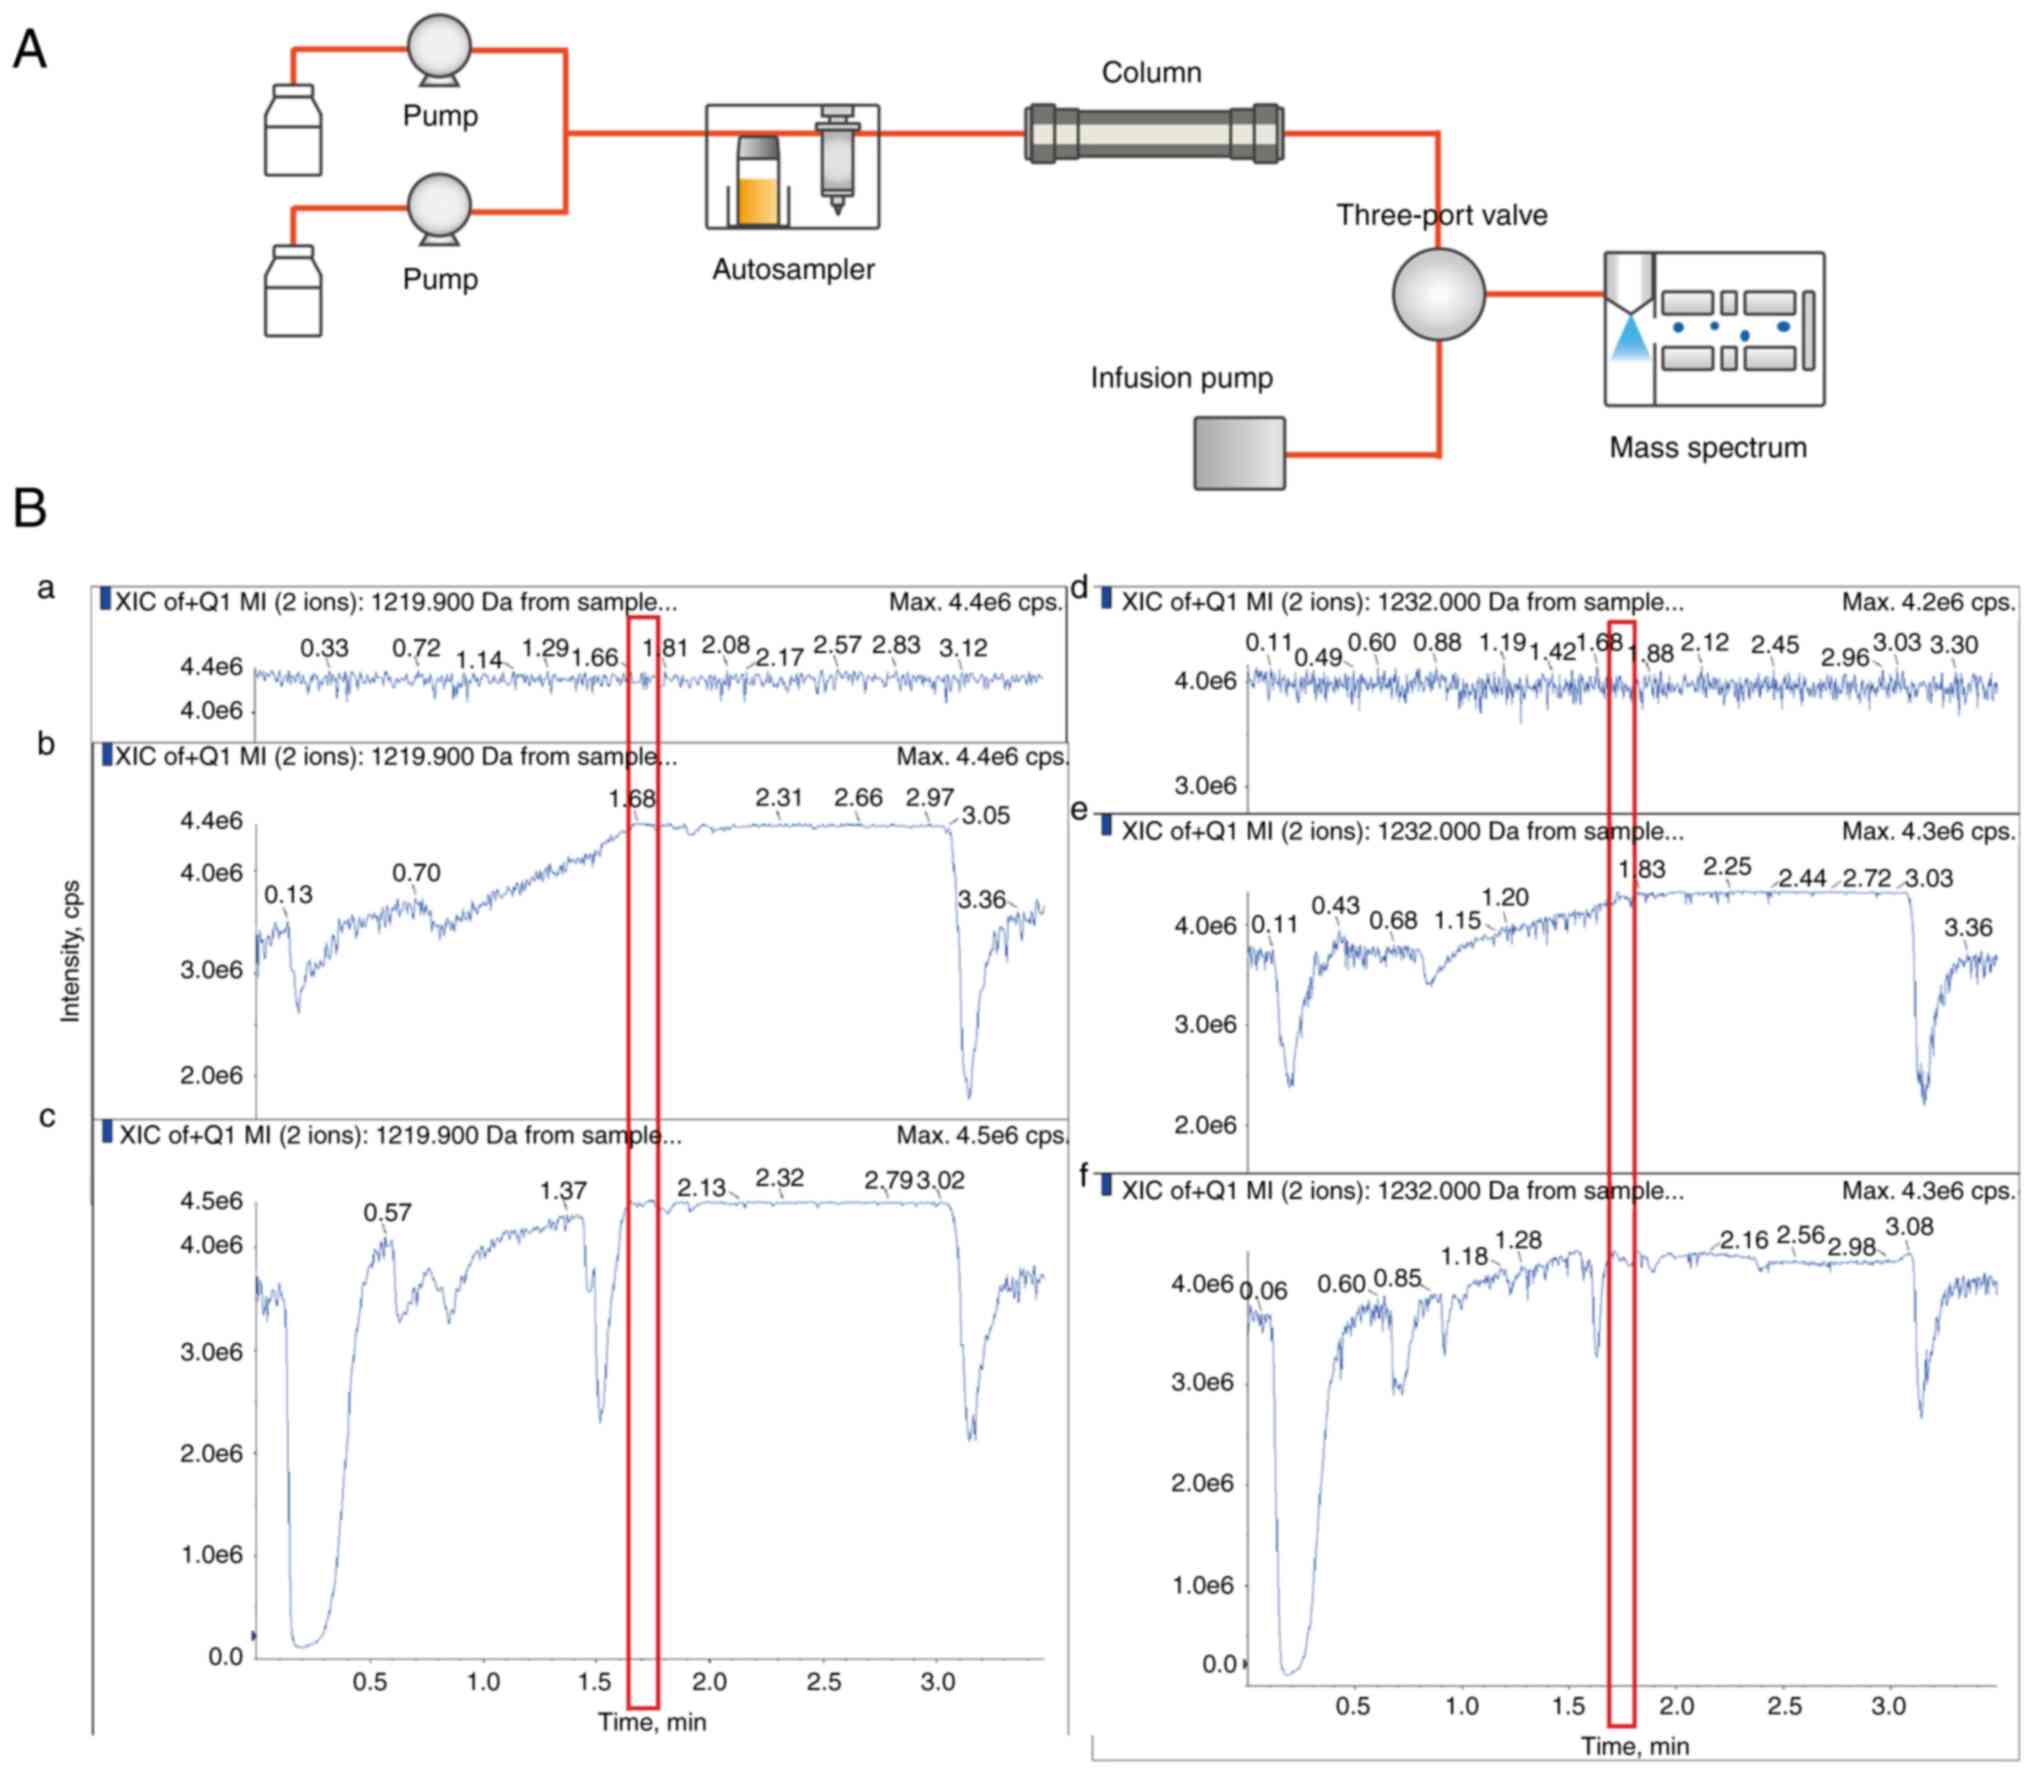 | Figure 5The post-column infusion system and
ion chromatograms of cyclosporin A and cyclosporin A-d12. (A)
Schematic of the post-column infusion system. (B) Comparison of (a,
d) analytes directly infused into the mass spectrometer using a
syringe pump (30 µl/min) after reaching a stable total ion count,
(b, e) 50% methanol/water injection whole blood sample prepared by
protein precipitation, and (c, f) extracted whole blood sample
injection using the post-column infusion method. The time points
(around 1.7 min) when the matrix components are eluted from the
columns are marked in the red box. a, b, and c for cyclosporin A;
d, e, and f for cyclosporin A-d12. XIC, extracted ion
chromatogram. |
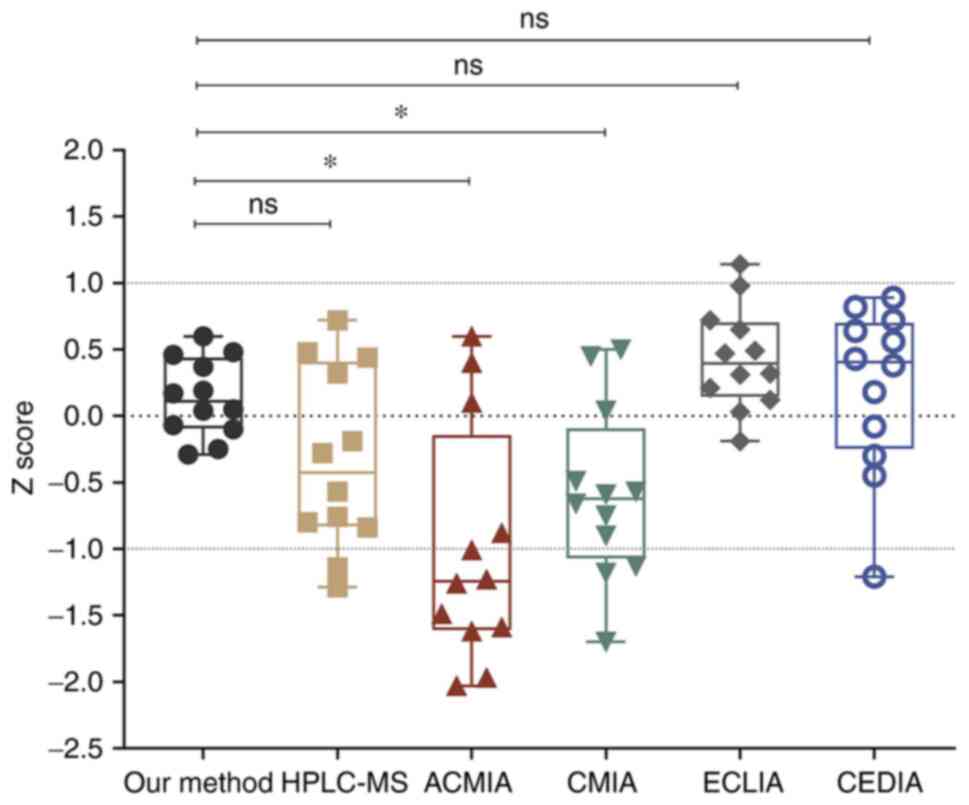
A total of 12 standard samples with a concentration
range of 121.74-1,439 ng/ml were applied to compare the modified
LC-MS/MS with five other CSA detection methods, including HPLC-MS,
ACMIA, CMIA, ECLIA, and CEDIA. The Z score represents the deviation
between the measured value and the target value. In the modified
LC-MS/MS, the Z scores of the 12 samples were between -0.5 and 1,
which were statistically different from ACMIA and CMIA (Fig. 6). However, the Z score of the
LC-MS/MS method (median=0.1,100; 25th-75th
percentile=-0.0925-0.4375) was less discrete when compared with
HPLC-MS (median=-0.425; 25th-75th percentile=-0.830-0.410), ECLIA
(median=0.395; 25th-75th percentile=-0.1425-0.7025) and CEDIA
(median=0.405; 25th-75th percentile = -0.245-0.700). Both ECLIA and
CEDIA are a type of immunoassay based on the specific reaction of
antigen and antibody. The obvious disadvantage was cross-reactivity
with metabolites, particularly in liver transplant recipients where
hepatic dysfunction can lead to alterations in CSA metabolism and
elimination (18). CEDIA had
cross-reactivity for CSA metabolites AM1, AM4n, and AM9, resulting
in a positive bias of the results (16). Likewise, Shigematsu et al
(19) evaluated the analytical
performances of immunoassays in monitoring tacrolimus, using
LC-MS/MS as a standard, and observed a bias of 7.46% in ECLIA.
Thus, the accuracy and stability of the modified LC-MS/MS showed
improvement to some extent.
Clinical application. Overall
monitoring
Patients with kidney transplants received more
frequent monitoring than those with nephrotic syndrome (NS). The
CSA concentration was significantly higher for patients with kidney
transplants than for those with NS (P<0.05). Of the 33 patients
with NS, 13 underwent renal biopsies, and nine were diagnosed with
membranous nephropathy, whereas four showed minimal changes in the
disease. The results of the monitoring are shown in Table III.
| Table IIIResults of cyclosporin A blood
concentrations monitoring in patients with nephropathies. |
Table III
Results of cyclosporin A blood
concentrations monitoring in patients with nephropathies.
| Diseases | Monitor
frequency | C0,
ng/ml (range) |
|---|
| Nephrotic syndrome,
n=33 | 141 | 81.95
(<10.4-872.18) |
| Membranous
nephropathy, n=9 | | 72.02
(13.35-296.13) |
| Minimal change
disease, n=4 | | 76.57
(19.69-281.42) |
| Kidney transplant,
n=8 | 103 | 149.95
(38.43-1079.25) |
Concomitant medications
Concomitant medications were more common in patients
with NS. The CSA treatment was most frequently combined with
antihypertensive agents. The results of the monitoring of patients
with different drug combinations are shown in Table IV.
| Table IVCSA blood concentration in patients
with nephropathy with different drug combinations. |
Table IV
CSA blood concentration in patients
with nephropathy with different drug combinations.
| Drugs | C0 in
nephrotic syndrome, ng/ml | C0 in
kidney transplant, ng/ml (range) |
|---|
|
Antihypertensives | 72.02
(<10.4-385.58), n=22 | 149.95
(48.63-1,079.25), n=6 |
| Lipid-modifying
drugs | 60.75
(<10.4-296.13), n=13 | n=0 |
|
Corticosteroids | 55.00
(<10.4-296.13), n=12 | 153.00
(48.63-1,079.25), n=3 |
| Calcitriol | 48.13
(<10.4-296.13), n=9 | 151.76
(48.63-1,079.25), n=2 |
| Diuretics | 81.22
(15.50-360.11), n=8 | n=0 |
| Gastric mucosal
protective agents | 69.93
(<10.4-281.42), n=8 | 151.76
(48.63-1,079.25) |
| Liver-protection
drugs | 40.79
(<10.4-239.43), n=6 | n=0 |
| Mycophenolic
acid | 93.80
(40.9-167.81), n=2 | 153.00
(48.63-1,079.25), n=3 |
CKD stages
Patients with NS in the CKD3 stage had higher blood
concentrations than those in the CKD1 stage (P<0.05). However,
no statistically significant differences between other grades in
patients with either NS or kidney transplants were observed
(P>0.05, Table V).
| Table VDistribution of CSA blood
concentrations in different CKD stages. |
Table V
Distribution of CSA blood
concentrations in different CKD stages.
| Stage | C0 in
nephrotic syndrome, ng/ml | C0 in
kidney transplant, ng/ml |
|---|
| CKD1 | 73.05
(<10.4-872.18) | - |
| CKD2 | 76.55
(<10.4-360.11) | 154.79
(47.05-247.29) |
| CKD3 | 120.39
(<10.4-310.97) | 149.94
(38.43-1079.25) |
| P-value | NS CKD1 vs. NS
CKD2, 0.783; NS CKD1 vs. NS CKD3, 0.062; NS CKD2 vs. NS CKD3,
0.129. | Kidney transplant
CKD2 vs. CKD3, 0.302; NS CKD2 vs. kidney transplant CKD2,
<0.001; NS CKD3 vs. kidney transplant CKD3, 0.457. |
Discussion
In the monitoring of ISDs, sample preparation is
typically regarded as the bottleneck of the analytical method
(20). In the blood, CSA is often
bound to plasma proteins and erythrocytes, in proportions
influenced by multiple factors such as temperature, hematocrit, and
drug concentration. Therefore, whole blood samples were used for
CSA concentration detection to ensure accurate and stable results
(20). When detected directly
without any purification pretreatment, the complex matrix in whole
blood blocks the chromatographic channels and contaminates the mass
spectrometer, thereby increasing the maintenance costs and
decreasing the lifetime of the instrument. Even after sample
pretreatment, considerable daily maintenance is required for
LC-MS/MS.
Notably, the complicated purification process is
time-consuming and technically challenging (because of personnel
requirements, quality control for the overall process, and
auxiliary equipment demands). Protein precipitation (PPT),
liquid-liquid extraction (LLE), and solid-phase extraction (SPE)
are most frequently used for blood CSA preparation (5-9,21).
Compared to existing protein precipitation methods, the sample
preparation procedure often contains multiple liquid-adding and
mixing steps (Table VI). In this
study, zinc sulfate was pre-mixed with CSA-d12 in methanol/water
and added together. This one-step PPT for sample preparation was
rapid and easier to perform (Table SI).
| Table VIComparison of the modified LC-MS-MS
with previous LC-MS-MS methods. |
Table VI
Comparison of the modified LC-MS-MS
with previous LC-MS-MS methods.
| A, Analytical
performance |
|---|
| Performance
parameters | Present study |
31156436a |
33780006a |
29206806a |
30350284a |
19065123a |
20010460a |
18520600a |
36044751a |
33068377a |
|---|
|
Intra-precision | <1.64% | <7.43% | <4.93% | <6.48% | - | <6.30% | <3.30% | ≤4.70% | ≤.20% | <6.00% |
|
Inter-precision | <3.64% | <7.43% | <5.88% | <8.57% | - | <6.00% | <7.00% | ≤5.10% | - | <6.00% |
|
Accuracy-recovery | 89.4%-104.7% | ±7.0% | >79.8% | 100.4-110.5% | - | -2.5-2.7% | 97.5-107.7% | 89.0% | ≤6.7% | <1.3% |
| EQA Bias | 1.90% | - | - | - | - | - | - | 3.00% | - | - |
| Linear range,
ng/ml | 5.85-1,890.00 | 10-3,000 | 5-2,500 | 5-2,000 | 25-1,000 | 10-2,000 | 10-1,500 | 25-2,000 | 10-800 | 16-450 |
| Quantitation range
(ng/ml) | 5.85-15,120.00 | - | - | 5-20,000 | - | - | - | - | - | - |
| Dilution times | 8 | - | - | 10 | - | 5 | - | - | - | - |
| B, Workflow
procedure |
| Operating
parameters | Present study |
31156436a |
33780006a |
29206806a |
30350284a |
19065123a |
20010460a |
18520600a |
36044751a |
33068377a |
| Sample volume,
µl | 30 | 50 | 50 | 50 | 200 | 200 | 100 | 100 | 300 | - |
| Sample
preparation | One-step
preparation | Two-step
preparation | Solid phase
extraction | Four-step
preparation | - | Two-step
preparation | One-step
preparation and online clean up | Two-step PPT | - | Protein
precipitation |
| Internal
standard | CSA-d12 | CSD | CSA-d4 | Ticlopidine | CSA-13C2, d4 | Ascomycin | CSA-d4 | Ascomycin and
cyclosporin D | - | - |
| Analysis time per
sample | 2.15 min | 5.0 min | 4.0 min | 2.2 min | 15 sec (RapidFire
365) | 2.6 min | 1.5 min | 1.5 min | - | 4.0 min |
Recently, increased efforts have been made to
improve the throughput of CSA detection. Several of these reduced
the LC running time using smaller diameter separation media
(14,22,23),
which may be accompanied by a high column pressure and a higher
risk of column blockage. Additionally, a RapidFire high-throughput
solid-phase extraction system with running times of <15 sec per
sample has been reported in recent years (8). From a clinical point of view, the
injection volume of 400 µl makes the method less suitable for those
patients whose sample collection is more difficult. This novel
method is not yet widespread in domestic laboratories, thus
normalization and standardization are required. In this study, a
C18 column 50x2.1 mm, with 2.7 µm pore size was used for
separation, and the mass spectrometer was coupled to two HPLC
systems. Furthermore, only part of the sample after LC separation
was allowed to enter the mass spectrum, through this double HPLC
system coupled with one mass spectrometry design. Consequently, the
instrument throughput was improved allowing for a routine detection
time of 4.3 min for two samples, that is, 2.15 min per sample. This
study suggested that the two coupled LC systems can be considered
an available alternative for improving the throughput in
laboratories with a large number of samples. As CSA has a narrow
therapeutic window, the rapid and high throughput LC-MS/MS method
for drug-level monitoring may contribute to informing clinical
decision-making better.
Importantly, this easily operable method has not
only high throughput but also good analytical performance. A
potential advantage is the use of CSA-d12 for the internal
standard. Consistent with the view of Yang et al (24), internal standards should be
carefully selected when using HPLC-MS/MS to measure
immunosuppressants, as they are critical for the performance of
detection. The findings of Taylor et al (25) revealed the superior performance of
CSA-d12 when compared with CSD and ascomycin. They described the
presence of interference in the CSD mass transition leading to
negative skewing for high CSA concentrations. Regarding the
deuterium-labeled CSA, the isotope abundance contributions of
CSA-d4 with fewer isotopes also challenge the accuracy.
Furthermore, the inter-day precision is <3.64%, and the
intra-day precision is <1.64%. One possible reason is that the
chromatographic separation time used in the present study was not
long enough, which avoids the influence of the sample matrix.
Meanwhile, there is a stable room temperature controlled within
±2̊C in our laboratory, which is essential for reproducible results
(26).
This modified LC-MS/MS method was applied for the
detection of CSA concentrations in clinical practice. To the best
of our knowledge, multiple factors such as gene polymorphisms,
concomitant medications, and other conditions play important roles
in the pharmacokinetic variability of CSA and influence blood
concentrations (27,28). For managing the patient's condition
and preventing complications, ISD treatment among patients with
nephropathy is frequently combined with corticosteroids,
anti-hypertensives, or lipid-modifying drugs. From a metabolic
perspective, the CSA concentrations in patients with different drug
combinations might yield different results, owing to drug-drug
interactions (5,29). In this study, the CSA
concentrations detected by using the LC-MS/MS method were compared
with those detected by other methods presented in previous studies
in patients with NS or kidney transplants receiving the same drug
combinations (30-33)
(Table VII). However, from a
detection perspective, tandem mass spectrometers provide highly
specific information for drug monitoring. The mass pairs of
precursor and product ions are unique to the specific compound
(34). Therefore, the analyte
concentrations detected by LC-MS/MS were not affected by PK-drug
drug interactions. Furthermore, nephropathies directly affect drug
pharmacokinetics (for example absorption, distribution, and
metabolism) in parallel with the decrease in GFR and tubular
secretion, thus resulting in a decline in kidney drug clearance,
and molecular accumulation (35).
The CSA concentrations may differ among patients with nephropathy
at different stages of kidney function. In this study, the CSA
concentrations detected by our LC-MS/MS method were compared with
other methods presented in previous studies in patients with
nephropathy and similar eGFR (31,36)
(Table VIII). The LC-MS/MS
method presented in this study may provide a much wider detection
range and a lower limit of detection in actual clinical
applications, which appeared to outperform other methods described
in previous studies.
| Table VIIComparison of CSA concentrations
between our method and others in patients with nephropathy treated
with the same drug combinations. |
Table VII
Comparison of CSA concentrations
between our method and others in patients with nephropathy treated
with the same drug combinations.
| First author et
al, year | Drug
Combinations | Methods | CSA daily dose,
mg/day | CSA concentration,
ng/ml (range) | (Refs.) |
|---|
| Inoue et al,
2013 | CSA +
corticosteroids | Enzyme immunoassay,
n=11 | 100-150 | 70.00
(36.00-101.00) | (30) |
| | | LC-MS/MS, n=20 | | 45.46
(<10.4-98.11) | |
| Sommerer et
al, 2008 | CSA +
corticosteroids | Enzyme multiplied
immunoassay technique, n=20 | 175 (100-300) | 105.00
(67.00-206.00) | (31) |
| | | LC-MS/MS, n=30 | 200 (100-300) | 152.88
(48.63-1079.25) | |
| Noreikaite et
al, 2017 | CSA + mycophenolic
acid + corticosteroids | LC-MS/MS, n=83 | 204.80±46.26
120-300 | 59.00-254.00 | (32) |
| | | LC-MS/MS, n=30 | 208.33±43.71
100-300 | 48.63-1,079.25 | |
| Wasilewska et
al, 2007 | CSA +
antihypertensives + corticosteroids | Immunofluorescence,
n=40 | ≤150 | 36.70-215.30 | (33) |
| | | LC-MS/MS, n=24 | ≤150 | 13.35-296.13 | |
| Table VIIIComparison of CSA concentrations
between the method used in the present study and previous
methods. |
Table VIII
Comparison of CSA concentrations
between the method used in the present study and previous
methods.
| First author et
al, year | Methods | Estimated
glomerular filtration rate, ml/min/1.73m2 | CSA daily dose,
mg/day | CSA concentration,
ng/ml | (Refs.) |
|---|
| Sommerer et
al, 2008 | Enzyme multiplied
immunoassay technique, n=20 | 55
(28.00-112.00) | 175 (100-400) | 109
(69.00-176.00) | (31) |
| Trkulja et
al, 2014 | Affinity column-
mediated immunoassay. n=43 | 37.8
(16.60-102.10) | - | 70.00-341.00 | (36) |
| The present
study | Liquid
chromatography- tandem mass spectrometry, n=76 | 58.47
(26.24-99.33) | 200 (100-300) | 109.74
(<10.40-1,079.25) | - |
However, the limited sample size was a drawback of
the study. In follow-up studies, the sample size will be expanded
further to perform more in-depth and comprehensive research.
In conclusion, the design of multi-LC systems plays
a significant role in the improvement of daily detection
throughput, to allow for the application of LC-MS/MS as an integral
part of 24/7 diagnostics in the near future. The high throughput
LC-MS/MS method with a simple sample preparation procedure, a much
wider detection range, and a lower limit of detection than those of
prior methods is suitable for mass specimen detection and thus
provides high clinical application value.
Acknowledgements
Not applicable.
Funding
Funding: The present study was supported by grants from the
National Natural Sciences Foundation of China (grant no. 82072336),
the Natural Science Fund of Guangdong (grant no. 2019A1515010178,
and 2021A1515111125), the Science and Technology Program of
Guangzhou (grant nos. 202002020038, 202102010173, and
202103000025), Guangdong Basic and Applied Basic Research
Foundation Project-key Project of Regional Joint Fund (grant no.
2019B1515120004), Dongguan Science and Technology of Social
Development Program (grant no. 201950715023190), Guangzhou Basic
and Applied Basic Research project (grant no. 202102020101), the
fellowship of China Postdoctoral Science Foundation (grant no.
2021M700904) and the Project of Administration of Traditional
Chinese Medicine of Guangdong Province of China (grant no.
20211180, 20202067 and 20222081).
Availability of data and materials
The datasets used and/or analyzed during the current
study are available from the corresponding author on reasonable
request.
Authors' contributions
BBZ and XZH designed the study. BBZ, BLL, and HD
performed the method validation. KWY was responsible for recording
clinical data. YSY, JML, XRL, and CMK performed the data analysis.
YSY and JML wrote the manuscript. PFK, XRL, YX, and LC confirm the
authenticity of all the raw data. All authors have read and
approved the final manuscript.
Ethics approval and consent to
participate
Ethical approval was obtained from the Committee for
Ethical Review of Research Involving Human Subjects of Guangdong
Provincial Hospital of Chinese Medicine (Guangdong, China).
Patient consent for publication
Written informed consent was obtained from all
participants.
Competing interests
The authors declare that they have no competing
interests.
References
|
1
|
Chighizola CB, Ong VH and Meroni PL: The
use of cyclosporine A in rheumatology: A 2016 comprehensive review.
Clin Rev Allergy Immunol. 52:401–423. 2017.PubMed/NCBI View Article : Google Scholar
|
|
2
|
Wu Q, Wang X, Nepovimova E, Wang Y, Yang H
and Kuca K: Mechanism of cyclosporine A nephrotoxicity: Oxidative
stress, autophagy, and signalings. Food Chem Toxicol. 118:889–907.
2018.PubMed/NCBI View Article : Google Scholar
|
|
3
|
Becker A, Backman JT and Itkonen O:
Comparison of LC-MS/MS and chemiluminescent immunoassays for
immunosuppressive drugs reveals organ dependent variation in blood
cyclosporine a concentrations. Clin Chim Acta. 508:22–27.
2020.PubMed/NCBI View Article : Google Scholar
|
|
4
|
Drira C, Ben Ayed W, Soussi MA, Razgallah
Khrouf M and Fradi I: Validation of routine analytical method for
injectable cyclosporine preparation control using HPLC-FIA assay.
Ann Pharm Fr. 79:266–274. 2021.PubMed/NCBI View Article : Google Scholar
|
|
5
|
Liu R, Li X, Wei J, Liu S, Chang Y, Zhang
J, Zhang J, Zhang X, Fuhr U, Taubert M and Tian X: A single dose of
baicalin has no clinically significant effect on the
pharmacokinetics of cyclosporine A in healthy chinese volunteers.
Front Pharmacol. 10(518)2019.PubMed/NCBI View Article : Google Scholar
|
|
6
|
Koster RA, Dijkers EC and Uges DR: Robust,
high-throughput LC-MS/MS method for therapeutic drug monitoring of
cyclosporine, tacrolimus, everolimus, and sirolimus in whole blood.
Ther Drug Monit. 31:116–125. 2009.PubMed/NCBI View Article : Google Scholar
|
|
7
|
Vosough M and Tehrani SM: Development of a
fast HPLC-DAD method for simultaneous quantitation of three
immunosuppressant drugs in whole blood samples using intelligent
chemometrics resolving of coeluting peaks in the presence of blood
interferences. J Chromatogr B Analyt Technol Biomed Life Sci.
1073:69–79. 2018.PubMed/NCBI View Article : Google Scholar
|
|
8
|
Bjergum MW, Jannetto PJ and Langman LJ:
Simultaneous determination of tacrolimus and cyclosporine A in
whole blood by ultrafast LC-MS/MS. Methods Mol Biol. 1872:111–118.
2019.PubMed/NCBI View Article : Google Scholar
|
|
9
|
Salm P, Taylor PJ and Rooney F: A
high-performance liquid chromatography-mass spectrometry method
using a novel atmospheric pressure chemical ionization approach for
the rapid simultaneous measurement of tacrolimus and cyclosporin in
whole blood. Ther Drug Monit. 30:292–300. 2008.PubMed/NCBI View Article : Google Scholar
|
|
10
|
Gong ZS, Wu ZH, Xu SX, Han WN, Jiang XM,
Liu HP, Yan-Li , Wei-Hu and Yan-Wang : A
high-throughput LC-MS/MS method for the quantification of four
immunosu- ppressants drugs in whole blood. Clin Chim Acta.
498:21–26. 2019.PubMed/NCBI View Article : Google Scholar
|
|
11
|
Pablo AH, Breaud AR and Clarke W: Analysis
of immunosuppressant drugs in whole blood by liquid
chromatography-tandem mass spectrometry (LC-MS/MS). Curr Protoc
Toxicol. 84(e92)2020.PubMed/NCBI View
Article : Google Scholar
|
|
12
|
CLSI. Liquid Chromatography-Mass
Spectrometry Methods; Approved Guideline. CLSI document C62-A.
Wayne, PA: Clinical and Laboratory Standards Institute; 2014.
|
|
13
|
Seger C, Shipkova M, Christians U, Billaud
EM, Wang P, Holt DW, Brunet M, Kunicki PK, Pawinski T, Langman LJ,
et al: Assuring the proper analytical performance of measurement
procedures for immunosuppressive drug concentrations in clinical
practice: Recommendations of the international association of
therapeutic drug monitoring and clinical toxicology
immunosuppressive drug scientific committee. Ther Drug Monit.
38:170–189. 2016.PubMed/NCBI View Article : Google Scholar
|
|
14
|
Mei S, Wang J, Chen D, Zhu L, Zhao M, Hu
X, Yang L and Zhao Z: Ultra-high performance liquid chromatography
tandem mass spectrometry for cyclosporine analysis in human whole
blood and comparison with an antibody-conjugated magnetic
immunoassay. Ther Drug Monit. 40:69–75. 2018.PubMed/NCBI View Article : Google Scholar
|
|
15
|
Toole B, Gechtman C, Dreier J, Kuhn J,
Gutierrez MR, Barrett A and Niederau C: Evaluation of the new
cyclosporine and tacrolimus automated electrochemiluminescence
immunoassays under field conditions. Clin Lab. 61:1303–1315.
2015.PubMed/NCBI View Article : Google Scholar
|
|
16
|
Butch AW and Fukuchi AM: Analytical
performance of the CEDIA cyclosporine PLUS whole blood immunoassay.
J Anal Toxicol. 28:204–210. 2004.PubMed/NCBI View Article : Google Scholar
|
|
17
|
Kidney Disease: Improving Global Outcomes
(KDIGO) CKD-MBD Update Work Group: KDIGO 2017 clinical practice
guideline update for the diagnosis, evaluation, prevention, and
treatment of chronic kidney disease-mineral and bone disorder
(CKD-MBD). Kidney Int Suppl. 7:1–59. 2017.PubMed/NCBI View Article : Google Scholar
|
|
18
|
Tredger JM, Grevel J, Naoumov N, Steward
CM, Niven AA, Whiting B and Williams R: Cyclosporine
pharmacokinetics in liver transplant recipients: Evaluation of
results using both polyclonal radioimmunoassay and liquid
chromatographic analysis. Eur J Clin Pharmacol. 40:513–519.
1991.PubMed/NCBI View Article : Google Scholar
|
|
19
|
Shigematsu T, Suetsugu K, Yamamoto N,
Tsuchiya Y and Masuda S: Comparison of 4 commercial immunoassays
used in measuring the concentration of tacrolimus in blood and
their cross-reactivity to its metabolites. Ther Drug Monit.
42:400–406. 2020.PubMed/NCBI View Article : Google Scholar
|
|
20
|
Zhang Y and Zhang R: Recent advances in
analytical methods for the therapeutic drug monitoring of
immunosuppressive drugs. Drug Test Anal. 10:81–94. 2018.PubMed/NCBI View
Article : Google Scholar
|
|
21
|
Watanabe T, Tanaka R, Ono H, Suzuki Y,
Tatsuta R and Itoh H: Sensitive, wide-range and high-throughput
quantification of cyclosporine in whole blood using
ultra-performance liquid chromatography coupled to tandem mass
spectrometry and comparison with an antibody-conjugated magnetic
immunoassay. Biomed Chromatogr. 35(e5128)2021.PubMed/NCBI View
Article : Google Scholar
|
|
22
|
Szerkus O, Wolska E, Struck-Lewicka W,
Siluk D, Radwanska A, Wiczling P, Chorazewicz J, Sznitowska M,
Markuszewski MJ and Kaliszan R: Development and validation of UHPLC
method for the determination of cyclosporine A in biological
samples. Biomed Chromatogr. 28:802–809. 2014.PubMed/NCBI View
Article : Google Scholar
|
|
23
|
Mei S, Wang J, Chen D, Zhu L, Zhao M, Tian
X, Hu X and Zhao Z: Simultaneous determination of cyclosporine and
tacrolimus in human whole blood by ultra-high performance liquid
chromatography tandem mass spectrometry and comparison with a
chemiluminescence microparticle immunoassay. J Chromatogr B Analyt
Technol Biomed Life Sci. 1087-1088:36–42. 2018.PubMed/NCBI View Article : Google Scholar
|
|
24
|
Yang Z and Wang S: Recent development in
application of high performance liquid chromatography-tandem mass
spectrometry in therapeutic drug monitoring of immunosuppressants.
J Immunol Methods. 336:98–103. 2008.PubMed/NCBI View Article : Google Scholar
|
|
25
|
Taylor PJ, Brown SR, Cooper DP, Salm P,
Morris MR, Pillans PI and Lynch SV: Evaluation of 3 internal
standards for the measurement of cyclosporin by HPLC-mass
spectrometry. Clin Chem. 51:1890–1893. 2005.PubMed/NCBI View Article : Google Scholar
|
|
26
|
Meinitzer A, Gartner G, Pilz S and Stettin
M: Ultra fast liquid chromatography-tandem mass spectrometry
routine method for simultaneous determination of cyclosporine A,
tacrolimus, sirolimus, and everolimus in whole blood using
deuterated internal standards for cyclosporine A and everolimus.
Ther Drug Monit. 32:61–66. 2010.PubMed/NCBI View Article : Google Scholar
|
|
27
|
Nishino T, Takahashi K, Tomori S, Ono S
and Mimaki M: Cyclosporine A C1.5 monitoring reflects the area
under the curve in children with nephrotic syndrome: A
single-center experience. Clin Exp Nephrol. 26:154–161.
2021.PubMed/NCBI View Article : Google Scholar
|
|
28
|
Mulder TAM, van Eerden RAG, de With M,
Elens L, Hesselink DA, Matic M, Bins S, Mathijssen RHJ and van
Schaik RHN: CYP3A4*22 genotyping in clinical practice: Ready
for implementation? Front Genet. 12(711943)2021.PubMed/NCBI View Article : Google Scholar
|
|
29
|
Ziaei M, Ziaei F and Manzouri B: Systemic
cyclosporine and corneal transplantation. Int Ophthalmol.
36:139–146. 2016.PubMed/NCBI View Article : Google Scholar
|
|
30
|
Inoue M, Yumura W, Morishita Y, Ito C,
Hamano Y, Ando Y, Muto S and Kusano E: Patients with adult minimal
change nephrotic syndrome treated with long-term cyclosporine did
not experience a reduction in their eGFR. Clin Nephrol. 79:101–106.
2013.PubMed/NCBI View
Article : Google Scholar
|
|
31
|
Sommerer C, Giese T, Schmidt J, Meuer S
and Zeier M: Ciclosporin A tapering monitored by NFAT-regulated
gene expression: A new concept of individual immunosuppression.
Transplantation. 85:15–21. 2008.PubMed/NCBI View Article : Google Scholar
|
|
32
|
Noreikaitė A, Saint-Marcoux F, Marquet P,
Kaduševičius E and Stankevičius E: Influence of cyclosporine and
everolimus on the main mycophenolate mofetil pharmacokinetic
parameters: Cross-sectional study. Medicine (Baltimore).
96(e6469)2017.PubMed/NCBI View Article : Google Scholar
|
|
33
|
Wasilewska A, Zoch-Zwierz W and Pietruczuk
M: Expression of multidrug resistance P-glycoprotein on lymphocytes
from nephrotic children treated with cyclosporine A and
ACE-inhibitor. Eur J Pediatr. 166:447–452. 2007.PubMed/NCBI View Article : Google Scholar
|
|
34
|
Tuzimski T and Petruczynik A: Review of
chromatographic methods coupled with modern detection techniques
applied in the therapeutic drugs monitoring (TDM). Molecules.
25(4026)2020.PubMed/NCBI View Article : Google Scholar
|
|
35
|
Andre C, Choukroun G, Bennis Y, Kamel S,
Lemaire-Hurtel AS, Masmoudi K, Bodeau S and Liabeuf S: Potential
interactions between uremic toxins and drugs: An application in
kidney transplant recipients treated with calcineurin inhibitors.
Nephrol Dial Transplant. 37:2284–2292. 2021.PubMed/NCBI View Article : Google Scholar
|
|
36
|
Trkulja V, Lalić Z, Nađ-Škegro S, Lebo A,
Granić P, Lovrić M, Pasini J and Božina N: Effect of cyclosporine
on steady-state pharmacokinetics of MPA in renal transplant
recipients is not affected by the MPA formulation: Analysis based
on therapeutic drug monitoring data. Ther Drug Monit. 36:456–464.
2014.PubMed/NCBI View Article : Google Scholar
|