Introduction
IgA nephropathy (IgAN) is the most common type of
glomerulonephritis (GN) worldwide and is now one of the leading
causes of end-stage renal disease (1,2). The
prevalence of IgAN varies depending on the level of biopsy
techniques, socioeconomic factors, geographic and environmental
influences and ethnic differences (3). IgAN has become a serious threat to
individuals and a huge burden to society, particularly in countries
in East Asia and the Pacific region (4-6).
Invasive renal biopsy is indispensable for both
diagnosis and prognosis prediction in patients with IgAN, mainly
based on positive staining for IgA-dominant immune complex deposits
in the interstitium by histopathology or immunofluorescence
(7,8). According to the Oxford
classification, endocapillary hyperplasia, interstitial cell
hyperplasia, segmental glomerulosclerosis and tubular atrophy or
interstitial fibrosis are considered independent predictors of
prognosis for patients with IgAN (9-11).
A major finding in patients with IgAN is the presence of
circulating and glomerular immune complexes, including
galactose-deficient IgA1, as IgG autoantibodies against hinge
region O-glycans, and complement C3(12). On the one hand, IgA-containing
complexes cause renal damage mainly through glomerular inflammation
and thylakoid hyperplasia. On the other hand, abnormal activation
of the renin-angiotensin-aldosterone system and complement also
leads to glomerulosclerosis, tubulointerstitial fibrosis and
eventual loss of renal function (13,14).
The clinicopathological manifestations of IgAN vary from
asymptomatic urinary abnormalities, proteinuria, hypertension,
reduced glomerular filtration rate (GFR) and nephrotic syndrome to
progressive GN (14,15). Renal outcomes in patients with IgAN
are related to the histological grade and findings at the time of
diagnosis (10,16-18).
Early detection, early diagnosis and early intervention are
necessary and important measures in patients with IgAN. However,
most patients with IgAN have a chronic onset and feature reduced
GFR, mild to moderate proteinuria, persistent microhematuria and
hypertension at the time of first diagnosis. Certain long-term
follow-up studies have estimated that 25% of patients with IgAN
develop renal failure after 10 years and up to 50% after 30 years
(19,20). Currently, there is still a lack of
simple, feasible and non-invasive methods as alternative options to
renal biopsy for the diagnosis, classification and prognosis
prediction of IgAN.
Proteins and peptides have critical roles, with
multifunctional and physical properties as hormones, enzymes,
channels or transporters (21).
During post-translational modifications, glycoproteins are modified
by N- and O-linked glycosylation through the attachment of sugars
to asparagine or serine (Ser)/threonine (Thr) residues (22,23).
The two most common types of glycosylation are O-glycosylation and
N-glycosylation. Eukaryotic O-glycosylation indicates the
attachment of sugars to Ser or Thr residues by enzymes of the
endoplasmic reticulum and Golgi apparatus. N-glycosylation in
eukaryotes indicates the attachment of N-glycans to N-X-S/T/C
sequences. Glycosylated proteins have a variety of integral roles
in physiological regulation, such as DNA damage repair, cell
growth, cell migration and immune responses, as well as
pathophysiological conditions, including cancer, neurodegenerative
diseases, cardiometabolic disorders and immune disorders (24-26).
Previous studies have indicated that abnormal glycosylated
glycoproteins are aberrantly expressed in serum and excreted into
the urine with reduced renal selective permeability in patients
with IgAN (27-30).
Glycoproteins may have the potential to be used as diagnostic
markers for IgA nephropathy.
Mass spectrometry (MS) is an advanced experimental
high-throughput technique that allows researchers to explore
biomolecules (22).
Glycoproteomics is an MS-based proteomics approach that has been
used to identify glycoproteins involved in physiological processes,
signaling pathways and pathological development (25). High-throughput site- and
structure-specific characterization of different N-glycosylations
under pathological conditions using MS-based N-glycoproteomics has
become a common approach for the discovery of putative disease
biomarkers. Recently, it has further been found to be involved in
the regulation of various renal diseases, including diabetic kidney
disease, IgAN, renal cell carcinoma, lupus nephritis and glomerular
basement membrane resistant disease (31). Abnormal glycoproteins are excreted
into the urine, which may be collected noninvasively and are a good
source for patients with renal disease. Therefore, it is important
to perform glycoproteomics analysis of the urine of patients with
IgAN to find unique glycosylated proteins as specific diagnostic
biomarkers for IgAN. In the present study, the urine of patients
with IgAN was examined to identify potential urinary proteins as
specific biomarkers of IgAN.
Materials and methods
Materials
Reagents for glycoproteomics sample preparation were
used as follows. The bicinchoninic acid assay kit was purchased
from Real-Times Biotechnology Co. Coomassie Brilliant Blue staining
solution was obtained from Wuhan Servicebio. N-glycosaminidase was
obtained from New England Biolabs Co. Liquid chromatography tandem
mass spectrometry (LC-MS/MS) grade ultrapure water, dithiothreitol
(DTT), iodoacetamide, sequencing grade trypsin, LC-MS grade
acetonitrile (ACN) and LC-MS grade formic acid were obtained from
Thermo Fisher Scientific, Inc. Hydrop interaction liquid
chromatography (HILIC) columns and Venusil® HILIC were
purchased from Agela Technologies. H218O
(also called water-18O) reagents and other chemicals
were purchased from Sigma-Aldrich (Merck KGaA).
ProteoMiner™ enrichment kits for concentrating
low-abundance proteins were purchased from Bio-Rad Laboratories,
Inc. In addition, acetone was purchased from Xilong Scientific
Chemical Co., Ltd. and water-saturated phenol was obtained from
Shanghai Zeya Biological Co., Ltd.
Study population and procedures
This study was conducted at the Department of
Nephrology, Guangan People's Hospital (Guangan, China). All
participants were enrolled between June 2021 and June 2023.
The inclusion criteria were as follows: i) IgAN was
defined as immunofluorescence and light microscopic IgA deposition
in the thylakoid region with or without capillary rings, combined
with or without IgG, IgM and C3 deposition according to the Kidney
Diseases: Improving Global Outcomes guidelines (32). IgAN caused by other diseases was
excluded by clinical manifestations and other laboratory findings.
ii) Subjects were selected from patients with IgAN confirmed by
first renal biopsy at our institution, without glucocorticoid and
immunosuppressive therapy. iii) Patients agreed to participate in
this study and signed an informed consent form.
The exclusion criteria were as follows. i) IgAN
complicated by membranous nephropathy, light chain deposition, thin
basement membrane nephropathy and other types of renal disease. ii)
Pathological changes of IgAN caused by other diseases, such as
systemic lupus erythematosus, Henoch-Schonlein purpura nephritis or
hepatitis B virus-associated nephritis. iii) IgAN complicated by
severe cardiopulmonary disease, or tumors (33).
Finally, 30 patients diagnosed with IgAN without
other renal disease were recruited as the IgAN group. Another 30
sex- and age-matched healthy volunteers were also recruited as a
healthy control group. These healthy volunteers were individuals
who underwent physical examinations at our hospital with no history
of renal disorder. They were further screened for kidney disease by
detailed clinical and laboratory examinations, such as creatinine,
urinary protein, blood pressure and urinalysis. No trace amounts of
blood or protein were detected of these healthy volunteers at study
entry.
The trial was conducted in accordance with the
Declaration of Helsinki and was approved by the Ethics Committee of
Guangan People's Hospital (Guangan, China; approval no. 2021009).
This committee supervised the whole process of project
implementation. All participants signed an informed consent form
before enrollment. General data and medical information were
collected from the participants.
Collection and preservation of
urine
Approximately 20 ml of fresh mid-morning fasting
urine samples were collected at the time of biopsy from patients
with IgAN prior to receiving hormonal or immunosuppressive therapy
during hospitalization. Similarly, ~20 ml of fresh mid-morning
fasting urine samples were collected in healthy volunteers. All
samples were collected in sterile containers, placed at room
temperature, centrifuged at 2,000 x g for 20 min over 1 h, and the
supernatant was separated to remove debris and cells. The
centrifuged urine samples were then stored at -80˚C for further
analysis.
Urine sample preparation and
procedures
Novogen was commissioned to perform all procedures,
including total proteins extraction, protease digestion and HILIC
enrichment of glycopeptides, as well as bioinformatics
analysis.
Extraction of total protein. Urine samples
from three patients with IgAN and three healthy controls were
removed from the -80˚C refrigerator and thawed rapidly at room
temperature. Each sample (15 ml) was ultrafiltered and concentrated
to ~1 ml using a 10KD centrifugation device. The retentate of the
concentrated samples was transferred to a 1.5-ml centrifuge tube.
RIPA lysis buffer (100 mM ammonium bicarbonate/8 M urea, 0.2% SDS,
pH=8) was added to this filtrate for protein lysis. After mixing
the top and bottom phases in the centrifuge tube, the mixture was
placed on ice and sonicated for 8 min. The solution was pre-cooled
at 4˚C and centrifuged at 12,000 x g for 20 min. Subsequently, the
supernatant was transferred into a new 1.5-ml centrifuge tube,
DTTred at a concentration of 10 mM was added and the mixture placed
at 56˚C for 1 h. A sufficient amount of iodoacetamide was added and
the sample was incubated in the dark for 1 h. 4 times volume of
precooled acetone at -20˚C was then added to the tubes. The samples
were centrifuged at 12,000 x g for 15 min and the precipitate was
collected. Then, 1 ml precooled acetone at -20˚C was further added
to the tubes for resuspension. The samples were again centrifuged
at 12,000 x g for 15 min and the precipitate was collected and
air-dried at room temperature. Finally, a solution [6 M urea, 100
mM triethylammonium bicarbonate (TEAB), pH=8.5] was added to
dissolve the precipitate for subsequent MS assay.
Protease digestion and HILIC enrichment of
glycopeptides. An appropriate amount of protein lysate (8 M
urea, 100 mM TEAB, pH=8.5) was added to the lysed protein samples,
not exceeding 500 µl in total. After initial digestion with
sequencing-grade trypsin for 4 h, a secondary digestion with a
combination of sequencing-grade trypsin and CaCl2 enzyme
was subsequently performed overnight. The digested samples were
acidified with formic acid and centrifuged at 12,000 x g for 20 min
at 4˚C in an ultracentrifuge. The supernatant was washed by 0.1%
formic acid with 3% acetonitrile three times with a C18 column
(Peptide Desalting Spin Columns; cat. no. 89852;
Pierce™; Thermo Fisher Scientific, Inc.). Next, the
eluate (0.1% formic acid with 70% acetonitrile) was added to this
C18 column for collection of the eluate, which was then
lyophilized. The peptide-containing sample was then redissolved in
80% ACN and 0.1% trifluoroacetic acid (TFA), passed through the
HILIC column, rinsed with 0.1% TFA and dried thermally at 45˚C with
vacuum treatment. The precipitate was then suspended in 50 mM
ammonium bicarbonate buffer dissolved in
H218O. 2 µl Peptide-N-glycosidase F (cat. no.
11365169001; Merck KGaA) dissolved in H218O
was added. The mixture was shaken overnight at 37˚C and dried
thermally at 45˚C with vacuum treatment.
LC-MS. Phase A (0.1% formic acid and 2% ACN
aqueous solution) and phase B (0.1% formic acid and 95% ACN aqueous
solution) were prepared for LC-MS. The thawed dry powder was
phase-solubilized with the appropriate amount of solution A and
centrifuged at 13,400 x g for 5 min at room temperature. From each
sample, 1 µg of supernatant was used for quality assurance. An
EASY-nLC™ upgraded ultra-performance LC system (Thermo
Fisher Scientific, Inc.) with an in-house made autonomous
pre-column (2 cm x75 µm x3 µm) and a home-made autonomous
analytical column (15 cm x150 µm x1.9 µm) was used, using a linear
gradient elution as listed in Table
I. Q Exactive™ HF-X (Thermo Fisher Scientific, Inc.)
and Nanospray Flex™ (Thermo Fisher Scientific, Inc.)
positive and negative electron spray ionization ion sources were
used. The ion spray voltage was set to 2.3 kV and the temperature
of the ion transport tube was set to 320˚C. The mass spectra were
acquired in data-dependent acquisition mode with a scan range of
350-1,500 m/z. The primary and secondary MS resolution, maximum
volume and maximum injection time were set separately for the final
generation of raw MS data.
 | Table ILiquid chromatography elution
gradient table. |
Table I
Liquid chromatography elution
gradient table.
| Time, min | Flow rate,
nl/min | Mobile phase A,
% | Mobile phase B,
% |
|---|
| 0 | 600 | 95 | 5 |
| 2 | 600 | 90 | 10 |
| 107 | 600 | 60 | 40 |
| 112 | 600 | 50 | 50 |
| 115 | 600 | 10 | 90 |
| 120 | 600 | 0 | 100 |
Identification and MS quantification were performed
using Mascot 2.5 software (Matrix Science Ltd.) and Proteome
Discoverer 2.5 software (Thermo Fisher Scientific, Inc.).
Independent samples t-tests were performed to investigate the
differences in protein expression levels between the IgAN (n=3)
group and the healthy control group (n=3). The fold change (FC) was
calculated as the relative ratio of the mean protein expression
levels in the urine samples of the two groups. Differentially
expressed urinary glycoproteins were selected using |logFC|>2 as
screening criteria. P<0.05 was considered to indicate a
statistically significant difference, while P<0.01 was
considered to indicate a highly statistically significant
difference.
Bioinformatics analysis
Differential glycoproteins were analyzed through the
DAVID database (http://david.abcc.ncifcrf.gov/). Gene Ontology (GO)
functional prediction analysis was performed, including functional
terms in the categories biological process (BP), cellular component
(CC) and molecular function (MF). Furthermore, the DAVID database
was used for Kyoto Encyclopedia of Genes and Genomes (KEGG) pathway
analysis. Protein-protein interaction network of differential
glycoproteins was visualized in the String DB database (https://cn.string-db.org/).
Determination of afamin (AFM) in
urine
The expression level of AFM in urine of both 30
healthy controls and 30 patients with IgAN were determined by
ELISA. The Human Afamin DuoSet ELISA kit was acquired from Novus
Biologicals Corp. (cat. no. DY8065-05). All procedures were
performed according to the manufacturer's protocol.
Statistical analysis
For sample estimation, since similar data could not
be found in published articles, a power analysis was performed with
PASS 15 Power Analysis and Sample Size Software (2017) (NCSS, LLC)
based on our results. A 1-β value of >0.8 was considered a
criterion for the target power.
Values are expressed as mean ± SEM. Comparisons
between two groups were assessed by unpaired Student's t-test (if
continuous variables) and chi-square (χ2) test (if
categorical variables). Statistical analysis was performed by SPSS
version 19.0 (IBM Corp.). The receiver operating characteristic
(ROC) curve was generated and the area under the ROC curve (AUC)
was determined by SPSS software version 19.0 (IBM Corp.) based on
the results of AFM expression levels in urine. P<0.05 was
considered to indicate statistical significance.
Results
Data quality of urinary glycoprotein
from IgAN and healthy controls
Proteins and peptides were analyzed from the urine
of patients with IgAN (n=3) and healthy volunteers (n=3) and used
for subsequent MS analysis. The clinical characteristics of the
above participants are listed in Table II. The age of enrolled patients
with IgAN and healthy controls was 24, 55 and 35 years, as well as
41, 29, 34 years, respectively. Their corresponding sex was female,
male, female, and female, female, female. Sex and age of these six
enrolled participants in the IgAN group and the healthy control
group was compared with respectively the χ2 test and
t-test. No significant differences were found in both sex and age
in 2 groups (P>0.05). A flowchart of the MS data quality
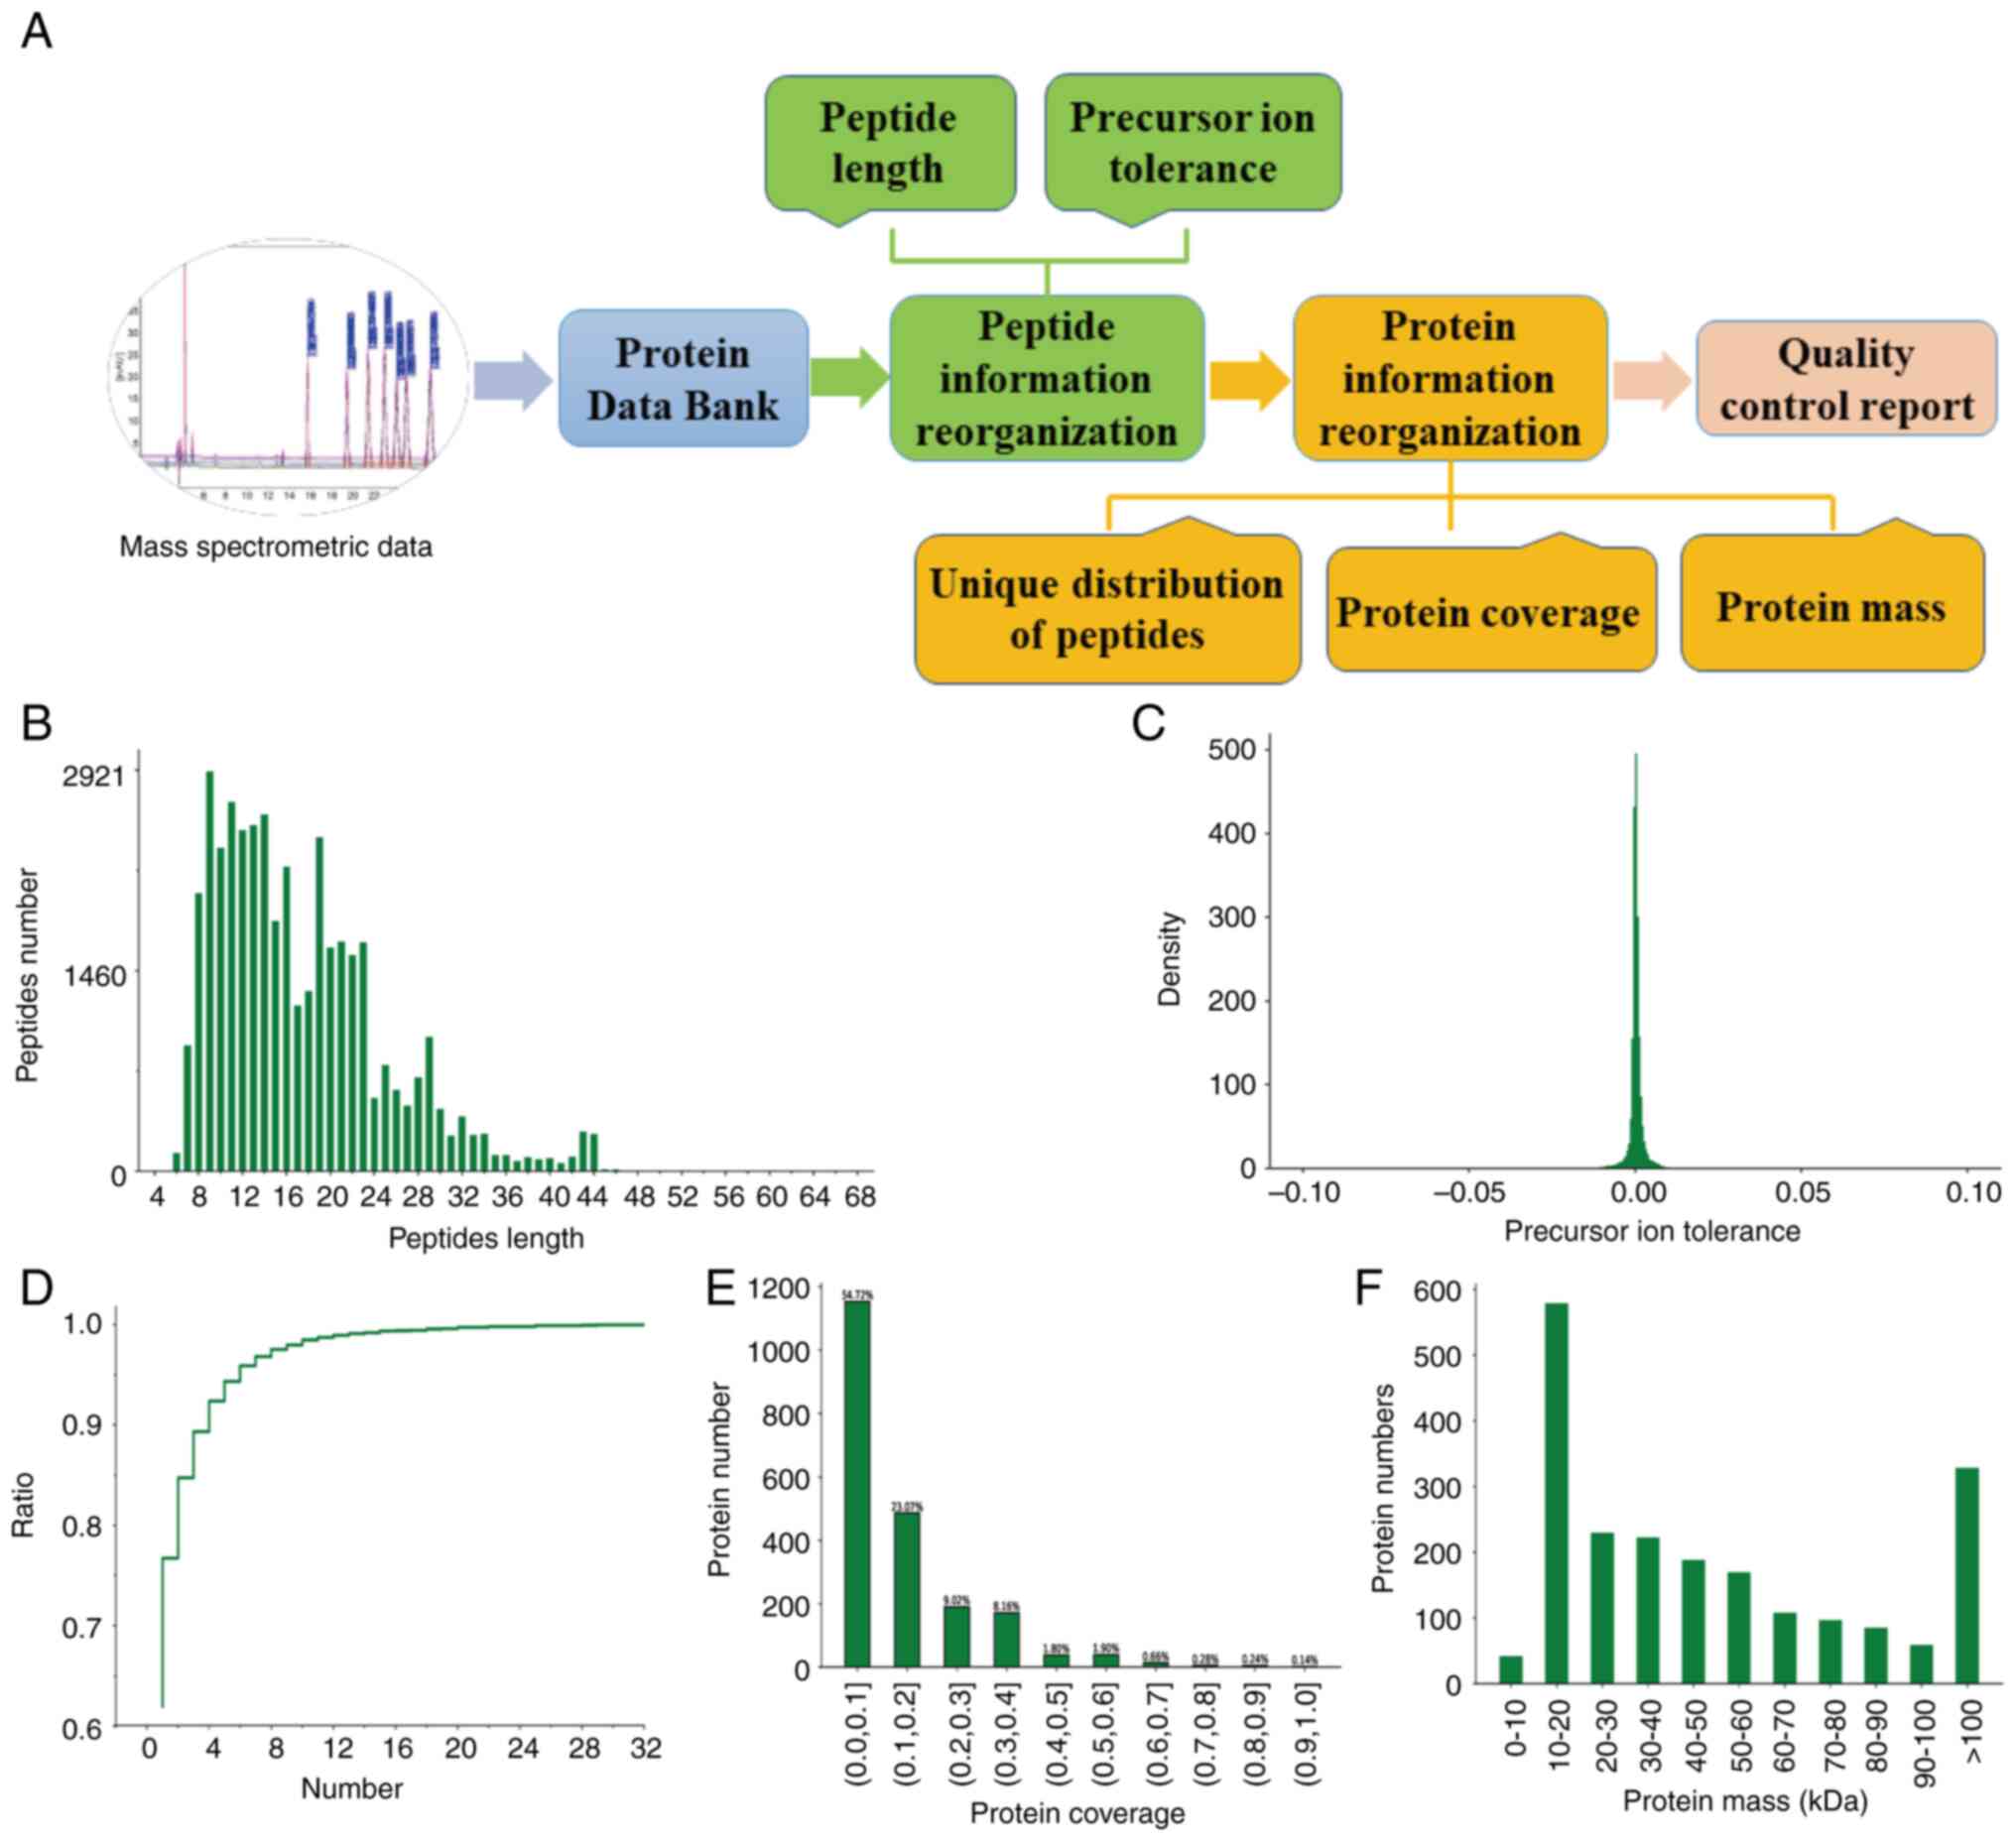
analysis is provided in Fig. 1A.
The results of the peptide information recombination indicated that
the protein mass of the peptides detected in the samples ranged
from 8-23 amino acids, with the peak of the mass precursor ion
tolerance close to 0 (Fig. 1B and
C). The results of the protein
information recombination further suggested that the number of
unique peptide sequences contained in all identified proteins as
plausible proteins ranged from ~1 to 10 in their relative
proportions shown (Fig. 1D). A
total of 851 proteins and peptides were obtained, while the protein
coverage was >1% (Fig. 1E). The
molecular weight of the proteins was mainly between 10 and 20 kDa
(Fig. 1F). Therefore, the data
from the protein analysis in this experiment were indicated to be
accurate and reliable.
| Table IICharacteristics of the enrolled
participants for glycosylation proteome analysis. |
Table II
Characteristics of the enrolled
participants for glycosylation proteome analysis.
| Characteristic | IgAN1 | IgAN2 | IgAN3 | HC1 | HC2 | HC3 |
|---|
| Age, years | 24 | 55 | 35 | 41 | 29 | 34 |
| Sex | F | M | F | F | F | F |
| Creatinine,
µmol/l | 67 | 183 | 63 | 84 | 68 | 78 |
| Urea nitrogen,
µmol/l | 5.46 | 11.5 | 5.37 | 5.6 | 5.4 | 6.0 |
| Hemoglobin,
g/l | 139 | 142 | 137 | 125 | 127 | 130 |
| CRP, mg/l | 0.56 | 0.32 | 0.23 | 0 | 0 | 0 |
| Urine protein | +- | + | 3+ | - | - | - |
| 24-h urinary
protein, g | 2.24 | 0.51 | 1.08 | - | - | - |
| Urine numbers of
microscopic erythrocytes, /HP | 8-12 | 0 | 2-6 | - | - | - |
| Serum IgA, g/l | 3.06 | 3.58 | 2.32 | - | - | - |
| Serum IgE,
IU/ml | 76.5 | 42.2 | 5 | - | - | - |
| Mesangial
hyperplasia | Yes | Yes | Yes | - | - | - |
| IgA mesangial
deposition | Yes | Yes | Yes | - | - | - |
| Degree of segmental
hardening, % (n/total) | 21.4 (3/14) | 35.2 (6/17) | 44.80 (13/29) | - | - | - |
Identification of differentially
expressed urinary glycoproteins
Urine samples from patients with IgAN (n=3) and
healthy controls (n=3) were examined by the data-dependent
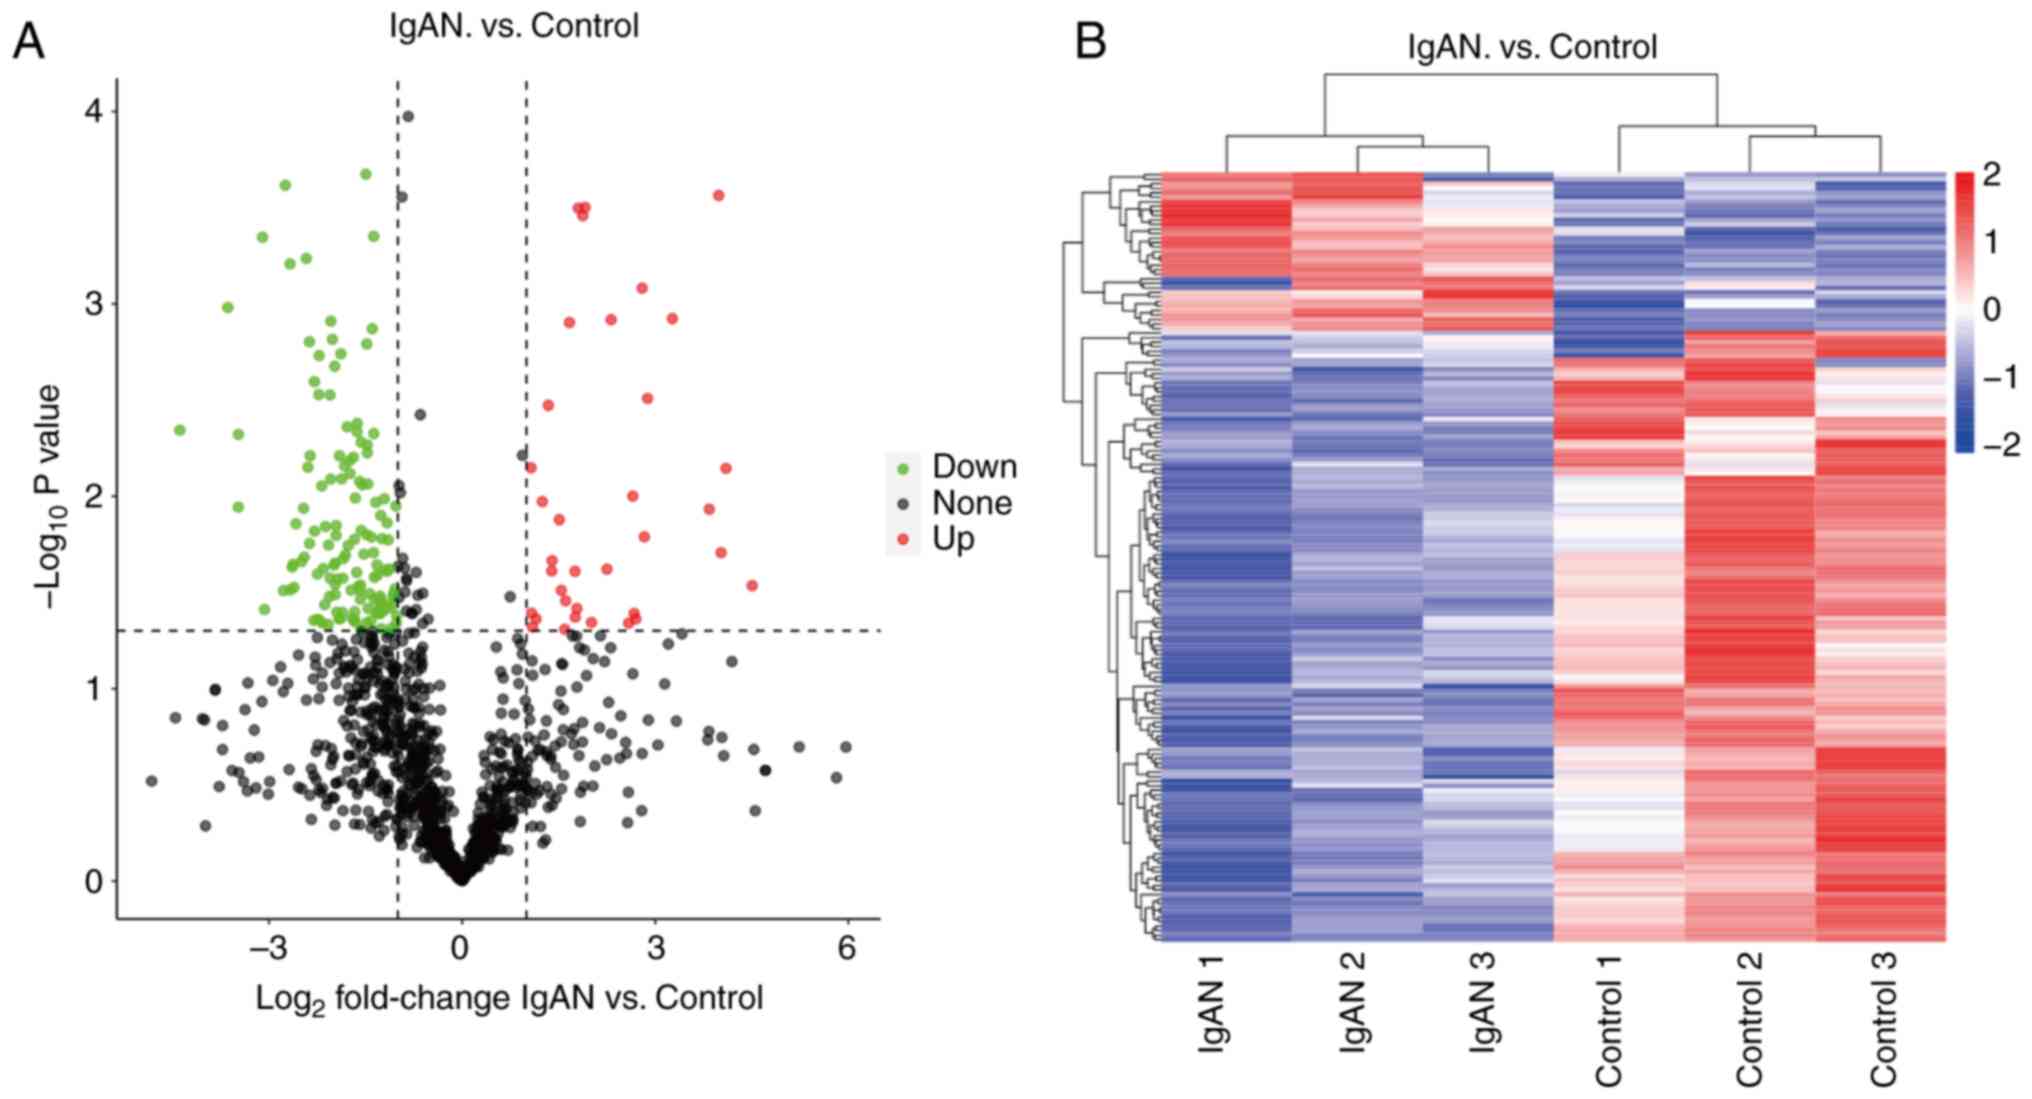
acquisition LC-tandem MS label-free quantitative technique. A total
of 851 N-glycoproteins were detected in the six urine samples
mentioned above, of which 169 differential N-glycoproteins were
found (Fig. 2A). Cluster analysis
of the IgAN and healthy groups revealed high similarity of data
patterns within the groups and low similarity of data patterns
between the groups (Fig. 2B), both
of which further justified the screening of differential
proteins.
Compared to healthy controls, the IgAN group had 37
glycoproteins, of which 11 glycoproteins were specifically
expressed in IgAN, including C4BPA, CABLES2, DSC2, FAM171A1, FAP,
FOLR2, NFIB, SLC2A13, SLCO4C1, UNQ172 and WDR82 (Table III). Meanwhile, a total of 132
glycoproteins were downregulated in the IgAN group compared with
the healthy controls, of which 22 glycoproteins were specifically
expressed in IgAN, including ADA2, ADAM 28, ADAMTS2, ADAMTS4,
CCL25, CD274 molecule [CD274, also known as programmed death-ligand
1 (PD-L1)], COL18A1, DCN, FGFR2, GFRA1, HLA-DRB1, IL7R, ISLR2,
LRP5, MMP23B, PAMR1, PRRT3, RCN3, RELT, SEMA3F, SIL1, SNED1
(Table IV).
| Table IIIUpregulated N-glycoproteins (n=11) in
IgAN vs. healthy controls. |
Table III
Upregulated N-glycoproteins (n=11) in
IgAN vs. healthy controls.
| Protein | Gene | IgAN1 | IgAN2 | IgAN3 | HC1 | HC2 | HC3 |
|---|
| P04003 | C4BPA |
4.597x10⁶ |
1.184x10⁶ |
9.895x10⁶ | 0 | 0 | 0 |
| H0Y5H2 | CABLES2 |
2.116x10⁵ |
2.917x10⁵ |
2.589x10⁵ | 0 | 0 | 0 |
| A9X9L1 | DSC2 |
1.106x10⁶ |
8.126x10⁵ |
1.304x10⁶ | 0 | 0 | 0 |
| Q5VUB5 | FAM171A1 |
1.556x10⁵ |
4.516x10⁴ |
2.113x10⁴ | 0 | 0 | 0 |
| C9J131 | FAP |
3.034x10⁵ |
1.652x10⁵ |
2.427x10⁵ | 0 | 0 | 0 |
| F5H3Z4 | FOLR2 |
5.122x10⁵ |
2.554x10⁵ |
1.587x10⁵ | 0 | 0 | 0 |
| O00712 | NFIB |
2.869x10⁵ |
7.288x10⁵ |
6.267x10⁵ | 0 | 0 | 0 |
| Q96QE2 | SLC2A13 |
2.868x10⁵ |
1.313x10⁵ |
2.685x10⁵ | 0 | 0 | 0 |
| Q6ZQN7 | SLCO4C1 |
4.135x10⁵ |
1.348x10⁵ |
2.590x10⁵ | 0 | 0 | 0 |
| Q6UY50 | UNQ172 |
6.541x10⁵ |
2.338x10⁵ |
6.071x10⁵ | 0 | 0 | 0 |
| Q6UXN9 | WDR82 |
3.162x10⁵ |
6.517x10⁵ |
4.647x10⁵ | 0 | 0 | 0 |
| Table IVDownregulated glycoproteins (n=22) in
IgAN vs. healthy controls. |
Table IV
Downregulated glycoproteins (n=22) in
IgAN vs. healthy controls.
| Protein | Gene | IgAN1 | IgAN2 | IgAN3 | HC1 | HC2 | HC3 |
|---|
| A0A087X0I3 | ADA2 | 0 | 0 | 0 |
7.607x10⁵ |
1.089x10⁶ |
3.845x10⁵ |
| Q9UKQ2 | ADAM28 | 0 | 0 | 0 |
6.702x10⁵ |
2.751x10⁶ |
7.011x10⁵ |
| A0A1B0GTY3 | ADAMTS2 | 0 | 0 | 0 |
6.190x10⁶ |
9.887x10⁶ |
7.362x10⁶ |
| Q5VTW1 | ADAMTS4 | 0 | 0 | 0 |
7.387x10⁵ |
8.900x10⁵ |
7.367x10⁵ |
| Q08AK2 | CCL25 | 0 | 0 | 0 |
2.924x10⁶ |
4.164x10⁶ |
2.077x10⁶ |
| Q9NZQ7 | CD274 | 0 | 0 | 0 |
4.101x10⁵ |
2.571x10⁵ |
3.432x10⁵ |
| P39060 | COL18A1 | 0 | 0 | 0 |
1.259x10⁵ |
3.497x10⁵ |
9.608x10⁵ |
| P07585 | DCN | 0 | 0 | 0 |
1.899x10⁶ |
1.144x10⁶ |
8.998x10⁵ |
| A0A141AXF5 | FGFR2 | 0 | 0 | 0 |
2.356x10⁵ |
3.132x10⁵ |
3.644x10⁵ |
| P56159 | GFRA1 | 0 | 0 | 0 |
3.010x10⁵ |
5.502x10⁵ |
7.028x10⁵ |
| Q3LA85 | HLA-DRB1 | 0 | 0 | 0 |
4.852x10⁵ |
1.294x10⁶ |
1.461x10⁵ |
| P16871 | IL7R | 0 | 0 | 0 |
7.330x10⁵ |
3.957x10⁵ |
1.978x10⁵ |
| Q6UXK2 | ISLR2 | 0 | 0 | 0 |
2.039x10⁵ |
1.591x10⁵ |
2.138x10⁵ |
| O75197 | LRP5 | 0 | 0 | 0 |
6.139x10⁴ |
5.514x10⁵ |
2.122x10⁵ |
| O75086 | MMP23B | 0 | 0 | 0 |
5.638x10⁵ |
7.407x10⁵ |
6.469x10⁵ |
| Q6UXH9 | PAMR1 | 0 | 0 | 0 |
4.697x10⁵ |
3.056x10⁵ |
2.900x10⁵ |
| Q5FWE3 | PRRT3 | 0 | 0 | 0 |
3.049x10⁵ |
3.480x10⁵ |
4.729x10⁵ |
| M0QZH0 | RCN3 | 0 | 0 | 0 |
6.473x10⁵ |
1.363x10⁵ |
4.489x10⁵ |
| Q969Z4 | RELT | 0 | 0 | 0 |
2.317x10⁵ |
7.763x10⁵ |
5.149x10⁵ |
| C9J1V2 | SEMA3F | 0 | 0 | 0 |
3.541x10⁵ |
7.040x10⁵ |
5.402x10⁵ |
| Q9H173 | SIL1 | 0 | 0 | 0 |
1.917x10⁵ |
9.445x10⁵ |
2.743x10⁵ |
| Q8TER0 | SNED1 | 0 | 0 | 0 |
2.438x10⁵ |
1.948x10⁵ |
2.602x10⁵ |
Based on the cutoff criteria of P<0.05 and
|logFC|>2 by comparison of the IgAN group and healthy controls,
the top 5 significantly differentially expressed proteins between
the two groups were listed. The top 5 upregulated differential
glycoproteins are CP, CNDP1, BCHE, GPLD1 and AFM. Meanwhile, the
top 5 downregulated differential glycoproteins were PTPRK, NRXN1,
LAMA2, EFNA4 and PCDH19 (Table
V).
| Table VTop 5 differentially expressed
glycoproteins between IgAN compared with healthy controls. |
Table V
Top 5 differentially expressed
glycoproteins between IgAN compared with healthy controls.
| Protein | Gene | IgAN1 | IgAN2 | IgAN3 | HC1 | HC2 | HC3 | IgAN vs. HC
P-value | IgAN vs. HC
log2FC | Direction of
differential expression of IgAN vs. HC |
|---|
| A5PL27 | CP |
7.326x10⁸ |
4.178x10⁸ |
7.332x10⁸ |
2.404x10⁷ |
2.459x10⁷ |
3.420x10⁷ | 0.029 | 4.507 | Up |
| Q96KN2 | CNDP1 |
1.770x10⁷ |
1.760x10⁷ |
2.258x10⁷ |
8.670x10⁵ |
1.593x10⁶ |
9.144x10⁵ | 0.007 | 4.100 | Up |
| F8WF14 | BCHE |
2.221x10⁷ |
2.632x10⁸ |
1.598x10⁷ |
5.090x10⁵ |
1.418x10⁶ |
2.036x10⁶ | 0.020 | 4.025 | Up |
| P80108 | GPLD1 |
3.145x10⁷ |
3.018x10⁷ |
3.830x10⁷ |
1.786x10⁶ |
3.259x10⁶ |
1.259x10⁶ | <0.001 | 3.986 | Up |
| P43652 | AFM |
5.535x10⁸ |
4.248x10⁸ |
6.108x10⁸ |
3.505x10⁷ |
4.663x10⁷ |
2.931x10⁷ | 0.012 | 3.840 | Up |
| Q15262 | PTPRK |
1.761x10⁵ |
1.237x10⁵ |
1.293x10⁵ |
2.608x10⁶ |
3.105x10⁶ |
3.264x10⁶ | 0.004 | -4.387 | Down |
| A0A1B0GVF4 | NRXN1 |
1.009x10⁶ |
7.591x10⁵ |
6.057x10⁵ |
1.057x10⁷ |
7.539x10⁶ |
8.374x10⁶ | 0.011 | -3.480 | Down |
| A0A087WX80 | LAMA2 |
6.116x10⁵ |
2.755x10⁵ |
1.531x10⁵ |
2.678x10⁶ |
4.665x10⁶ |
4.246x10⁶ | 0.005 | -3.478 | Down |
| P52798 | EFNA4 |
1.010x10⁶ |
2.692x10⁵ |
1.514x10⁵ |
3.683x10⁶ |
4.228x10⁶ |
4.377x10⁶ | <0.001 | -3.102 | Down |
| Q8TAB3 | PCDH19 |
7.577x10⁵ |
1.001x10⁶ |
4.406x10⁵ |
4.400x10⁶ |
8.282x10⁶ |
5.793x10⁶ | 0.039 | -3.070 | Down |
Differential GO analysis of
glycoproteins in urine
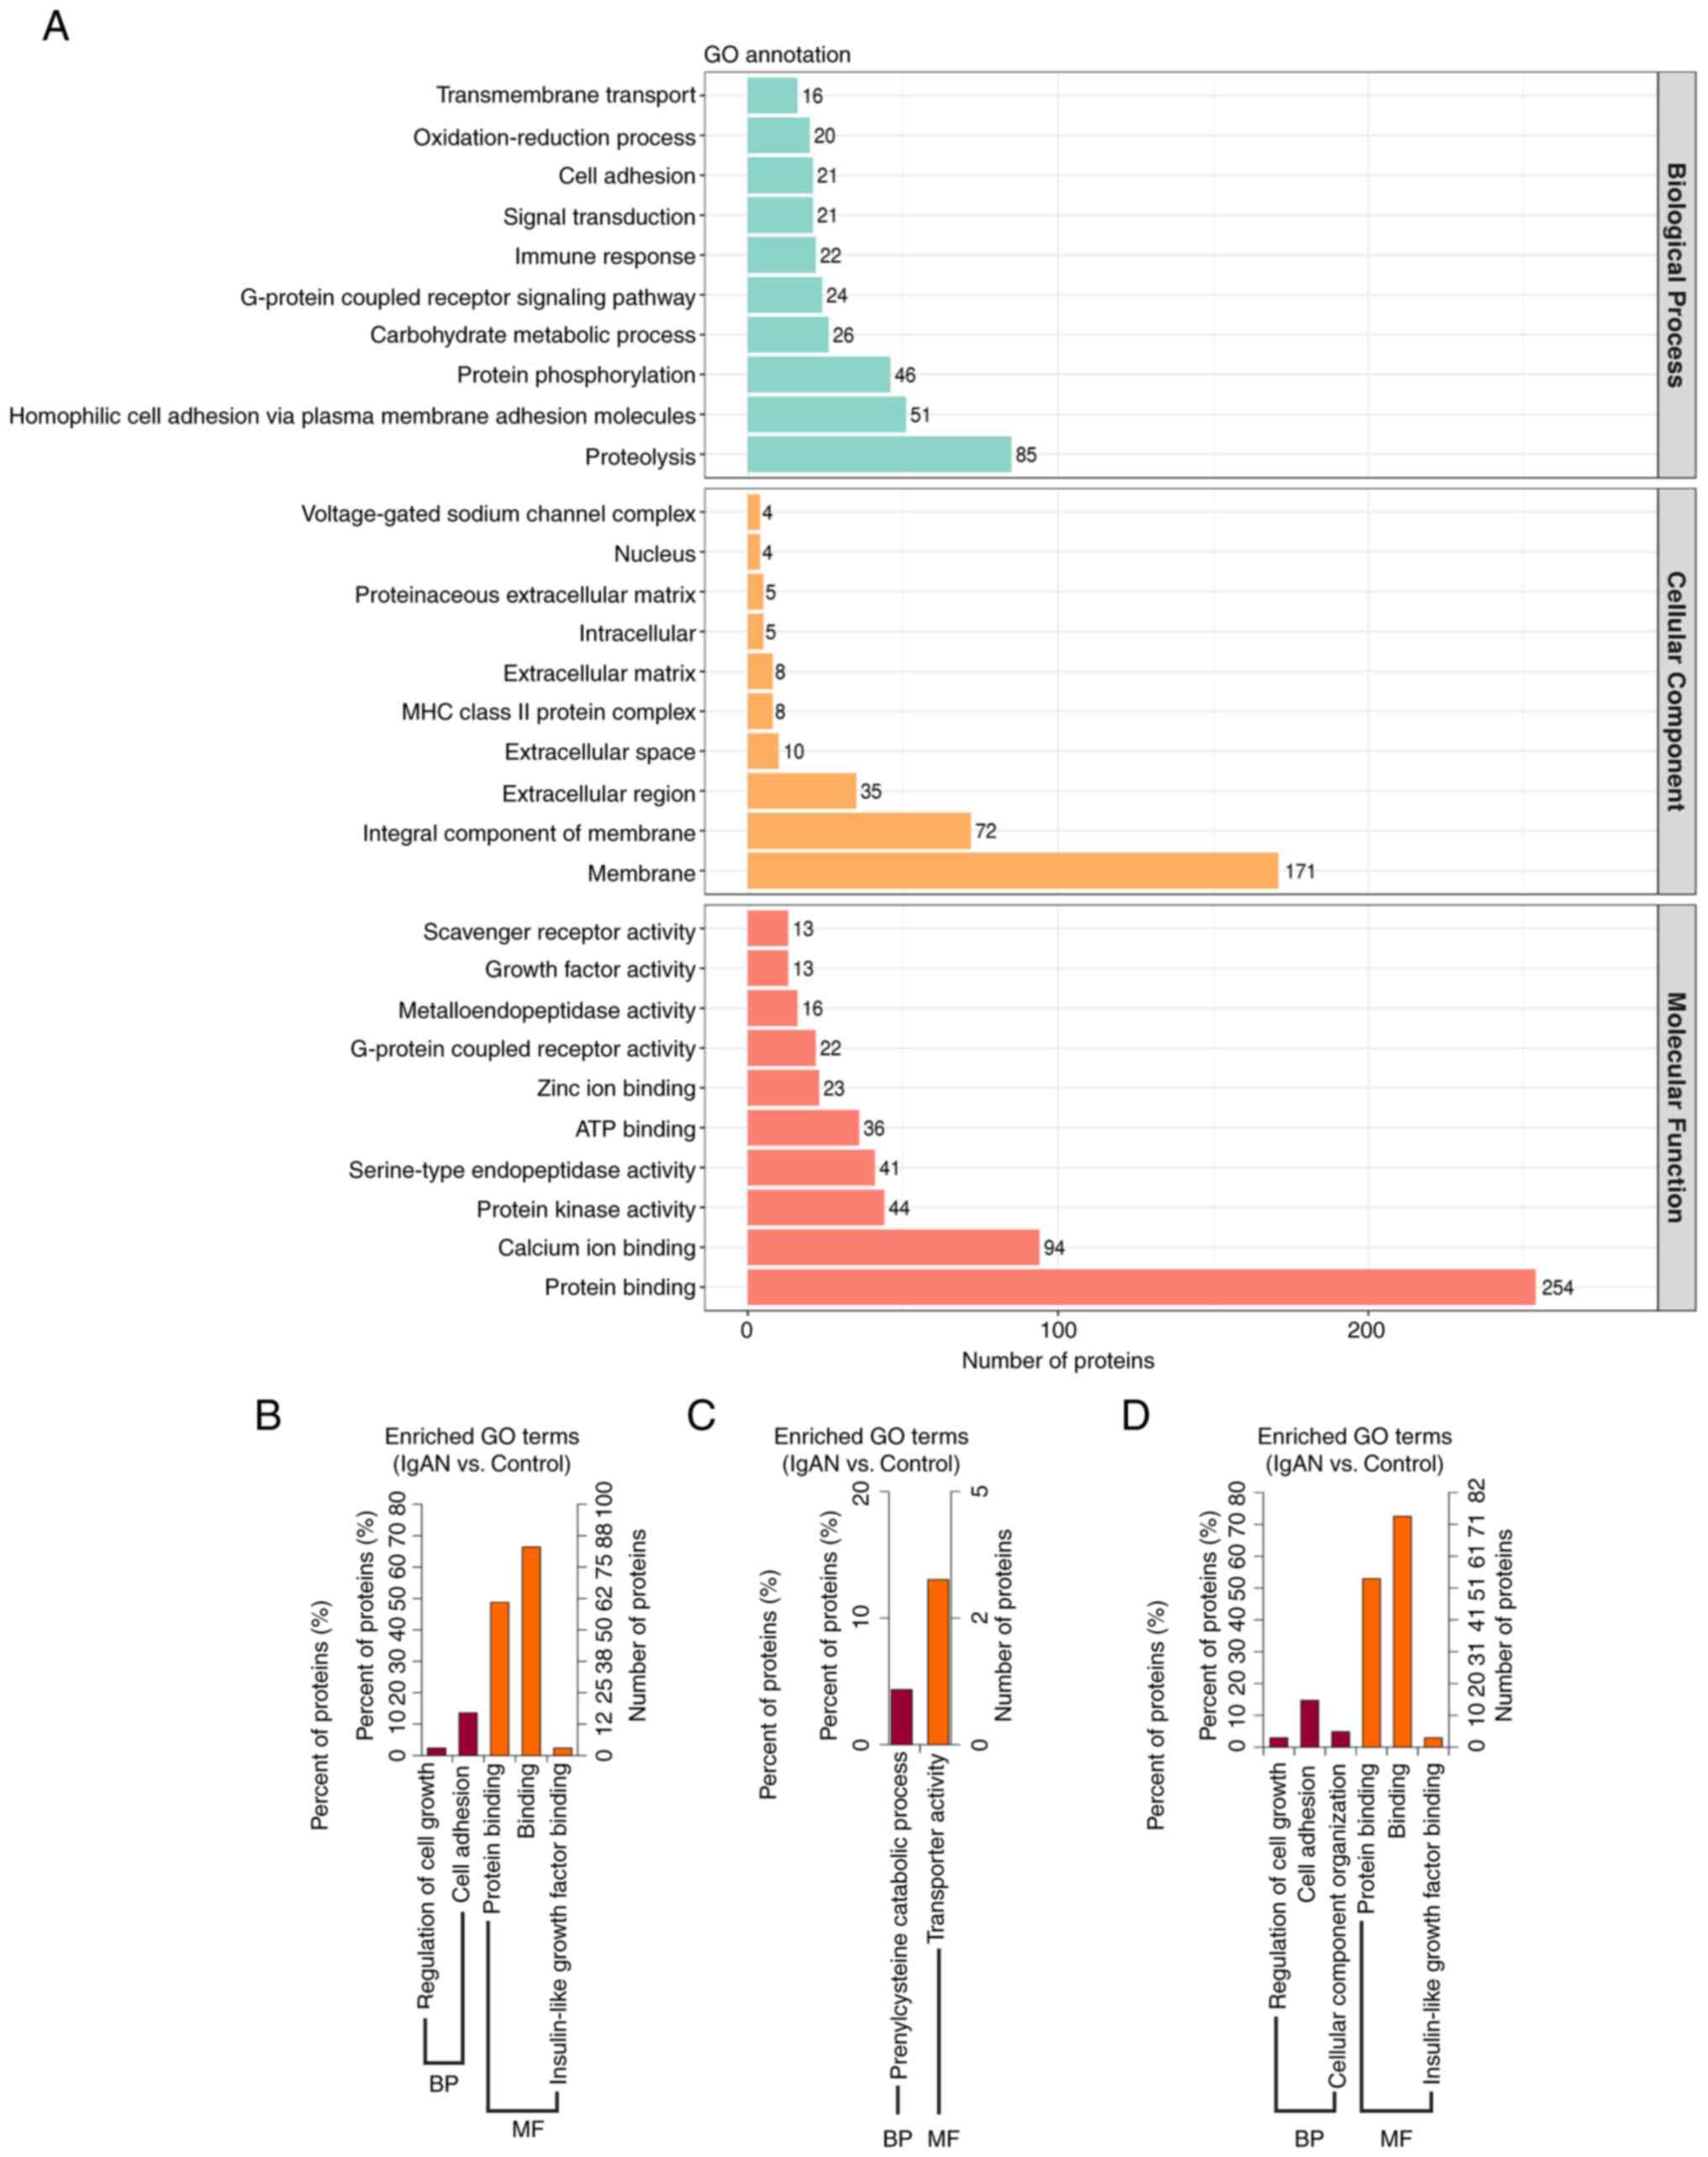
GO annotations of all identified N-glycoproteins in
the IgAN group and control group, in the categories CC, BP and MF,
are provided in Fig. 3A. In
addition, 169 differentially expressed proteins were classified as
CC, BP and MF by GO functional enrichment analysis using the DAVID
bioinformatics database (Fig.
3B-D). The results indicated that the differential
N-glycoproteins of the IgAN group were mainly enriched in the
membrane, as well as extracellular, intracellular and nuclear
domains (Fig. 3A). The main
function of downregulated N-glycoproteins in the category BP was
regulating cell growth and cell adhesion, while that of the
upregulated N-glycoprotein was prenylcysteine catabolic process
(Fig. 3B and C). The main functional term in the
category MF of downregulated N-glycoproteins was binding, including
proteins and insulin-like growth factors, while that of the
upregulated N-glycoprotein was transporter activity (Fig. 3B and C). According to the overall analysis in
the category BP, differentially expressed glycoproteins had the
main functions of regulating cell growth, cell adhesion and
cellular component organization. In addition, according to the
analysis in the category MF, differentially expressed
N-glycoproteins had predicted functions of protein binding,
insulin-like growth factor binding and other types of binding
(Fig. 3D).
KEGG analysis of differential urinary
glycoproteins
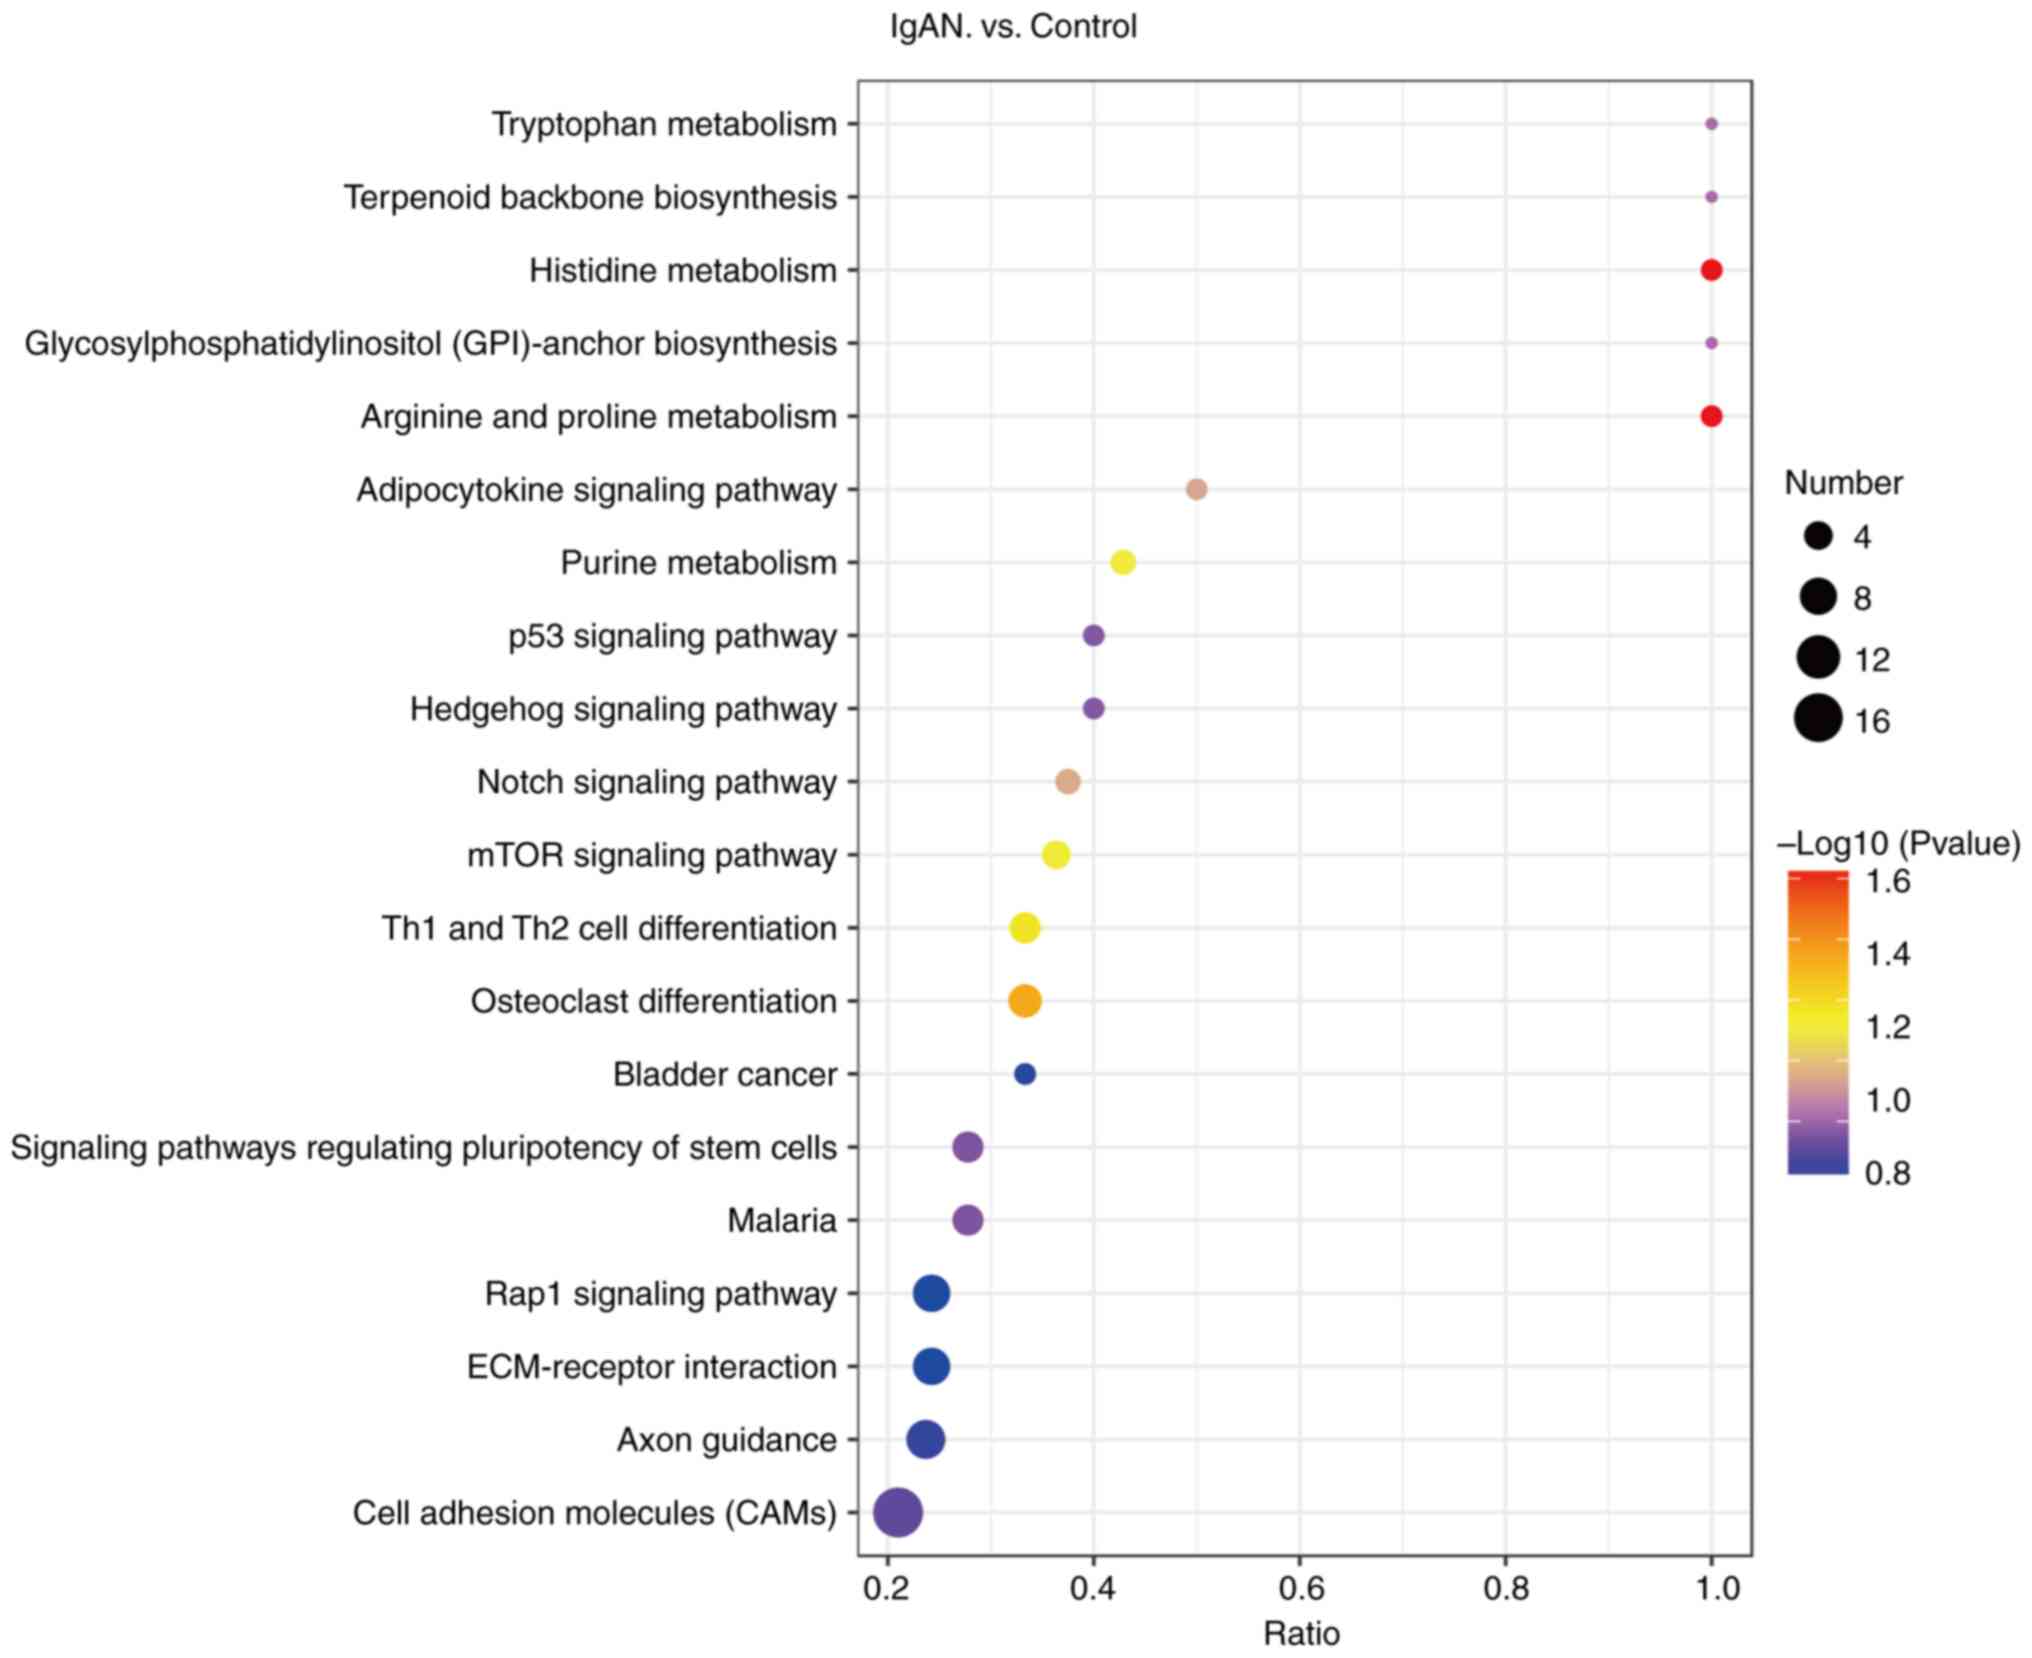
Further KEGG enrichment analysis was performed to
examine the enrichment of proteomic pathways (Fig. 4). Of the 169 differentially
expressed N-glycoproteins, the majority were significantly
associated with metabolic pathways, indicating the metabolism of
tryptophan, histidine, biotin, arginine and proline, as well as
purines. In addition, a certain proportion of the proteins were
enriched in the adipocytokine signaling pathway, p53 signaling
pathway, Hedgehog signaling pathway, Notch signaling pathway, mTOR
signaling pathway and Rap1 signaling pathway, as well as signaling
pathways regulating stem cell pluripotency. In addition, certain
N-glycoproteins were classified into type 1 T-helper (Th1) and Th2
cell differentiation, osteoblast differentiation, bladder cancer,
malaria, extracellular matrix (ECM)-receptor interactions, axon
guidance and cell adhesion molecules (CAMs).
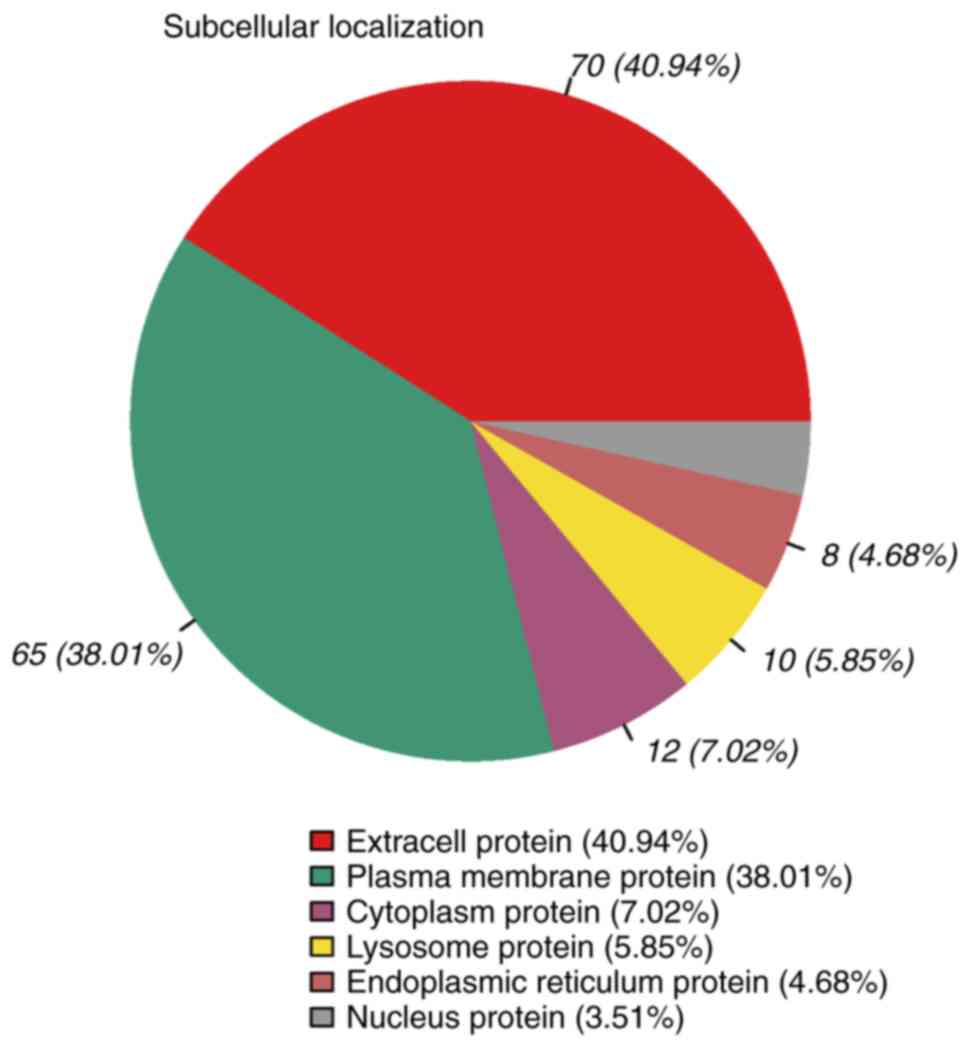
Subcellular localization of
glycoproteins
The subcellular localization of the 169 differential
glycoproteins was analyzed (Fig.
5). The results indicated that 40.94% of the differential
glycoproteins were classified as extracellular proteins, 38.01% as
plasma membrane proteins, 7.02% as cytoplasmic proteins, 5.85% as
lysosomal proteins, 4.68% as endoplasmic reticulum proteins and
3.51% as nuclear proteins.
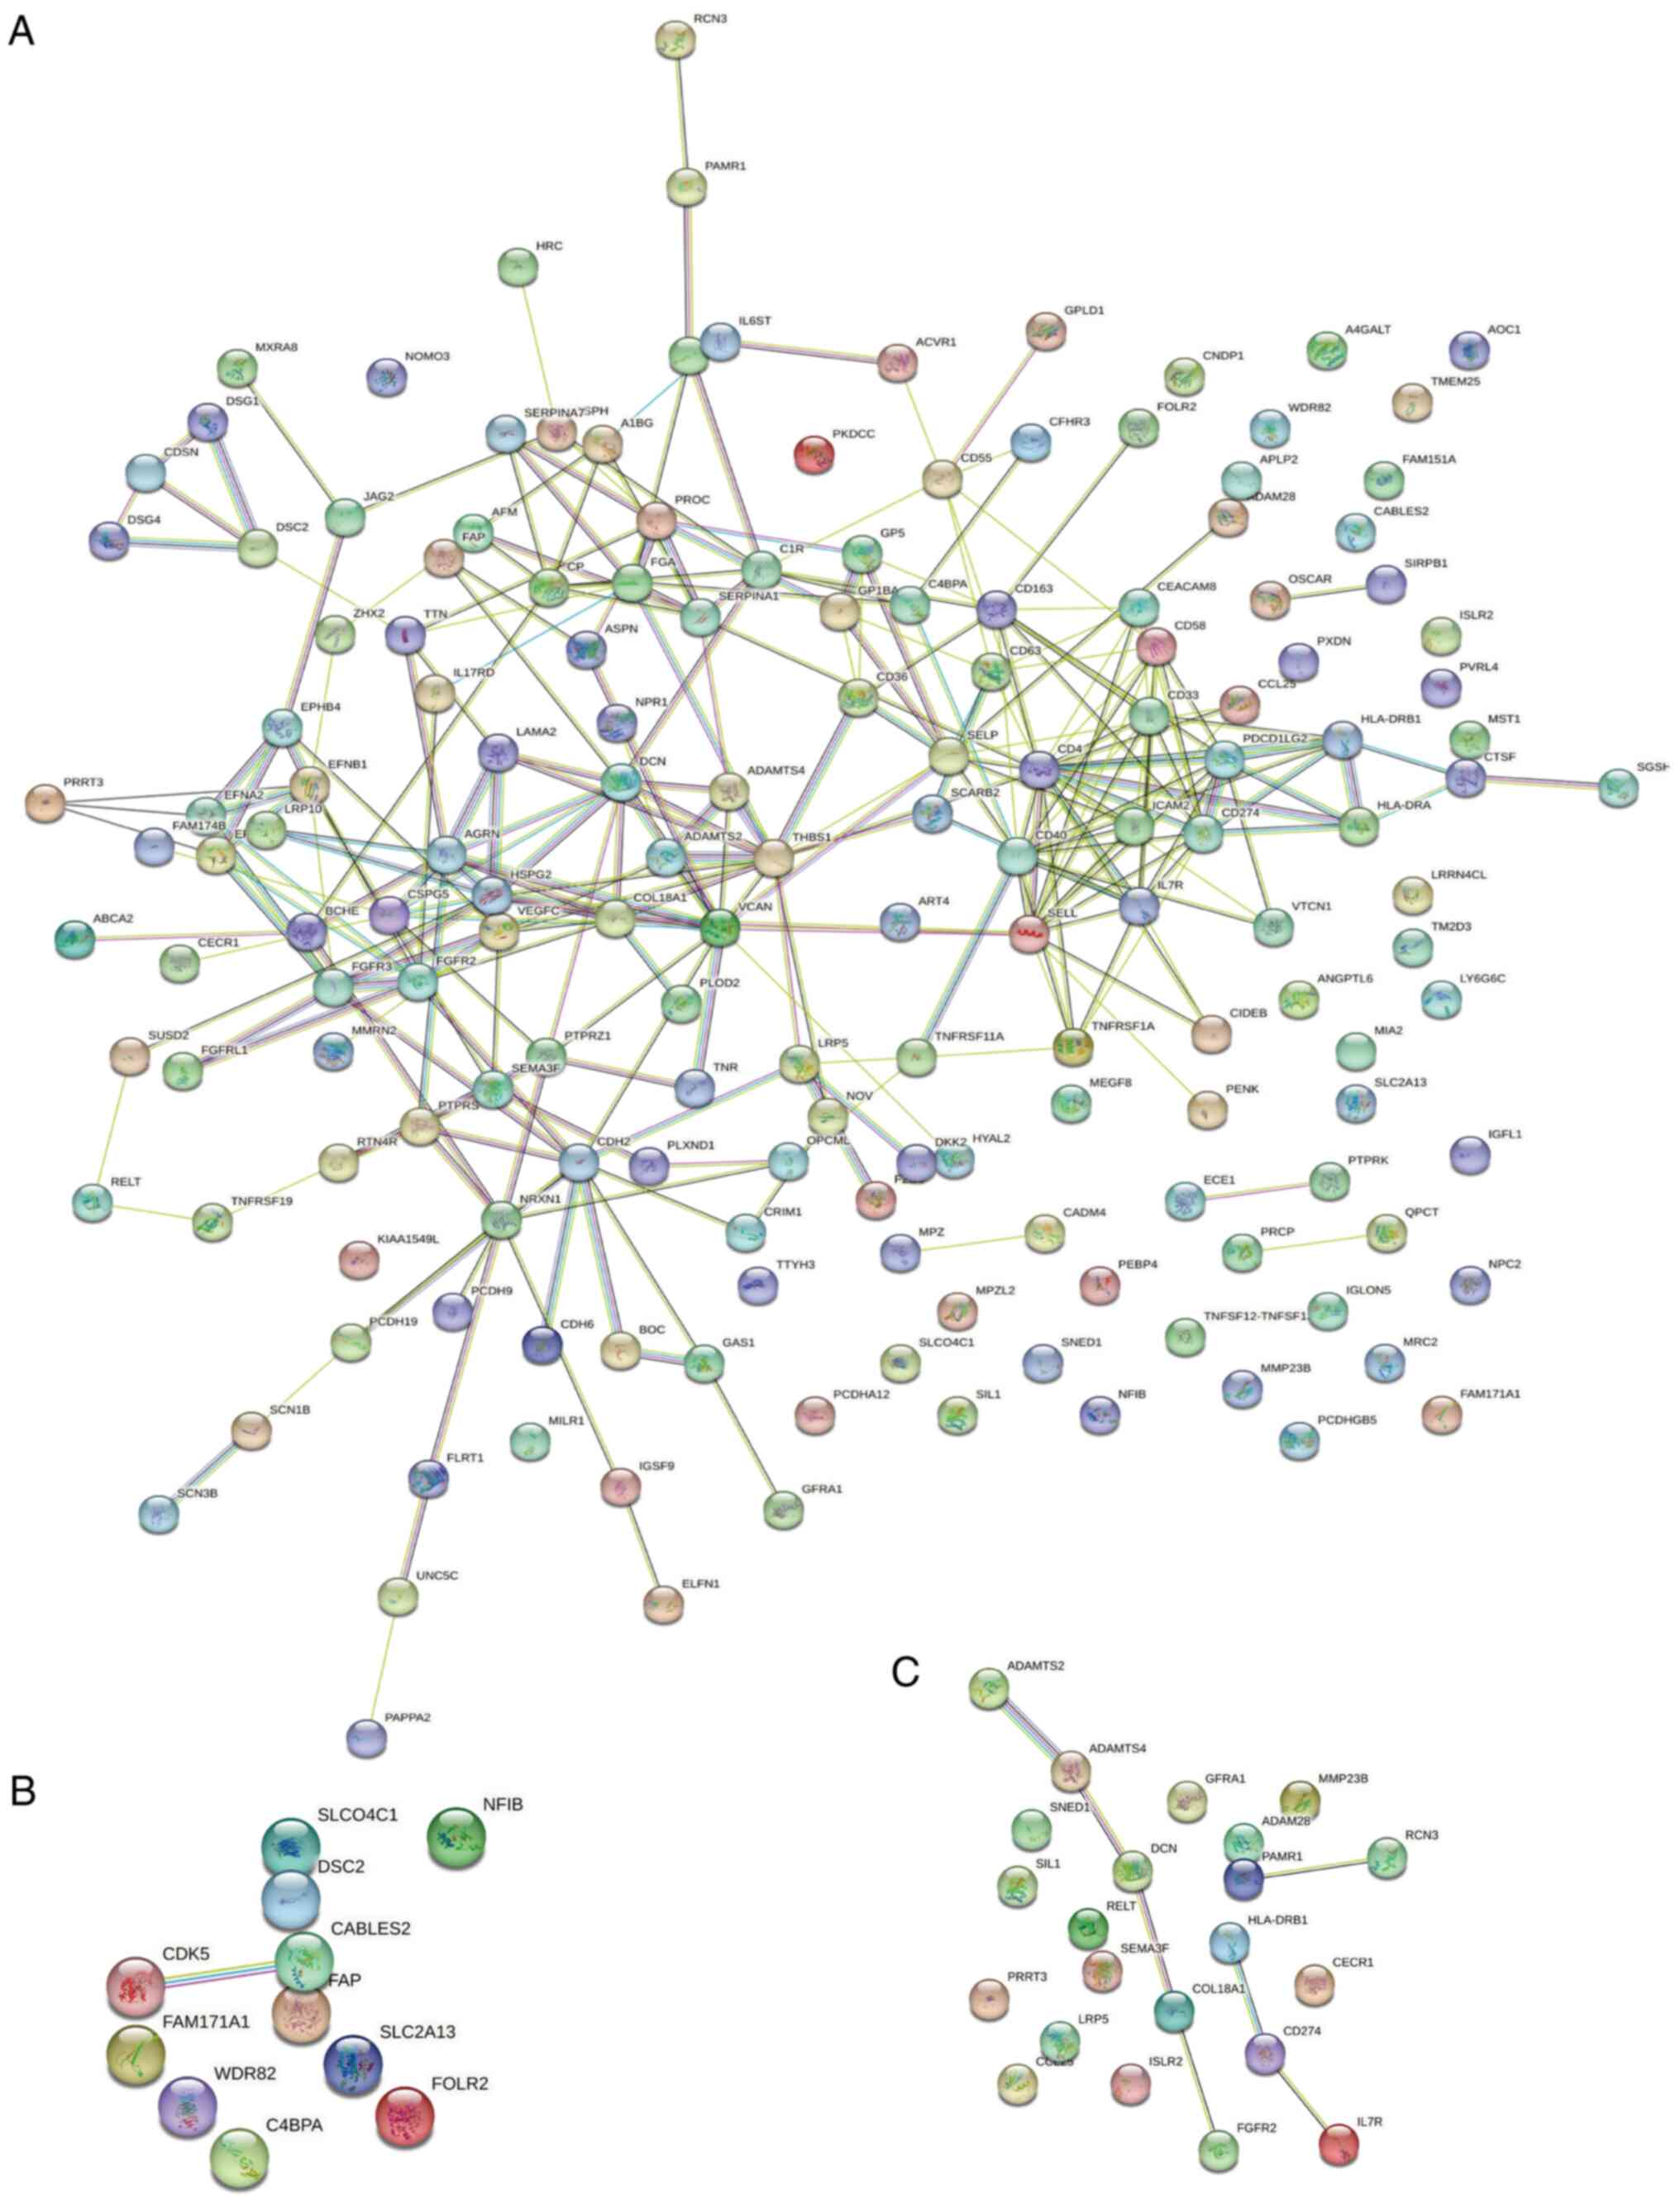
Interaction analysis of IgAN-related
differentially expressed glycoproteins
The interaction analysis of IgAN-related
differentially expressed glycoproteins was performed using the
String database for visualization (http://string-db.org/). Nodes of different colors
indicate individual proteins and lines of different thicknesses
indicate the strength of the interaction between two different
proteins. Among 169 different glycoproteins, most of the
N-glycoproteins were interconnected (Fig. 6A). Among the 11 upregulated
specific differential glycoproteins, CDK5 interacts with CABLES2
(Fig. 6B). Furthermore, among the
22 downregulated specific differential glycoproteins, 10 were
interlinked (Fig. 6C).
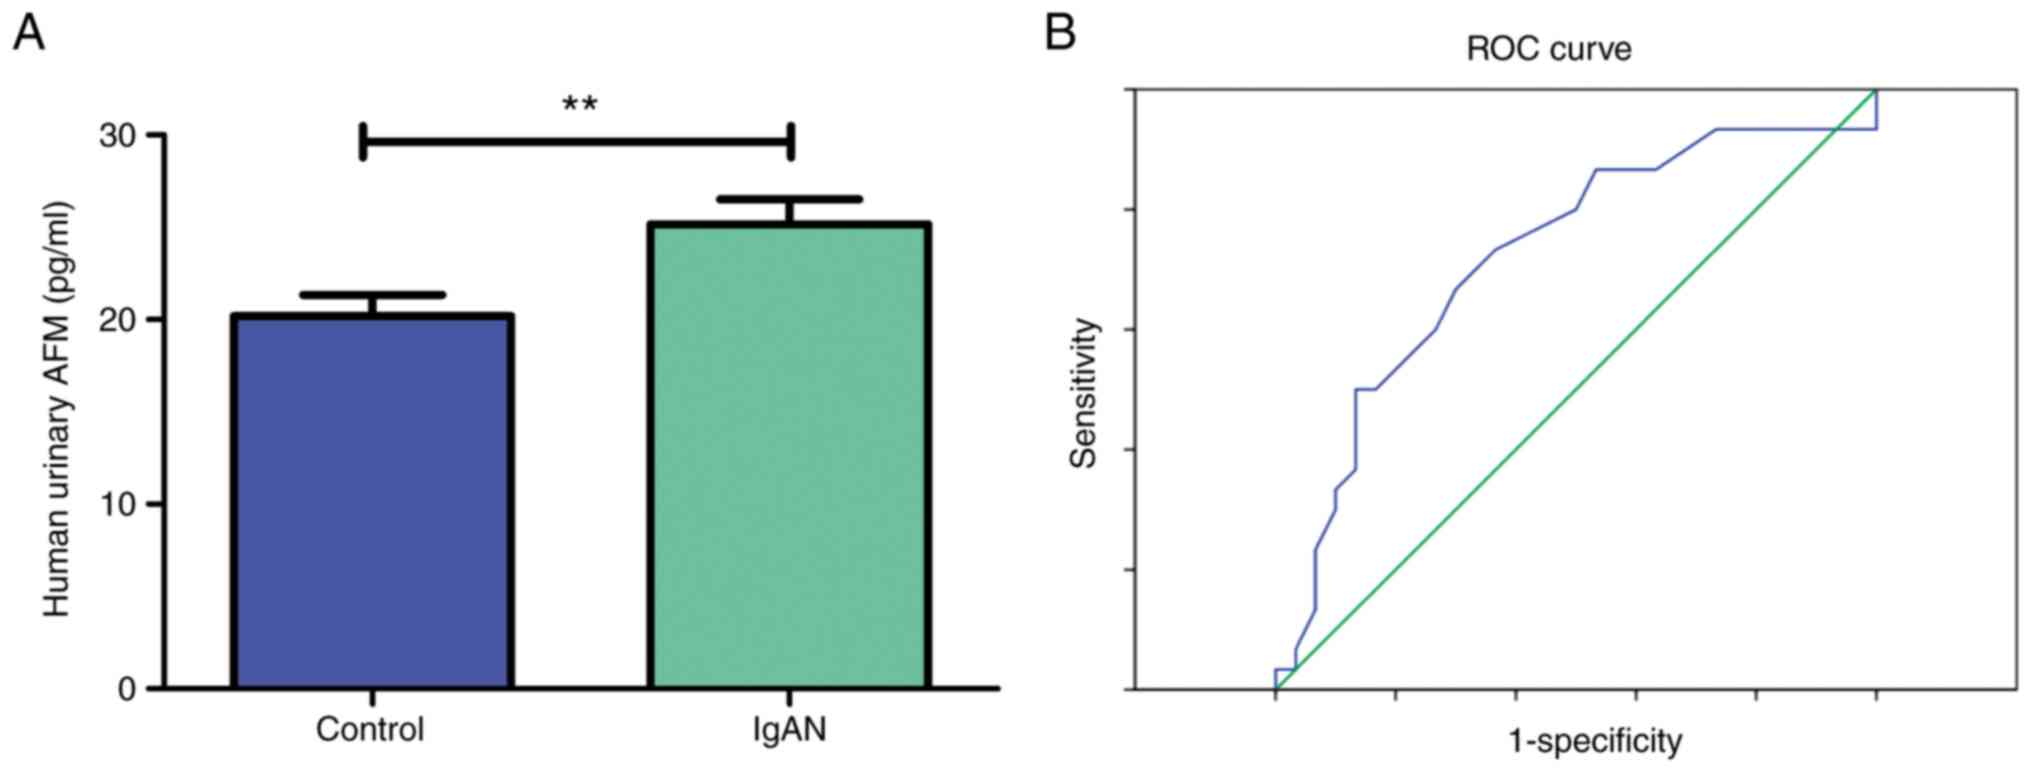
Urine concentration of AFM by ELISA in
the validation cohort
The expression levels of AFM in the urine of 30
healthy controls and 30 patients with IgAN were then measured by
ELISA (Table VI). The results
indicated that AFM levels were significantly higher in the patients
with IgAN compared to the healthy controls (Fig. 7A). To predict the potential impact
of AFM as a biomarker candidate in differentiating IgAN from
healthy individuals, ELISA results from these participants were
further analyzed to generate ROC curves, even though the number of
enrolled participants was small (Fig.
7B). The AUC was 0.720 (95% CI: 0.587 to 0.853). The
corresponding sensitivity was 0.667 and specificity was 0.700.
These results suggest that the expression level of the AFM
indicator in urine is moderately diagnostic for IgAN.
| Table VICharacteristics of all participants
enrolled for AFM ELISA analysis. |
Table VI
Characteristics of all participants
enrolled for AFM ELISA analysis.
| Characteristic | Healthy controls
(n=30) | IgAN patients
(n=30) | P-value |
|---|
| Age, years | 45.367±10.240 | 45.100±10.330 | 0.920 |
| Sex, M/F | 15/15 | 15/15 | >0.999 |
| Creatinine,
µmol/l | 114.900±47.416 | 72.067±10.748 | <0.001 |
| Urea nitrogen,
µmol/l | 9.441±3.148 | 5.593±0.502 | <0.001 |
| Hemoglobin,
g/l | 127.733±7.575 | 125.267±5.848 | 0.163 |
| CRP, mg/l | 0.452±0.117 | 0 | <0.001 |
| AFM, pg/ml | 25.162±7.462 | 20.197±6.271 | 0.007 |
Discussion
The present study aimed to identify potential
urinary proteomic biomarkers for the diagnosis of patients with
IgAN using glycoprotein MS analysis. It was found that the
expression levels of certain N-glycoproteins were significantly
altered by IgAN. Most of the altered N-glycoproteins had roles in
the regulation of cell growth, cell adhesion and cellular component
organization, as well as protein binding, insulin-like growth
factor binding and other kinds of binding. The altered
N-glycoproteins were significantly associated with a variety of
metabolic functions, including tryptophan, histidine and purines,
signaling pathways of various pathways, such as p53, Notch and mTOR
signaling pathways, Th1 and Th2 cell differentiation, osteoclast
differentiation, bladder cancer, malaria, ECM-receptor
interactions, axon guidance and CAMs. These results suggest that
N-glycoproteins are involved in the pathological progression of
IgAN through various mechanisms. It was further found that IgAN
significantly altered the expression levels of numerous
N-glycoproteins in urine. Most of them are extracellular and
membrane proteins, indicating the organization and regulation of
the immune response, and cellular components, such as nucleus,
intracellular, extracellular matrix and membrane, due to their high
viscosity. To our knowledge, this is the first exploration of using
glycoproteomics to study the integrated picture of IgAN.
In the present study, 37 N-glycoproteins were
upregulated and 132 N-glycoproteins were downregulated in patients
with IgAN compared to healthy controls. Of these, 11
N-glycoproteins were upregulated and 22 N-glycoproteins were
downregulated and specifically expressed in patients with IgAN
compared to healthy controls. Some of the genes and corresponding
proteins identified in the present study have been shown to be
associated with the diagnosis, pathological process and prognosis
of kidney disease, particularly in IgAN. Lin et al (34) found that the methylated CpG
corresponding to the WDR82 gene was associated with IgAN in a
Chinese population. Buren et al (35) noted that the unique expression of
CCL25 in small intestinal cells is a form of defective adaptive
humoral immune response to mucosal immunogens in patients with
IgAN. CD274 (PD-L1), a ligand for PD-1, has been shown to be
associated with the development of glomerular injury and
inflammation in the peripheral blood of patients with primary
glomerulonephritis (36). In
addition, increased collagen levels were observed in kidney biopsy
specimens from patients with anti-phospholipase A2 receptor
autoantibodies associated with membranous nephropathy (37). In the inflammatory injury of
glomerulonephritis, DCN expression levels in thylakoid cells are
reduced by upregulation of OTU deubiquitinase, ubiquitin aldehyde
binding 1, a member of deubiquitinating enzymes (38). In et al (39) recently noted that the HLA-DRB1
allele was associated with the progression of IgAN in Korean
patients. Jiyun et al (40)
revealed the association of HLA-DRB1 gene and the primary IgAN in
Han Chinese. Zhan et al (41) further found that HLA-DRB1 protein
expression levels in peripheral blood lymphocytes of patients with
IgAN were significantly lower than those of healthy controls and
the severity of IgAN was also correlated with peripheral blood
lymphocytes in Chinese individuals. Additional studies have further
demonstrated the effect of HLA-DRB1 on genetic susceptibility,
disease progression, severity, ethnic heterogeneity and geospatial
risk of IgAN (39,40,42-47).
Hahn et al (48) indicated
that IL7R gene polymorphism was associated with susceptibility to
IgAN in Korean children. The above available evidence further
supports the feasibility of clinical application of urinary
glycoprotein in kidney disease.
The two most common types of glycosylation are
O-glycosylation and N-glycosylation. Eukaryotic O-glycosylation
indicates that enzymes of the endoplasmic reticulum and Golgi
apparatus append sugars to Ser or Thr residues. N-glycosylation in
eukaryotes indicates that N-glycans are attached to N-X-S/T/C
sequences. High-throughput site- and structure-specific
characterization of different N-glycosylations under pathological
conditions using MS-based N-glycoproteomics has become one of the
common approaches for the discovery of putative disease biomarkers.
Therefore, in the present study, the option to test only
N-glycoproteins was pursued, rather than two glycosylations. A
significant difference in up- and downregulation of N-glycoprotein
expression was found by comparing IgAN and healthy controls based
on P<0.05 and |logFC|>2. Moon et al (49) found that CP was uniquely detected
and upregulated in patients with IgAN. Therefore, CP is considered
one of the candidate biomarkers for differentiating early IgAN by a
proteomic approach of urinary exosomes (49-51).
Urinary AFM is also a potential prognostic biomarker and classifier
of IgAN and kidney injury (29,52,53).
The results of the present study indicated that urinary AFM was
significantly elevated in adult patients with IgAN compared to
levels in healthy controls, which is similar to experimental
results from LC-MS/MS analysis of urine from children with IgAN
(29). These N-glycoproteins may
be considered diagnostic biomarkers for patients with IgAN.
Furthermore, interaction analysis of differentially expressed
N-glycoproteins associated with IgAN indicated that 22
downregulated specific differential glycoproteins were associated
with each other and among 11 upregulated specific differential
glycoproteins, CDK5 was associated with CABLES2. This may shed
light on the various functions of N-glycoproteins in the
pathological process of IgAN compared to healthy volunteers. The
fact that similar data could not be found in published articles
made it difficult to assess the sample size using the PASS
software. To ensure reproducibility of the experiment and normality
of the data distribution, three patients with IgAN and three
healthy volunteers were included. Significant differences between
the two groups for the five top N-glycoproteins mentioned above
were obtained. A statistical power analysis was then performed
based on the expression levels of CP, CNDP1, BCHE, GPLD1, AFM,
PTPRK, NRXN1, LAMA2, EFNA4 and PCDH19 and it was found that the
value of 1-β exceeded 0.8.
To validate the results of the proteomics analysis,
AFM proteins upregulated in patients with IgAN were selected in the
validation cohort and further examined by ELISA. The validation
results indicated that the expression levels of AFM in the urine of
patients with IgAN were significantly higher compared to the
healthy controls. This result indicates that the expression levels
of AFM indicators in urine are moderately effective in the
diagnosis of IgAN. AFM was chosen as a representative
discriminatory glycoprotein for the following reasons: i) AFM was
one of the upregulated significantly different N-glycoproteins by
LC-MS/MS comparing IgAN and healthy controls with P<0.05 and
|log2FC|>2. ii) The expression level of AFM in urine
was previously examined in pediatric patients with IgAN (29), while it has not been investigated
in adult patients with IgAN. iii) A human AFM ELISA kit was
available from Novus Biologicals to easily, simply and effectively
detect its expression level in urine. The results indicated an AUC
of 0.720 (95% CI: 0.587-0.853) with a corresponding sensitivity of
0.667 and specificity of 0.700. These results suggest that the
expression level of the indicator AFM in urine has moderate
diagnostic efficacy for IgAN. Further key differential
glycoproteins identified by LC-MS/MS should be assessed and
combined to improve the diagnostic efficacy of IgAN and establish a
multiparametric model for diagnostic performance.
IgAN was first described histologically as
intercapillary deposition of IgA-IgG in 1968 by Berger and Hinglais
(54). Worldwide, the prevalence
of IgA nephropathy varies widely and is highest in East Asian
individuals (55). IgAN accounts
for ~40% of all native-kidney biopsies in Japan, 25% in Europe and
12% in the United States (56,57).
Currently, the gold standard for the diagnosis of IgAN remains
renal biopsy, which, as an invasive diagnostic method, has numerous
limitations and may lead to multiple complications (58,59).
Traditional clinicopathological indicators remain inadequate to
predict the diagnosis, progression and prognosis of IgAN, such as
blood pressure, albuminuria and hematuria. Urine glycoproteomics
technology has been indicated to be feasible as a non-invasive
approach to explore and develop diagnostic biomarkers in patients
with IgAN (33,52,53).
Furthermore, the use of urine has several advantages over blood or
kidney tissue: i) Urine samples are easily accessible and
noninvasive. ii) Urine does not contain any other substances that
may interfere with the analysis, such as enzymes and immunoproteins
in the blood. iii) The proteins and composition of urine may change
during kidney injury and related diseases. iv) Urine samples are
feasible for patients with contraindications to biopsy. Therefore,
urine may be considered a better option to reflect the severity of
the kidney and as a source of biomarkers for diagnosis and
prognosis.
The limitations of the present study were as
follows. First, the sample size was small both in terms of enrolled
patients with IgAN and healthy volunteers, and in future studies, a
larger sample will be used to reduce the variability of the
analysis by further validation (29). In addition, due to the small sample
size, the progression and severity of IgAN were not taken into
account. Furthermore, due to the lack of follow-up, it was not
possible to assess the relationship between glycoprotein expression
levels and the prognosis of patients with IgAN. As another
limitation, the effect of drug use on the expression levels of
relevant glycoproteins still requires to be further explored.
Finally, more key differential glycoproteins through LC-MS/MS
should be identified and combined to increase the diagnostic
efficacy of IgAN and establish a multi-parameter model with
improved diagnostic performance. Therefore, more samples and more
influencing factors should be considered to obtain more accurate
and reliable results to reveal the clinical diagnosis and prognosis
of urine proteomics in patients with IgAN.
In conclusion, the present study demonstrated the
importance of glycoproteins in urine as basic specific diagnostic
biomarkers for IgAN. Further investigation is necessary to expand
their clinical application.
Acknowledgements
Not applicable.
Funding
Funding: This study was supported by Guangan People's Hospital
High-quality Development Fund (grant no. 21FZ012) and the
Scientific Research Project of the First Affiliated Hospital of
Jinzhou Medical University (grant no. KYTD-2022007).
Availability of data and materials
The datasets used and/or analyzed during the current
study are available from the corresponding author on reasonable
request. The mass spectrometry proteomics data have been deposited
in the ProteomeXchange Consortium via the PRIDE partner repository
(http://www.ebi.ac.uk/pride/archive/projects/PXD041151).
Authors' contributions
JL, LW, HG and ML collected and analyzed the patient
data. JL, JZ and HZ conceived and designed the experiments. JZ and
HZ drafted and revised the paper. All authors have read and
approved the final version of the manuscript. JL and HZ confirm the
authenticity of all the raw data.
Ethics approval and consent to
participate
This study was approved by the Ethics Committee of
the Guangan People's Hospital (Guangan, China; approval no.
2021009). All participants provided written informed consent before
enrollment.
Patient consent for publication
Not applicable.
Competing interests
The authors declare that they have no competing
interests.
References
|
1
|
Floege J, Rauen T and Tang SCW: Current
treatment of IgA nephropathy. Semin Immunopathol. 43:717–728.
2021.PubMed/NCBI View Article : Google Scholar
|
|
2
|
Nihei Y, Haniuda K, Higashiyama M, Asami
S, Iwasaki H, Fukao Y, Nakayama M, Suzuki H, Kikkawa M, Kazuno S,
et al: Identification of IgA autoantibodies targeting mesangial
cells redefines the pathogenesis of IgA nephropathy. Sci Adv.
9(eadd6734)2023.PubMed/NCBI View Article : Google Scholar
|
|
3
|
Yeo SC, Goh SM and Barratt J: Is
immunoglobulin A nephropathy different in different ethnic
populations? Nephrology (Carlton). 24:885–895. 2019.PubMed/NCBI View Article : Google Scholar
|
|
4
|
Hamano T, Imaizumi T, Hasegawa T, Fujii N,
Komaba H, Ando M, Nangaku M, Nitta K, Hirakata H, Isaka Y, et al:
Biopsy-proven CKD etiology and outcomes: The chronic kidney disease
Japan cohort (CKD-JAC) study. Nephrol Dial Transplant. 38:384–395.
2023.PubMed/NCBI View Article : Google Scholar
|
|
5
|
Liu Y, Wei W, Yu C, Xing L, Wang M, Liu R,
Ma J, Liu X, Xie R and Sui M: Epidemiology and risk factors for
progression in Chinese patients with IgA nephropathy. Med Clin
(Barc). 157:267–273. 2021.PubMed/NCBI View Article : Google Scholar : (In English,
Spanish).
|
|
6
|
Barratt J, Rovin B, Wong MG, Alpers CE,
Bieler S, He P, Inrig J, Komers R, Heerspink HJL, Mercer A, et al:
IgA nephropathy patient baseline characteristics in the sparsentan
PROTECT study. Kidney Int Rep. 8:1043–1056. 2023.PubMed/NCBI View Article : Google Scholar
|
|
7
|
Mohd R, Mohammad Kazmin NE, Abdul Cader R,
Abd Shukor N, Wong YP, Shah SA and Alfian N: Long term outcome of
immunoglobulin A (IgA) nephropathy: A single center experience.
PLoS One. 16(e0249592)2021.PubMed/NCBI View Article : Google Scholar
|
|
8
|
Pattrapornpisut P, Avila-Casado C and
Reich HN: IgA Nephropathy: Core curriculum 2021. Am J Kidney Dis.
78:429–441. 2021.PubMed/NCBI View Article : Google Scholar
|
|
9
|
Trimarchi H, Barratt J, Cattran DC, Cook
HT, Coppo R, Haas M, Liu ZH, Roberts IS, Yuzawa Y, Zhang H, et al:
Oxford classification of IgA nephropathy 2016: An update from the
IgA nephropathy classification working group. Kidney Int.
91:1014–1021. 2017.PubMed/NCBI View Article : Google Scholar
|
|
10
|
Chen T, Li X, Li Y, Xia E, Qin Y, Liang S,
Xu F, Liang D, Zeng C and Liu Z: Prediction and risk stratification
of kidney outcomes in IgA nephropathy. Am J Kidney Dis. 74:300–309.
2019.PubMed/NCBI View Article : Google Scholar
|
|
11
|
Gutiérrez E, Carvaca-Fontán F, Luzardo L,
Morales E, Alonso M and Praga M: A personalized update on IgA
nephropathy: A new vision and new future challenges. Nephron.
144:555–571. 2020.PubMed/NCBI View Article : Google Scholar
|
|
12
|
Bomback AS, Perazella MA and Choi MJ:
American society of nephrology quiz and questionnaire 2015:
Glomerular diseases. Clin J Am Soc Nephrol. 11:884–890.
2016.PubMed/NCBI View Article : Google Scholar
|
|
13
|
Koszegi S, Molnar A, Lenart L, Hodrea J,
Balogh DB, Lakat T, Szkibinszkij E, Hosszu A, Sparding N, Genovese
F, et al: RAAS inhibitors directly reduce diabetes-induced renal
fibrosis via growth factor inhibition. J Physiol. 597:193–209.
2019.PubMed/NCBI View
Article : Google Scholar
|
|
14
|
Wang S, Dong L, Qin A, Tan J, Zhou X and
Qin W: Roles of mesangial C3 and C1q deposition in the clinical
manifestations and prognosis of IgAN. Int Immunopharmacol.
120(110354)2023.PubMed/NCBI View Article : Google Scholar
|
|
15
|
Han X, Xiao Y, Tang Y, Zheng X, Anwar M
and Qin W: Clinical and pathological features of immunoglobulin A
nephropathy patients with nephrotic syndrome. Clin Exp Med.
19:479–486. 2019.PubMed/NCBI View Article : Google Scholar
|
|
16
|
Yu GZ, Guo L, Dong JF, Shi SF, Liu LJ,
Wang JW, Sui GL, Zhou XJ, Xing Y, Li HX, et al: Persistent
hematuria and kidney disease progression in IgA nephropathy: A
cohort study. Am J Kidney Dis. 76:90–99. 2020.PubMed/NCBI View Article : Google Scholar
|
|
17
|
Shen Y, Xiao T, Yu Z, Huang Y, He T, Li H,
Zhang J, Xiong J and Zhao J: Arteriolar hyalinosis and renal
outcomes in patients with immunoglobulin A nephropathy. Ren Fail.
44:994–1003. 2022.PubMed/NCBI View Article : Google Scholar
|
|
18
|
Ebbestad R, Sanaei Nurmi M and Lundberg S:
Long-term outcomes of patients with IgA nephropathy categorized by
the international IgAN Risk prediction tool and by the degree of
hematuria at diagnosis. Nephron. 146:573–583. 2022.PubMed/NCBI View Article : Google Scholar
|
|
19
|
Rauen T, Wied S, Fitzner C, Eitner F,
Sommerer C, Zeier M, Otte B, Panzer U, Budde K, Benck U, et al:
After ten years of follow-up, no difference between supportive care
plus immunosuppression and supportive care alone in IgA
nephropathy. Kidney Int. 98:1044–1052. 2020.PubMed/NCBI View Article : Google Scholar
|
|
20
|
Moriyama T, Tanaka K, Iwasaki C, Oshima Y,
Ochi A, Kataoka H, Itabashi M, Takei T, Uchida K and Nitta K:
Prognosis in IgA nephropathy: 30-Year analysis of 1,012 patients at
a single center in Japan. PLoS One. 9(e91756)2014.PubMed/NCBI View Article : Google Scholar
|
|
21
|
Cheung PW, Bouley R and Brown D: Targeting
the trafficking of kidney water channels for therapeutic benefit.
Annu Rev Pharmacol Toxicol. 60:175–194. 2020.PubMed/NCBI View Article : Google Scholar
|
|
22
|
Mihasan M, Wormwood KL, Sokolowska I, Roy
U, Woods AG and Darie CC: Mass spectrometry- and computational
structural biology-based investigation of proteins and peptides.
Adv Exp Med Biol. 1140:265–287. 2019.PubMed/NCBI View Article : Google Scholar
|
|
23
|
Goetze JP, Bruneau BG, Ramos HR, Ogawa T,
de Bold MK and de Bold AJ: Cardiac natriuretic peptides. Nat Rev
Cardiol. 17:698–717. 2020.PubMed/NCBI View Article : Google Scholar
|
|
24
|
Silsirivanit A: Glycosylation markers in
cancer. Adv Clin Chem. 89:189–213. 2019.PubMed/NCBI View Article : Google Scholar
|
|
25
|
Xu MM, Zhou MT, Li SW, Zhen XC and Yang S:
Glycoproteins as diagnostic and prognostic biomarkers for
neurodegenerative diseases: A glycoproteomic approach. J Neurosci
Res. 99:1308–1324. 2021.PubMed/NCBI View Article : Google Scholar
|
|
26
|
Connelly MA, Gruppen EG, Otvos JD and
Dullaart RPF: Inflammatory glycoproteins in cardiometabolic
disorders, autoimmune diseases and cancer. Clin Chim Acta.
459:177–186. 2016.PubMed/NCBI View Article : Google Scholar
|
|
27
|
Prikryl P, Vojtova L, Maixnerova D,
Vokurka M, Neprasova M, Zima T and Tesar V: Proteomic approach for
identification of IgA nephropathy-related biomarkers in urine.
Physiol Res. 66:621–632. 2017.PubMed/NCBI View Article : Google Scholar
|
|
28
|
Zeng W, Zheng S, Su T, Cheng J, Mao Y,
Zhong Y, Liu Y, Chen J, Zhao W, Lin T, et al: Comparative
N-glycoproteomics analysis of clinical samples via different mass
spectrometry dissociation methods. Front Chem.
10(839470)2022.PubMed/NCBI View Article : Google Scholar
|
|
29
|
Fang X, Lu M, Xia Z, Gao C, Cao Y, Wang R,
Wang M and Wu H: Use of liquid chromatography-tandem mass
spectrometry to perform urinary proteomic analysis of children with
IgA nephropathy and Henoch-Schönlein purpura nephritis. J
Proteomics. 230(103979)2021.PubMed/NCBI View Article : Google Scholar
|
|
30
|
Kawakita C, Mise K, Onishi Y, Sugiyama H,
Yoshida M, Yamada M and Wada J: Novel urinary glycan profiling by
lectin array serves as the biomarkers for predicting renal
prognosis in patients with IgA nephropathy. Sci Rep.
11(3394)2021.PubMed/NCBI View Article : Google Scholar
|
|
31
|
Ren W, Bian Q and Cai Y: Mass
spectrometry-based N-glycosylation analysis in kidney disease.
Front Mol Biosci. 9(976298)2022.PubMed/NCBI View Article : Google Scholar
|
|
32
|
Floege J, Wied S and Rauen T: Assessing
prognosis in IgA nephropathy. Kidney Int. 102:22–24.
2022.PubMed/NCBI View Article : Google Scholar
|
|
33
|
Choi YW, Kim YG, Song MY, Moon JY, Jeong
KH, Lee TW, Ihm CG, Park KS and Lee SH: Potential urine proteomics
biomarkers for primary nephrotic syndrome. Clin Proteomics.
14(18)2017.PubMed/NCBI View Article : Google Scholar
|
|
34
|
Lin Y, Yin P, Zhu Z, Peng Y, Li M, Li J,
Liang L and Yu X: Epigenome-wide association study and network
analysis for IgA nephropathy from CD19+ B-cell in
Chinese population. Epigenetics. 16:1283–1294. 2021.PubMed/NCBI View Article : Google Scholar
|
|
35
|
Buren M, Yamashita M, Suzuki Y, Tomino Y
and Emancipator SN: Altered expression of lymphocyte homing
chemokines in the pathogenesis of IgA nephropathy. Contrib Nephrol.
157:50–55. 2007.PubMed/NCBI View Article : Google Scholar
|
|
36
|
Grywalska E, Smarz-Widelska I,
Krasowska-Zajac E, Korona-Glowniak I, Zaluska-Patel K, Mielnik M,
Podgajna M, Malm A, Rolinski J and Zaluska W: The PD-1/PD-L1
inhibitory pathway is altered in primary glomerulonephritides. Arch
Immunol Ther Exp (Warsz). 66:133–143. 2018.PubMed/NCBI View Article : Google Scholar
|
|
37
|
Kaga H, Matsumura H, Suzuki T, Dohmae N,
Odaka M, Komatsuda A, Takahashi N and Wakui H: Comparative
proteomic analysis of glomerular proteins in primary and
bucillamine-induced membranous nephropathy. Clin Proteomics.
19(26)2022.PubMed/NCBI View Article : Google Scholar
|
|
38
|
Zhang Y, Hu R, Wu H, Jiang W, Sun Y, Wang
Y, Song Y, Jin T, Zhang H, Mao X, et al: OTUB1 overexpression in
mesangial cells is a novel regulator in the pathogenesis of
glomerulonephritis through the decrease of DCN level. PLoS One.
7(e29654)2012.PubMed/NCBI View Article : Google Scholar
|
|
39
|
In JW, Jung K, Shin S, Park KU, Lee H and
Song EY: Association of HLA-DRB1 and -DQB1 alleles with
susceptibility to IgA nephropathy in Korean patients. Ann Lab Med.
42:54–62. 2022.PubMed/NCBI View Article : Google Scholar
|
|
40
|
Jiyun Y, Guisen L, Li Z, Yi S, Jicheng L,
Fang L, Xiaoqi L, Shi M, Cheng J, Ying L, et al: The genetic
variants at the HLA-DRB1 gene are associated with primary IgA
nephropathy in Han Chinese. BMC Med Genet. 13(33)2012.PubMed/NCBI View Article : Google Scholar
|
|
41
|
Zhan X, Deng F, Wang AY, Chen Q, Du Y,
Wang Q, Zhong X, Zhang P, Wang W, Chen S, et al: HLA-DQB1 and
HLA-DRB1 expression is associated with disease severity in IgAN.
Ann Palliat Med. 10:9453–9466. 2021.PubMed/NCBI View Article : Google Scholar
|
|
42
|
López-Mejías R, Genre F, Pérez BS,
Castañeda S, Ortego-Centeno N, Llorca J, Ubilla B, Remuzgo-Martínez
S, Mijares V, Pina T, et al: Association of HLA-B*41:02 with
Henoch-Schönlein Purpura (IgA Vasculitis) in Spanish individuals
irrespective of the HLA-DRB1 status. Arthritis Res Ther.
17(102)2015.PubMed/NCBI View Article : Google Scholar
|
|
43
|
McCarlie VW, Hartsfield JK Jr, Blum JS,
González-Cabezas C, Chin JR, Eckert GJ, Morford LA, Pescovitz MD,
Rodriguez H, Fontana M and Gregory RL: Total IgA and IgA reactivity
to antigen I/II epitopes in HLA-DRB1*04 positive subjects. Open J
Immunol. 3:82–92. 2013.PubMed/NCBI View Article : Google Scholar
|
|
44
|
Li M, Wang L, Shi DC, Foo JN, Zhong Z,
Khor CC, Lanzani C, Citterio L, Salvi E, Yin PR, et al: Genome-wide
meta-analysis identifies three novel susceptibility loci and
reveals ethnic heterogeneity of genetic susceptibility for IgA
nephropathy. J Am Soc Nephrol. 31:2949–2963. 2020.PubMed/NCBI View Article : Google Scholar
|
|
45
|
Cao HX, Li M, Nie J, Wang W, Zhou SF and
Yu XQ: Human leukocyte antigen DRB1 alleles predict risk and
disease progression of immunoglobulin A nephropathy in Han Chinese.
Am J Nephrol. 28:684–691. 2008.PubMed/NCBI View Article : Google Scholar
|
|
46
|
Kiryluk K, Li Y, Sanna-Cherchi S,
Rohanizadegan M, Suzuki H, Eitner F, Snyder HJ, Choi M, Hou P,
Scolari F, et al: Geographic differences in genetic susceptibility
to IgA nephropathy: GWAS replication study and geospatial risk
analysis. PLoS Genet. 8(e1002765)2012.PubMed/NCBI View Article : Google Scholar
|
|
47
|
Li PK, Burns AP, So AK, Pusey CD, Feehally
J and Rees AJ: The DQw7 allele at the HLA-DQB locus is associated
with susceptibility to IgA nephropathy in Caucasians. Kidney Int.
39:961–965. 1991.PubMed/NCBI View Article : Google Scholar
|
|
48
|
Hahn WH, Suh JS, Park HJ and Cho BS:
Interleukin 7 receptor gene polymorphisms and haplotypes are
associated with susceptibility to IgA nephropathy in Korean
children. Exp Ther Med. 2:1121–1126. 2011.PubMed/NCBI View Article : Google Scholar
|
|
49
|
Moon PG, Lee JE, You S, Kim TK, Cho JH,
Kim IS, Kwon TH, Kim CD, Park SH, Hwang D, et al: Proteomic
analysis of urinary exosomes from patients of early IgA nephropathy
and thin basement membrane nephropathy. Proteomics. 11:2459–2475.
2011.PubMed/NCBI View Article : Google Scholar
|
|
50
|
Narimatsu H and Sato T: Wisteria
floribunda agglutinin positive glycobiomarkers: A unique lectin as
a serum biomarker probe in various diseases. Expert Rev Proteomics.
15:183–190. 2018.PubMed/NCBI View Article : Google Scholar
|
|
51
|
Gudehithlu KP, Hart P, Joshi A,
Garcia-Gomez I, Cimbaluk DJ, Dunea G, Arruda JAL and Singh AK:
Urine exosomal ceruloplasmin: A potential early biomarker of
underlying kidney disease. Clin Exp Nephrol. 23:1013–1021.
2019.PubMed/NCBI View Article : Google Scholar
|
|
52
|
Pang L, Duan N, Xu D, Jiao L, Huang C, Du
J, Guo Q and Li H: Urine afamin and afamin-creatinine ratio as
biomarkers for kidney injury. Biomark Med. 12:1241–1249.
2018.PubMed/NCBI View Article : Google Scholar
|
|
53
|
Kalantari S, Rutishauser D, Samavat S,
Nafar M, Mahmudieh L, Rezaei-Tavirani M and Zubarev RA: Urinary
prognostic biomarkers and classification of IgA nephropathy by high
resolution mass spectrometry coupled with liquid chromatography.
PLoS One. 8(e80830)2013.PubMed/NCBI View Article : Google Scholar
|
|
54
|
Berger J and Hinglais N: Intercapillary
deposits of IgA-IgG. J Urol Nephrol (Paris). 74:694–695.
1968.PubMed/NCBI(In French).
|
|
55
|
Rajasekaran A, Julian BA and Rizk DV: IgA
nephropathy: An interesting autoimmune kidney disease. Am J Med
Sci. 361:176–194. 2021.PubMed/NCBI View Article : Google Scholar
|
|
56
|
Yamagata K, Iseki K, Nitta K, Imai H, Iino
Y, Matsuo S, Makino H and Hishida A: Chronic kidney disease
perspectives in Japan and the importance of urinalysis screening.
Clin Exp Nephrol. 12:1–8. 2008.PubMed/NCBI View Article : Google Scholar
|
|
57
|
Donadio JV and Grande JP: IgA nephropathy.
N Engl J Med. 347:738–748. 2002.PubMed/NCBI View Article : Google Scholar
|
|
58
|
Schena FP, Rossini M, Abbrescia DI and
Zaza G: The molecular mechanisms of inflammation and scarring in
the kidneys of immunoglobulin A nephropathy: Gene involvement in
the mechanisms of inflammation and scarring in kidney biopsy of
IgAN patients. Semin Immunopathol. 43:691–705. 2021.PubMed/NCBI View Article : Google Scholar
|
|
59
|
Tan J, Luo X, Yang J, Liu N, Jiang Z, Tang
Y and Qin W: Clinicopathological characteristics and risk factors
in elderly patients with biopsy-proven IgA nephropathy. Ren Fail.
44:1026–1036. 2022.PubMed/NCBI View Article : Google Scholar
|