Introduction
After the human body rises to the plateau area at an
altitude of 2,500 m, the partial pressure of oxygen
(PaO2) decreases with increasing altitude, producing a
low-pressure hypoxic situation. The inability of the human body to
adapt to low-pressure and hypoxic environments can lead to tissue
hypoxia, followed by acute plateau reactions, such as plateau
pulmonary or cerebral oedema, and acute altitude sickness (1). Acute and prolonged exposure to
low-pressure and hypoxic environments can lead to the generation of
reactive oxygen species (ROS), which accelerates with increasing
altitude (2). Relatively high
levels of ROS may cause oxidative damage to tissues or induce
apoptosis under immune defence or pathological conditions (3). It is estimated that >140 million
individuals worldwide live at altitudes >2,500 m (4). Therefore, it is important to study
the molecular mechanisms of tissue systems in response to hypoxic
stress at high altitudes in workers and sojourners in high-altitude
areas.
The kidney is a highly metabolic organ that requires
a large amount of adenosine triphosphate (ATP) to maintain the
energy needed for water and solute reabsorption. Abnormal energy
production or utilisation can lead to cell dysfunction and death
(5). At the centre of cellular
bioenergetics, mitochondria serve a key role in the regulation of
cellular metabolism (6). In
response to hypoxic environments, mitochondria were reported to
adjust their metabolism in different ways, including exchanging or
modifying subunits of the respiratory chain, reducing oxidative
phosphorylation (OXPHOS), tricarboxylic acid (TCA) cycle
intermediates, adapting to ROS production and reducing β-oxidation
(7). A recent study showed that
impaired energy metabolism is characterised by ATP deficiency and
increased ROS (8), while a
previous study showed that increased ROS ultimately leads to
mitochondrial dysfunction by inducing mitochondrial oxidative
damage (9). In addition,
mitochondrial ROS production plays a key role in the development of
diabetic nephropathy and inhibiting excessive mitochondrial ROS
production can improve tubular oxidative damage (10). It was previously reported that
energy metabolism dysfunction is a key factor in the pathogenesis
of acute kidney injury (AKI) (5).
AKI is widely recognised as an important risk factor for the
development and progression of chronic kidney disease (CKD)
(11-13).
Dysregulation of mitochondrial homeostasis, changes in
bioenergetics, and organelle stress crosstalk can lead to the
transformation of AKI into CKD (14). Taken together, dysfunction of
energy metabolism can induce kidney tissue damage.
The TCA cycle and OXPHOS are important sources of
cellular energy and are involved in numerous cellular metabolic
pathways (15,16). Exposure to hypoxia inhibits the TCA
cycle pathway and converts the glycolytic pathway into the primary
metabolic pathway that generates available energy (17). Therefore, further investigation is
required regarding changes to energy metabolism mechanisms induced
by hypoxia through the TCA cycle with the OXPHOS pathway.
To improve the comprehension of the effect of
hypoxic exposure on mouse kidney tissue, a plateau hypoxia animal
model was constructed in the present study. Kidney tissue
morphology was observed using haematoxylin and eosin (H&E)
staining. Illumina transcriptome sequencing and liquid
chromatography-tandem mass spectrometry (LC-MS/MS) non-targeted
metabolomics techniques were used to identify differentially
expressed genes (DEGs) and significantly different metabolites
(SDMs) between experimental and control groups (P<0.05). The
mechanism by which hypoxia inhibits energy metabolism in kidney
tissues was explored using the TCA cycle and OXPHOS. Furthermore,
inflammation-related genes (IRGs) were screened using the Ensembl
database and combined with DEGs to analyse the possible effects of
hypoxia on inflammation. The present study clarified that
hypoxia-induced alterations in renal energy metabolism and that
changes in energy metabolism induced inflammation.
Materials and methods
Experimental animals
Six- to eight-week-old specific pathogen-free (SPF)
male C57BL/6 mice with a body mass of 18±2 g were purchased from
the Experimental Animal Centre of the Department of Medicine, Xi'an
Jiaotong University [animal production license no. SYXK (Shaanxi)
2020-005]. The research institute is located in Xining, China at an
altitude of 2,200 m; in order to provide a natural normoxic and
hypoxic condition, mice were randomly divided into two groups (five
mice per group). The control group raised at the Experimental
Animal Centre of the Department of Medicine, Xi'an Jiaotong
University (Xi'an, China) at an altitude of 400 m, was named the
plain normoxia (PKC) group. The plateau hypoxia (HKT) group was
raised in the Experimental Animal Room of the People's Hospital of
Maduo County, Guoluo Tibetan Autonomous Prefecture (Xining, China),
at an altitude of 4,200 m. All animals were provided with free
access to food and water. The ambient temperature was 18-25˚C, and
the relative humidity was 40-50%. In the process of animal feeding
and experimental operation, if mice developed either spontaneous
tumors the size of which was >10% of the body weight of mice,
incurable skin ulcers, severe shivering, spasm, dyspnea or
cyanosis, they were to be euthanized immediately. No mice were
euthanized for these reasons in the present study. After 30 days,
kidney tissues were aseptically collected from mice; one part was
stored in liquid nitrogen, and the other part was fixed with 4%
paraformaldehyde at 4˚C for 48 h.
Reagents and instruments
Primers were purchased from Shanghai Sangong
Pharmaceutical Co., Ltd. and the TRIzol® RNA extraction
buffer was purchased from Invitrogen (Thermo Fisher Scientific,
Inc.). The reverse transcription kit PrimeScript™ RT reagent Kit
with gDNA Eraser (cat. no. RR047A) and quantitative polymerase
chain reaction (qPCR) kit TB Green® Premix Ex Taq™ II
(Tli RNaseH Plus; cat. no. RR820A) were purchased from Takara Bio,
Inc. The fluorescent qPCR instrument was purchased from Roche
Diagnostics GmbH. Antibodies, the ECL chemiluminescent solution and
the western blot imaging system were purchased from Proteintech
Group, Inc., Thermo Fisher Scientific, Inc. and Vilber Lourmat,
respectively.
Measurement of blood gas analysis
index and kidney index in mice
After 30 days of modelling, the two groups of mice
remained on an empty stomach for 12 h, their fasting weights were
measured, and they were anesthetized using 400 mg/kg 10% chloral
hydrate. The mice were then fixed on a foam plate to take blood and
kidney tissues by laparotomy. After taking 10% chloral hydrate,
there was no sign of peritonitis in animals. After laparotomy, 0.2
ml of blood was taken through the abdominal aorta using a heparin
anticoagulant needle, and attention was paid to avoid discharging
air bubbles in the needle tube and isolating air. Using a PT1000
blood gas analyzer (Wuhan Easy Diagnosis Biomedicine Co., Ltd.),
arterial oxygen PaO2 and blood oxygen saturation
(SaO2) were measured within 15 min. Subsequently, mouse
bilateral kidney tissues were removed aseptically, rinsed with
pre-cooled saline, and filter paper was used to absorb the water on
the kidney surface. Both kidneys were then weighed. The kidney
index of the mice was calculated using the following formula:
Kidney index=bilateral kidney mass (g)/body mass (g) x100%.
H&E staining of mouse kidney
Mouse kidney tissues were fixed in 4%
paraformaldehyde at 4˚C for 48 h, dehydrated in an ethanol
gradient, embedded in paraffin and sliced into 5- to 6-µm thick
sections. After xylene dewaxing, the slices were stained with
hematoxylin for 5 min at room temperature, and after washing, the
slices were incubated with eosin for 2 min. Tissue sections were
observed by Nikon microscope (Nikon Corporation) and the images
were analyzed by Zeiss software (version 2.3; Zeiss AG).
RNA extraction and reverse
transcription-qPCR (RT-qPCR)
Total RNA in the mouse kidneys was isolated with
TRIzol® reagent (Thermo Fisher Scientific, Inc.), and
the concentration of RNA was measured with a Nanodrop 2000
spectrophotometer (Thermo Fisher Scientific, Inc.). The RNA was
reversed into cDNA using SYBR Green (Takara Bio, Inc.) with Prime
Script RT Regent Kit with GDNA Eraser (Takara Bio, Inc.), with the
following reaction conditions: 37˚C for 15 min and 87˚C for 5 sec.
PCR amplification was performed using cDNA as a template and
β-actin as an internal reference. Primer sequences are listed in
Table I. All primers used were
designed by Shanghai Shenggong Biology Engineering Technology
Service, Ltd. The total PCR measured 20 µl, and included 10 µl TB
Green® Premix Ex Taq™ II, 6.4 µl ddH2O, 2 µl
template and 0.8 µl of upstream and downstream primers. The
thermocycling conditions included pre-denaturation at 95˚C for 30
sec, amplification at 95˚C for 5 sec, 63˚C for 60 sec, and 60
cycles of lysis at 95˚C for 10 sec, 65˚C for 60 sec, 97˚C for 1 sec
and finally cooling at 37˚C for 30 sec. The relative expression
levels of selected genes in the HKT and PKC groups were quantified
using the 2-ΔΔCq method (18).
 | Table IPrimers used in the present
study. |
Table I
Primers used in the present
study.
| | Primer sequences
(5'-3') |
|---|
| Gene | Forward | Reverse |
|---|
| β-actin |
CATCCGTAAAGACCTCTATGCCAAC |
ATGGAGCCACCGATCCACA |
| IDH3A |
AGTTTGATGTTCTTGTCATGCC |
GAAGCATCATCACAGCACTAAG |
| SUCLA2 |
AAAGGAACATTTACAAGTGGCC |
GCTCACAGACCAAAACTTGATT |
| MDH2 |
CAAAGAGACGGAATGCACTTAC |
CTTTCTTGATGGAGGCTTTCAG |
| UQCRFS1 |
AGGTGCCCGACTTCTCTGACTATC |
CCGCATAAGCAACACCCACAGTAG |
| UQCRC1 |
GGACCTTGCCCAGAAACACTTGAG |
CAGTAGAGCGACATGGAGTGAGAC |
| CYC1 |
GCCCTTCATTCTGCCGTGAGTG |
GGTGTGGTCCAAGGAGGAGAGG |
| IL12B |
ATGTGGAATGGCGTCTCTGTCTG |
CAGTTCAATGGGCAGGGTCTCC |
| IL1B |
TCCAGGATGAGGACATGAGCAC |
GAACGTCACACACCAGCAGGTTA |
| S100A8 |
CTTGAGCAACCTCATTGATGTC |
GGAACTCCTCGAAGTTAATTGC |
| S100A9 |
GGAAGCACAGTTGGCAACCTTTA |
GATCAACTTTGCCATCAGCATCA |
Western blotting
To extract the total protein of mouse kidney
tissues, samples were taken out of the refrigerator at -80˚C and
put into a centrifuge tube equipped with protein extraction Lysis
Buffer (Beijing Solarbio Science & Technology Co., Ltd.).
Kidneys were cut into pieces using sterile surgical scissors and
then centrifuged (Beyotime Institute of Biotechnology) at 13,400 x
g for 10 min at 4˚C. The supernatant was added to a new aseptic
enzyme-free centrifuge tube and the total protein concentration was
measured using a BCA kit (Beyotime Institute of Biotechnology).
Total protein (30 µg protein/lane) was separated by SDS-PAGE on a
12% gel and transferred onto a nitrocellulose membrane. The
membrane was blocked with 5% skimmed milk for 2 h at room
temperature and then incubated with primary antibody at 4˚C for 15
h. IDH3A polyclonal antibody (1:500; cat. no. 15909-1-AP;
Proteintech Group, Inc.), SUCLA2 polyclonal antibody (1:1,000; cat.
no. 12627-1-AP; Proteintech Group, Inc.), MDH2 polyclonal antibody
(1:500; cat. no. 15462-1-AP; Proteintech Group, Inc.), UQCRFS1
polyclonal antibody (1:1,000; cat. no. 18443-1-AP; Proteintech
Group, Inc.), UQCRC1 polyclonal antibody (1:1,000; cat. no.
21705-1-AP; Proteintech Group, Inc.), CYC1 polyclonal antibody
(1:500; cat. no. 10242-1-AP; Proteintech Group, Inc.), NDUFA3
polyclonal antibody (1:200; cat. no. K008505P; Beijing Solarbio
Science & Technology Co., Ltd.), NDUFS7 polyclonal antibody
(1:1,000; cat. no. 15728-1-AP; Proteintech Group, Inc.), IL12B
polyclonal antibody (1:300; cat. no. DF5111; Affinity Biosciences),
IL1B monoclonal antibody (1:300; cat. no. BF8021; Affinity
Biosciences), S100A8 polyclonal antibody (1:300; cat. no.
15792-1-AP; Proteintech Group, Inc.), S100A9 polyclonal antibody
(1:300; cat. no. 26992-1-AP; Proteintech Group, Inc.) and β-actin
monoclonal antibody (1:10,000; cat. no. 66009-1-Ig; Proteintech
Group, Inc.). The relative expression levels of the target proteins
were normalized to those of β-actin. The membranes were washed with
TBS containing 0.05% Tween-20 (Beijing Solarbio Science &
Technology Co., Ltd.) and then incubated with goat anti-rabbit
(1:5,000; cat. no. SA100001-2; Proteintech Group, Inc.) or goat
anti-mouse (1:2,000; cat. no. SA100001-1; Proteintech Group, Inc.)
secondary antibodies for 1 h at room temperature. The membrane was
washed with TBS containing 0.05% Tween-20 five times, each time for
6 min, and the protein bands were visualized using an enhanced
chemiluminescence reagent (Thermo Fisher Scientific, Inc.). Protein
bands were imaged using a gel imaging analysis system (Vilber
Lourmat) and Image J (version 1.80; National Institutes of Health)
was used to quantify the protein expression.
Transcriptome sequencing
[RNA-sequencing (RNA-seq)] and data processing
Changes in total RNA after high-altitude hypoxia
treatment were analysed using transcriptome analysis. The total RNA
of mouse kidney was isolated by TRIzol reagent (Thermo Fisher
Scientific, Inc.). Next, the RNA integrity of HKT and PKC samples
was accurately detected by Agilent 2100 bioanalyzer (Agilent
Technologies Inc.). The initial RNA of the library was total RNA,
and the total amount was ≥1 µg. The ribosomal RNA in RNA samples
was removed to obtain mRNA, and each group of mRNA was randomly cut
into fragments and reverse transcribed into cDNA. A 3' adenosine
fragment and an Illumina linker (Illumina, Inc.) at the repair end
were added to the blunt-ended and phosphorylated cDNA. In order to
select cDNA fragments of preferentially 370-420 bp in length, the
library fragments were purified with AMPure XP system (Beckman
Coulter, Inc.). The kit used to build the database was the
NEBNext® Ultra™ RNA Library Prep Kit (Shanghai Yihui
Biological Technology Co., Ltd.) for Illumina. After the
construction of the library, the library was initially quantified
using a Qubit2.0 Fluorometer (Thermo Fisher Scientific, Inc.), and
the library was diluted to 1.5 ng/µl. Next, the insert size of the
library was detected using an Agilent 2100 bioanalyzer (Agilent
Technologies, Inc.). After the insert size met expectations, the
effective concentration of the library was accurately quantified by
qRT-PCR (the effective concentration of the library was >2 nM)
to ensure the quality of the library. After the library was
constructed, it was sequenced by Illumina Novaseq platform (Beijing
Novogene Co., Ltd.). Subsequently, the original data were filtered,
and the clean reads were quickly and accurately compared with the
reference genome (mus_musculus_Ensembl_102, ftp://ftp.ensembl.org/pub/release-102/fasta/mus_musculus/dna/Mus_musculus.GRCm38.dna.toplevel.fa.gz,
ftp://ftp.ensembl.org/pub/release-102/gtf/mus_musculus/Mus_musculus.GRCm38.102.gtf.gz)
using HISAT2 (version 2.0.5; https://kim-lab.org/) to obtain the positioning
information of reads on the reference genome. The percentage of
bases with Phred value greater than 20 (Q20) or 30 (Q30) to total
bases and GC content of the filtered clean reads were calculated,
and all downstream analyses were based on high-quality clean reads.
The FeatureCounts tool in the Subread (version 1.3.1; https://bioconductor.org/) was used to measure
original gene expression. Sample gene expression was normalized
using the gene expression values of all samples reported as
fragments per kilobase of transcript per million mapped reads
(FPKM) and was successively corrected for sequencing depth and gene
length.
Extraction, preparation and analysis
of metabolites
After blood collection by laparotomy, the mice were
sacrificed, using cervical dislocation as the method of euthanasia.
After mice were sacrificed, the kidney tissues of the mice in the
PKC and HKT groups were separately isolated, and cold methanol at
nine times the volume of the kidney was added. Tissue samples were
homogenized on ice with 30-Hz ultrasound for 30 min. After
homogenisation, the mixture was shaken for 5 min, centrifuged at
4˚C at 13,400 x g for 15 min (Eppendorf), and the supernatant was
transferred to a new centrifuge tube. The remaining precipitate was
homogenised again with precooled ethyl acetate:methanol (ratio,
1:3) and centrifuged once under the same conditions. The
supernatant obtained from both centrifugation steps was transferred
to a fresh glass vial for non-targeted metabolomic analysis.
Electrospray ionisation (ESI) was used to detect positive and
negative ion patterns. The samples were separated by
ultra-high-performance LC and analysed using an Agilent 6550 mass
spectrometer (Fig. S1; Agilent
Technologies, Inc.). The ESI source conditions were as follows: Gas
temperature, 250˚C; dry gas, 16 l/min, atomiser, 20 psig;
intrathecal gas temperature, 400˚C; intrathecal gas flow, 12 l/min;
Vcap, 3,000 V; nozzle voltage, 0 V; fragment, 175 V; mass range,
50-1,200 m/z; acquisition rate, 4 Hz; cycle time, 250 msec.
Bioinformatics analysis
DESeq2 (version 1.20.0; Bioconductor) (19) was used to analyse DEGs between the
HKT and PKC groups, and corrected for P-values (P-adjust). Genes
with P-adjust<0.05, and |log2fold-change(FC)|≥0 were
considered to be DEGs. The screened DEGs were subjected to Gene Set
Enrichment Analysis (GSEA; https://www.gsea-msigdb.org/gsea), Gene Ontology (GO;
https://www.geneontology.org/) and Kyoto
Encyclopaedia of Genes and Genomes (KEGG, https://www.genome.jp/kegg/pathway.html) enrichment
analysis. Metabolites with Very Important Pool score (VIP)>1,
FC>1.5 or FC>0.667 and P<0.05 were considered to be SDMs
taxonomically annotated using the KEGG, Human Metabolome Database
(HMDB; https://hmdb.ca/metabolites) and
LIPID MAPS (https://lipidmaps.org) databases.
Data collection of IRGs
IRGs were obtained from the Ensembl database
(https://www.ensembl.org/). After removing
duplicate genes, 689 IRGs were identified (Table SI). When drawing the Venn diagram
of DEGs and inflammation-related genes (IRGs), the intersection of
the genes in the Venn diagram was defined as the differential IRGs
(DE-IRGs). Pearson's correlation coefficients between DE-IRGs and
energy metabolism-related genes were calculated using R stats
(version 3.6.2; https://rdocumentation.org/packages/stats/versions/3.6.2),
and the results are shown as heat maps.
Statistical methods
Data analysis was performed using SPSS (version
18.0; IBM Corp.) and GraphPad Prism (version 8.4.0; GraphPad;
Dotmatics). Normality and log normality tests in GraphPad Prism
software are used to detect the normality of data. Quantitative
data that conformed to a normal distribution are expressed as the
mean ± standard deviation of three experiments. All statistical
tests in the text are two independent-sample t-tests. P<0.05 was
considered to indicate a statistically significant difference. By
using the calculation method of linear algebra, the dimensions of
tens of thousands of gene variables were reduced and the principal
components were extracted, and the gene expression values (FPKM) of
all samples were analyzed by PCA. Partial least squares regression
was used to establish the relationship model between the expression
of metabolites and sample categories, so as to predict the sample
categories and establish partial least squares discriminant
analysis (PLS-DA) models of each comparison group.
Results
Plateau hypoxia induces kidney injury
in mice
Physiological and biochemical changes indicated that
the modelling of plateau hypoxia in mice was successful.
PaO2 and SaO2 in the hypoxic group were
significantly decreased by 32.66 and 14.58% (P<0.0001; Table II), respectively. The mRNA and
protein expression of HIF-1α were upregulated in the kidney
tissues of the HKT group compared with that in the PKC group
(Fig. 1A-C), suggesting that a
plateau hypoxia mouse model was successfully established.
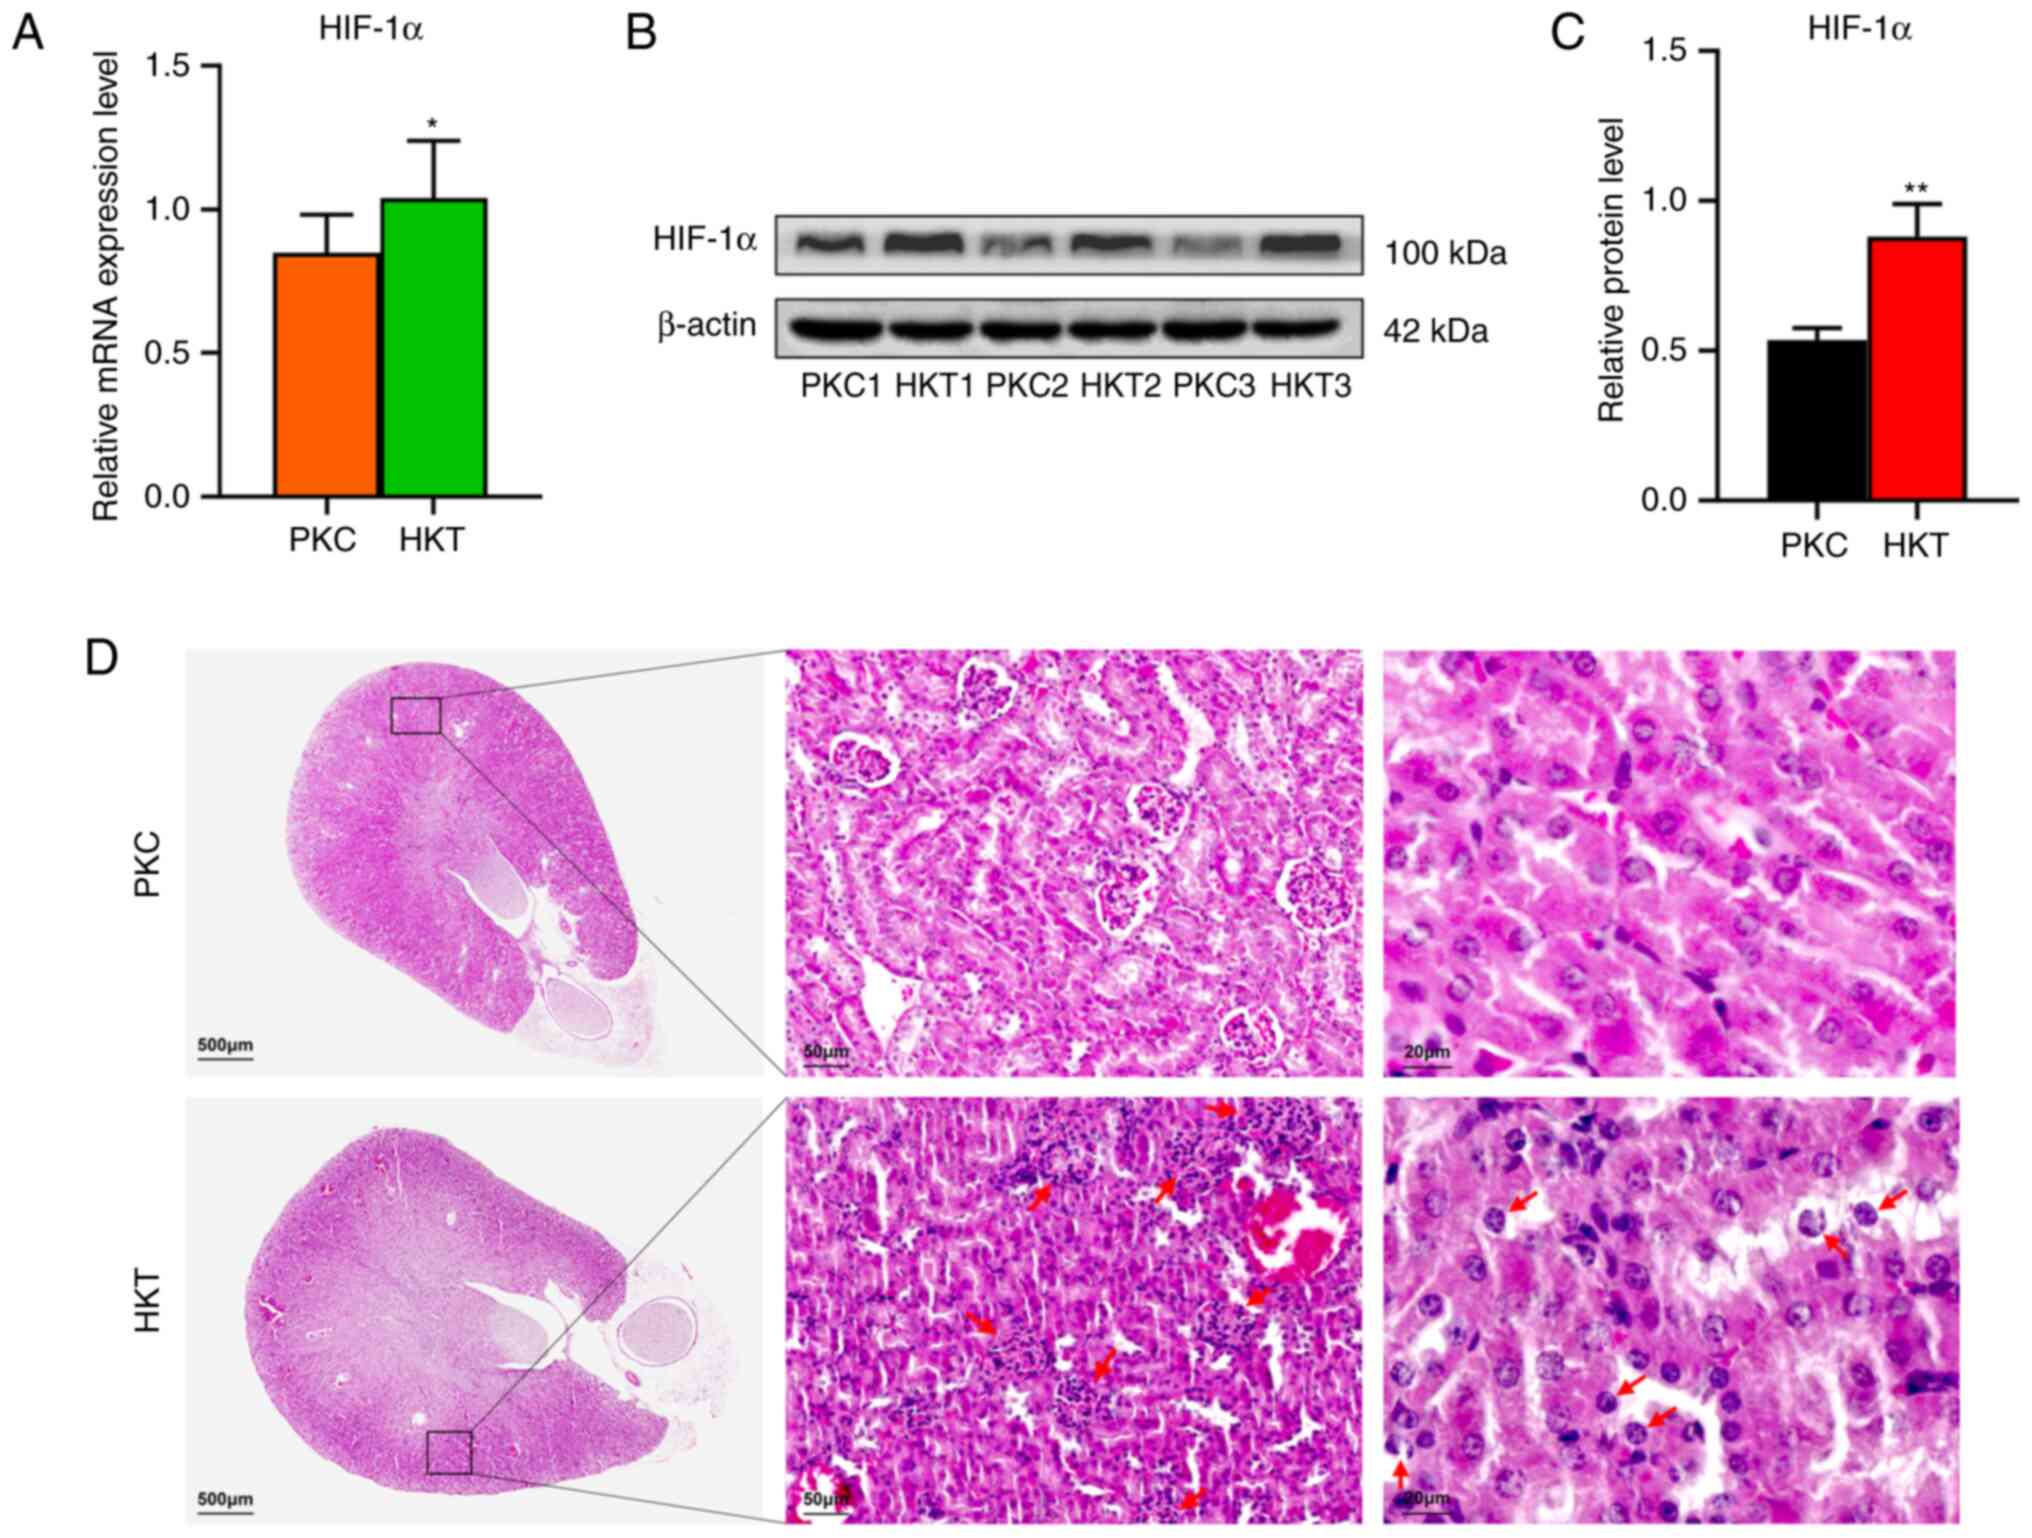 | Figure 1After 30 days of hypoxia treatment,
the expression of HIF-1α in the kidney of mice is downregulated and
the kidney tissue of mice is damaged. (A) The mRNA expression of
HIF-1α. (B) Western blotting of HIF-1α protein expression in the
two groups. (C) Quantitative analysis of HIF-1α protein expression,
with β-actin as the standard. (D) H&E staining of mouse kidney,
with scale bar 500 µm, and the overall morphology of mouse kidney,
with scale bar, 50 µm; black box circle area; red arrow refers to
atrophic and deformed glomeruli; scale bar, 20 µm. The red arrow
pointed to the swelling of renal tubular epithelial cells and cell
enucleation. Data are presented as mean ± standard deviation (n=3).
Compared with PKC, *P<0.05 and
**P<0.01. PKC, plain normoxia group; HKT, plateau
hypoxia group. |
| Table IIBlood gas analysis indexes of two
groups of mice. |
Table II
Blood gas analysis indexes of two
groups of mice.
| | Groups | |
|---|
| Blood gas
indexes | Plain normoxia | Plateau
hypoxia | t |
|---|
| PaO2,
mmHg | 94.896±2.592 | 63.902±3.026 | 17.4a |
| SaO2,
% | 95.006±2.079 | 81.153±0.961 | 10.93a |
As shown in Table
III, compared with that in the PKC group, the body weight of
mice decreased significantly after 30 days of plateau hypoxia
exposure (HKT group) by 16.28% (P<0.0001). Compared with the PKC
group, the kidney mass and index in the HKT group were
significantly decreased by 30.41% (P<0.0001) and 17.03%
(P<0.01), respectively. This indicated that kidney weight was
reduced in mice under a hypoxic environment in the plateau. In the
histological analysis, H&E staining showed that the kidney
tissues in the PKC group had normal glomerular and tubular
morphology without evident tissue damage. The kidney tissues in the
HKT group were damaged, including glomerular atrophy and
deformation, irregular arrangement of kidney tubular epithelial
cells, swelling of some kidney tubular epithelial cells,
erythrocyte exudation and partial cell denucleation (Fig. 1D). It is therefore suggested that
hypoxic environment may induce renal tissue damage in mice.
| Table IIIKidney indexes of two groups of
mice. |
Table III
Kidney indexes of two groups of
mice.
| | Groups | |
|---|
|
Characteristics | Plain normoxia | Plateau
hypoxia | t |
|---|
| Body mass, g | 22.267±0.619 | 18.643±0.641 | 9.097b |
| Bilateral renal
mass, g | 0.336±0.016 | 0.234±0.022 | 8.504b |
| Renal index, % | 1.50±0.085 | 1.27±0.089 | 4.704a |
Plateau hypoxia stress alters energy
metabolism
The quality of the transcriptome sequencing results
was evaluated. The results showed that the PKC and HKT groups
achieved clean reads of 41.47 and 40.68 M, respectively. The base
error rates of the data obtained from sequencing, Q20 and Q30
values were 0.02, 98.14 and >94.47%, respectively, and the range
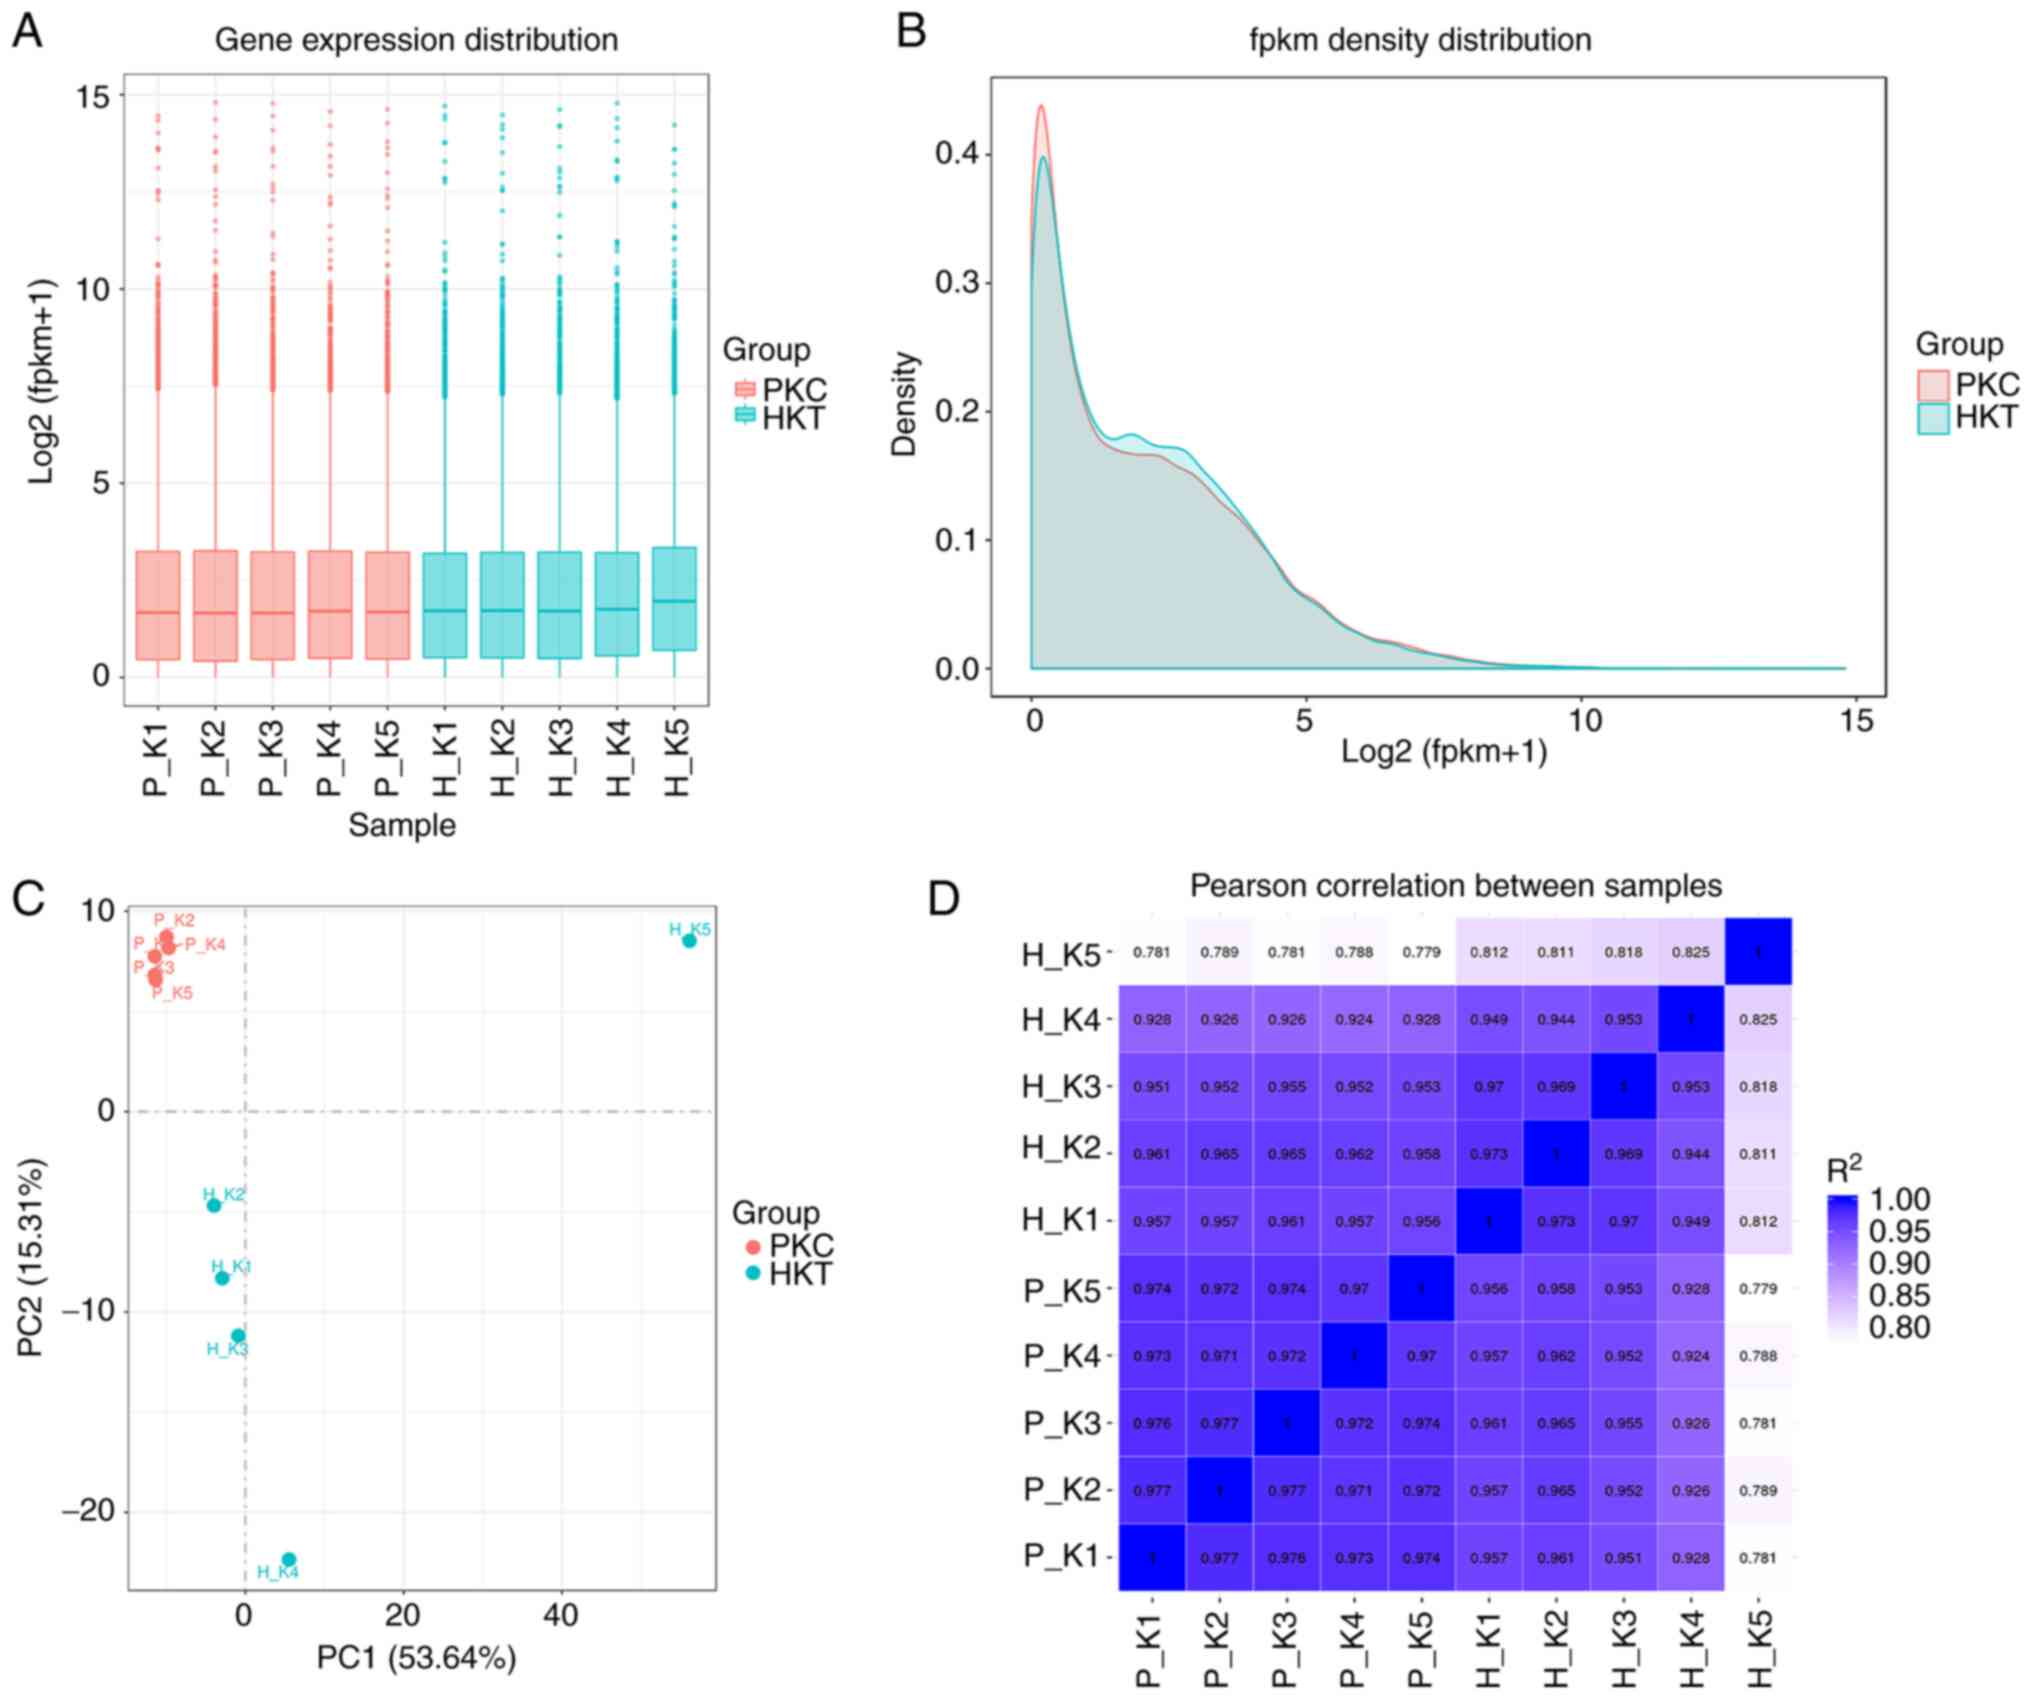
of the GC content was 46.97-48.71% (Table SII). The gene expression levels of
samples were normalized using FPKM, and the distribution of gene
expression levels in different samples was plotted using box-shaped
and density diagrams. The results showed that the average
Log2(FPKM+1) values of genes in both the HKT and PKC
groups were ~2 (Fig. 2A). The
density indices of genes in the PKC and HKT groups were as high as
0.40 and 0.44, respectively (Fig.
2B). PCA results showed that the samples were dispersed among
the groups and concentrated within the group (Fig. 2C). Pearson's correlation test
showed that the range of inter-sample correlation coefficients
(r2) within the group was 0.811-0.977, with
r2>0.8 (Fig. 2D).
These results suggest that the transcriptome sequencing biological
experiment was repeatable and that the sequencing data were
reliable and could be used for subsequent differential gene
analysis.
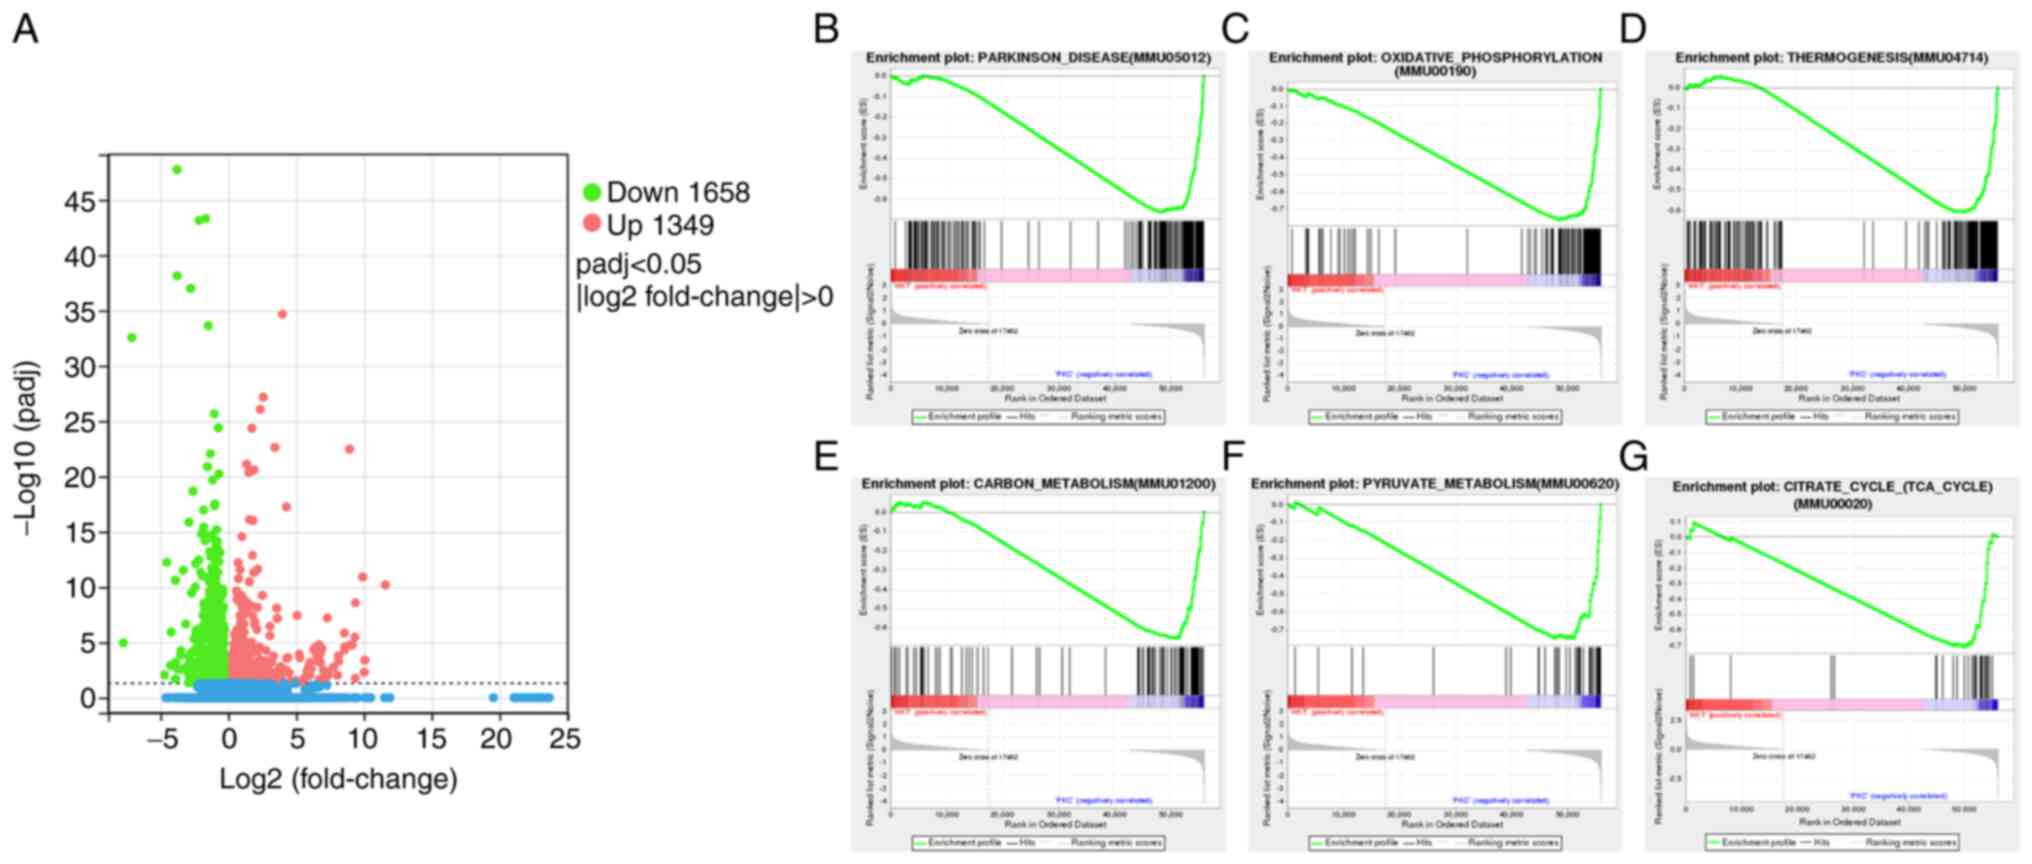
P-adjust<0.05 and |log2FC|>0 were
used as the screening thresholds for DEGs. Compared with the PKC
group, a total of 3,007 DEGs, 1,349 upregulated and 1,658
downregulated, were identified in the HKT group (Fig. 3A). GSEA was used to enrich all the
possible pathways under hypoxic exposure, among which the most
significantly enriched gene set was negatively correlated with the
hypoxic environment, including Parkinson signalling pathway
(Fig. 3B), OXPHOS signalling
pathway (Fig. 3C), thermogenic
signalling pathway (Fig. 3D),
carbon metabolism signalling pathway (Fig. 3E), pyruvate metabolism signalling
pathway (Fig. 3F) and TCA cycle
signalling pathway (Fig. 3G). The
core genes of these pathways were all significantly downregulated
(P<0.05).
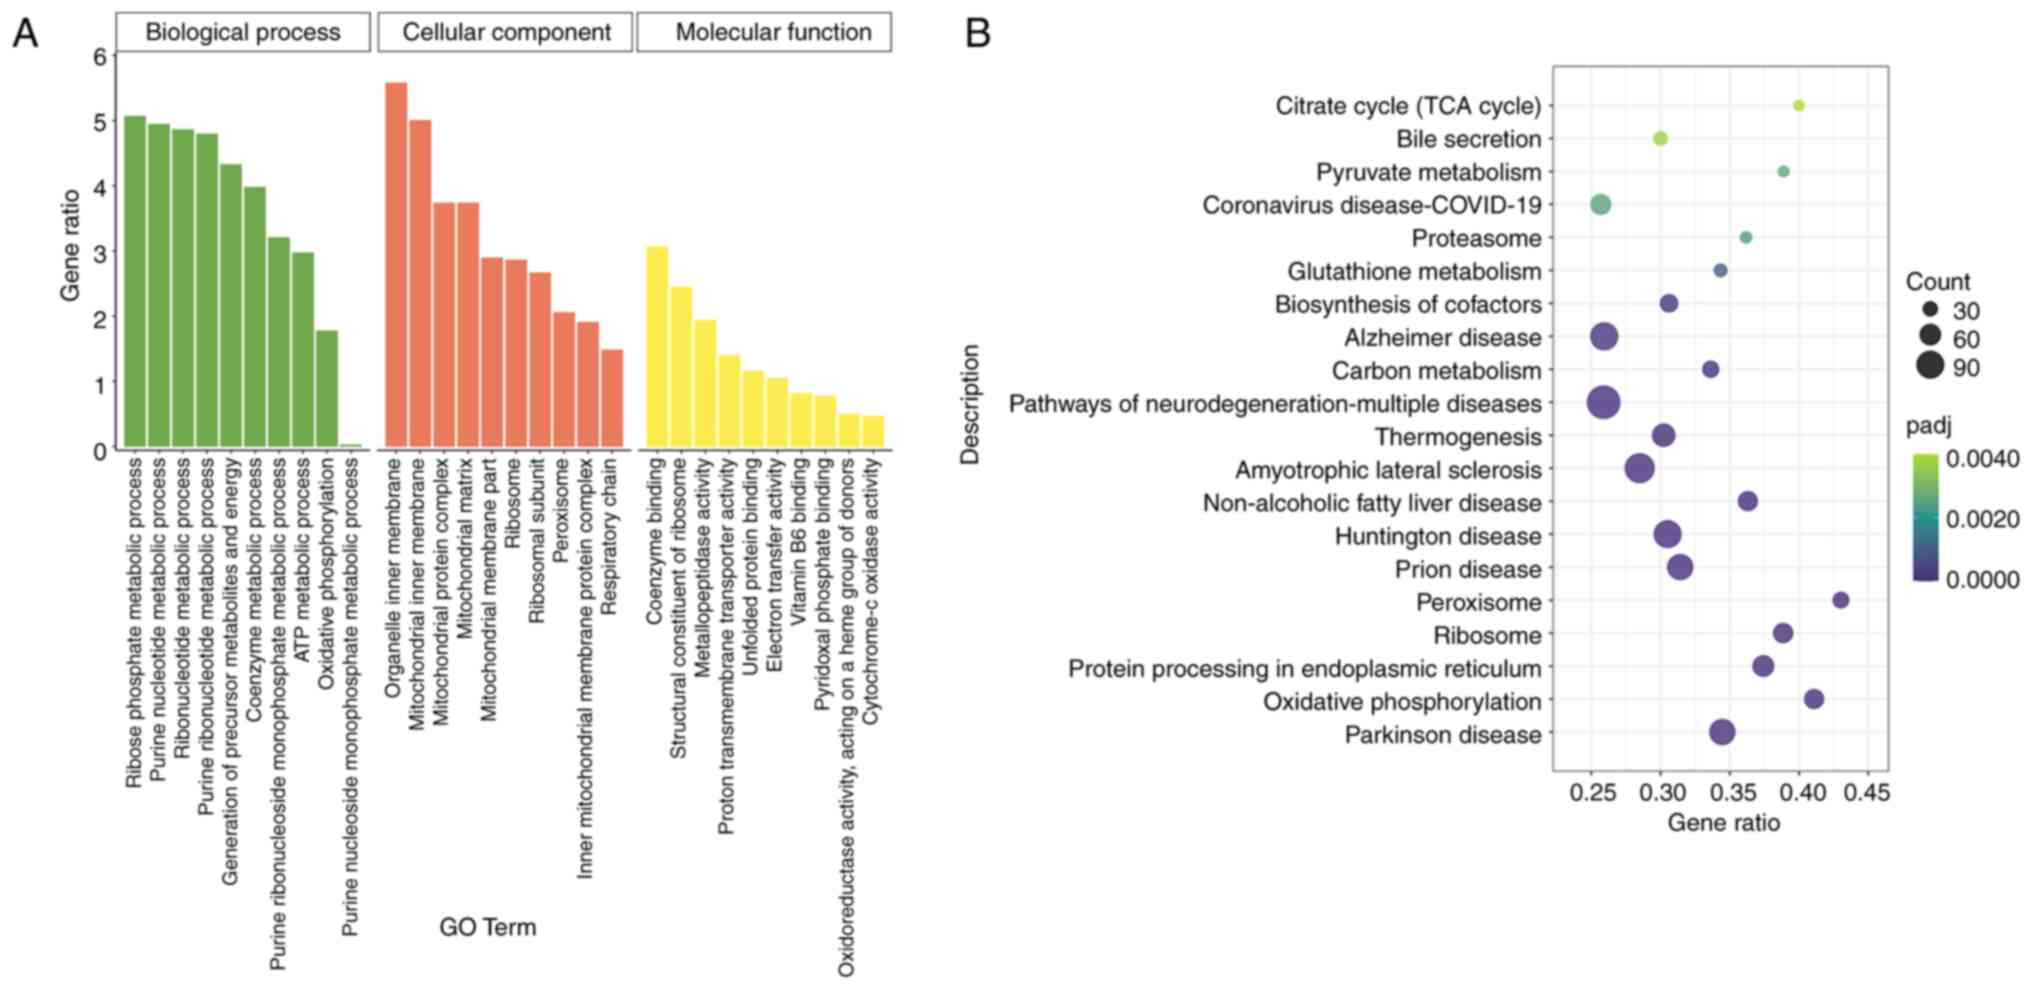
To further understand the biological functions and
adaptive pathways of DEGs under hypoxic stress at the plateau, GO
functional annotation and KEGG pathway enrichment analyses were
performed on the 3,007 enriched DEGs. GO functional annotation
showed that DEGs were enriched in ‘biological processes’, such as
‘ribose phosphate metabolic process’, ‘purine nucleotide metabolic
process’ and ‘energy production of precursor metabolites’. In terms
of ‘cellular components’, the ‘mitochondrial inner membrane’,
‘organelle inner membrane’ and ‘mitochondrial protein complex’ were
the most active. Regarding ‘molecular functions’, ‘structural
constituent of ribosome’ and ‘coenzyme binding’ were significantly
enriched (Fig. 4A). KEGG pathway
enrichment analysis showed that DEGs were significantly enriched in
322 signalling pathways. According to P-adjust, the 20 most
significant KEGG pathways were selected to draw the KEGG pathway
enrichment map, including those related to energy metabolism, such
as ‘OXPHOS’, the ‘TCA cycle’, ‘peroxisome’, ‘thermogenesis’ and
‘carbon metabolism’ signalling pathways (Fig. 4B). These results suggest that
hypoxic stress at the plateau influences energy metabolism.
TCA cycle and OXPHOS pathways in mouse
kidney tissues are inhibited by plateau hypoxia stress
The present study focused on the TCA cycle and
OXPHOS signalling pathways under hypoxic conditions. IDH3A,
SUCLA2 and MDH2 are three key enzymes in the TCA
cycle for ATP generation, and their downregulation leads to reduced
ATP production (20,21). The mRNA expression of genes was
examined using RT-qPCR, and the results showed that IDH3A
(P<0.05), SUCLA2 (P<0.01) and MDH2 (P<0.01)
were downregulated in the HKT group compared with the PKC group
(Figs. 5A and S1A). Accordingly, the protein expression
of IDH3A, SUCLA2 and MDH2 was significantly
downregulated in the HKT group compared with that in the PKC group
(P<0.05; Fig. 5B and C).
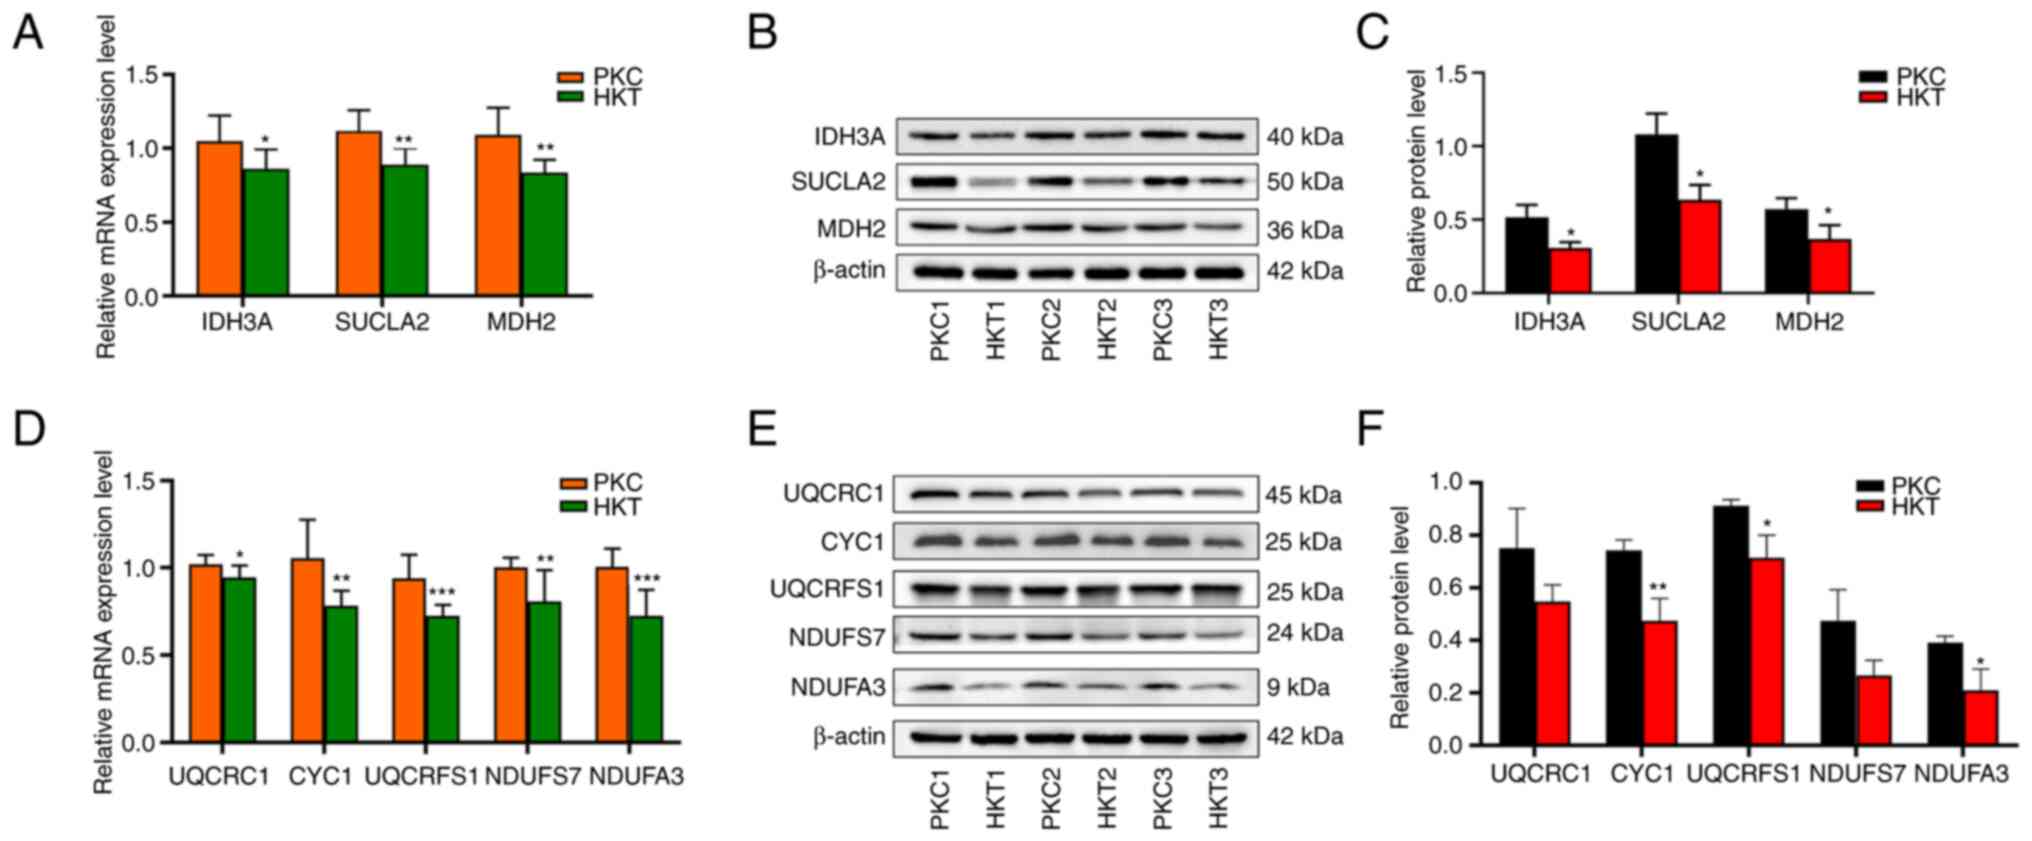 | Figure 5After 30 days of hypoxia treatment,
the expression levels of key genes and their encoded proteins in
the TCA cycle and OXPHOS pathways are downregulated. (A) mRNA
expression, (B) protein expression and (C) protein quantification
of IDH3A, SUCLA2 and MDH2 genes in the TCA
cycle pathway, with β-actin as the standard. (D) mRNA expression,
(E) protein expression and (F) protein quantification of UQCRC1,
CYC1, UQCRFS1, NDUFS7 and NDUFA3 genes in the OXPHOS
pathway, with β-actin as the standard. Compared with the PKC group,
*P<0.05, **P<0.01 and
***P<0.001 (n=3). PKC, plain normoxia group; HKT,
plateau hypoxia group; OXPHOS, oxidative phosphorylation; TCA,
tricarboxylic acid. |
The results of the transcriptome sequencing showed
that there were 53 molecular subunits differentially expressed in
the mitochondrial electron transport chain (ETC), and the range of
log2FC of these differential molecular subunits
was-0.25-3.89 (Table SIII). In
the present study, UQCRC1, CYC1, UQCRFS1,
NDUFS7 and NDUFA3 genes in the OXPHOS pathway were
selected for validation using RT-qPCR and western blotting. RT-qPCR
results showed that hypoxic exposure significantly reduced the mRNA
expression of UQCRC1 (P<0.05), CYC1 (P<0.01),
UQCRFS1 (P<0.001), NDUFS7 (P<0.01) and
NDUFA3 (P<0.001) (Figs.
5D and S1B). Similarly, the
protein levels of UQCRC1, CYC1 (P<0.01), UQCRFS1 (P<0.01),
NDUFS7 and NDUFA3 (P<0.05) were downregulated in the HKT group,
whereas there was no significant downregulation of UQCRC1 and
NDUFS7 between the two mouse groups (Fig. 5E and F). These results suggest that hypoxia
exposure inhibits the TCA cycle and the OXPHOS signalling pathways
(22,23) in mouse kidney tissues (Fig. S2).
Plateau hypoxia stress inhibits energy
metabolism
Energy metabolism is the process by which an
organism produces ATP via the TCA cycle and OXPHOS (15,16,24).
To further investigate whether plateau hypoxia can inhibit energy
metabolism in the organism, metabolomic analysis of kidney tissues
was performed to assess changes in differential metabolites
associated with energy metabolism induced by hypoxic exposure.
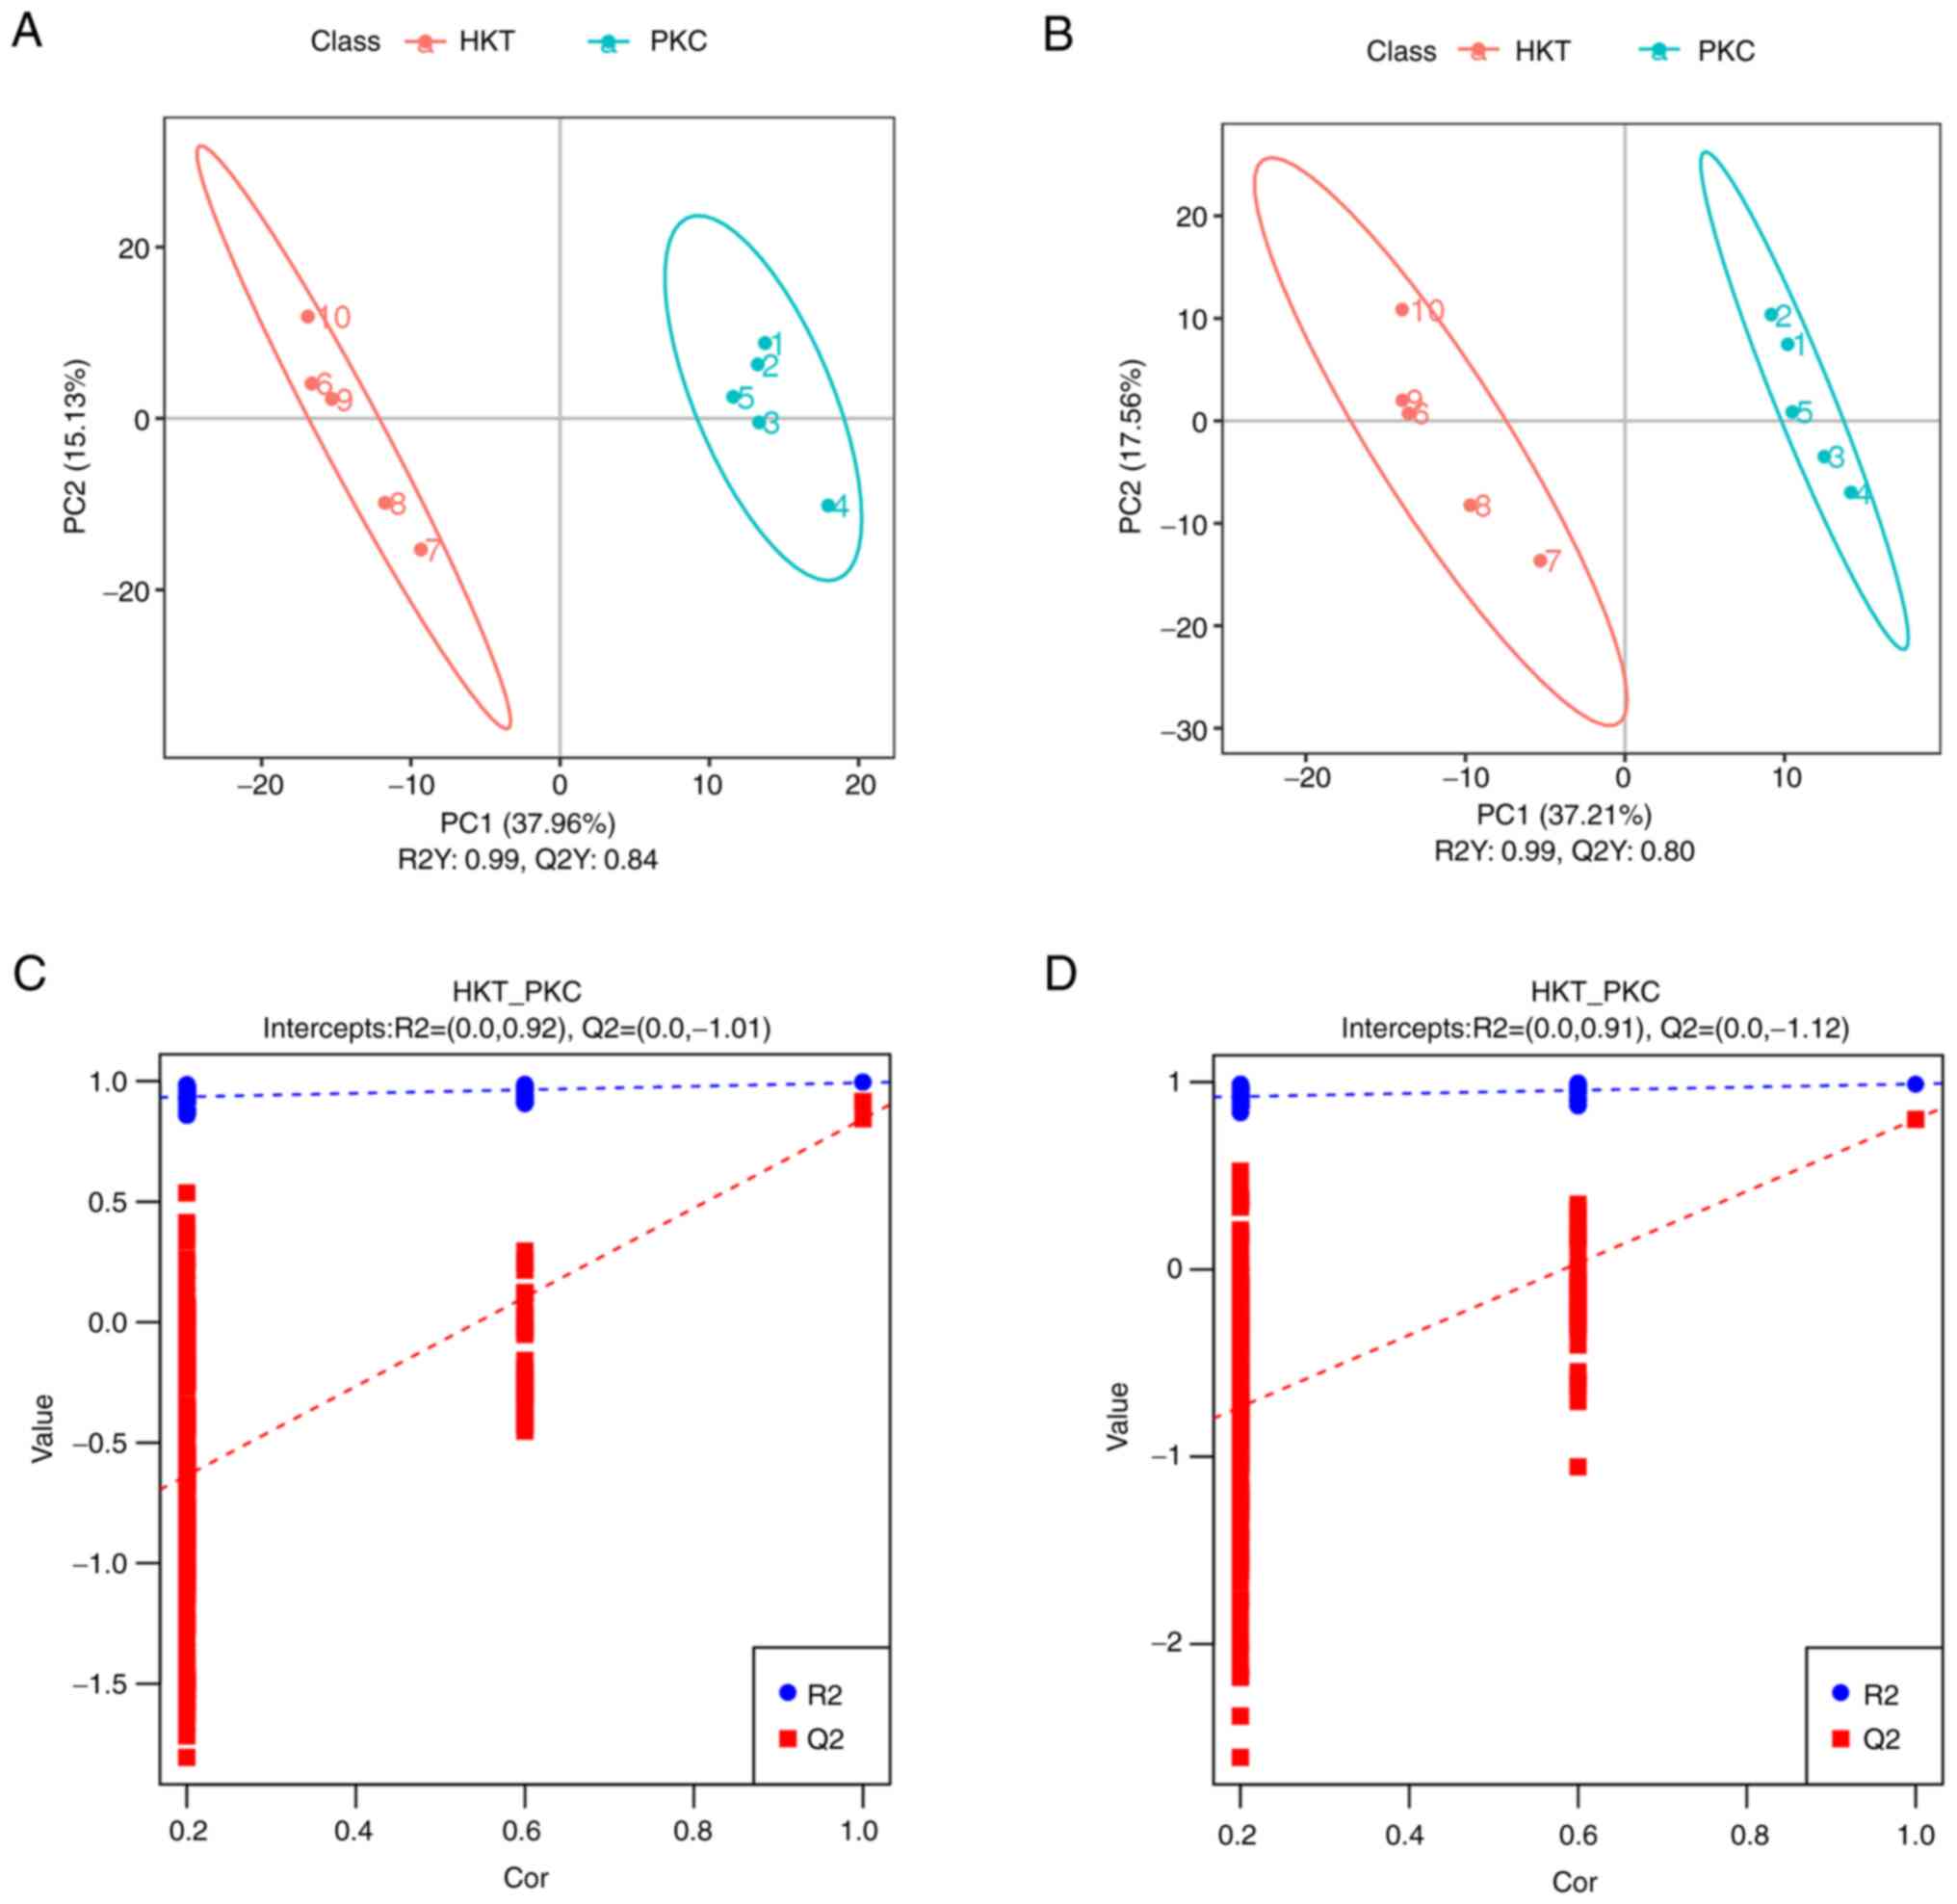
Metabolomics PLS-DA score scatter plots (Fig. 6A and B) showed that samples from the HKT and
PKC groups were significantly separated in both positive and
negative ion modes, with R2Y > Q2Y in both positive and negative
ion modes; in the PLS-DA ranking validation plots (Fig. 6C and D), R2 data in positive and negative
ionization mode were higher than Q2 data, while the intercept of Q2
regression line and Y-axis were <0. These results indicate that
the PLS-DA model has good stability and that there is no
overfitting. Hierarchical clustering analysis of the obtained
differential metabolites in each group revealed that the metabolic
expression patterns in the same comparison group were consistent
and the metabolic expression patterns were significantly separated
between the two groups (Fig.
S3).
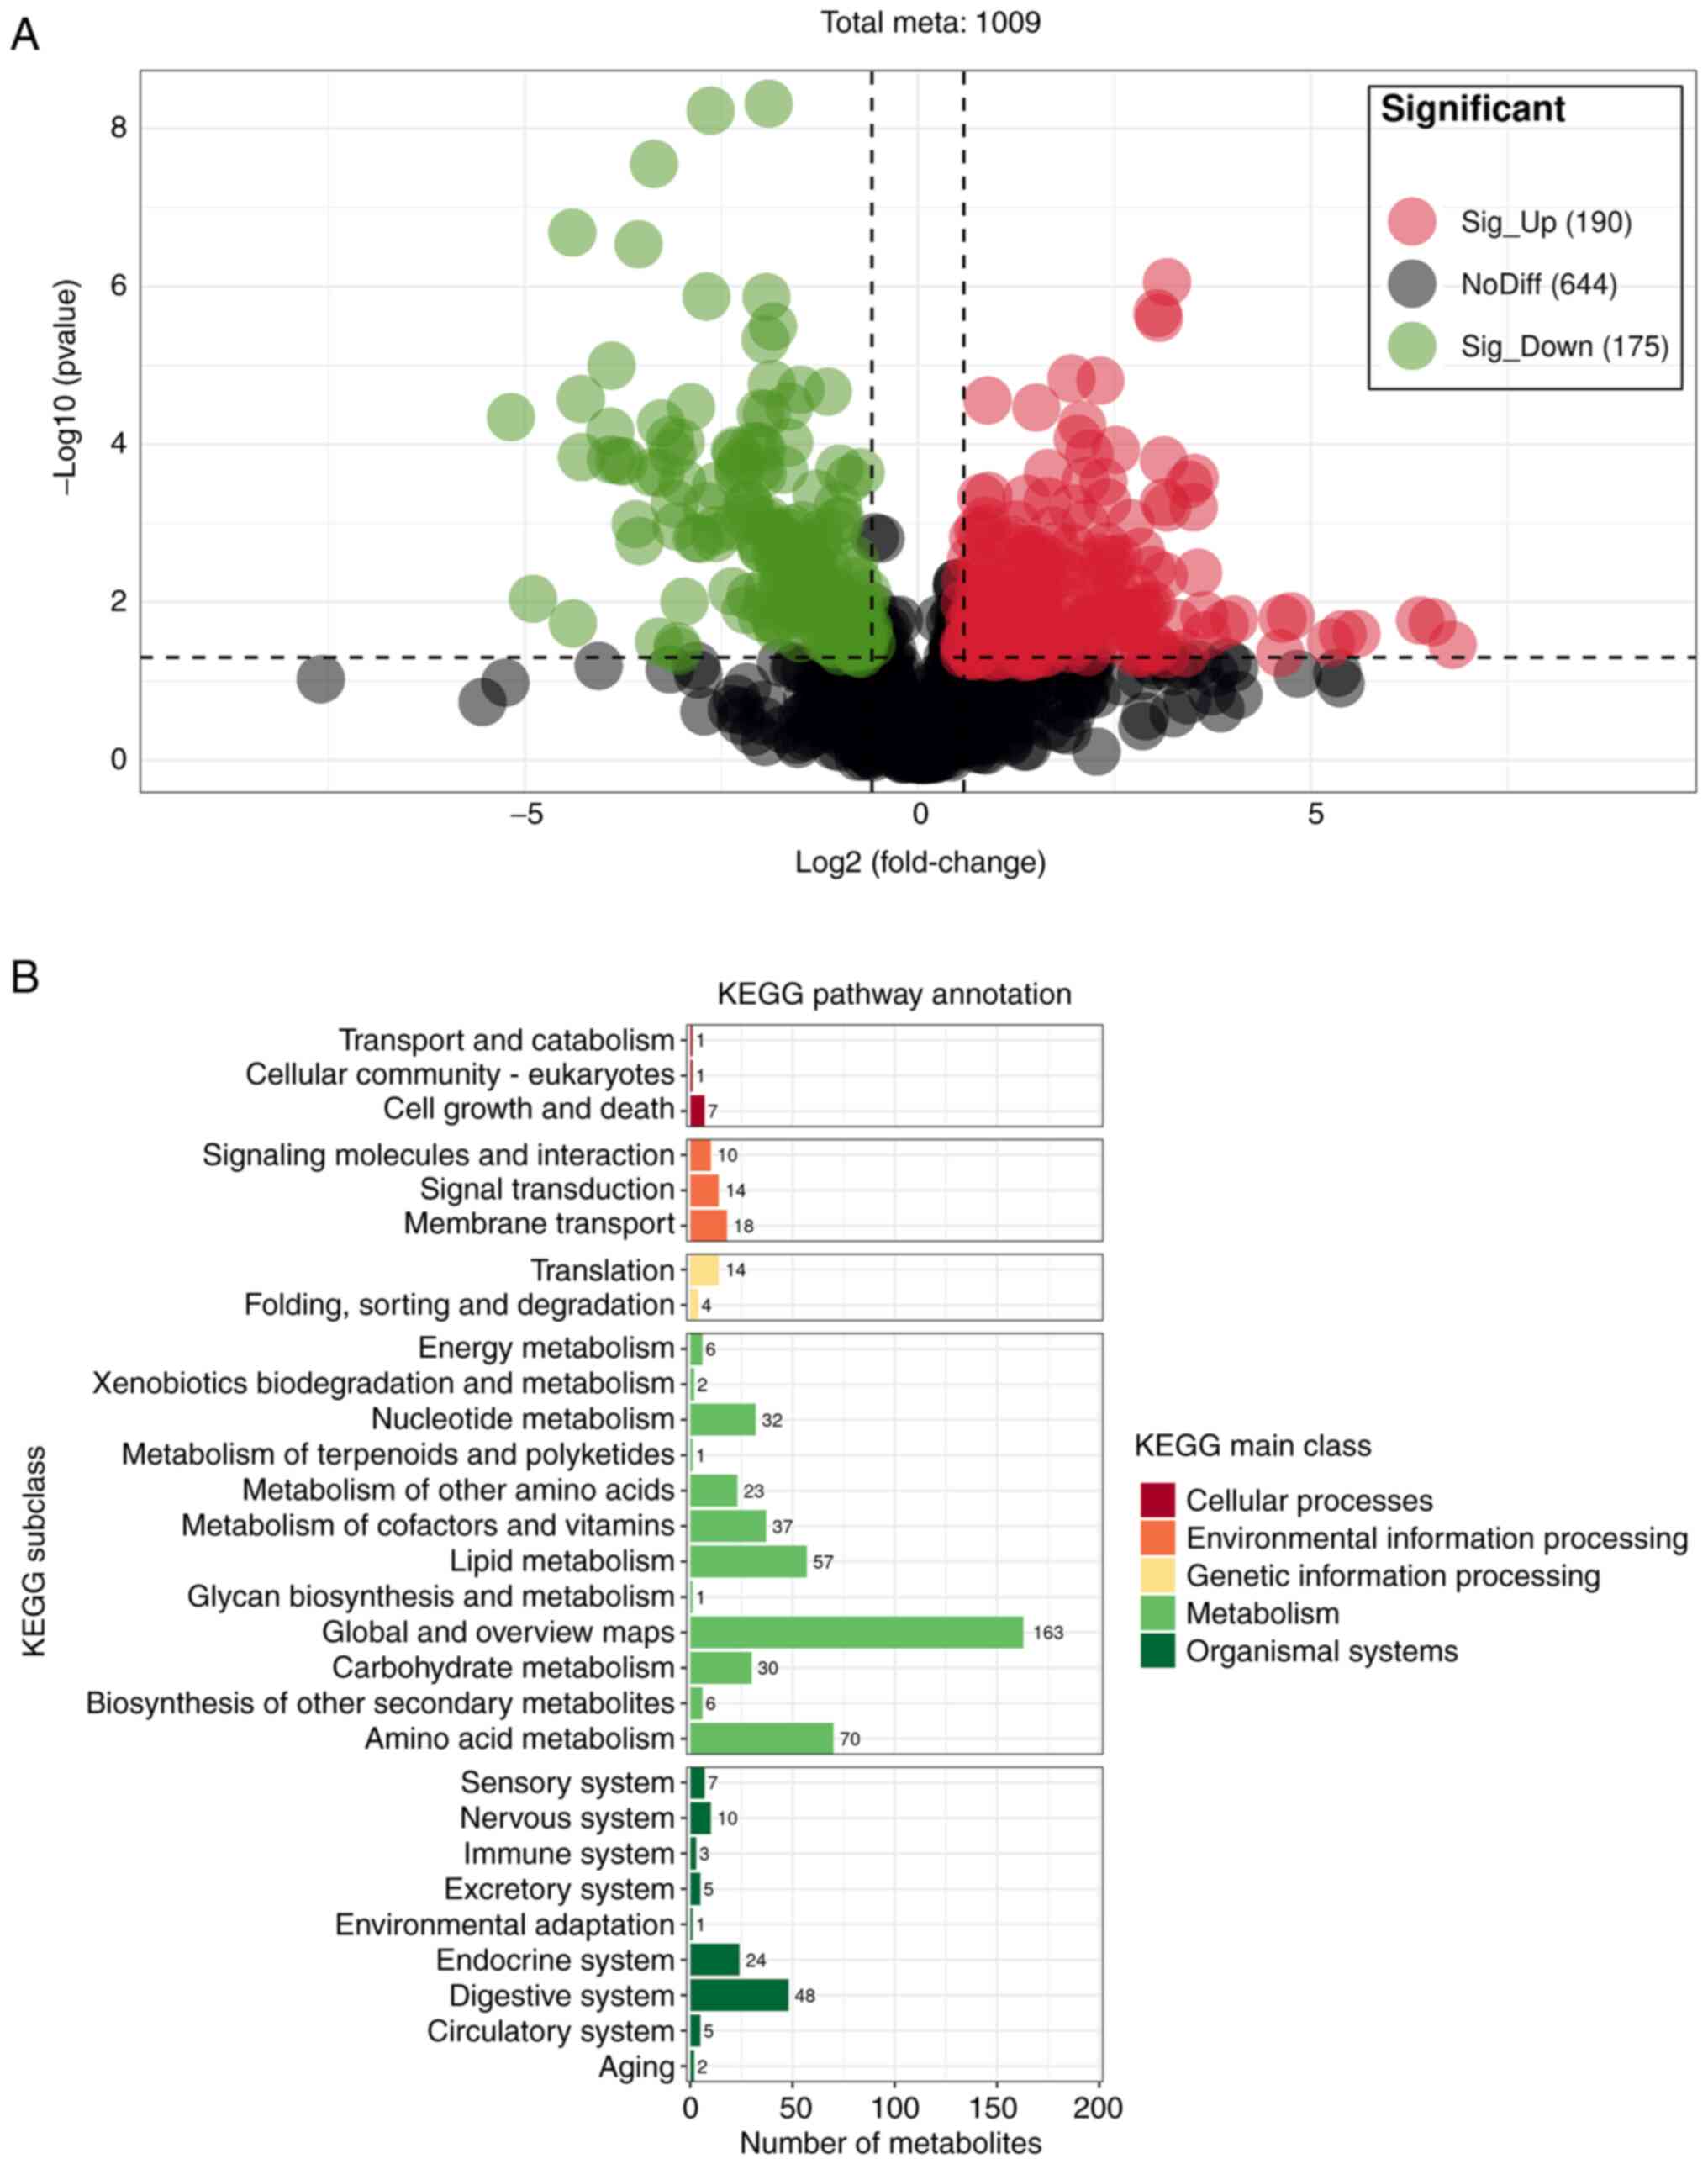
When the differential metabolites detected in the
positive and negative ion models were combined, 365 SDMs
(P<0.05) were detected between the HKT and PKC groups (VIP>1;
P<0.05; Fig. 7A), of which 190
and 175 were significantly upregulated and downregulated,
respectively. In addition, KEGG results revealed that SDMs were
mainly enriched in metabolic processes, such as ‘energy
metabolism’, ‘nucleotide metabolism’, ‘amino acid metabolism’,
‘metabolism of cofactors and vitamins’, ‘lipid metabolism’ and
‘carbohydrate metabolism’ (Fig.
7B). SDMs were primarily annotated in the HMDB database with
‘organic acids and derivatives’, and ‘lipids and lipid-like
molecules’ (Fig. S4). The results
annotated by Lipid MAPS show that SDMs are mainly enriched in
‘fatty acids and conjugates’, ‘eicosanoids’, ‘fatty esters’ of
fatty acyls, glycosides in glycerophospholipids and ‘flavonoids’ of
polyketides (Fig. S5).
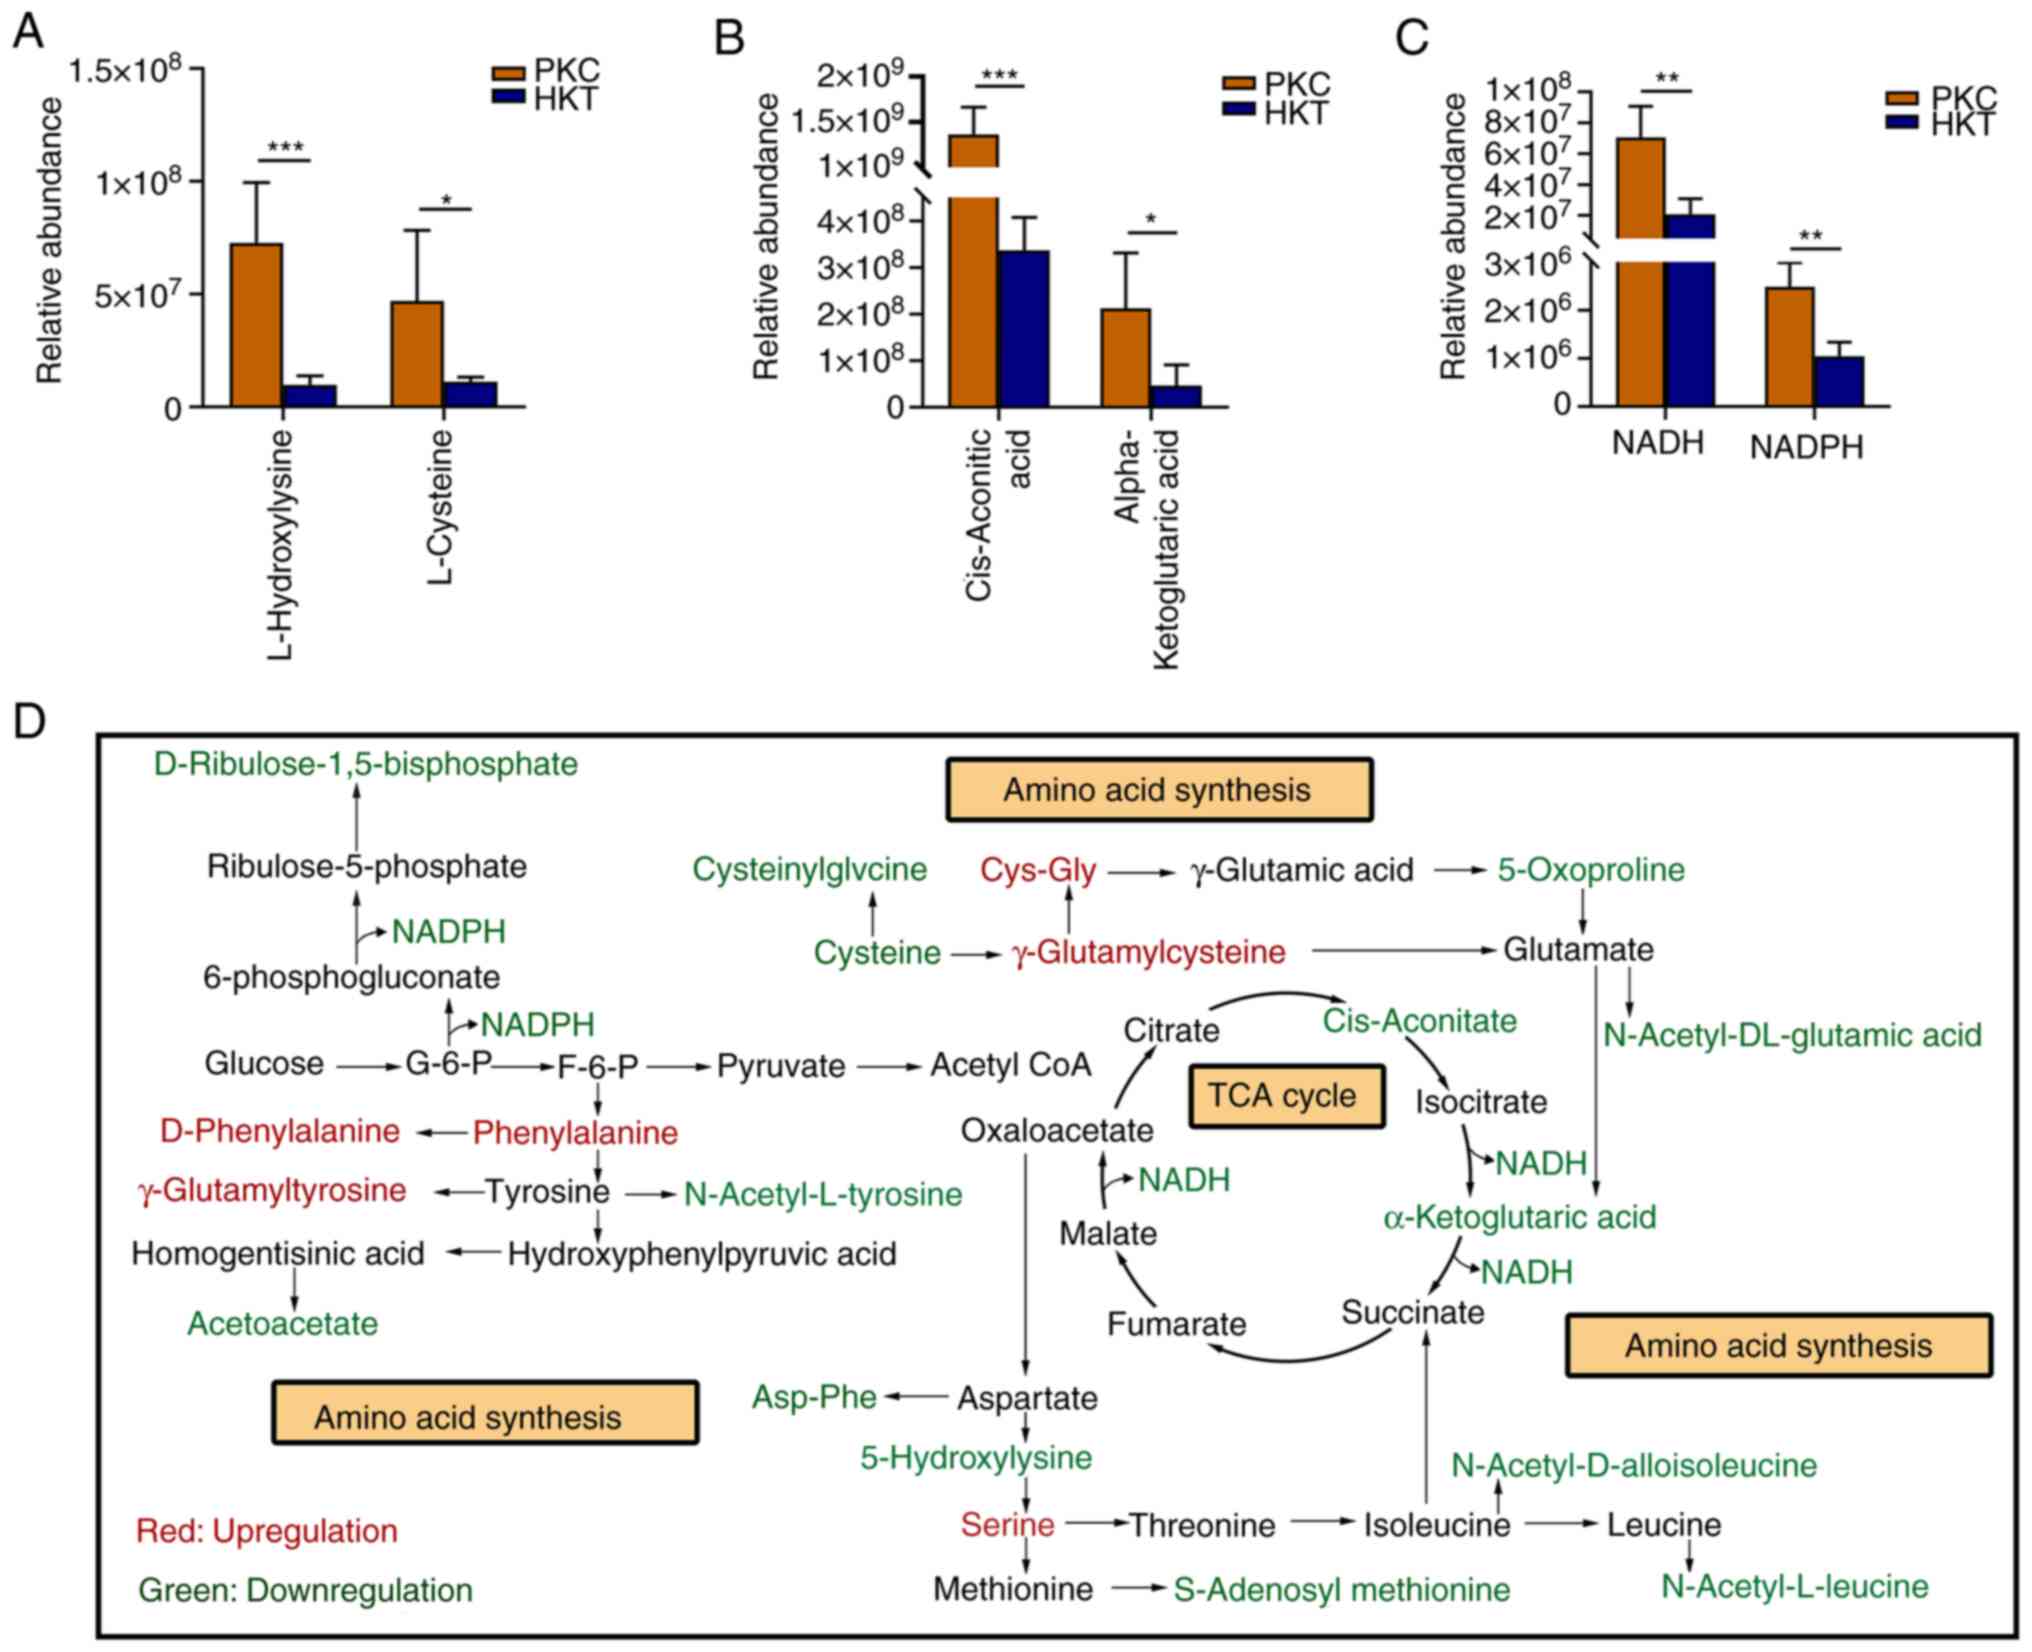
The metabolomic results showed that most amino acids
in the kidney tissues of mice in the HKT group were significantly
downregulated compared with those in the PKC group, with
L-hydroxylysine and L-cysteine significantly decreased by 86.48%
(P<0.001) and 76.21% (P<0.05), respectively (Fig. 8A). In addition, Asp-Phe,
N-acetyl-L-leucine, S-adenosyl-L-methionine, N-acetyl valine,
N-acetyl glycine and 5-oxoproline levels decreased by >41.44%
compared with those in the PKC group (Table SIV). Among these significantly
decreased amino acids, some participate in the central carbon
metabolism of the organism and thus in the TCA cycle (Fig. 8D). Further analysis of the
metabolomic data revealed that cis-aconitic acid and
α-ketoglutarate, which are involved in the TCA cycle, were
significantly reduced by 67.98% (P<0.001) and 78.11%
(P<0.05), respectively, under high-altitude hypoxia exposure
(Fig. 8B). The pentose phosphate
pathway is a mode of glucose oxidative decomposition that provides
multiple raw materials for the synthesis and metabolism of purines
and pyrimidines (Fig. 8D). NADPH
is mainly generated via the pentose phosphate pathway. Although
NADPH cannot directly enter the respiratory linkage to be oxidised,
the H+ in NADPH can be transferred to NAD+
and converted to NADH to enter the electron transport chain to
participate in ATP production. In the current study, NADPH and NADH
levels in the HKT group were significantly decreased by 63.92 and
74.87% (P<0.01 for both), respectively compared with those in
the PKC group (Fig. 8C). These
results indicated that hypoxia exposure inhibits the central hubs
of the three major energy metabolism pathways and suppresses the
synthesis of amino acids and the upstream products of the
mitochondrial electron transport chain.
After 30 days of hypoxic exposure, the metabolism of
purine and pyrimidine in the kidney tissues of the mice changed
(Fig. 9A). In purine metabolism,
the concentrations of GDP, GMP, guanine, ADP, adenine,
deoxyadenosine and xanthosine monophosphate (XMP) were
downregulated in the kidney tissues of mice in the HKT group
compared with those in the PKC group, with a significant decrease
of >41.86% (P<0.05) in adenine, deoxyadenosine and XMP
(Fig. 9B; Table SV). In terms of pyrimidine
metabolism, the concentrations of dCDP, thymidine, thymine, UDP,
UMP, CTP and CDP were downregulated in the kidney tissues of mice
in the HKT group, among which the concentrations of thymidine,
thymine, and UDP were significantly downregulated by 44.59%
(P<0.01), 44.03% (P<0.05) and 69.31% (P<0.01),
respectively (Fig. 9B; Table SV). These results suggest that
exposure to hypoxia disrupts nucleotide synthesis. To assess the
consistency of metabolite and metabolite trends, Pearson's
correlation coefficient of metabolites involved in amino and
nucleotide synthesis revealed that the correlations were all
positive (Fig. S6). The
aforementioned results further show that the energy metabolism of
mouse kidney tissue is inhibited in a hypoxic environment.
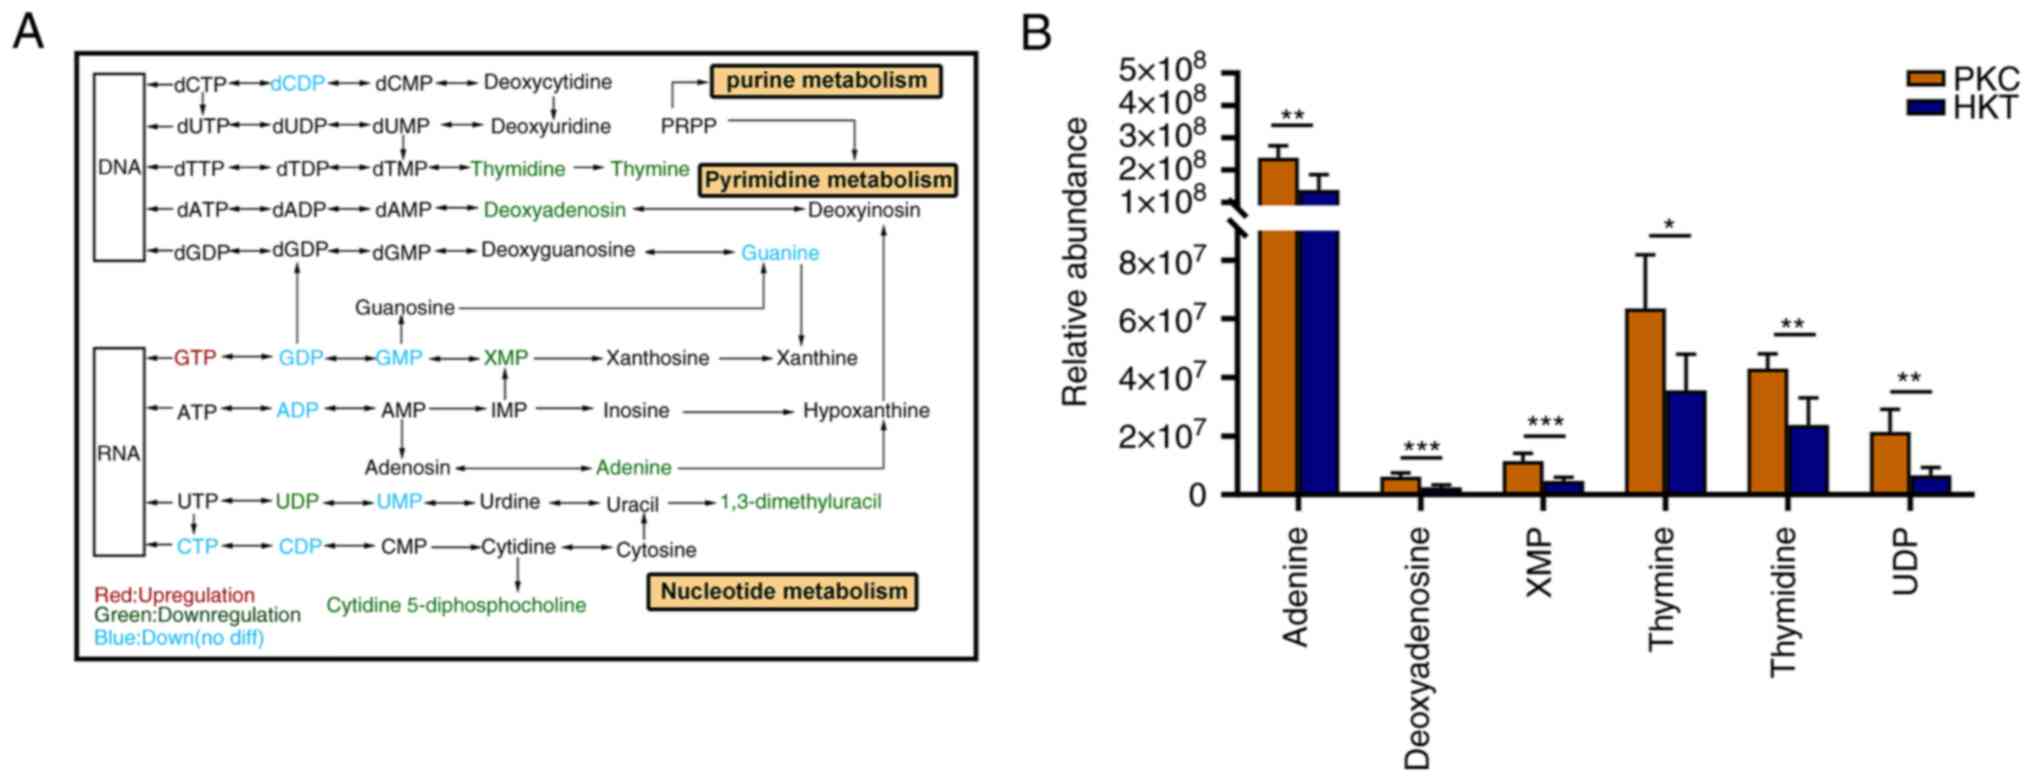 | Figure 9After 30 days of hypoxic exposure,
compared with the PKC group, the nucleotide metabolism in the
kidney tissue of the HKT group is disordered. (A) The most relevant
metabolites that are disrupted by hypoxic exposure in purine and
pyrimidine metabolism, in which hypoxia exposure inhibits
nucleotide synthesis. (B) Downregulation of concentration of
adenine, deoxyadenosine, XMP, thymidine, thymine and UDP in the
kidney of mice in the hypoxia treatment group. Data are expressed
as mean ± standard deviation (n=3). Compared with the PKC group,
*P<0.05, **P<0.01 and
***P<0.001. PKC, plain normoxia group; HKT, plateau
hypoxia group. |
Hypoxia exposure induces inflammatory
reactions in histiocytes
Impaired energy metabolism leads to decreased
production of adenosine triphosphate and increased production of
free radicals, exacerbating the inflammatory response (25). To further explore the mechanism of
inflammatory reactions induced by hypoxia exposure in mouse kidney
tissues, a cross-analysis was conducted between DEGs and IRGs,
indicating that 113 genes were DE-IRGs (Fig. 10A). A total of eight DEGs in the
TCA cycle and the OXPHOS signalling pathways were defined as energy
metabolism-related differential genes (ER-DEGs). Results showed
that the correlation between DE-IRGs and ER-DEGs was either
positive or negative, and there were more negatively than
positively correlated genes (Fig.
10B). The mRNA and protein expression levels of the DEGs
IL1B, IL12B, S100A8 and S100A9 were
subsequently verified by RT-qPCR and western blotting. The results
showed that the mRNA and protein expression of IL1B,
IL12B and S100A9 were significantly upregulated
(P<0.05). The mRNA expression of S100A8 was significantly
upregulated (P<0.0001); however, its protein expression was not
significantly different (Fig.
10D-F). Pearson's correlation coefficients of inflammatory
factors IL1B, IL12B, S100A8 and S100A9
with ER-DEGs revealed negative correlations (Fig. 10C), indicating that downregulated
expression of ER-DEGs promoted the expression of the inflammatory
factors IL1B, IL12B, S100A8 and S100A9,
and induced an inflammatory response. These results further suggest
that energy metabolism inhibition influences inflammation in the
kidney tissues of mice.
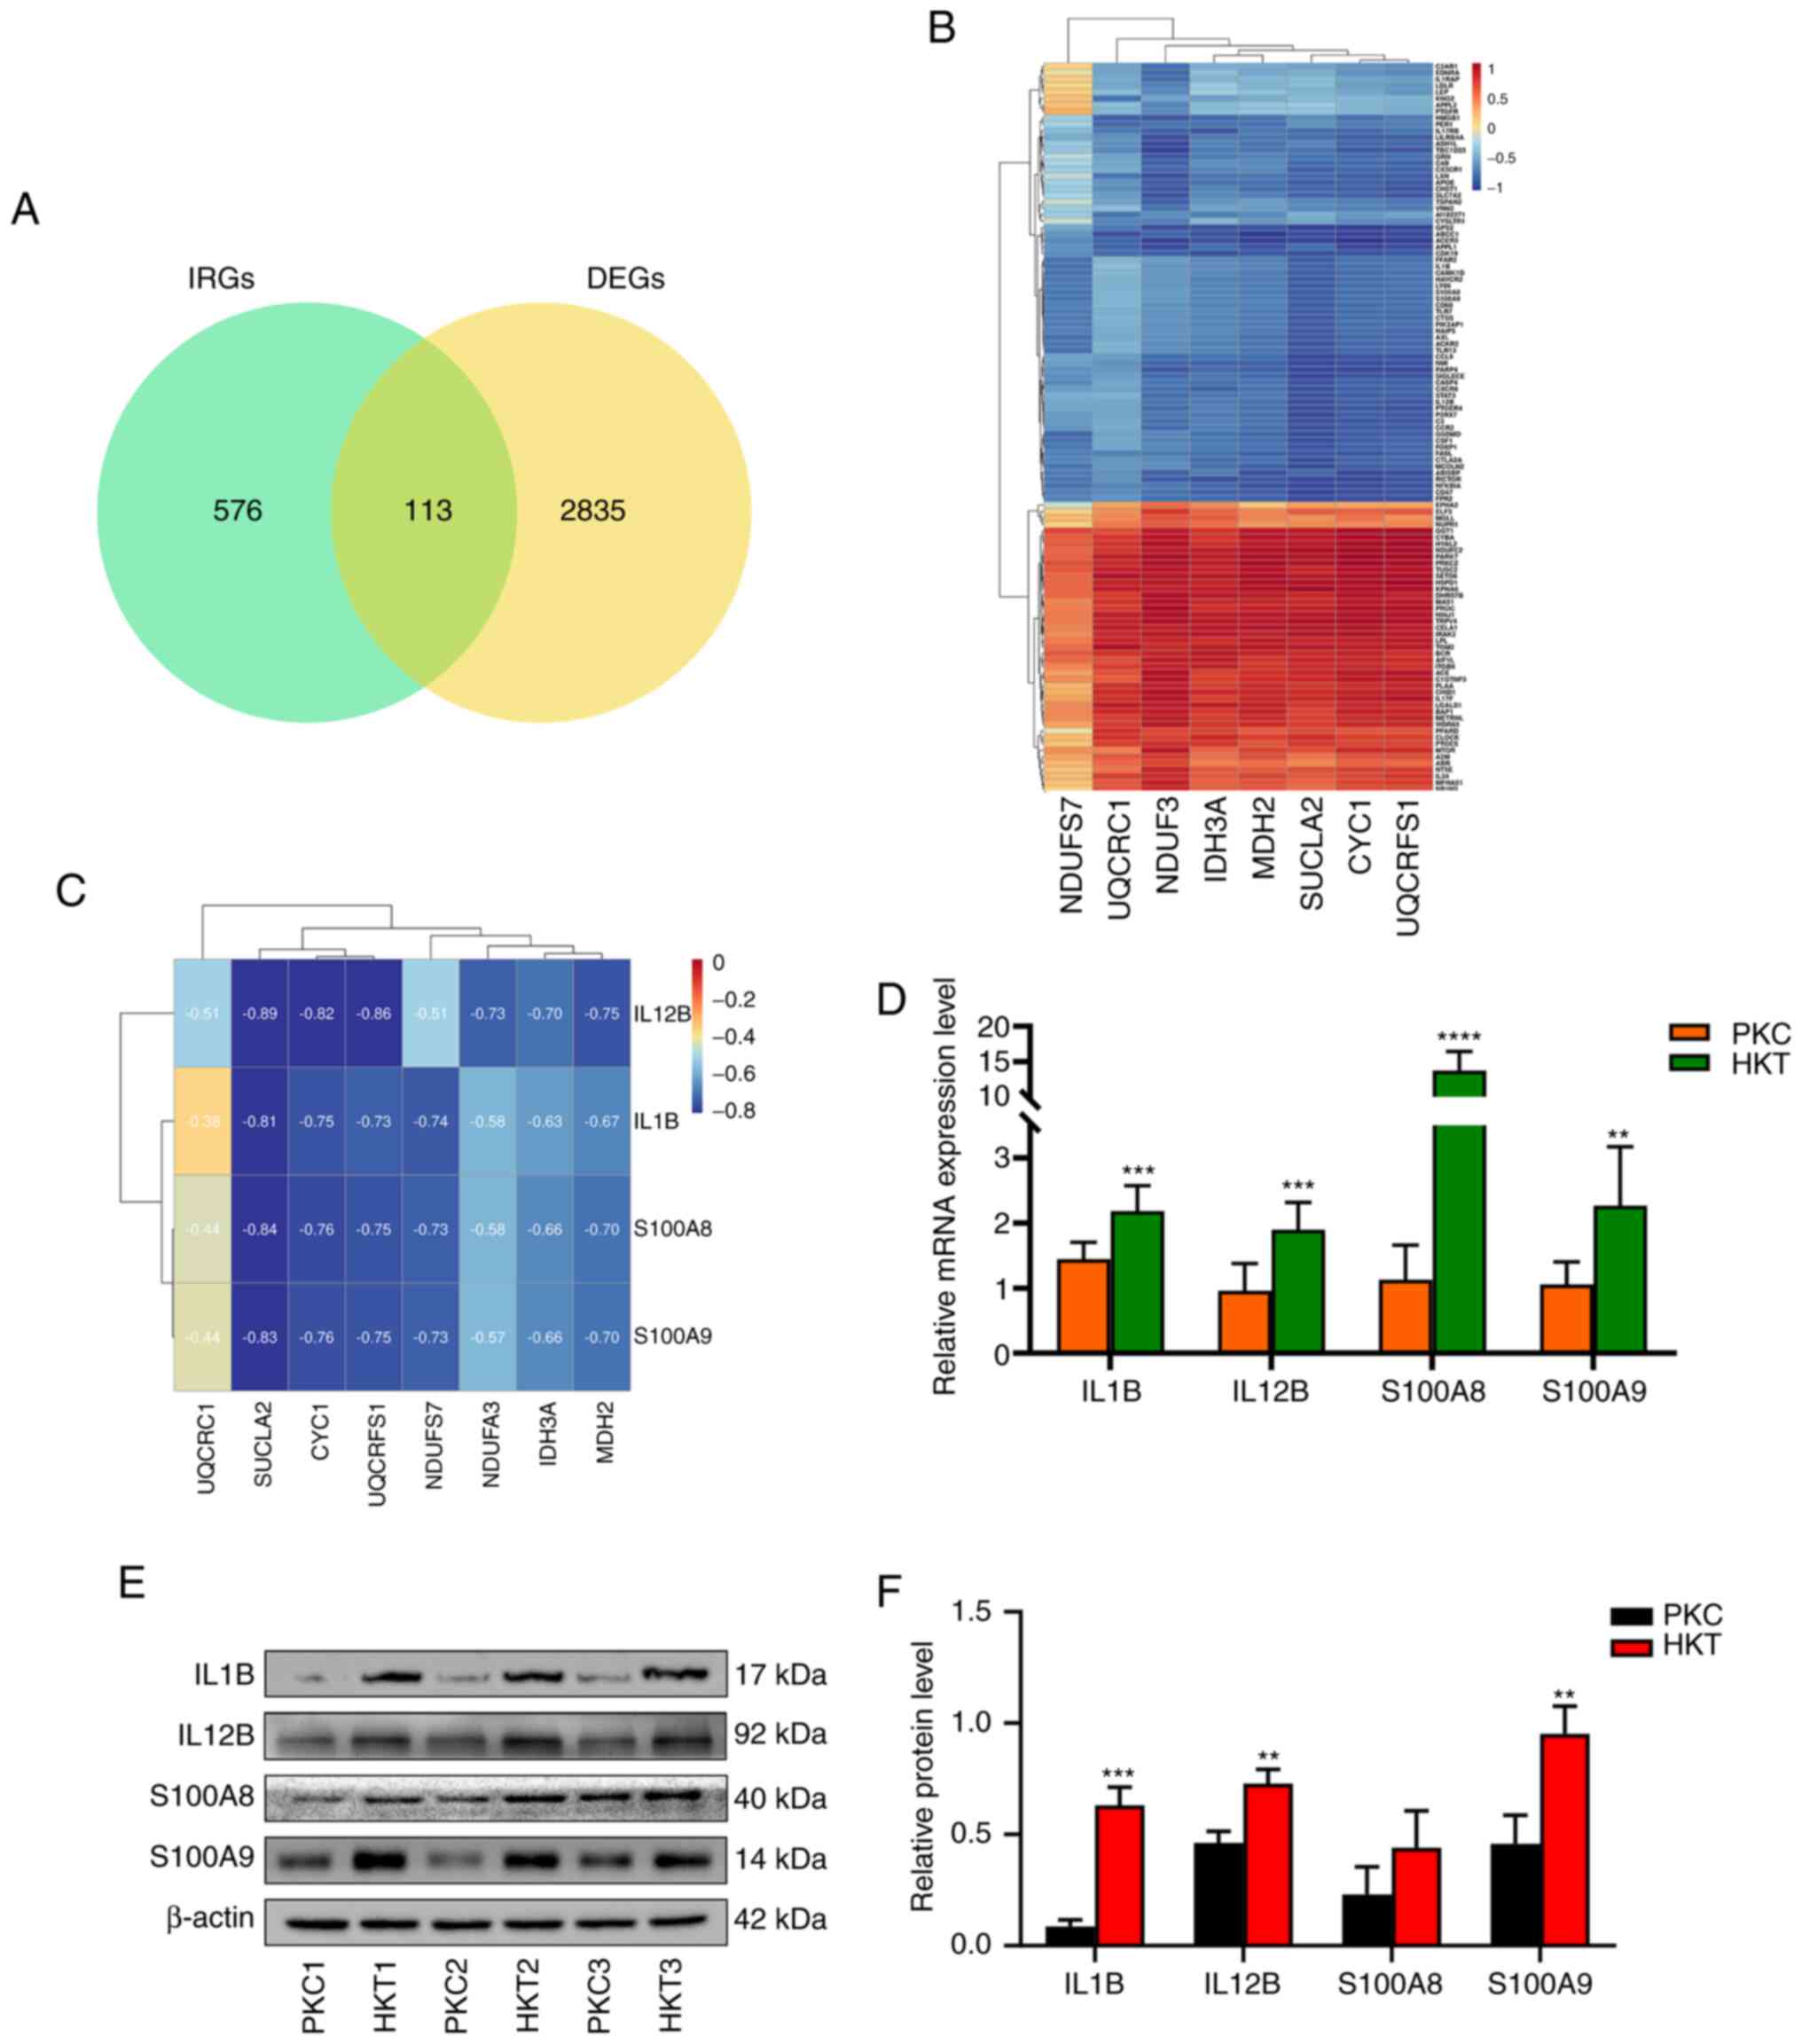 | Figure 10Correlation analysis of ER-DEGs and
inflammatory factors and expression of inflammatory factors. (A)
Venn diagram of DE-IRGs and a total of 113 DE-IRGs were identified;
(B) Correlation analysis between ER-DEGs and DE-IRGs, there is a
positive or negative correlation between ER-DEGs and DE-IRGs; (C)
The correlation analysis between ER-DEGs and inflammatory factors
IL1B, IL12B, S100A8 and S100A9 was negatively correlated. (D) mRNA
expression, (E) protein expression and (F) protein quantification
of inflammatory factors IL1B, IL12B, S100A8 and S100A9 genes were
upregulated, with β-actin as the standard. Data were expressed as
mean ± standard deviation (n=3). Compared with the PKC group,
**P<0.01, ***P<0.001 and
****P<0.0001. PKC, plain normoxia group; HKT, plateau
hypoxia group; DE-IRGs, differential inflammation-related genes;
ER-DEGs, energy metabolism-related differential genes. |
Discussion
In the current study, C57BL/6 mice were maintained
at an altitude of 4,200 m in Maduo, China to construct a plateau
hypoxia animal model. Transcriptomic sequencing and non-targeted
metabolomics were used to detect and analyse DEGs and SDMs in the
kidneys of PKC and HKT mice. The mechanism by which hypoxia
inhibits energy metabolism and leads to kidney inflammation in mice
was investigated. Under normoxic conditions, HIF-1α is
degraded by prolyl hydroxylase, which uses oxygen as a substrate.
Therefore, hypoxia inhibits HIF-1α prolyl hydroxylation and
upregulates the expression of HIF-1α, which regulates
adaptation to hypoxic environments (26). In the current study, the mRNA and
protein expression levels of HIF-1α in the HKT group were
significantly upregulated compared with those in the PKC group,
indicating that the hypoxic animal model was successfully
established. Changes in body mass and organ index are important
health indicators. Therefore, the kidney and body mass of mice were
further measured, and it was found that they were both
significantly decreased, and the kidney index was also decreased.
H&E staining results showed that the HKT group displayed
obvious kidney damage, including glomerular atrophy and
deformation, irregular arrangement of tubular epithelial cells,
swelling of some tubular epithelial cells, exudation of
erythrocytes and denucleation of some cells compared with the PKC
group. These results suggest that exposure to hypoxia leads to
significant changes in the kidney tissues of mice.
To clarify the key pathways and genes that induce
alterations in the kidney under hypoxic stimulation, DEGs were
enriched for KEGG pathways and KEGG results of mouse kidney tissue
transcriptomic analysis showed that metabolism-related pathways,
such as ‘OXPHOS’, ‘TCA cycle’, ‘peroxisome’, ‘thermogenesis’ and
‘carbon’ metabolism signalling pathways, were significantly
enriched. Energy metabolism is the process of generating ATP
through OXPHOS and the TCA cycle. Therefore, the mechanism of
hypoxic exposure on the TCA cycle and OXPHOS signalling pathways
was further investigated. A previous study showed that IDH3
is an NAD+-dependent heterotetrameric enzyme that
irreversibly catalyses the conversion of isocitrate (ICT) to
α-ketoglutarate (AKG) (27). The
conversion of ICT to AKG is necessary for the TCA cycle and the
production of NADH during OXPHOS for ATP generation (28). Succinyl coenzyme A synthase (SCS)
is a TCA cycle enzyme responsible for the conversion of succinyl
coenzyme A to succinic acid in the mitochondrial matrix and is
coupled with phosphorylation of GDP or ADP, thus providing the only
‘substrate level’ phosphorylation in the TCA cycle (29). SUCLA2 encodes an
ADP-specific β-subunit subtype of SCS (30) and its downregulation inhibits
mitochondrial respiratory activity (31). Malate dehydrogenase 2 (MDH2)
catalyses the reversible reduction of oxaloacetate to l-malate
depending on NAD+ (32). MDH2 deficiency limits the flux of
pyruvate to complex I of the mitochondrial electron transport
chain, thereby reducing complex I-dependent respiration (33). By contrast, MDH2 deficiency
interrupts the TCA cycle and mitochondrial NADH levels, resulting
in an inadequate energy supply (34). In the present study, hypoxic
exposure significantly reduced the mRNA and protein expression of
IDH3A, SUCLA2 and MDH2 in the TCA cycle. It is
suggested that the hypoxic plateau environment inhibits the TCA
cycle and suppresses ATP production in the mouse kidney.
The OXPHOS system of the mitochondrial inner
membrane consists of five enzymes [complexes I-V (cI-V)] (35,36),
and the RNA-seq results showed that several molecular subunits in
cI and cIII in the mitochondrial ETC were significantly
downregulated under hypoxic exposure, suggesting that hypoxic
stress may lead to changes in mitochondrial function. Mitochondrial
respiratory chain complex I (cI, NADH-ubiquinone reductase/NADH
dehydrogenase) is the main entrance of the mitochondrial
respiratory chain, which accepts the electron transfer of NADH to
ubiquinone and couples with the proton pump, thus providing proton
power to ATP synthase for the production of ATP (36,37).
cI is the largest ETC enzyme and consists of 45 subunits (38). NDUFA3 is required for the
assembly and/or stabilisation of the cI matrix arm in human
mitochondria, and NDUFA3 is necessary for the formation of
functional cI (39). NDUFS7
is one of the subunits of iron-sulphur proteins in cI, which is
involved in the transfer of electrons in the respiratory chain and
is the catalytic centre of electron flow in cI (40). NDUFS7 subunits are essential
for maintaining cI activity, and their degradation leads to a
decrease in cI activity (41). The
data of the current study showed that NDUFA3 and
NDUFS7 are downregulated in mouse kidney tissues exposed to
hypoxic conditions, indicating that exposure of the organism to
chronic hypoxia leads to decreased stability and activity of cI,
which inhibits the function of the mitochondrial ETC and energy
production.
In the current study, it was found that hypoxia
exposure downregulated the mRNA and protein expression of
UQCRC1, CYC1 and UQCRFS1 subunits in cIII. The
assembly of 10 subunits encoded by nuclear DNA and one subunit
encoded by mitochondrial DNA generates functional cIII, which
transfers electrons from ubiquinol to cytochrome c (42). UQCRFS1 is a protein containing the
Fe/S cluster, which is the last component inserted into cIII. The
insertion of UQCRFS1 is essential for the stable formation
of cIII (43), while its mutation
is a causative factor of cIII deficiency (44). UQCRC1 is a key component of
cIII in the mitochondrial respiratory chain. UQCRFS1 is
notably upregulated in UQCRC1-overexpressing cells.
UQCRC1 overexpression leads to increased mitochondrial
OXPHOS and ATP production (45).
Downregulation of UQCRC1 promotes mitochondrial membrane
potential collapse by increasing ROS production, thereby impairing
mitochondrial function and affecting energy metabolism (46). Dysfunction of UQCRC1 and
UQCRFS1 is associated with reduced cIII and brain
mitochondrial content (47). In
addition, CYC1 is one of the component subunits of
mitochondrial cIII. Downregulation of CYC1 decreases
mitochondrial cIII activity and increases the ratio of AMP to ATP
(48). Based on these findings, it
is suggested that hypoxia exposure disrupts mitochondrial function
and inhibits energy metabolism.
To further confirm that hypoxic exposure inhibits
energy metabolism, we performed a non-targeted metabolomic analysis
of the kidney. A total of 365 SDMs were identified by non-targeted
metabolomics in positive and negative ion modes. KEGG results
showed that SDMs were mainly enriched in metabolic processes, such
as ‘energy metabolism’, ‘nucleotide metabolism’, ‘amino acid
metabolism’, ‘cofactor and vitamin metabolism’, ‘lipid metabolism’
and ‘carbohydrate metabolism’. This indicates that plateau hypoxic
stress alters energy metabolism. Cis-aconitate and α-ketoglutarate
are key intermediate metabolites of the TCA cycle. In the present
study, hypoxic exposure reduced the concentrations of cis-aconitic
acid and α-ketoglutarate, confirming that hypoxic stress inhibits
the TCA cycle. Inhibition of the TCA cycle inevitably reduces the
efficiency of electron transfer to ubiquinone, thereby inhibiting
the energy metabolism of OXPHOS. NADH and NADPH are involved in
numerous biological reactions as electron carriers (49). NADH is mainly involved in energy
metabolism through glycolysis and OXPHOS for ATP production,
whereas NADPH is used to maintain redox homeostasis and nucleotide
biosynthesis (50,51). The results of the present study
showed that the concentrations of NADH and NADPH in the HKT group
were significantly lower than those in the PKC group, indicating
that hypoxic exposure inhibited the electron transfer process of
OXPHOS and suppressed energy metabolism. Due to this inhibition of
energy metabolism, the synthesis of amino acids, nucleotides, and
other nutrients is bound to decrease, which may inhibit various
biological reactions and ultimately affect cell growth (52). In the current study, the
concentrations of most amino acids, pyrimidines and purines in the
kidney tissues of mice were significantly downregulated under
hypoxic exposure.
Inhibition of energy metabolism can lead to
inflammation. cI and III are generally considered the main sites of
ROS production (53). Impaired
mitochondrial respiratory chain complexes may lead to reduced ATP
synthesis and increased ROS production (54), which increases the inflammatory
response (55). Therefore, to
further investigate the mechanism of the inflammatory response
caused by the inhibition of energy metabolism, 113 DE-IRGs were
identified by analysing the inflammatory response database. It was
found that the correlation between DE-IRGs and ER-DEGs was either
positive or negative, and the number of negatively correlated genes
was greater than that of positively correlated genes. These results
suggest that ER-DEG may play a role in the development of renal
inflammatory response stimulated by hypoxia. A previous study
showed that IDH1 and IDH2 mRNA expression is notably
reduced in the skin surrounding hidradenitis suppurativa lesions
(56). Deletion of SUCLA2
leads to TCA circulatory failure, mitochondrial DNA depletion and
fatal childhood encephalomyopathy (57). In addition, MDH2 silencing
promotes ovarian cancer cell proliferation in vitro and
in vivo (58). Microglia
U90926 directly binds to MDH2 and competitively reduces
MDH2-mediated CXCL2 mRNA degradation, thereby
promoting neutrophil infiltration (59). NDUFA3 and NDUFS7 may
play important roles in regulating oxidative stress, apoptosis, and
inflammatory responses during cerebral ischaemia-reperfusion
(60). Based on the aforementioned
results, the mRNA and protein expression of the inflammatory
factors IL1B, IL12B, S100A8 and S100A9
was verified. The results showed that IL1B, IL12B,
S100A8 and S100A9 were upregulated. It has been
suggested that inhibition of energy metabolism induces
inflammation.
The present study provides convincing evidence that
hypoxia exposure inhibits energy metabolism by suppressing the TCA
cycle and OXPHOS pathway, leading to amino acid and nucleotide
deficiencies, and further inducing inflammation. The current study
has several advantages, despite only reporting preliminary data. In
animal experiments, mice were placed in a highland area at an
altitude of 4,200 m to establish animal models to simulate human
exposure in the real world. In addition, the present study applied
multi-omics techniques to comprehensively evaluate biological
changes in the mouse kidney under hypoxic exposure. Transcriptomic
results showed that hypoxic exposure inhibited the TCA cycle and
OXPHOS pathway in the kidney. Non-targeted metabolomics confirmed
that hypoxic exposure inhibited energy metabolism, resulting in a
lack of amino acids and nucleotides. By associating DEGs with the
inflammatory response database, it was found that hypoxic exposure
could induce inflammation. At present, for the treatment of chronic
hypoxia, HIF oxygen-dependent prolyl hydroxylase inhibitor,
sodium-glucose cotransporter 2 inhibitor, antioxidant drugs
melatonin and hydrogen sulphide are mainly used to improve
hypoxia-induced renal inflammation (61). However, the present study has some
limitations. It is difficult to establish a high altitude hypoxia
model, and the sample size is small, hence periodic acid-Schiff,
periodic acid-silver metheramine and immunohistochemical staining
were not used in the early experimental design of the present study
to measure the glomerular injury score and the number of tubular
necrosis. In addition, there is no direct evaluation of the
relationship between metabolites involved in amino acid and
nucleotide synthesis and inflammatory reaction. Moreover, the
conclusions would be more convincing if the genes related to energy
metabolism, which are altered under hypoxic conditions, were
induced to be expressed at high levels or knocked out. The current
study provides new insights into hypoxia-mediated kidney injury,
which will guide future studies about the specific mechanism
through which hypoxia inhibits energy metabolism and induces
inflammation.
Supplementary Material
Liquid chromatography-tandem mass
spectrometry diagrams. (A) Negative ion mode. (B) Positive ion
mode. QC, quality control; CN, negative mode; CP, positive
mode.
Tricarboxylic acid cycle (https://www.genome.jp/pathway/map00020) and oxidative
phosphorylation (https://www.genome.jp/pathway/map00190) signal
pathway diagram. (A) Diagram of Tricarboxylic acid cycle signaling
pathway; (B) Diagram of the oxidative phosphorylation signaling
pathway (22,23). Blue boxes represent downregulated
differential metabolites.
Hierarchical clustering analysis of
significantly different metabolites. (A) Positive ion mode. (B)
Negative ion mode. PKC, plain normoxia group; HKT, plateau hypoxia
group.
HMDB classification notes of
significantly different metabolites. (A) Positive ion mode. (B)
Negative ion mode. HMDB, Human Metabolome Database.
Lipidmaps classification notes of
significantly different metabolites. (A) Positive ion mode. (B)
Negative ion mode.
Pearson's correlation coefficient of
metabolites involved in amino acid synthesis and nucleotide
synthesis.
Inflammation response related genes of
Ensembl database.
Quality of the transcriptome
sequencing.
Differentially expressed genes of
mitochondrial electron transport chain.
Significantly different metabolites
involved in amino acid synthesis in PKC and HKT groups.
Significantly different metabolites
involved in nucleotide synthesis in PKC and HKT groups.
Acknowledgements
Not applicable.
Funding
Funding: The present study was funded by National Natural
Science Foundation of China (grant no. 82060295) and by the Applied
Basic Research Project of Qinghai Province (grant no.
2023-ZJ-771).
Availability of data and materials
The datasets used and/or analyzed during the
current study are available from the corresponding author on
reasonable request. The Illumina sequencing data were deposited in
the Gene Expression Omnibus database (accession no. GSE240049;
https://www.ncbi.nlm.nih.gov/geo/query/acc.cgi?acc=GSE240049).
Authors' contributions
YG carried out the experimental work and wrote the
manuscript. QL designed the experiments. HY carried out
transcriptomics sequencing. YH assisted with transcript expression
assessments. YX performed metabolomics data analysis. CT analyzed
the data of RT-qPCR. CG analyzed the western blotting data. SY
established animal models of hypoxia and normoxicity. YG and SY
confirm the authenticity of all the raw data. All authors read and
approved the final version of the manuscript.
Ethics approval and consent to
participate
Animal experiments were approved by the Animal
Ethics Review Committee of Medical College of Qinghai University
(approval no. 2020-005) and all procedures were carried out in
accordance with the guidelines for the care and use of experimental
animals of the National Institutes of Health.
Patient consent for publication
Not applicable.
Competing interests
The authors declare that they have no competing
interests.
References
|
1
|
Li Y and Zhang Y and Zhang Y: Research
advances in pathogenesis and prophylactic measures of acute high
altitude illness. Respir Med. 145:145–152. 2018.PubMed/NCBI View Article : Google Scholar
|
|
2
|
Gaur P, Prasad S, Kumar B, Sharma SK and
Vats P: High-altitude hypoxia induced reactive oxygen species
generation, signaling, and mitigation approaches. Int J
Biometeorol. 65:601–615. 2021.PubMed/NCBI View Article : Google Scholar
|
|
3
|
Yang S and Lian G: ROS and diseases: Role
in metabolism and energy supply. Mol Cell Biochem. 467:1–12.
2020.PubMed/NCBI View Article : Google Scholar
|
|
4
|
Wilkins MR, Ghofrani HA, Weissmann N,
Aldashev A and Zhao L: Pathophysiology and treatment of
high-altitude pulmonary vascular disease. Circulation. 131:582–590.
2015.PubMed/NCBI View Article : Google Scholar
|
|
5
|
Clark AJ and Parikh SM: Mitochondrial
metabolism in acute kidney injury. Semin Nephrol. 40:101–113.
2020.PubMed/NCBI View Article : Google Scholar
|
|
6
|
Infantino V, Santarsiero A, Convertini P,
Todisco S and Iacobazzi V: Cancer cell metabolism in hypoxia: Role
of HIF-1 as key regulator and therapeutic target. Int J Mol Sci.
22(5703)2021.PubMed/NCBI View Article : Google Scholar
|
|
7
|
Fuhrmann DC and Brüne B: Mitochondrial
composition and function under the control of hypoxia. Redox Biol.
12:208–215. 2017.PubMed/NCBI View Article : Google Scholar
|
|
8
|
Liu X, Du H, Sun Y and Shao L: Role of
abnormal energy metabolism in the progression of chronic kidney
disease and drug intervention. Ren Fail. 44:790–805.
2022.PubMed/NCBI View Article : Google Scholar
|
|
9
|
Cadenas S: Mitochondrial uncoupling, ROS
generation and cardioprotection. Biochim Biophys Acta Bioenerg.
1859:940–950. 2018.PubMed/NCBI View Article : Google Scholar
|
|
10
|
Han Y, Xu X, Tang C, Gao P, Chen X, Xiong
X, Yang M, Yang S, Zhu X, Yuan S, et al: Reactive oxygen species
promote tubular injury in diabetic nephropathy: The role of the
mitochondrial ros-txnip-nlrp3 biological axis. Redox Biol.
16:32–46. 2018.PubMed/NCBI View Article : Google Scholar
|
|
11
|
Palomba H, Castro I, Yu L and Burdmann EA:
The duration of acute kidney injury after cardiac surgery increases
the risk of long-term chronic kidney disease. J Nephrol.
30:567–572. 2017.PubMed/NCBI View Article : Google Scholar
|
|
12
|
Wei J, Zhang J, Wang L, Jiang S, Fu L,
Buggs J and Liu R: New mouse model of chronic kidney disease
transitioned from ischemic acute kidney injury. Am J Physiol Renal
Physiol. 317:F286–F295. 2019.PubMed/NCBI View Article : Google Scholar
|
|
13
|
Zhang X, Agborbesong E and Li X: The role
of mitochondria in acute kidney injury and chronic kidney disease
and its therapeutic potential. Int J Mol Sci.
22(11253)2021.PubMed/NCBI View Article : Google Scholar
|
|
14
|
Jiang M, Bai M, Lei J, Xie Y, Xu S, Jia Z
and Zhang A: Mitochondrial dysfunction and the AKI-to-CKD
transition. Am J Physiol Renal Physiol. 319:F1105–F1116.
2020.PubMed/NCBI View Article : Google Scholar
|
|
15
|
Kang W, Suzuki M, Saito T and Miyado K:
Emerging role of TCA cycle-related enzymes in human diseases. Int J
Mol Sci. 22(13057)2021.PubMed/NCBI View Article : Google Scholar
|
|
16
|
Jourdain AA, Begg BE, Mick E, Shah H,
Calvo SE, Skinner OS, Sharma R, Blue SM, Yeo GW, Burge CB and
Mootha VK: Loss of LUC7L2 and U1 snRNP subunits shifts energy
metabolism from glycolysis to OXPHOS. Mol Cell. 81:1905–1919.e12.
2021.PubMed/NCBI View Article : Google Scholar
|
|
17
|
Fuller GG and Kim JK: Compartmentalization
and metabolic regulation of glycolysis. J Cell Sci.
134(jcs258469)2021.PubMed/NCBI View Article : Google Scholar
|
|
18
|
Livak KJ and Schmittgen TD: Analysis of
relative gene expression data using real-time quantitative PCR and
the 2(-Delta Delta C(T)) method. Methods. 25:402–408.
2001.PubMed/NCBI View Article : Google Scholar
|
|
19
|
Love MI, Huber W and Anders S: Moderated
estimation of fold change and dispersion for RNA-seq data with
DESeq2. Genome Biol. 15(550)2014.PubMed/NCBI View Article : Google Scholar
|
|
20
|
Huss JM and Kelly DP: Nuclear receptor
signaling and cardiac energetics. Circ Res. 95:568–578.
2004.PubMed/NCBI View Article : Google Scholar
|
|
21
|
Zhang Q, Luo P, Chen J, Yang C, Xia F,
Zhang J, Tang H, Liu D, Gu L, Shi Q, et al: Dissection of targeting
molecular mechanisms of aristolochic acid-induced nephrotoxicity
via a combined deconvolution strategy of chemoproteomics and
metabolomics. Int J Biol Sci. 18:2003–2017. 2022.PubMed/NCBI View Article : Google Scholar
|
|
22
|
Kanehisa M: Toward understanding the
origin and evolution of cellular organisms. Protein Sci.
28:1947–1951. 2019.PubMed/NCBI View Article : Google Scholar
|
|
23
|
Kanehisa M, Furumichi M, Sato Y, Kawashima
M and Ishiguro-Watanabe M: KEGG for taxonomy-based analysis of
pathways and genomes. Nucleic Acids Res. 51:D587–D592.
2023.PubMed/NCBI View Article : Google Scholar
|
|
24
|
Nissanka N and Moraes CT: Mitochondrial
DNA damage and reactive oxygen species in neurodegenerative
disease. FEBS Lett. 592:728–742. 2018.PubMed/NCBI View Article : Google Scholar
|
|
25
|
Kan C, Ungelenk L, Lupp A, Dirsch O and
Dahmen U: Ischemia-reperfusion injury in aged livers-the energy
metabolism, inflammatory response, and autophagy. Transplantation.
102:368–377. 2018.PubMed/NCBI View Article : Google Scholar
|
|
26
|
Vallée A, Guillevin R and Vallée JN:
Vasculogenesis and angiogenesis initiation under normoxic
conditions through Wnt/β-catenin pathway in gliomas. Rev Neurosci.
29:71–91. 2018.PubMed/NCBI View Article : Google Scholar
|
|
27
|
May JL, Kouri FM, Hurley LA, Liu J,
Tommasini-Ghelfi S, Ji Y, Gao P, Calvert AE, Lee A, Chandel NS, et
al: IDH3α regulates one-carbon metabolism in glioblastoma. Sci Adv.
5(eaat0456)2019.PubMed/NCBI View Article : Google Scholar
|
|
28
|
Findlay AS, Carter RN, Starbuck B, McKie
L, Nováková K, Budd PS, Keighren MA, Marsh JA, Cross SH, Simon MM,
et al: Mouse Idh3a mutations cause retinal degeneration and reduced
mitochondrial function. Dis Model Mech.
11(dmm036426)2018.PubMed/NCBI View Article : Google Scholar
|
|
29
|
Lambeth DO, Tews KN, Adkins S, Frohlich D
and Milavetz BI: Expression of two succinyl-CoA synthetases with
different nucleotide specificities in mammalian tissues. J Biol
Chem. 279:36621–36624. 2004.PubMed/NCBI View Article : Google Scholar
|
|
30
|
Donti TR, Stromberger C, Ge M, Eldin KW,
Craigen WJ and Graham BH: Screen for abnormal mitochondrial
phenotypes in mouse embryonic stem cells identifies a model for
succinyl-CoA ligase deficiency and mtDNA depletion. Dis Model Mech.
7:271–280. 2014.PubMed/NCBI View Article : Google Scholar
|
|
31
|
Kohno S, Linn P, Nagatani N, Watanabe Y,
Kumar S, Soga T and Takahashi C: Pharmacologically targetable
vulnerability in prostate cancer carrying RB1-SUCLA2 deletion.
Oncogene. 39:5690–5707. 2020.PubMed/NCBI View Article : Google Scholar
|
|
32
|
Shimozawa Y, Himiyama T, Nakamura T and
Nishiya Y: Structural analysis and reaction mechanism of malate
dehydrogenase from Geobacillus stearothermophilus. J Biochem.
170:97–105. 2021.PubMed/NCBI View Article : Google Scholar
|
|
33
|
Gray LR, Tompkins SC and Taylor EB:
Regulation of pyruvate metabolism and human disease. Cell Mol Life
Sci. 71:2577–2604. 2014.PubMed/NCBI View Article : Google Scholar
|
|
34
|
Laemmle A, Steck AL, Schaller A, Kurth S,
Perret Hoigné E, Felser AD, Slavova N, Salvisberg C, Atencio M,
Mochel F, et al: Triheptanoin-novel therapeutic approach for the
ultra-rare disease mitochondrial malate dehydrogenase deficiency.
Mol Genet Metab Rep. 29(100814)2021.PubMed/NCBI View Article : Google Scholar
|
|
35
|
Bergman O and Ben-Shachar D: Mitochondrial
oxidative phosphorylation system (OXPHOS) deficits in
schizophrenia: Possible interactions with cellular processes. Can J
Psychiatry. 61:457–469. 2016.PubMed/NCBI View Article : Google Scholar
|
|
36
|
Haapanen O, Reidelbach M and Sharma V:
Coupling of quinone dynamics to proton pumping in respiratory
complex I. Biochim Biophys Acta Bioenerg.
1861(148287)2020.PubMed/NCBI View Article : Google Scholar
|
|
37
|
Grivennikova VG, Gladyshev GV and
Vinogradov AD: Deactivation of mitochondrial NADH:ubiquinone
oxidoreductase (respiratory complex I): Extrinsically affecting
factors. Biochim Biophys Acta Bioenerg. 1861(148207)2020.PubMed/NCBI View Article : Google Scholar
|
|
38
|
Zhu J, Vinothkumar KR and Hirst J:
Structure of mammalian respiratory complex I. Nature. 536:354–358.
2016.PubMed/NCBI View Article : Google Scholar
|
|
39
|
Rak M and Rustin P: Supernumerary subunits
NDUFA3, NDUFA5 and NDUFA12 are required for the formation of the
extramembrane arm of human mitochondrial complex I. FEBS Lett.
588:1832–1838. 2014.PubMed/NCBI View Article : Google Scholar
|
|
40
|
Mimaki M, Wang X, McKenzie M, Thorburn DR
and Ryan MT: Understanding mitochondrial complex I assembly in
health and disease. Biochim Biophys Acta. 1817:851–862.
2012.PubMed/NCBI View Article : Google Scholar
|
|
41
|
Chen Q, Thompson J, Hu Y, Dean J and
Lesnefsky EJ: Inhibition of the ubiquitous calpains protects
complex I activity and enables improved mitophagy in the heart
following ischemia-reperfusion. Am J Physiol Cell Physiol.
317:C910–C921. 2019.PubMed/NCBI View Article : Google Scholar
|
|
42
|
Heidari E, Rasoulinezhad M, Pak N, Reza
Ashrafi M, Heidari M, Banwell B, Garshasbi M and Reza Tavasoli A:
Defective complex III mitochondrial respiratory chain due to a
novel variant in CYC1 gene masquerades acute demyelinating syndrome
or leber hereditary optic neuropathy. Mitochondrion. 60:12–20.
2021.PubMed/NCBI View Article : Google Scholar
|
|
43
|
Sánchez E, Lobo T, Fox JL, Zeviani M,
Winge DR and Fernández-Vizarra E: LYRM7/MZM1L is a UQCRFS1
chaperone involved in the last steps of mitochondrial complex III
assembly in human cells. Biochim Biophys Acta. 1827:285–293.
2013.PubMed/NCBI View Article : Google Scholar
|
|
44
|
Gusic M, Schottmann G, Feichtinger RG, Du
C, Scholz C, Wagner M, Mayr JA, Lee CY, Yépez VA, Lorenz N, et al:
Bi-allelic UQCRFS1 variants are associated with mitochondrial
complex III deficiency, cardiomyopathy, and alopecia totalis. Am J
Hum Genet. 106:102–111. 2020.PubMed/NCBI View Article : Google Scholar
|
|
45
|
Wang Q, Li M, Gan Y, Jiang S, Qiao J,
Zhang W, Fan Y, Shen Y, Song Y, Meng Z, et al: Mitochondrial
protein UQCRC1 is oncogenic and a potential therapeutic target for
pancreatic cancer. Theranostics. 10:2141–2157. 2020.PubMed/NCBI View Article : Google Scholar
|
|
46
|
Zeng J, Tao J, Xi L, Wang Z and Liu L:
PCSK9 mediates the oxidative low-density lipoprotein-induced
pyroptosis of vascular endothelial cells via the UQCRC1/ROS
pathway. Int J Mol Med. 47(53)2021.PubMed/NCBI View Article : Google Scholar
|
|
47
|
Giannos P, Prokopidis K, Raleigh SM,
Kelaiditi E and Hill M: Altered mitochondrial microenvironment at
the spotlight of musculoskeletal aging and Alzheimer's disease. Sci
Rep. 12(11290)2022.PubMed/NCBI View Article : Google Scholar
|
|
48
|
Han Y, Sun S, Zhao M, Zhang Z, Gong S, Gao
P, Liu J, Zhou J, Ma D, Gao Q and Wu P: CYC1 predicts poor
prognosis in patients with breast cancer. Dis Markers.
2016(3528064)2016.PubMed/NCBI View Article : Google Scholar
|
|
49
|
Oka SI, Hsu CP and Sadoshima J: Regulation
of cell survival and death by pyridine nucleotides. Circ Res.
111:611–627. 2012.PubMed/NCBI View Article : Google Scholar
|
|
50
|
Yang Y and Sauve AA: NAD(+) metabolism:
Bioenergetics, signaling and manipulation for therapy. Biochim
Biophys Acta. 1864:1787–1800. 2016.PubMed/NCBI View Article : Google Scholar
|
|
51
|
Ying W: NAD+/NADH and NADP+/NADPH in
cellular functions and cell death: Regulation and biological
consequences. Antioxid Redox Signal. 10:179–206. 2008.PubMed/NCBI View Article : Google Scholar
|
|
52
|
Shi F, Zhang Z, Wang J, Wang Y, Deng J,
Zeng Y, Zou P, Ling X, Han F, Liu J, et al: Analysis by
metabolomics and transcriptomics for the energy metabolism disorder
and the Aryl hydrocarbon receptor activation in male reproduction
of mice and GC-2spd cells exposed to PM2.5. Front
Endocrinol (Lausanne). 12(807374)2022.PubMed/NCBI View Article : Google Scholar
|
|
53
|
Chouchani ET, Pell VR, James AM, Work LM,
Saeb-Parsy K, Frezza C, Krieg T and Murphy MP: A unifying mechanism
for mitochondrial superoxide production during ischemia-reperfusion
injury. Cell Metab. 23:254–263. 2016.PubMed/NCBI View Article : Google Scholar
|
|
54
|
Baldissera MD, Souza CF, Grings M,
Parmeggiani BS, Leipnitz G, Moreira KLS, da Rocha MIUM, da Veiga
ML, Santos RCV, Stefani LM and Baldisserotto B: Inhibition of the
mitochondrial respiratory chain in gills of Rhamdia quelen
experimentally infected by Pseudomonas aeruginosa: Interplay with
reactive oxygen species. Microb Pathog. 107:349–353.
2017.PubMed/NCBI View Article : Google Scholar
|
|
55
|
Zhao M, Wang Y, Li L, Liu S, Wang C, Yuan
Y, Yang G, Chen Y, Cheng J, Lu Y and Liu J: Mitochondrial ROS
promote mitochondrial dysfunction and inflammation in ischemic
acute kidney injury by disrupting TFAM-mediated mtDNA maintenance.
Theranostics. 11:1845–1863. 2021.PubMed/NCBI View Article : Google Scholar
|
|
56
|
Hessam S, Gambichler T, Skrygan M, Sand M,
Rüddel I, Scholl L and Bechara FG: Reduced ten-eleven translocation
and isocitrate dehydrogenase expression in inflammatory
hidradenitis suppurativa lesions. Eur J Dermatol. 28:449–456.
2018.PubMed/NCBI View Article : Google Scholar
|
|
57
|
Alkhater RA, Ahonen S and Minassian BA:
SUCLA2 Arg407Trp mutation can cause a nonprogressive movement
disorder-deafness syndrome. Ann Clin Transl Neurol. 8:252–258.
2021.PubMed/NCBI View Article : Google Scholar
|
|
58
|
Pei X, Li KY, Shen Y, Li JT, Lei MZ, Fang
CY, Lu HJ, Yang HJ, Wen W, Yin M, et al: Palmitoylation of MDH2 by
ZDHHC18 activates mitochondrial respiration and accelerates ovarian
cancer growth. Sci China Life Sci. 65:2017–2030. 2022.PubMed/NCBI View Article : Google Scholar
|
|
59
|
Chen J, Jin J, Zhang X, Yu H, Zhu X, Yu L,
Chen Y, Liu P, Dong X, Cao X, et al: Microglial lnc-U90926
facilitates neutrophil infiltration in ischemic stroke via
MDH2/CXCL2 axis. Mol Ther. 29:2873–2885. 2021.PubMed/NCBI View Article : Google Scholar
|
|
60
|
Ma Q, Wang C, Wang M, Li Y, Li P, Wang J,
Cheng L, An Y, Dai H, Duan Y, et al: Investigation of brain damage
mechanism in middle cerebral artery occlusion/reperfusion rats
based on i-TRAQ quantitative proteomics. Exp Brain Res.
239:1247–1260. 2021.PubMed/NCBI View Article : Google Scholar
|
|
61
|
Wang B, Li ZL, Zhang YL, Wen Y, Gao YM and
Liu BC: Hypoxia and chronic kidney disease. EBioMedicine.
77(103942)2022.PubMed/NCBI View Article : Google Scholar
|