Introduction
Myasthenia gravis (MG) is an antibody-mediated
neurological autoimmune disorder, caused by transmission defects in
the neuromuscular junction (1).
The incidence rate of this disease ranges from 4.1 to 30 cases per
million person-years, with a prevalence rate spanning from 150 to
200 cases per million individuals (2). It has been reported that MG results
from a loss of self-tolerance, which allows auto-reactive
lymphocytes to develop. There are a number of mechanisms that may
contribute to compromised self-tolerance in MG, one of which is a
quantitative, functional and migratory deficit in regulatory T
cells (Tregs) (3).
Previous studies have focused on recognizing antigen
epitopes, assisting B cells to differentiate and mature into plasma
cells to produce antibodies and secrete cytokines of different
T-cell subsets during MG progression, and their contributions to
immune activation and autoimmunity (4,5). It
has been reported that Treg dysfunction contributes to the
pathogenesis of MG (6,7). However, data are conflicting
regarding whether reduced Treg numbers contribute to disease
pathogenesis (8,9). Treg suppressive function and effector
T cell numbers from patients with MG are both observed as
abnormalities in vivo studies (10). Tregs are a subgroup of T cells that
regulate autoimmune reactivity by inhibiting the function of other
effector T cells and antigen-presenting cells (11). Tregs release multiple
immunoinhibitory cytokines, such as transforming growth factor-β1
(TGF-β1) and interleukin-10 (IL-10) (11). The immunomodulatory properties of
Tregs are controlled by the expression of fork-head box protein 3
(Foxp3) (12). Inhibition of the
suppressive abilities of Tregs may lead to the increased production
of pro-inflammatory cytokines, such as IL-6, IL-17 and IFN-γ, as
well as in the activation of autoantibody-producing B cells
(13).
MicroRNAs (miRNAs/miRs) are small, non-coding RNAs
that regulate immune function and homeostasis (14-17).
Although these previous studies have provided considerable insight
into the role of miRNAs in immune homeostasis, their direct targets
remain to be fully elucidated, particularly in Tregs. miR-155-5p
has been shown to regulate the differentiation of lymphocyte
subsets, such as B cells and CD8+ and CD4+ T
cells, including T-helper type and Tregs (18). Previous studies have demonstrated
that miRNAs are involved in the pathogenesis of MG (4,19),
and the expression level of miR-155 is significantly increased in
peripheral blood mononuclear cells (PBMCs) of patients with MG
(20). However, to the best of our
knowledge, a direct link between miR-155 dysregulation and impaired
Treg induction in the context of MG onset has not been reported to
date.
B-cell lymphoma/leukemia 10 (BCL10) is an
intracellular signaling protein that serves a role in T cell
receptor-induced NF-κB activation in Tregs and participates in the
production of Treg effectors under homeostatic conditions (21). Previous animal studies reported
that BCL10 regulates the development and function of Tregs
(21,22) and can be targeted by miR-155-5p
(23). However, whether miR-155-5p
and BCL10 contribute to the pathological mechanisms of MG remains
unknown. Thus, the present study aimed to explore whether
miR-155-5p could target BCL10 and regulate the function of Tregs in
MG.
Materials and methods
Study subjects
A total of 18 patients with MG were recruited from
the Department of Neurology at the Second Hospital of Lanzhou
University (Lanzhou, China). The inclusion criteria were as
follows: i) Meeting the diagnostic criteria for MG (24); ii) detection of AChR antibody in
all collected samples; and iii) Myasthenia Gravis Foundation of
America classification of I to IV (25). The exclusion criteria encompassed
individuals with concomitant cognitive impairment, other autoimmune
diseases, malignant tumors, liver and kidney insufficiency, and
coagulation disorders. A total of 15 healthy controls were also
recruited from the Physical Examination Center of the Second
Hospital of Lanzhou University. The inclusion criteria for these
controls were as follows: i) Absence of any disease status upon
physical examination; and ii) matching the sex and age of the
patients with MG. The quantitative MG (QMG) score (26) was measured by two researchers who
were blinded to the experimental groups. All patients with MG and
healthy individuals were recruited between May 2021 and May 2022.
The study was approved by the Ethics Committee of Lanzhou
University Second Hospital (approval no. 2021A-445; Lanzhou,
China), and all samples were collected after obtaining written
informed consent from the participants. Subsequently, fresh blood
samples were collected from 18 patients diagnosed with MG and 15
healthy controls, which were then utilized for reverse
transcription-quantitative (RT-q)PCR and flow cytometry analysis.
The baseline characteristics of the study population, including age
and sex distribution, and the demographic characteristics of the
patients with MG are presented in Tables I and II, respectively.
 | Table IBaseline characteristics of the study
population. |
Table I
Baseline characteristics of the study
population.
|
Characteristics | Patients with MG
(n=18) | Healthy controls
(n=15) | P-value |
|---|
| Age, years | 49.20±3.50 | 50.22±3.69 | 0.8440 |
| Female sex, n
(%) | 11(18) | 9(15) | >0.9999 |
| BMI,
kg/m2 | 23.25±1.14 | 20.84±0.36 | 0.0725 |
| Table IIDemographic characteristics of
patients with MG. |
Table II
Demographic characteristics of
patients with MG.
| Patient | Age at onset,
years | Sex, M/F | Disease duration,
months | MGFA clinical
classification | QMG score | Abnormalities of
the thymus | Acetylcholine
receptor antibody levels (nmol/l) |
|---|
| MG1 | 32 | F | 6.0 | I | - | Thymoma | ~ |
| MG2 | 55 | M | 1.0 | I | 13 | / | 17.12 |
| MG3 | 52 | F | 2.5 | IIIa | 27 | / | 8.34 |
| MG4 | 34 | M | 2.0 | I | - | Thymic
hyperplasia | ~ |
| MG5 | 46 | F | 1.0 | I | 18 | / | ~ |
| MG6 | 39 | M | 3.0 | IIa | 15 | / | 22.67 |
| MG7 | 43 | M | 36.0 | IIIa | 5 | Thymic
hyperplasia | 117.60 |
| MG8 | 55 | M | 66.0 | IIa | - | / | 11.68 |
| MG9 | 72 | F | 24.0 | I | 28 | Thymoma | ~ |
| MG10 | 36 | F | 6.0 | IIb | 19 | / | 14.27 |
| MG11 | 24 | M | 3.0 | I | 17 | Thymic
hyperplasia | ~ |
| MG12 | 63 | M | 0.5 | I | 7 | / | ~ |
| MG13 | 47 | F | 6.0 | IIIa | 22 | Thymic
hyperplasia | 32.18 |
| MG14 | 12 | F | 600.0 | IIa | 29 | / | 45.26 |
| MG15 | 59 | M | 1.5 | IVb | 21 | Thymoma | 39.26 |
| MG16 | 17 | F | 1.0 | IIb | 11 | / | ~ |
| MG17 | 45 | M | 132.0 | IIa | - | Thymic
hyperplasia | 26.67 |
| MG18 | 56 | F | 12.0 | I | 15 | / | 4.58 |
Establishment and clinical evaluation
of acetylcholine receptor (AChR)-induced experimental autoimmune MG
(EAMG)
A total of 16 female Lewis rats (7 weeks old; 170±2
g; Beijing Vital River Laboratory Animal Technology Co., Ltd.) were
bred under the following pathogen-free conditions: Light/dark
cycle, 12/12 h; temperature, 21-22˚C; humidity, 55±5%; and water
and food intake, ad libitum. Autoimmunity was induced by
injecting the R97-116 peptide (sequence, DGDFAIVKFTKVLLDYTGHI;
CSBio). In torpedo and rat receptors, 16 of the 20 residues of the
R97-116 sequence are identical, and the R97-116 polypeptide is a
synthetic peptide with 80% homology to the AChR-α subunit. Baggi
et al (27) previously
reported that induction of EAMG in rats using the R97-116 peptide
resulted in a high rate of success. Clinical scores, clinical
incidence, body weight measurement, AChR-specific antibody
detection and muscle AChR detection were employed to illustrate the
effective induction of experimental autoimmune myasthenia gravis
(EAMG) following AChR immunization. Additionally, the EAMG rat
model exhibited hunched posture, muscle strength, and fatigability,
which closely mirrored the symptoms observed in clinical MG
patients. Briefly, the animals used in the present study were
anesthetized via intraperitoneal injection of pentobarbital sodium
(50 mg/kg) prior to subcutaneous immunization. Each animal was
injected with a total volume of 200 µl inoculum containing R97-116
peptide (50 µg), emulsified in complete Freund's adjuvant (CFA;
MilliporeSigma). On day 11 post-injection, all rats were boosted by
injecting R97-116 peptide emulsified in incomplete Freund's
adjuvant (IFA; MilliporeSigma) at four well-separated sites on the
back of the animals (50 µg/rat). The control rats were immunized
with subcutaneous injections of CFA and IFA. Animals were
euthanized via an intraperitoneal injection of sodium pentobarbital
(200 mg/kg) (28). All animal
experiments were approved by the Animal Care and Use Committee of
Lanzhou University Second Hospital (approval no. 2021A-319;
Lanzhou, China).
The weight of the rats, Lennon scores and the levels
of anti-AChR antibody in the serum were used to assess whether the
EAMG animal model was successfully established. Briefly, all rats
were weighed and scored at the beginning of the experiment and at
least twice a week until the end of the experiment on day 45. The
Lennon score was evaluated according to previously described
criteria (29). Disease severity
was graded as follows: 0, normal; 1, mildly decreased activity,
weak grip and fatigable; 2, weakness, hunched posture at rest,
decreased body weight and tremor; 3, severe generalized weakness, a
marked decrease in body weight and moribund; and 4, death. Rats
with intermediate signs were assigned grades of 0.5, 1.5, 2.5 or
3.5, respectively.
Anti-AChR antibodies
The absolute anti-AChR antibody levels in rats with
EAMG were evaluated using an ELISA kit (cat. no. EK-R31157;
Shanghai Enzyme Research Biotechnology Co., Ltd.). After
administering anesthesia to the rats, a fresh blood sample of 500
µl was obtained from the heart and subsequently underwent
centrifugation at 1,000 x g for 10 min at 4˚C to isolate the serum.
The obtained serum was then diluted using a diluent comprising 1%
phosphate-buffered saline (PBS; cat. no. P1022; Beijing Solarbio
Science & Technology Co., Ltd.) and 2% fetal bovine serum (FBS;
cat. no. 10099158; Gibco). This diluted serum was added to the
assay plate at a volume of 100 µl per well and incubated at 37˚C
for 90 min. Subsequently, the liquid within the wells was discarded
and incubated with 100 µl of biotin-labeled antibodies for 30 min
at 37˚C. Following this, the assay plate underwent three cycles of
washing, after which 100 µl of streptavidin-HRP working solution
was added and incubated at 37˚C for 30 min. The plate was then
washed five times before the addition of 90 µl of the chromogenic
reagent tetramethylbenzidine to each well, and incubated at 37˚C
for 15 min in the dark. Finally, the reactions were terminated by
adding 100 µl of the stop solution (1M H3PO4). The optical density
of the test samples and standard was measured using a
Multiskan™ FC microplate reader (Thermo Fisher
Scientific, Inc.) at 450 nm.
Flow cytometry
To determine the proportion of CD4+
CD25hi CD127low Tregs in the peripheral blood
of patients with MG and the proportion of CD4+
CD25+ Foxp3+ Tregs in splenic lymphocytes of
EAMG rats, flow cytometry guidelines were followed (30). Briefly, 100 µl of freshly collected
peripheral blood was added to a 1.5-ml centrifuge tube, followed by
300 µl red cell lysis buffer (C3702; Beyotime Institute of
Biotechnology), mixed thoroughly, and incubated in the dark at RT
for 5 min. Subsequently, 5 µl human TruStain FcX Fc receptor
blocking solution (cat. no. 422301; BioLegend, Inc.) was added to
the 1x10⁶ cells/sample and incubated at RT in the dark
for 10 min, and centrifuged at 500 x g for 5 min at RT.
Subsequently, the samples were stained with fluorochrome-conjugated
antibodies against surface markers FITC anti-human CD4 (0.5 mg/ml;
cat. no. 300505; BioLegend, Inc.), phycoerythrin (PE) anti-human
CD25 (0.5 mg/ml; cat. no. 302605; BioLegend, Inc.) and
allophycocyanin (APC) anti-human CD127 (0.2 mg/ml; cat. no. 351315;
BioLegend, Inc.) antibodies, and incubated in the dark at 4˚C for
30 min. Rat spleen mononuclear cells were isolated by density
gradient centrifugation and counted at 1x10⁶ cells/100
µl per tube, then 5 µl 2% BSA (cat. no. A8020; Beijing Solarbio
Science & Technology Co., Ltd.) was added to 1x10⁶
cells/tube and incubated at RT in the dark for 15 min to block
non-specific staining. The mixture was centrifuged at 450 x g for 5
min at RT, then 1x10⁶ cells/samples were incubated with
FITC anti-rat CD4 (0.5 mg/ml; cat. no. 201505; BioLegend, Inc.) and
PE anti-rat CD25 (0.2 mg/ml; cat. no. 202105; BioLegend, Inc.)
antibodies at 4˚C in the dark for 30 min. Following fixation for 20
min and permeabilization for 15 min at RT using FOXP3 Fix/Perm
Buffer Set (cat. no. 421403; BioLegend, Inc.), cells were stained
with APC anti-rat Foxp3 antibodies (0.2 mg/ml; cat. no. 77-5775-40;
eBioscience; Thermo Fisher Scientific, Inc.) at RT in the dark for
30 min. Mouse IgG1 κ labeled with the same fluorescence as the flow
antibody, was set as a negative control (cat. no. F11IG101, 0.2
mg/ml; cat. no. F11IG103; 0.2 mg/ml; cat. no. F11IG102, 0.2 mg/ml;
Hangzhou MULTISCIENCES Co., Ltd.). Stained cells were counted using
a BD FACSCanto™ flow cytometer (BD Biosciences) and
analyzed using FlowJo™ software (version 10.8.1; FlowJo
LLC).
Dual-luciferase reporter assay
Bioinformatics analysis was performed to predict the
potential targets of miR-155-5p using the TargetScan 8.0 software
(https://www.targetscan.org/). To verify
whether BCL10 and miR-155-5p could bind, the human BCL10
3'-untranslated region (UTR) sequence that was predicted to
interact with the miR-155-5p seed sequence was mutated (Mut, the
putative binding site was changed from 5'-AGCATTAA-3' to
5'-TCGAAATT-3'; Shanghai GenePharma Co., Ltd.). Human
BCL10-wild-type (WT) and BCL10-Mut 3'-UTRs were cloned into the
pmirGLO (Shanghai GenePharma Co., Ltd.) vector containing both
Renilla and firefly luciferase. 293T cells (The Cell Bank of
Type Culture Collection of the Chinese Academy of Sciences;
cultured in DMEM (cat. no. 31600034; Gibco; Thermo Fisher
Scientific, Inc.) with 10% FBS (Gibco; Thermo Fisher Scientific,
Inc.) at 37˚C with 5% CO2 were seeded in 12-well plates
at a concentration of 5x10⁵ cells/well. miR-155-5p
mimics or mimics negative control (NC) (20 µM; Shanghai GenePharma
Co., Ltd.; Table III) and 1.6 µg
of the aforementioned luciferase reporter plasmid were
co-transfected into 293T cells using the GP-transfect-Mate reagent
(Shanghai GenePharma Co., Ltd.). After 48 h, the cells were
collected for detection of the luciferase activity using the
Dual-Luciferase® Reporter Assay System (Promega
Corporation). The ratio of Renilla luciferase to firefly
luciferase activity was calculated. All experiments were performed
in duplicate.
| Table IIISequences of synthesized
oligonucleotides and primers used in the present study. |
Table III
Sequences of synthesized
oligonucleotides and primers used in the present study.
| A, miRNA mimics and
inhibitors |
|---|
|
Gene/oligonucleotide | Sequence
(5'-3') |
|---|
| Rno-mimics NC | |
|
Sense |
UUCUCCGAACGUGUCACGUTT |
|
Antisense |
ACGUGACACGUUCGGAGAATT |
| Rno-miR-155-5p
mimics | |
|
Sense |
UUAAUGCUAAUUGUGAUAGGGGU |
|
Antisense |
CCCUAUCACGAUUAGCAUUAAUU |
| Rno-miR-155-5p
inhibitor NC |
CAGUACUUUUGUGUAGUACAA |
| Rno-miR-155-5p
inhibitor hsa-mimics NC |
ACCCCUAUCACAAUUAGCAUUAA |
|
Sense |
UUGUGAAGGCAUAAUGGUGUCAUU |
|
Antisense |
AAUGACACCAUUAUGCCUUCACAA |
| hsa-miR-155-5p
mimics | |
|
Sense |
UUAAUGCUAAUCGUGAUAGGGGUU |
|
Antisense |
AACCCCUAUCACGAUUAGCAUUAA |
| hsa-miR-155-5p
inhibitor NC |
CAGUACUUUUGUGUAGUACAA |
| hsa-miR-155-5p
inhibitor |
AACCCCTATCACGATTAGCATTAA |
| B, siRNAs |
|
Gene/oligonucleotide | Sequence
(5'-3') |
| si-BCL10-1 | |
|
Sense |
CCAAUUCUGAUGAGAGCAATT |
|
Antisense |
UUGCUCUCAUCAGAAUUGGTT |
| si-BCL10-2 | |
|
Sense |
GGAAGUUGUUAGACUACUUTT |
|
Antisense |
AAGUAGUCUAACAACUUCCTT |
| si-BCL10-3 | |
|
Sense |
GCUAAAGCUUCGGAAUAUATT |
|
Antisense |
UAUAUUCCGAAGCUUUAGCTT |
| si-NC | |
|
Sense |
UUCUCCGAACGUGUCACGUTT |
|
Antisense |
ACGUGACACGUUCGGAGAATT |
| C, Primers |
|
Gene/oligonucleotide | Sequence
(5'-3') |
| Rno-miR-155-5p | |
|
Forward |
CTCCTACCTGTTAGCATTAACAAAA |
|
Reverse | All-in-One™ miRNA
RT-qPCR detection kit (GeneCopoeia, Inc.) |
| Rno-U6 | Cat. no. RmiRQP9003
(GeneCopoeia, Inc.) |
| hsa-miR-155-5p | |
|
Forward |
GCTCCTACATATTAGCATTAACAAAAA |
|
Reverse | All-in-One™ miRNA
RT-qPCR detection kit (GeneCopoeia, Inc.) |
| hsa-U6 | Cat. no. HmiRQP9001
(GeneCopoeia, Inc.) |
| BCL10 | |
|
Forward |
ACCATCCAGAGGGAGAGTCG |
|
Reverse |
CTGTTTTCCAGCCTGCCAAC |
| β-actin | |
|
Forward |
CCCGCGAGTACAACCTTCTT |
|
Reverse |
AACACAGCCTGGATGGCTAC |
| Foxp3 | |
|
Forward |
TGGGATCAATGTGGCCAGTC |
|
Reverse |
GGTTGCTGTCTTTCCTGGGT |
| TGF-β1 | |
|
Forward |
ACGTCAGACATTCGGGAAGC |
|
Reverse |
CGTGTTGCTCCACAGTTGAC |
| CTLA-4 | |
|
Forward |
TGTACCCACCGCCATACTTTG |
|
Reverse |
CGAACTAACTGCAGCAAGGA |
| ICOS | |
|
Forward |
TCCTGCACTTCTTCCTGAAACA |
|
Reverse |
CTGTGACCTCAAAGGACCCTAC |
Transfection of miR-155-5p mimics and
miR-155-5p inhibitor in Jurkat cells
In the present study, the selection of miR-155-5p
mimics and miR-155-5p inhibitor as exogenous biomacromolecules was
based on their characteristics, namely their ability to be
transfected into cells solely through the use of transfection
reagents, thereby eliminating the need for intricate vector
construction and concerns regarding viral protection. miRNA
inhibitors, which are chemically modified oligonucleotides that
exhibit complete complementarity to endogenous mature miRNA, were
chosen due to their ability to inhibit the functions of target
miRNAs effectively (31).
miR-155-5p mimics, inhibitor, and NC oligonucleotides (Table III) were purchased from Shanghai
GenePharma Co., Ltd. Jurkat T Cells (Procell Life Science &
Technology Co., Ltd.) were transfected with the corresponding
oligonucleotides using Entranster™-R4000 (Engreen
Biosystem, Co., Ltd.) according to the manufacturer's instructions.
Cells were seeded in 24-well plates 1 day prior to the experiment.
Jurkat T cells were cultured in RPMI-1640 medium (Gibco; Thermo
Fisher Scientific, Inc.) with 10% FCS (Gibco; Thermo Fisher
Scientific, Inc.), 1% L-glutamine (MilliporeSigma), 1% sodium
pyruvate, 1% non-essential amino acids, 2x10⁻⁵ M
2-mercaptoethanol (Amresco, LLC) and 1% penicillin-streptomycin
(Gibco; Thermo Fisher Scientific, Inc.). Cells in the logarithmic
growth phase were used, with a total of 2x10⁵ cells/well
used for transfection. A total of 0.67 µg (50 pmol) miR-155-5p
mimics, miR-155-5p inhibitor or NC oligonucleotides were mixed with
25 µl serum-free RPMI-1640. Additionally, a 25 µl
Entranster™-R4000 solution was prepared by mixing 1 µl
Entranster™-R4000 with 24 µl serum-free RPMI-1640.
Entranster™-R4000 and miRNA solutions were mixed and
incubated for 15 min at RT. Subsequently, the 50-µl transfection
solution was added to the cells along with 0.45 ml complete
RPMI-1640 medium as aforementioned, and incubated at 37˚C. After a
transfection period lasting 6 h, the cells were found to be in a
favorable condition. Consequently, the cells were cultured for 48 h
before the initiation of subsequent experiments.
Isolation of CD4+ T cells
and CD4+ CD25+ Tregs
After the rats were euthanized, the spleen was
isolated, and a single-cell suspension was prepared using
Ficoll-Histopaque (Beijing Solarbio Science & Technology Co.,
Ltd.) density gradient centrifugation at 700 x g for 30 min at RT.
Samples collected by centrifugation were treated with RPMI-1640
medium (cat. no. 11875093; Gibco; Thermo Fisher Scientific, Inc.)
with 10% FBS (cat. no. c0235; Gibco; Thermo Fisher Scientific,
Inc.) and 1% penicillin-streptomycin, and were re-suspended and
counted at 1x10⁷ cells/ml. CD4+ T cells and
CD4+ CD25+ cells were sorted using the BD
FACSAria™ III Cell Sorter (BD Biosciences). The sorted
cells were centrifuged at 450 x g for 5 min at RT, counted at
1x10⁶ cells/100 µl per tube, then treated with 5 µl 2%
BSA (cat. no. A8020; Beijing Solarbio Science & Technology Co.,
Ltd.) and incubated at RT in the dark for 10 min to block
non-specific staining. This was followed by staining with
fluorochrome-conjugated antibodies against surface markers FITC
anti-rat CD4 (0.5 mg/ml; cat. no. 201505; BioLegend, Inc.) and PE
anti-rat CD25 (0.2 mg/ml, cat. no. 202105; BioLegend, Inc.), and
incubated in the dark at 4˚C for 30 min. The sorting procedure was
repeated three times to assess the purity of the sorted cells,
which was determined to be 95% by flow cytometry.
Cell Counting Kit-8 (CCK-8) assay
A total of 1x10⁵ of the sorted
CD4+ T cells and CD4+ CD25+ Tregs
were cultured and resuspended in 100 µl culture medium (RPMI 1640
supplemented with 10% FCS, 1% L-glutamine, HEPES 1 M and 1%
penicillin-streptomycin) in sterile plastic 96-well, flat-bottom
microwell culture plates (Thermo Fisher Scientific, Inc.) at 37˚C
with 5% CO2. For proliferation analysis, CD4+
CD25+ Tregs and CD4+ T cells were cultured
separately, and 100 µl control medium with or without
phytohaemagglutinin (PHA) (cat. no. P8090; Beijing Solarbio Science
& Technology Co., Ltd.) was added to the appropriate wells. The
final concentration of PHA was 20 µg/ml. For suppression analysis,
CD4+ T cells and CD4+ CD25+ Tregs
were co-cultured at a 1:1 ratio (0.5x10⁵ +
0.5x10⁵) for 96 h in the same conditions. Tregs
inhibitory capacity was assessed using CCK-8 assay (Beyotime
Institute of Biotechnology). A 10 µl solution of CCK-8 reagent was
added to the cells and incubated with 5% CO2 at 37˚C for
2 h. The absorbance of samples was then measured at 450 nm using a
Multiskan™ FC microplate reader.
Verification of the function of BCL10
in Tregs
To explore the function of BCL10 in Tregs,
CD4+ CD25+ Tregs were transfected with 20 µM
BCL10 small interfering (si)RNA, scramble siRNA (si-NC; Table III; Shanghai GenePharma Co.,
Ltd.), 20 µM miR-155-5p inhibitor or inhibitor NC (Table III; Shanghai GenePharma Co.,
Ltd.) in 24-well plates with 1x10⁶ cells/well using
Entranster™-R4000 according to the manufacturer's
instructions. After incubation with 5% CO2 at 37˚C for 4
h, the cells were placed in fresh RPMI-1640 medium with 10% FCS, 1%
L-glutamine, 1% sodium pyruvate, 1% non-essential amino acids,
2x10⁻⁵ M 2-mercaptoethanol and 1%
penicillin-streptomycin, followed by stimulation with 5 µg/ml
anti-CD3 (cat. no. 201415; BioLegend, Inc.) and 5 µg/ml anti-CD28
(cat. no. 200902; BioLegend, Inc.) monoclonal antibodies in the
presence of IL-2 (100 U/ml; PeproTech, Inc.) at 37˚C for 48 h. To
evaluate the activation of Tregs, the TGF-β1 and IL-10 levels in
the cell supernatant were measured using an ELISA kit (cat. no.
ml002856; cat. no. ERC004; Neobioscience Technology Co., Ltd.)
according to the manufacturer's instructions.
Western blotting
CD4+ CD25+ Treg cells were
lysed with RIPA buffer (cat. no. 89901; Thermo Fisher Scientific,
Inc.) and the protein concentration was quantified using the BCA
method. A total of 150 µg proteins from each sample were separated
by SDS-PAGE using a 5% concentration and a 15% separation gel and
then transferred to a 0.22 µm polyvinylidene fluoride membrane.
Next, the membranes were blocked in 5% non-fat dried milk (cat. no.
D8340; Beijing Solarbio Science & Technology Co., Ltd.) in
Tris-buffered saline containing 0.05% Tween 20 (TBST) [0.05% (v/v)
Tween 20 in 20 mmol/l Tris-HCl buffer, pH 7.6, containing 137 mm
sodium chloride] for 1 h at RT. The membranes were incubated with
primary antibodies including mouse anti-BCL10 (1:1,000; cat. no.
BM1565; Wuhan Boster Biological Technology, Ltd.) and mouse
anti-β-actin (1:1,000; cat. no. 3700; Cell Signaling Technology,
Inc.) overnight at 4˚C. The membranes were washed three times with
TBST, and incubated with HRP-labeled goat anti-mouse secondary IgG
antibody (zb-2305; OriGene Technologies, Inc.) for 2 h at RT.
Protein bands were visualized with Immobilon Western
Chemiluminescent HRP Substrate (Millipore, USA) and captured by
MiniChemi 610 Plus imaging system (Beijing Sage Creation Science
Co., Ltd.). Bands were quantified using ImageJ (Ver. 1.46; National
Institutes of Health) and normalized to β-actin.
RT-qPCR
Initially, fresh whole blood was diluted in 1% PBS
at a ratio of 1:3 and then centrifuged at 450 x g for 10 min at RT
to eliminate red cells in 10 ml of red blood cell lysis buffer
(C3702; Beyotime Institute of Biotechnology). Subsequently,
peripheral blood mononuclear cells (PBMC) were isolated through
Ficoll density gradient centrifugation at 700 x g for 30 min at RT.
Total RNA was then extracted from either PBMC or Tregs using
TRIzol® reagent (Invitrogen; Thermo Fisher Scientific,
Inc.) in accordance with the manufacturer's guidelines, and
subsequently reverse transcribed into complementary DNA (cDNA)
using a PrimeScript™ RT reagent Kit (Takara
Biotechnology Co., Ltd.) as per the manufacturer's instructions.
The relative expression levels of miR-155-5p were quantified using
the All-in-One™ miRNA RT-qPCR detection kit
(GeneCopoeia, Inc.). The primer sequences used in the present study
are presented in Table III, and
were purchased from GeneCopoeia, Inc. The reverse primers were
included in the All-in-One™ miRNA RT-qPCR detection kit.
The thermocycling conditions used were as follows: Initial
denaturation for 30 sec at 95˚C; followed by 40 cycles of 5 sec at
95˚C, 30 sec at 60˚C and 30 sec at 72˚C. mRNAs for BCL10, TGF-β1,
Foxp3, cytotoxic T-lymphocyte-associated protein 4 (CTLA-4) and
inducible T-cell costimulator (ICOS) were reverse transcribed using
the RevertAid First Strand cDNA Synthesis Kit (Thermo Fisher
Scientific, Inc.), and qPCR was performed using SYBR Green
Real-time PCR Master Mix (Thermo Fisher Scientific, Inc.). The
thermocycling conditions used were as follows: Uracil-DNA
glycosylase enzyme activation for 2 min at 50˚C and predenaturation
for 2 min at 95˚C, followed by 40 cycles of 15 sec at 95˚C and 1
min at 60˚C. The 2-ΔΔCq method (32) was used for the calculation of
relative expression levels normalized to β-actin (for mRNA) or U6
(for miRNA). Data analysis was performed using CFX 96 software
(Bio-Rad Laboratories, Inc.).
Statistical analysis
All experiments were performed in three independent
biological replicates unless stated otherwise, and the data are
presented as the mean ± standard error of the mean or the median
(interquartile range). Data were analyzed using GraphPad Prism
(version 9.1; GraphPad Software; Dotmatics). Correlations were
analyzed using Pearson's correlation test. The means of the two
groups were compared using an unpaired Student's t-test, while the
Mann-Whitney U test was utilized for Lennon's score. One-way
analysis of variance followed by Tukey's post hoc test was used for
comparisons among multiple groups. Additionally, two-way ANOVA
followed by Bonferroni's post hoc test was employed to analyze the
CCK-8 data. Fisher's exact test was used to compare the sex
distribution between the MG group and non-MG groups, which is
presented as n (%). P<0.05 was considered to indicate a
statistically significant difference.
Results
miR-155-5p expression level is
associated with the QMG score and BCL10 mRNA expression level in
patients with MG
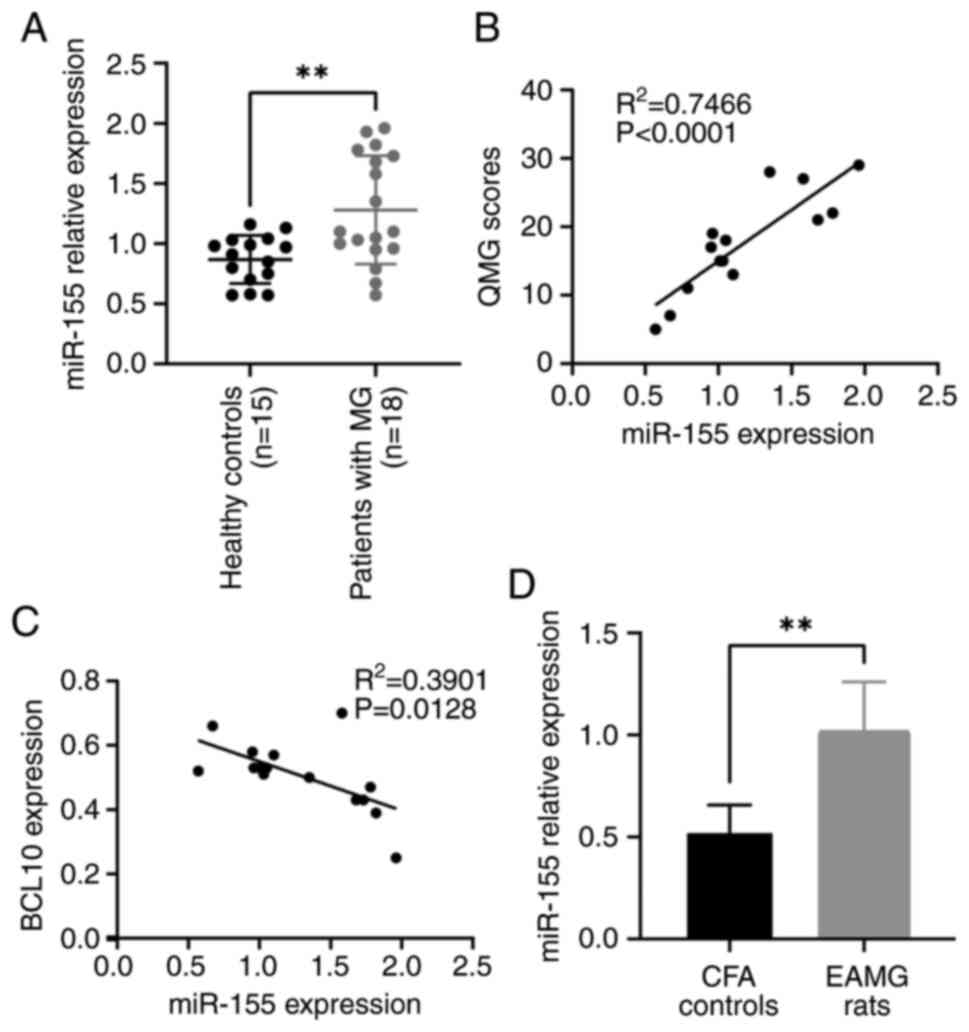
RT-qPCR results demonstrated that the expression
level of miR-155-5p was significantly higher in PBMCs from patients
with MG compared with that of the control group (Fig. 1A). Furthermore, there was a
significant positive correlation between the expression levels of
miR-155-5p and QMG scores (R2=0.7466; Fig. 1B). A significant negative
correlation was observed between the expression levels of
miR-155-5p and the levels of BCL10 mRNA in the blood
(R2=0.3901; Fig. 1C).
Furthermore, the expression level of miR-155-5p in rats with EAMG
was significantly higher compared with that in control rats
(Fig. 1D).
Clinical manifestation, weight
evolution and Lennon score of rats with EAMG
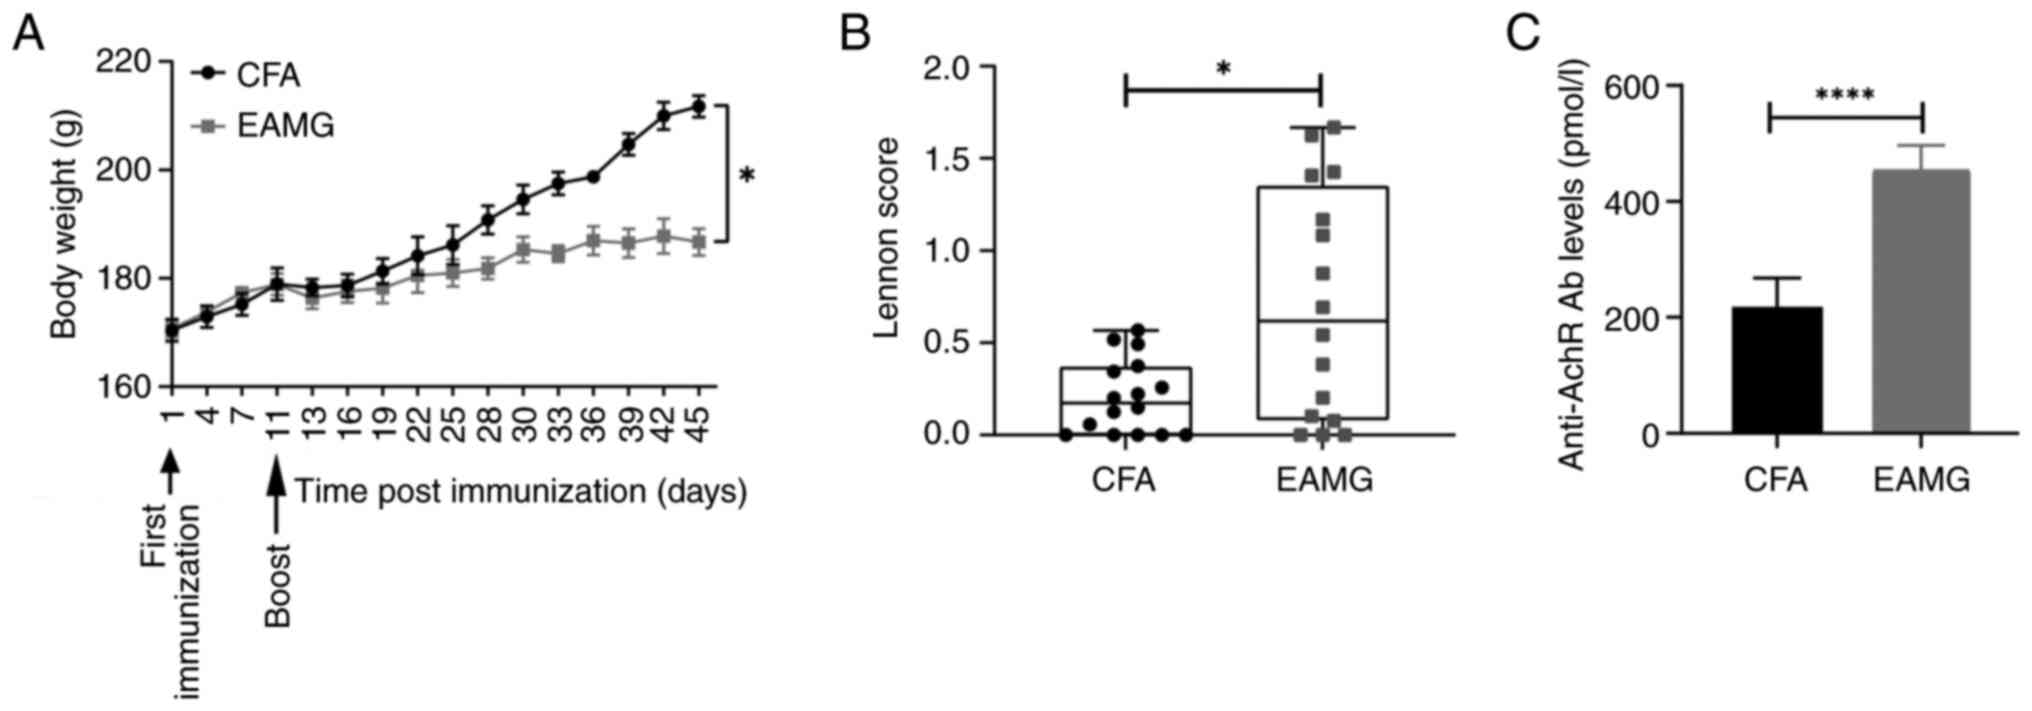
The rats in the EAMG group demonstrated weakness,
weight loss, dull coats and listlessness in the 11 days following
R97-116 peptide immunization, and an inflammatory response
characterized by redness, swelling and pain was observed at the
injection sites (data not shown). In addition, hypoactivity was
observed, including reduced crawling and grip, weak bite and
vocalization and reduced food intake in rats with EAMG. At 45 days
following immunization, the body weight of rats with EAMG
(186.7±0.63 g) was significantly lower compared with that of the
control group (211.7±0.64 g) (Fig.
2A). The Lennon scores of the EAMG group 1.63 (0.31) [median
(interquartile range)] were significantly higher compared with
those of the control group 0.50 (0.3) (Fig. 2B). The ELISA results demonstrated
that the level of serum anti-AChR antibodies in the EAMG group
(453.70±16.23) was significantly higher compared with that of the
control group (222.30±19.75) (Fig.
2C). These results indicated the successful establishment of
the rat model of EAMG.
BCL10 is a direct target of
miR-155-5p
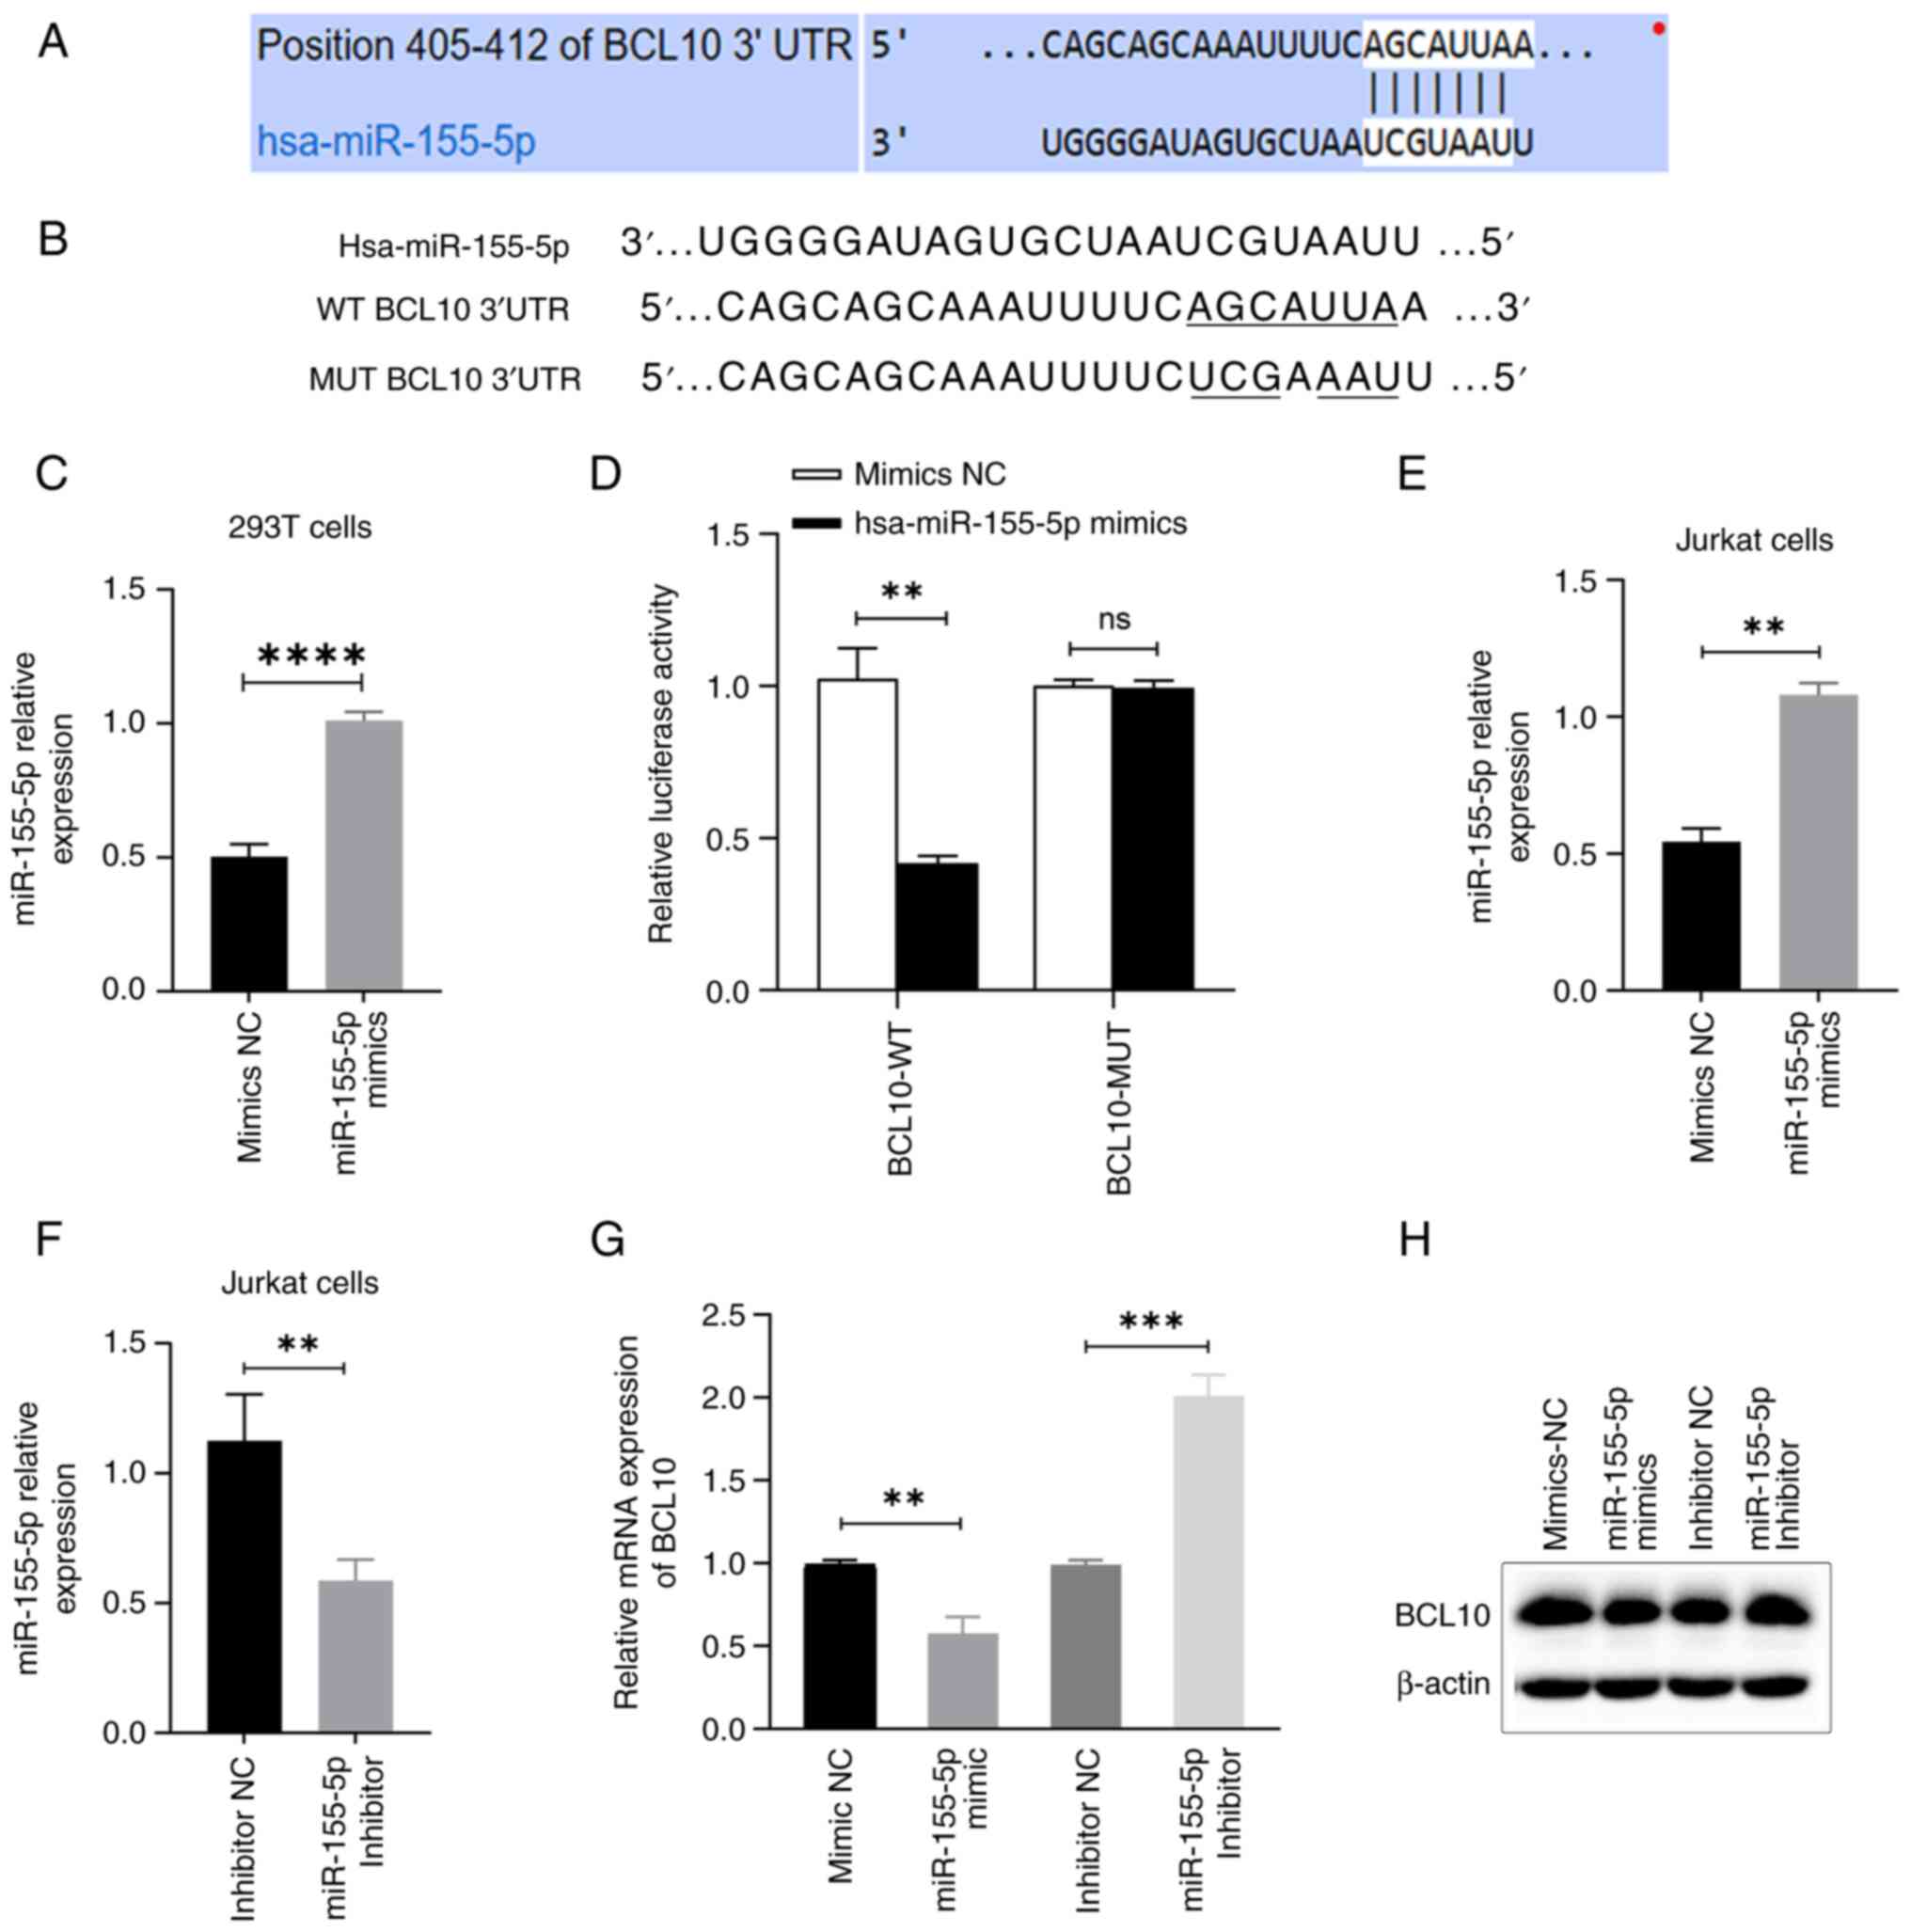
The TargetScan 8.0 software search indicated that
BCL10 was a potential target of miR-155-5p, as demonstrated by the
complementary sequences between BCL10 3'-UTR and miR-155-5p
(Fig. 3A and B). miR-155-5p mimics or mimics NC were
introduced via transfection into 293T cells. Similarly, miR-155-5p
mimics or mimics NC, along with miR-155-5p inhibitor or inhibitor
NC, were transfected into Jurkat T cells. The expression levels of
miR-155-5p were quantitatively assessed using RT-qPCR in 293T and
Jurkat cells, demonstrating the success of the transfections
(Fig. 3C, E and F).
Luciferase assay results demonstrated that co-transfection with
miR-155-5p mimics led to a significant ~55% decrease in the
luciferase activity of BCL10-WT-transfected cells compared with the
mimics NC group, indicating that BCL10 specifically binds to
miR-155-5p. However, no significant change was observed in
BCL10-Mut-transfected cells (Fig.
3D). Moreover, the study revealed that transfection of
miR-155-5p mimics resulted in a significant decrease in mRNA and a
notable downregulation of protein expression levels of BCL10 in
Jurkat T cells, as compared to the transfection of mimics NC.
Conversely, transfection of miR-155-5p inhibitor led to a
significant increase in mRNA and a marked upregulation of protein
expression levels of BCL10 in Jurkat T cells, as compared to the
transfection of inhibitor NC (Fig.
3G and H). These results
demonstrated that BCL10 is a direct target of miR-155-5p.
Proportion of Tregs is significantly
decreased in patients with MG and rats with EAMG
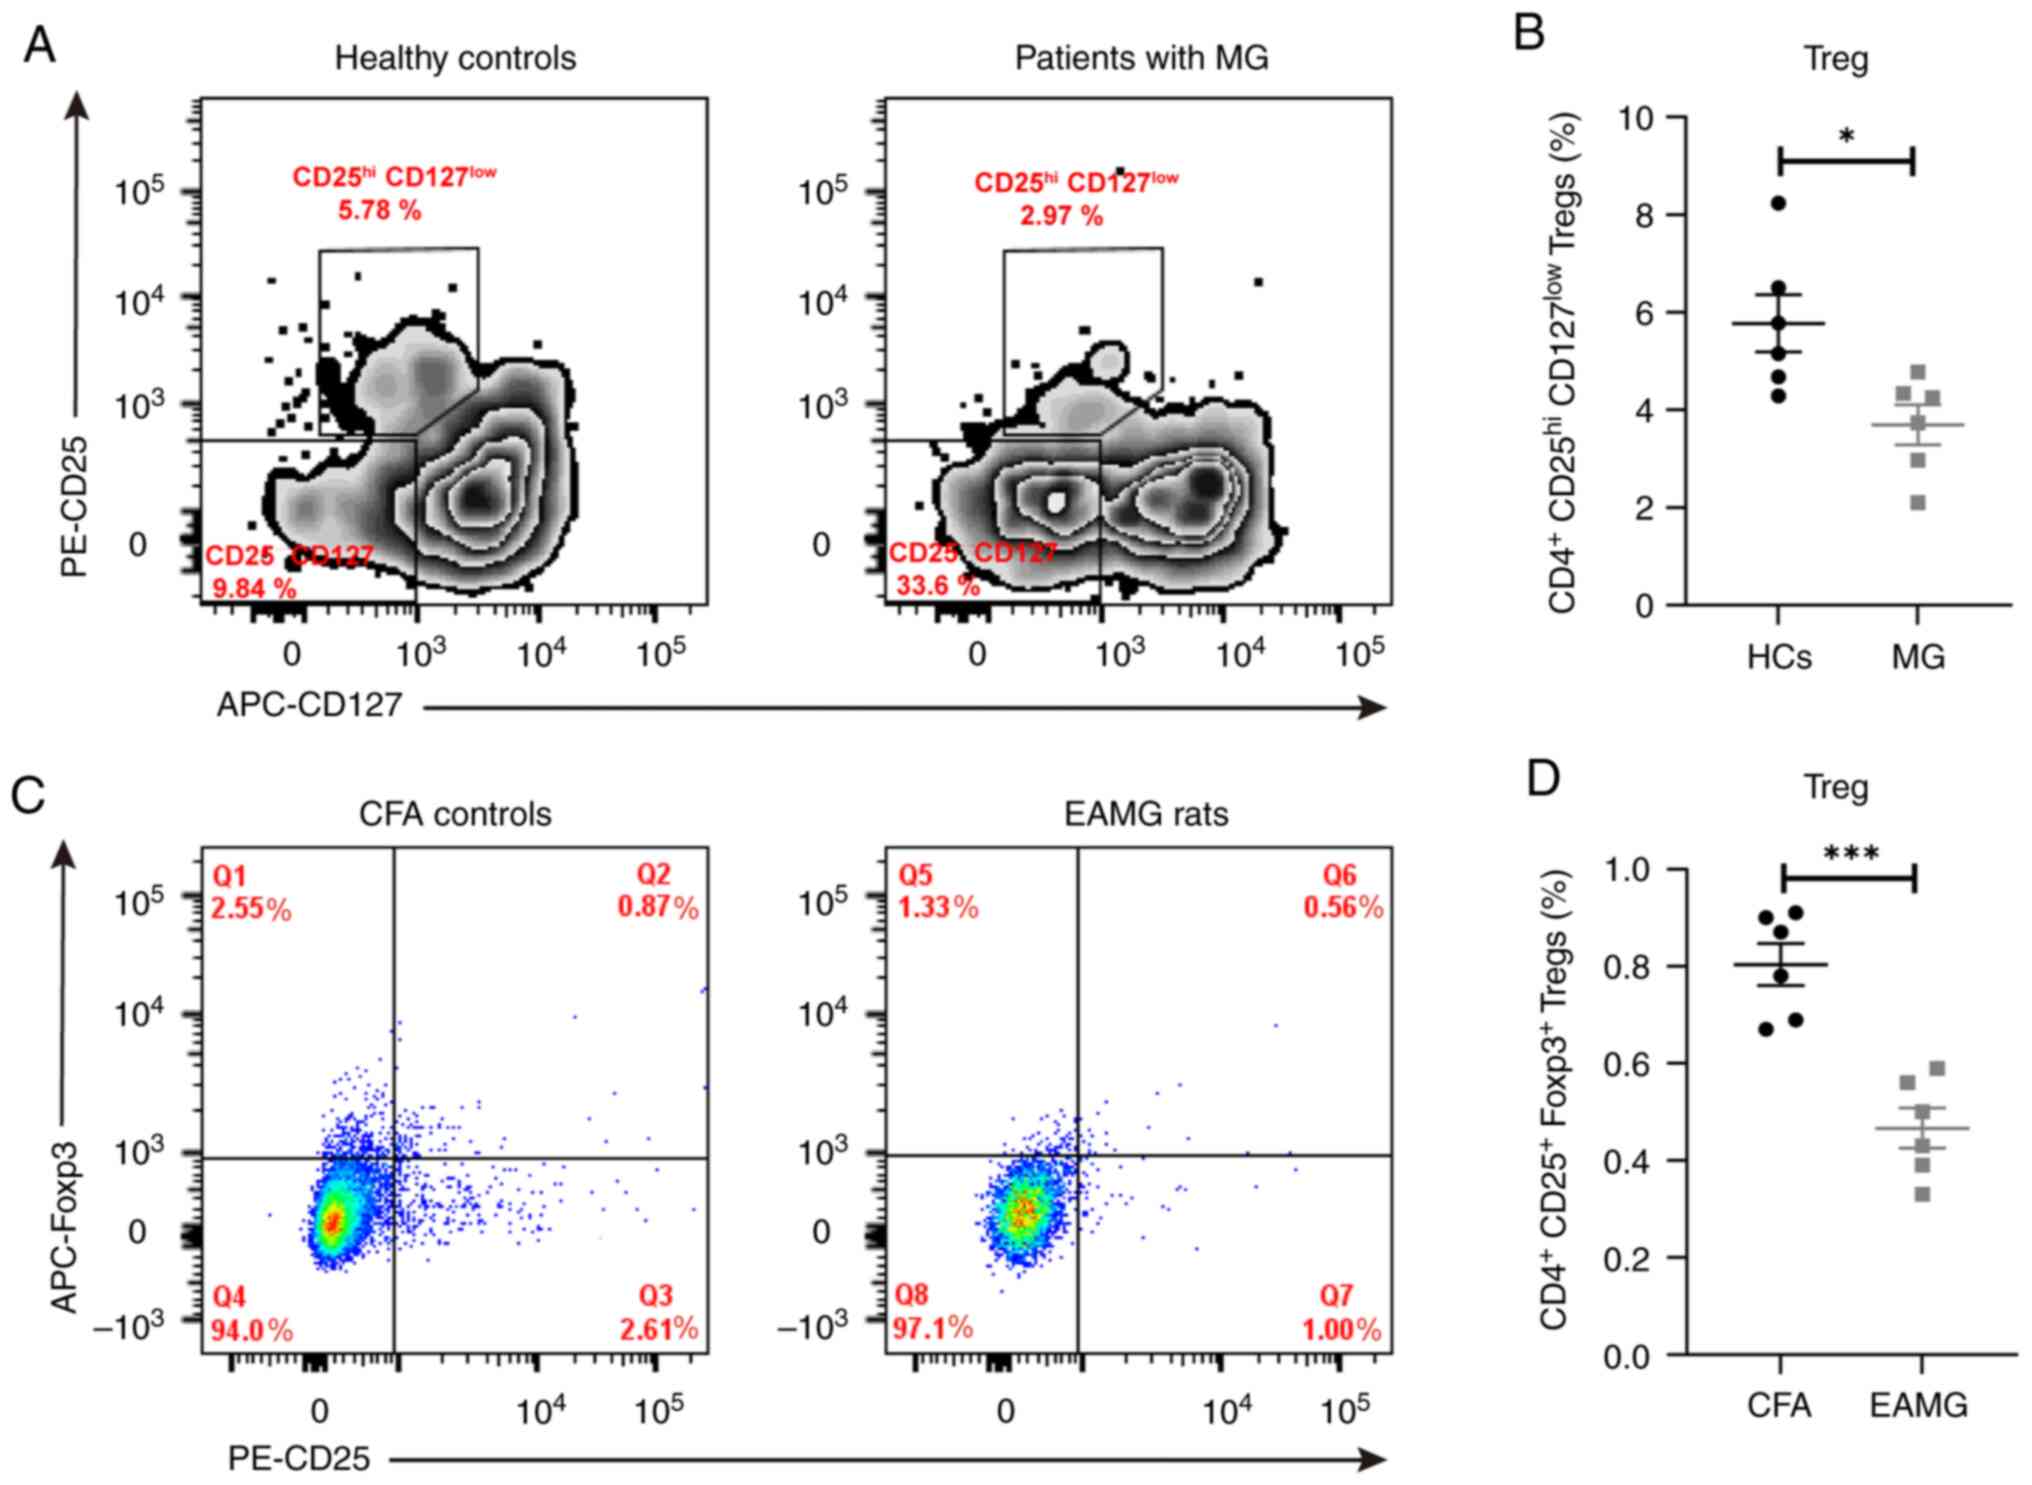
FACS analysis revealed that the proportion of
circulating Tregs was significantly decreased in patients with MG
compared with that in the control group (3.70±0.41% vs. 5.77±0.59%,
respectively; Fig. 4A and C). The proportion of Tregs was also
significantly decreased in the spleen of rats with EAMG compared
with that in the CFA group (0.47±0.04% vs. 0.80±0.04%,
respectively; Fig. 4B and D).
BCL10 is related to the activation and
suppressive function of Tregs
To clarify the biological functions of BCL10 in
CD4+ CD25+ Tregs, BCL10 expression was
knocked down using siRNA. si-NC and si-BCL10-1, -2 and -3 were
transfected into cells and BCL10 expression levels were measured
using RT-qPCR and western blotting (Fig. 5A and B). si-BCL10-1 was the most efficient
siRNA in significantly reducing the expression of BCL10 at both the
mRNA and protein levels compared with the corresponding control
groups, and was selected for use in subsequent experiments.
Additionally, the expression levels of miR-155-5p were
significantly decreased in CD4+ CD25+ Tregs
after transfection with miR-155-5p inhibitor compared with those in
the control group, as demonstrated by RT-qPCR (Fig. 5C). These results indicated that the
aforementioned transfections were successful. In addition,
miR-155-5p inhibitor transfection notably increased the mRNA and
protein expression levels of BCL10 (Fig. 5D and E). Both the levels of TGF-β1 and IL-10 in
the cell supernatant were significantly reduced in the si-BCL10
group and elevated in the miR-155-5p inhibitor group, as compared
to their respective control groups. These findings suggest that
BCL10 plays a role in the activation of Tregs (Fig. 5F and G). The CCK-8 assay was employed to assess
the suppressive capacity of CD4+ CD25+ Tregs
on the proliferation of CD4+ T cells. The results
demonstrated that CD4+ T-cell proliferation in both the
inhibitor NC group and the si-BCL10 group exhibited a significant
increase after 72 h of CD4+ T cells and CD4+
CD25+ Tregs were co-culture compared with the miR-155-5p
inhibitor group. Furthermore, after 96 h of CD4+ T cell
and CD4+/CD25+ Treg co-culture, the
proliferation of CD4+ T cells in the si-BCL10 group was
significantly higher compared with that in the si-NC group.
Additionally, the proliferation of CD4+ T cells in both
the inhibitor NC group and the si-BCL10 group was significantly
increased compared with that in the miR-155-5p inhibitor group.
These findings suggest that BCL10 knockdown resulted in a decrease
in the suppressive capacity of Tregs on CD4+ T cell
proliferation, while the inhibition of miR-155-5p expression
weakened the inhibition of the BCL10 gene, potentially exhibiting
an indirect impact on the suppressive ability of Tregs on
CD4+ T cell proliferation (Fig. 5H). Furthermore, the expression
levels of Foxp3, TGF-β1, CTLA-4 and ICOS were significantly
decreased in Tregs transfected with si-BCL10 and significantly
increased in Tregs transfected with miR-155-5p inhibitor compared
with those in the corresponding controls (Fig. 5I-L). These results indicated that
BCL10 affects the activation of Tregs and their immunosuppressive
functions.
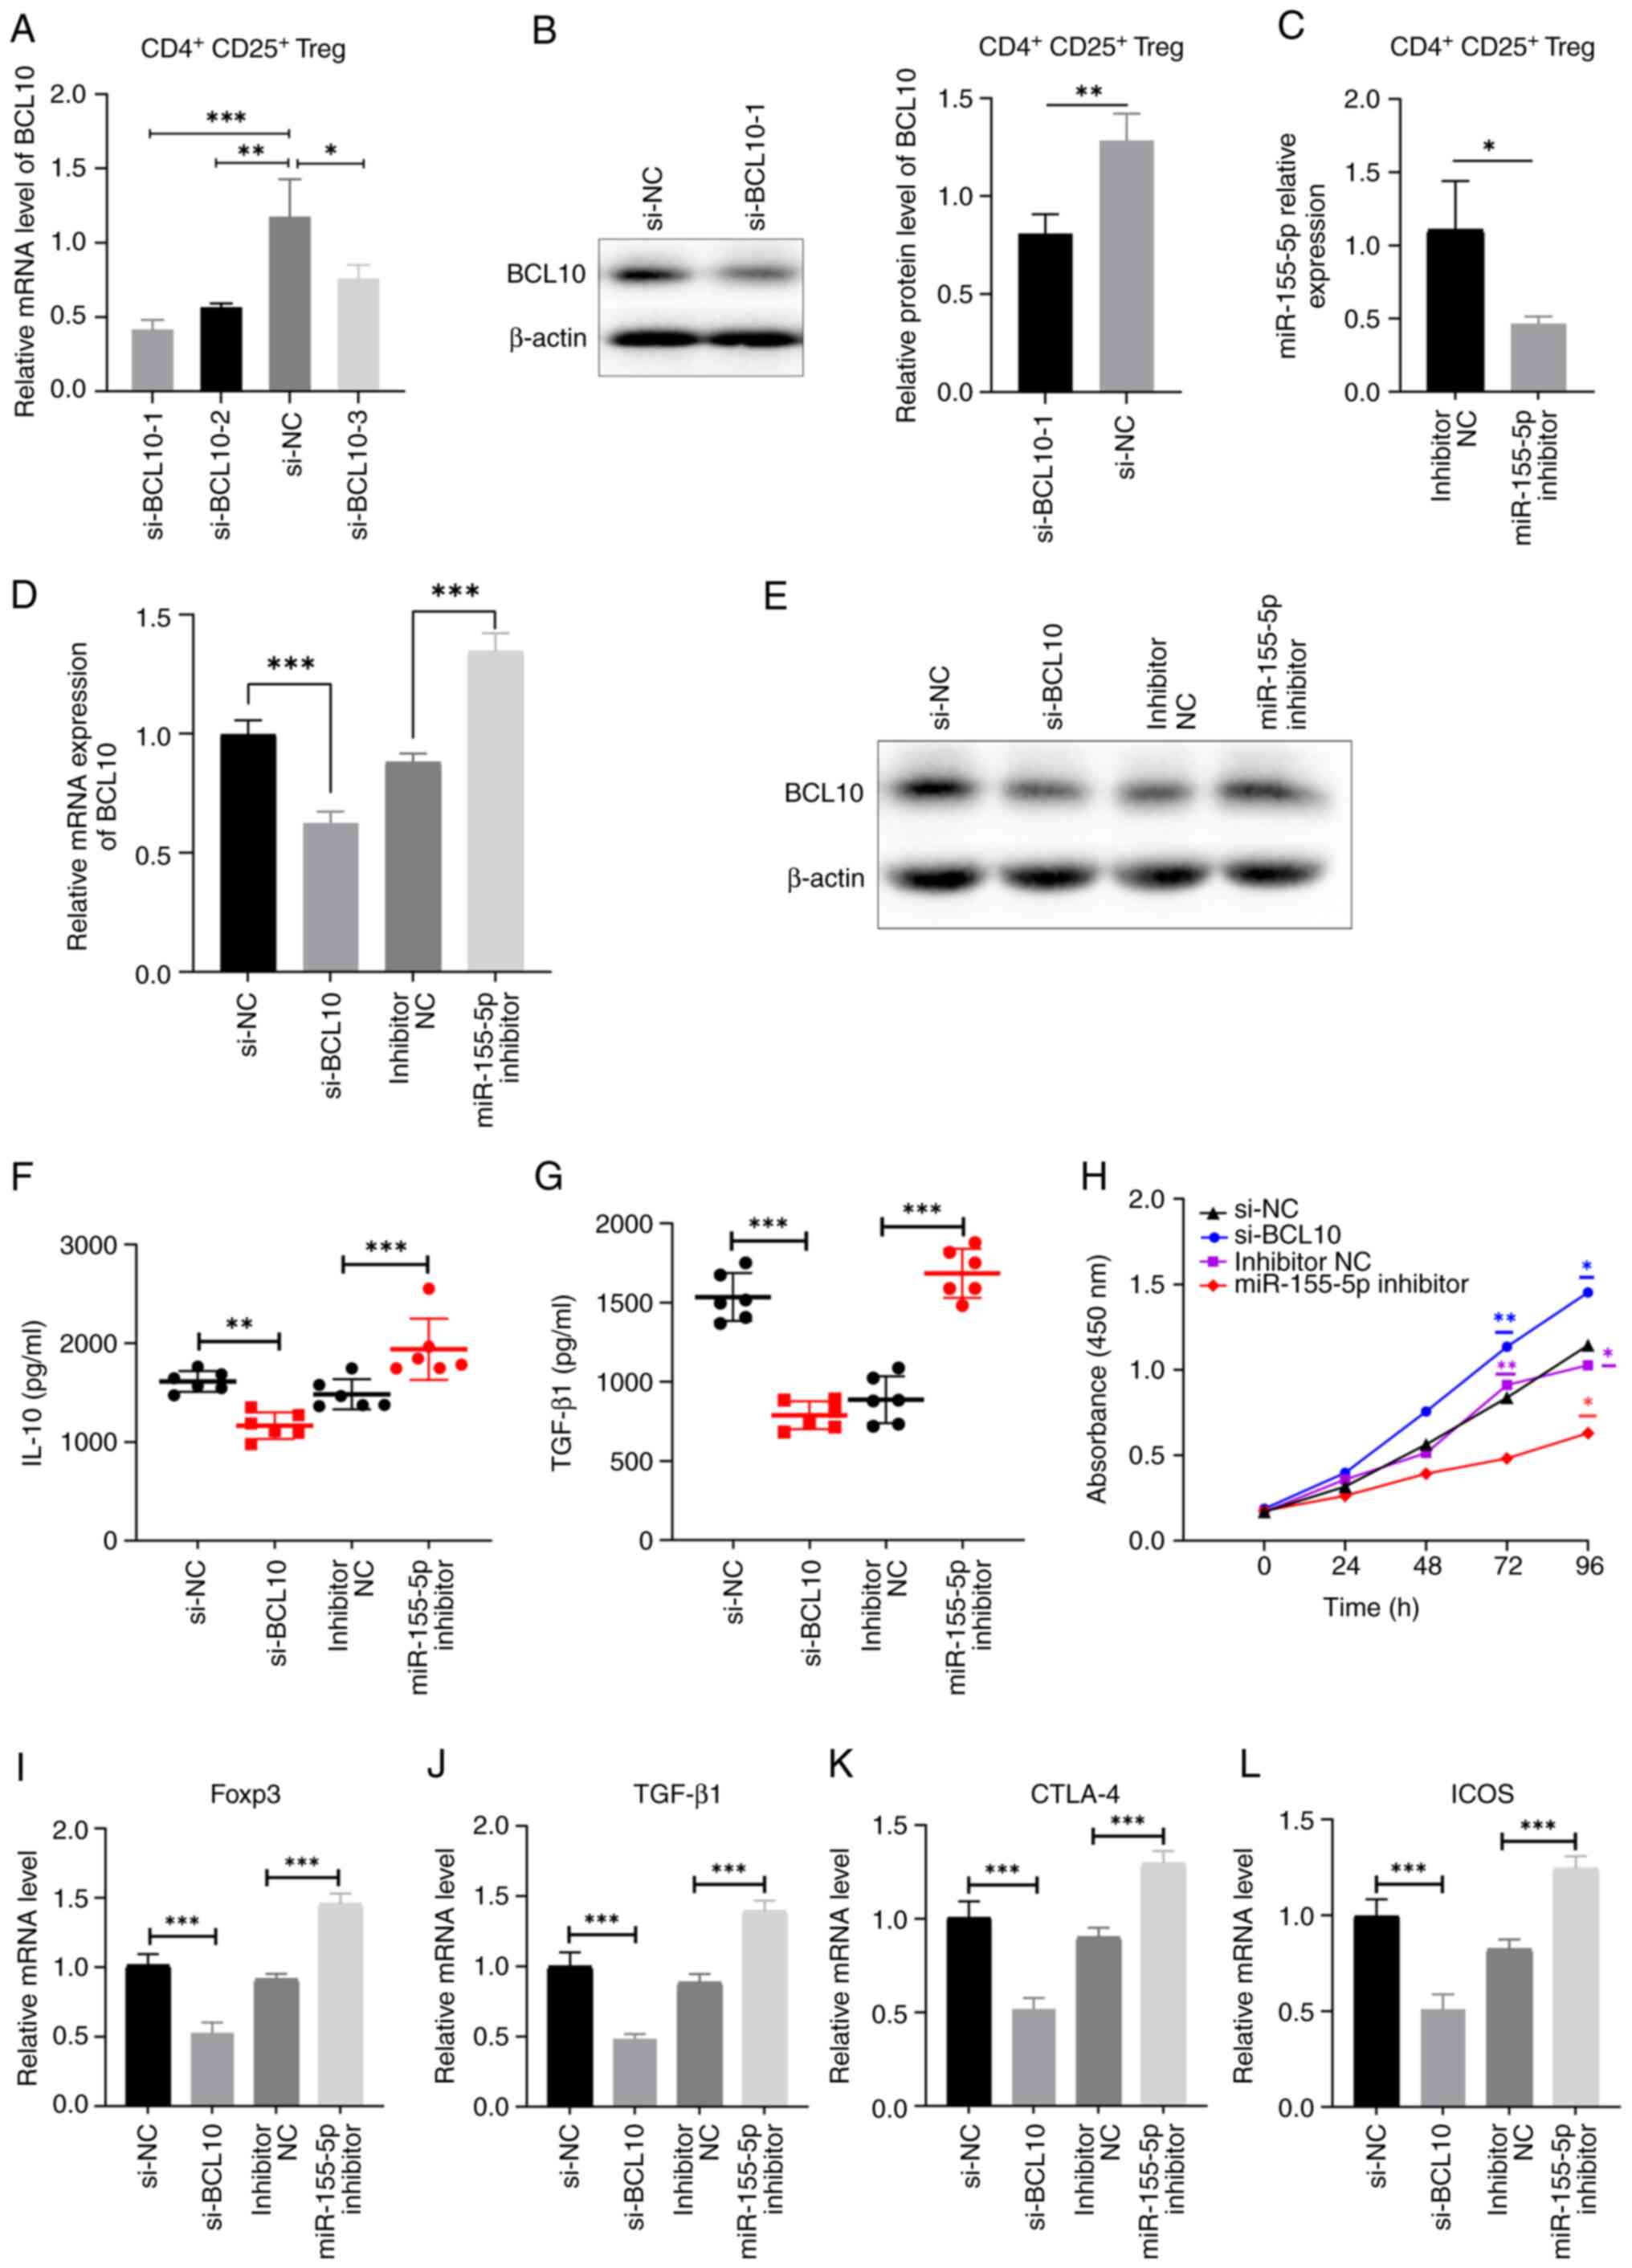 | Figure 5BCL10 mediates Treg activation and
immunosuppressive functions. (A) Reverse transcription-quantitative
PCR and (B) western blotting was used to measure the expression
levels of BCL10 in cells transfected with siRNAs targeting BCL10.
(C) Relative expression levels of miR-155-5p in CD4+
CD25+ Tregs transfected with miR-155-5p inhibitor and
inhibitor NC. BCL10 (D) mRNA and (E) protein expression levels
decreased in cells transfected with si-BCL10 and increased in the
miR-155-inhibitor group compared with controls. Serum levels of (F)
IL-10 and (G) TGF-β1 significantly decreased in the si-BCL10 group
and increased in the miR-155-inhibitor group, compared with
controls. (H) Cell Counting Kit-8 assay demonstrated that
CD4+ T cell proliferation significantly increased at 96
h following BCL10 knockdown, while significantly decreased with
miR-155-5p inhibition, compared with the respective control groups.
mRNA expression levels of (I) Foxp3, (J) TGF-β1, (K) CTLA-4 and (L)
ICOS in cells transfected with si-BCL10, miR-155-5p inhibitor and
respective transfection controls. Data are presented as the mean ±
standard error of the mean. *P<0.05,
**P<0.01 and ***P<0.001. BCL10, B-cell
lymphoma/leukemia 10; Treg, regulatory T cell, NC, negative
control; Foxp3, fork-head box protein 3; TGF-β1, transforming
growth factor β1; CTLA-4, cytotoxic T-lymphocyte-associated protein
4; ICOS, inducible T cell costimulator; si, siRNA; miR,
microRNA. |
Discussion
The current study revealed an upregulation of
miR-155-5p expression in both patients diagnosed with MG and rats
with EAMG when compared to their respective control groups. Through
use of a dual-luciferase reporter assay, it was established that
BCL10 is a direct target of miR-155-5p. Furthermore, this study
presented evidence supporting a connection between miR-155-5p/BCL10
signaling and compromised Treg function.
miRNAs have previously been reported to participate
in certain physiological processes, including immune regulation and
homeostasis (33-36).
A previous study reported that miR-142-3p targets Tet
methylcytosine dioxygenase 2 and impairs the differentiation of
Tregs and their stability in type 1 diabetes (37). Another previous study demonstrated
that miR-34a targets Foxp3, an essential regulator of Treg
development and function (38).
Furthermore, Kim et al (39) predicted that miR-342-3p could
directly target components of mTOR complex 2, which inhibits the
development of Tregs (40). Foxp3
has previously been reported to bind to an intron region of the
gene that encodes the mRNA precursor of miR-155-5p, and is
associated with the regulation of activation and immunosuppressive
function of Tregs (41,42). As immune activation and the
disruption of immune homeostasis are tightly associated with the
pathogenesis of MG, and the expression of miRNAs can be
specifically inhibited or mimicked, miRNAs that regulate the
function of Tregs may be promising targets for the management of
MG.
The precise impact of miRNAs on immune regulation
and the involvement of miRNAs and their target genes in the
pathogenesis of MG has been previously investigated, indicating
that miRNA plays an important role in the development of MG
(43). In the present study, it
was found that the expression level of miR-155-5p was significantly
increased in patients with MG, which is consistent with the results
of a previous study by Wang et al (20). The QMG score can be used to
evaluate the severity of MG and response to treatment (25,26).
The present study demonstrated that the expression level of
miR-155-5p was positively correlated with the QMG score, and thus,
the severity of MG. Meanwhile, an increased expression level of
miR-155-5p was observed in EAMG rats compared with the control
group. These results suggest that miR-155-5p is closely related to
the pathogenesis of MG.
BCL10 is member of the lymphoid caspase recruitment
domain (CARD) 11-BCL10-mucosa-associated lymphoid tissue lymphoma 1
(MALT1) and myeloid-CARD9-BCL10-MALT1 tripartite complexes that
transduce signals from immunoreceptor tyrosine-based activation
motif-coupled receptors in lymphoid and myeloid immune cells
(44). Yang et al (22) reported that BCL10 is necessary for
the development and suppressive function of Foxp3+
Tregs, the proportion of effector Tregs and the expression of a
series of Treg-cell effector and suppressive genes were
significantly decreased in BCL10-deficient Tregs. Rosenbaum et
al (21) reported that
BCL10-deficient effector Tregs cannot express CTLA-4, OX40,
programmed cell death protein 1 or T cell immunoreceptor with Ig
and ITIM domains, which are cooperatively involved in Treg-mediated
immune suppression. In the present study, the binding of miR-155-5p
and BCL10 was further confirmed by bioinformatics analysis and a
dual-luciferase reporter assay. Inhibition of miR-155-5p in
vitro resulted in increased mRNA and protein expression levels
of BCL10, further supporting the notion of BCL10 as a direct target
of miR-155-5p.
Treg dysfunction is associated with a number of
autoimmune diseases, such as systemic lupus erythematosus and
rheumatoid arthritis (45). The
present study demonstrated that the proportion of CD4+
CD25hi CD127low Tregs significantly decreased
in the peripheral blood of patients with MG and the spleens of rats
with EAMG compared with the respective controls, which suggested
that the proportion of Tregs is dysregulated in MG. Furthermore,
BCL10 knockdown significantly inhibited, while miR-155-5p inhibitor
significantly increased the activation and immunosuppressive
function of CD4+ CD25+ Tregs compared with
controls. It was found that the impaired immunosuppressive function
of Tregs was associated with the levels of BCL10 and miR-155-5p,
and miR-155-5p may regulate Treg cell activation by directly
targeting BCL10.
There are certain limitations to the present study.
These include the utilization of diverse sample sources and
distinct Foxp3 markers for the detection of Tregs in patients with
MG and the rat model of EAMG. Consequently, significant variations
in the proportion of Tregs between patients and the animal model
were observed. This discrepancy may also be attributed to the
disparate cellular origins of the human and rat samples utilized in
the flow cytometry analysis, along with the divergent selection of
cell markers for gating. Furthermore, existing literature also
suggests that the percentage of Tregs in the peripheral blood of
patients with MG surpass those in the spleen of EAMG animal models
(46-49).
Another limitation of the present study was that the demographic
information of patients with MG and healthy controls was not
strictly matched, as well as the failure to eliminate confounding
factors such as the duration of disease in patients with MG and the
unrestricted influence of drug treatment, which may influence the
validity of the clinical findings. Furthermore, the differential
expression levels of miR-155-5p and BCL10 in patients with MG and
rats with EAMG were not confirmed by gene sequencing; therefore,
future studies are required to further investigate the underlying
mechanisms of the miR-155-5p/BCL10 axis on the development of
MG.
In conclusion, the present study demonstrated that
the expression levels of BCL10 in patients with MG significantly
negatively correlated with the expression levels of miR-155-5p,
which suggests that miR-155-5p is involved in the pathogenesis of
MG and is associated with BCL10. Furthermore, Treg activation and
functional changes in the presence of BCL10 siRNA provided
additional support for the functional relevance and homeostasis of
the miR-155-5p/BCL10 axis in the regulation of Tregs in MG. In
conclusion, the present study demonstrated that miR-155-5p
inhibited the activation and immunosuppressive function of Tregs
potentially by targeting BCL10, which may constitute a future
possible target for the treatment of MG.
Acknowledgements
Not applicable.
Funding
Funding: This study was supported by the Talent Innovation and
Entrepreneurship Project of Lanzhou City, Gansu Province (grant no.
2020-RC-47), the Cuiying Scientific and Technological Innovation
Program in Lanzhou University Second Hospital (grant no.
CY2021-QN-A08), the 2022 Provincial Key Talent Project-Neural
Infection and Immune Diseases Precision Diagnosis and Treatment
Network Platform Construction (grant no. 2022-77-6) and the Lanzhou
Science and Technology Program Project (grant no. 2021-1-177).
Availability of data and materials
The datasets used and/or analyzed during the current
study are available from the corresponding author on reasonable
request.
Authors' contributions
JS and MS designed the study. QX and WZ performed
the bioinformatics analysis. JS and QX conducted the experiments.
MW and XL confirm the authenticity of all the raw data. JS, XL and
MW performed the statistical analyses and the interpretation of
data. JS and MS wrote the manuscript. QX and XL provided valuable
opinions in the process of writing the manuscript. XL and MW
revised the manuscript. All authors read and approved the final
version of the manuscript.
Ethics approval and consent to
participate
The study involving human participants was reviewed
and approved by the Lanzhou University Second Hospital Ethics
Committee (approval no. 2021A-445; Lanzhou, China). The
patients/participants provided written informed consent to
participate in the present study. The Institutional Animal Care and
Use Committee of Lanzhou University Second Hospital approved the
animal experimental protocol (approval no. 2021A-319; Lanzhou,
China).
Patient consent for publication
Not applicable.
Competing interests
The authors declare that they have no competing
interests.
References
|
1
|
Gilhus NE, Tzartos S, Evoli A, Palace J,
Burns TM and Verschuuren JJGM: Myasthenia gravis. Nat Rev Dis
Primers. 5(30)2019.PubMed/NCBI View Article : Google Scholar
|
|
2
|
Dresser L, Wlodarski R, Rezania K and
Soliven B: Myasthenia gravis: Epidemiology, pathophysiology and
clinical manifestations. J Clin Med. 10(2235)2021.PubMed/NCBI View Article : Google Scholar
|
|
3
|
Danikowski KM, Jayaraman S and Prabhakar
BS: Regulatory T cells in multiple sclerosis and myasthenia gravis.
J Neuroinflammation. 14(117)2017.PubMed/NCBI View Article : Google Scholar
|
|
4
|
Cron MA, Guillochon É, Kusner L and Le
Panse R: Role of miRNAs in normal and myasthenia gravis thymus.
Front Immunol. 11(1074)2020.PubMed/NCBI View Article : Google Scholar
|
|
5
|
Villegas JA, Van Wassenhove J, Le Panse R,
Berrih-Aknin S and Dragin N: An imbalance between regulatory T
cells and T helper 17 cells in acetylcholine receptor-positive
myasthenia gravis patients. Ann N Y Acad Sci. 1413:154–162.
2018.PubMed/NCBI View Article : Google Scholar
|
|
6
|
Balandina A, Lécart S, Dartevelle P,
Saoudi A and Berrih-Aknin S: Functional defect of regulatory
CD4(+)CD25+ T cells in the thymus of patients with autoimmune
myasthenia gravis. Blood. 105:735–741. 2005.PubMed/NCBI View Article : Google Scholar
|
|
7
|
Thiruppathi M, Rowin J, Ganesh B, Sheng
JR, Prabhakar BS and Meriggioli MN: Impaired regulatory function in
circulating CD4(+)CD25(high)CD127(low/-) T cells in patients with
myasthenia gravis. Clin Immunol. 145:209–223. 2012.PubMed/NCBI View Article : Google Scholar
|
|
8
|
Battaglia A, Di Schino C, Fattorossi A,
Scambia G and Evoli A: Circulating CD4+CD25+ T regulatory and
natural killer T cells in patients with myasthenia gravis: A flow
cytometry study. J Biol Regul Homeost Agents. 19:54–62.
2005.PubMed/NCBI
|
|
9
|
Fuchs S, Aricha R, Reuveni D and Souroujon
MC: Experimental autoimmune myasthenia gravis (EAMG): From
immunochemical characterization to therapeutic approaches. J
Autoimmun. 54:51–59. 2014.PubMed/NCBI View Article : Google Scholar
|
|
10
|
Gradolatto A, Nazzal D, Truffault F,
Bismuth J, Fadel E, Foti M and Berrih-Aknin S: Both treg cells and
tconv cells are defective in the myasthenia gravis thymus: Roles of
IL-17 and TNF-α. J Autoimmun. 52:53–63. 2014.PubMed/NCBI View Article : Google Scholar
|
|
11
|
Rodríguez-Perea AL, Arcia ED, Rueda CM and
Velilla PA: Phenotypical characterization of regulatory T cells in
humans and rodents. Clin Exp Immunol. 185:281–291. 2016.PubMed/NCBI View Article : Google Scholar
|
|
12
|
Gavin MA, Rasmussen JP, Fontenot JD, Vasta
V, Manganiello VC, Beavo JA and Rudensky AY: Foxp3-dependent
programme of regulatory T-cell differentiation. Nature.
445:771–775. 2007.PubMed/NCBI View Article : Google Scholar
|
|
13
|
Vrolix K, Fraussen J, Losen M, Stevens J,
Lazaridis K, Molenaar PC, Somers V, Bracho MA, Le Panse R,
Stinissen P, et al: Clonal heterogeneity of thymic B cells from
early-onset myasthenia gravis patients with antibodies against the
acetylcholine receptor. J Autoimmun. 52:101–112. 2014.PubMed/NCBI View Article : Google Scholar
|
|
14
|
Serr I, Fürst RW, Ott VB, Scherm MG,
Nikolaev A, Gökmen F, Kälin S, Zillmer S, Bunk M, Weigmann B, et
al: miRNA92a targets KLF2 and the phosphatase PTEN signaling to
promote human T follicular helper precursors in T1D islet
autoimmunity. Proc Natl Acad Sci USA. 113:E6659–E6668.
2016.PubMed/NCBI View Article : Google Scholar
|
|
15
|
Serr I, Scherm MG, Zahm AM, Schug J, Flynn
VK, Hippich M, Kälin S, Becker M, Achenbach P, Nikolaev A, et al: A
miRNA181a/NFAT5 axis links impaired T cell tolerance induction with
autoimmune type 1 diabetes. Sci Transl Med.
10(eaag1782)2018.PubMed/NCBI View Article : Google Scholar
|
|
16
|
Zhou X, Jeker LT, Fife BT, Zhu S, Anderson
MS, McManus MT and Bluestone JA: Selective miRNA disruption in T
reg cells leads to uncontrolled autoimmunity. J Exp Med.
205:1983–1991. 2008.PubMed/NCBI View Article : Google Scholar
|
|
17
|
O'Connell RM, Kahn D, Gibson WS, Round JL,
Scholz RL, Chaudhuri AA, Kahn ME, Rao DS and Baltimore D:
MicroRNA-155 promotes autoimmune inflammation by enhancing
inflammatory T cell development. Immunity. 33:607–619.
2010.PubMed/NCBI View Article : Google Scholar
|
|
18
|
Seddiki N, Brezar V, Ruffin N, Lévy Y and
Swaminathan S: Role of miR-155 in the regulation of lymphocyte
immune function and disease. Immunology. 142:32–38. 2014.PubMed/NCBI View Article : Google Scholar
|
|
19
|
Ghafouri-Fard S, Azimi T, Hussen BM,
Taheri M and Jalili Khoshnoud R: A review on the role of non-coding
RNAs in the pathogenesis of myasthenia gravis. Int J Mol Sci.
22(12964)2021.PubMed/NCBI View Article : Google Scholar
|
|
20
|
Wang YZ, Tian FF, Yan M, Zhang JM, Liu Q,
Lu JY, Zhou WB, Yang H and Li J: Delivery of an miR155 inhibitor by
anti-CD20 single-chain antibody into B cells reduces the
acetylcholine receptor-specific autoantibodies and ameliorates
experimental autoimmune myasthenia gravis. Clin Exp Immunol.
176:207–221. 2014.PubMed/NCBI View Article : Google Scholar
|
|
21
|
Rosenbaum M, Gewies A, Pechloff K, Heuser
C, Engleitner T, Gehring T, Hartjes L, Krebs S, Krappmann D,
Kriegsmann M, et al: Bcl10-controlled Malt1 paracaspase activity is
key for the immune suppressive function of regulatory T cells. Nat
Commun. 10(2352)2019.PubMed/NCBI View Article : Google Scholar
|
|
22
|
Yang D, Zhao X and Lin X: Bcl10 is
required for the development and suppressive function of
Foxp3+ regulatory T cells. Cell Mol Immunol. 18:206–218.
2021.PubMed/NCBI View Article : Google Scholar
|
|
23
|
Wei TT, Cheng Z, Hu ZD, Zhou L and Zhong
RQ: Upregulated miR-155 inhibits inflammatory response induced by
C. albicans in human monocytes derived dendritic cells via
targeting p65 and BCL-10. Ann Transl Med. 7(758)2019.PubMed/NCBI View Article : Google Scholar
|
|
24
|
Berrih-Aknin S, Frenkian-Cuvelier M and
Eymard B: Diagnostic and clinical classification of autoimmune
myasthenia gravis. J Autoimmun. 48–49, 143-148. 2014.PubMed/NCBI View Article : Google Scholar
|
|
25
|
Jaretzki A III, Barohn RJ, Ernstoff RM,
Kaminski HJ, Keesey JC, Penn AS and Sanders DB: Myasthenia gravis:
Recommendations for clinical research standards. Task force of the
medical scientific advisory board of the myasthenia gravis
foundation of America. Neurology. 55:16–23. 2000.PubMed/NCBI View Article : Google Scholar
|
|
26
|
Bedlack RS, Simel DL, Bosworth H, Samsa G,
Tucker-Lipscomb B and Sanders DB: Quantitative myasthenia gravis
score: Assessment of responsiveness and longitudinal validity.
Neurology. 64:1968–1970. 2005.PubMed/NCBI View Article : Google Scholar
|
|
27
|
Baggi F, Annoni A, Ubiali F, Milani M,
Longhi R, Scaioli W, Cornelio F, Mantegazza R and Antozzi C:
Breakdown of tolerance to a self-peptide of acetylcholine receptor
alpha-subunit induces experimental myasthenia gravis in rats. J
Immunol. 172:2697–2703. 2004.PubMed/NCBI View Article : Google Scholar
|
|
28
|
Laferriere CA and Pang DS: Review of
intraperitoneal injection of sodium pentobarbital as a method of
euthanasia in laboratory rodents. J Am Assoc Lab Anim Sci.
59:254–263. 2020.PubMed/NCBI View Article : Google Scholar
|
|
29
|
Losen M, Martinez-Martinez P, Molenaar PC,
Lazaridis K, Tzartos S, Brenner T, Duan RS, Luo J, Lindstrom J and
Kusner L: Standardization of the experimental autoimmune myasthenia
gravis (EAMG) model by immunization of rats with Torpedo
californica acetylcholine receptors-recommendations for methods and
experimental designs. Exp Neurol. 270:18–28. 2015.PubMed/NCBI View Article : Google Scholar
|
|
30
|
Cossarizza A, Chang HD, Radbruch A, Acs A,
Adam D, Adam-Klages S, Agace WW, Aghaeepour N, Akdis M, Allez M, et
al: Guidelines for the use of flow cytometry and cell sorting in
immunological studies (second edition). Eur J Immunol.
49:1457–1973. 2019.PubMed/NCBI View Article : Google Scholar
|
|
31
|
Robertson B, Dalby AB, Karpilow J,
Khvorova A, Leake D and Vermeulen A: Specificity and functionality
of microRNA inhibitors. Silence. 1(10)2010.PubMed/NCBI View Article : Google Scholar
|
|
32
|
Livak KJ and Schmittgen TD: Analysis of
relative gene expression data using real-time quantitative PCR and
the 2(-Delta Delta C(T)) method. Methods. 25:402–408.
2001.PubMed/NCBI View Article : Google Scholar
|
|
33
|
Ha M and Kim VN: Regulation of microRNA
biogenesis. Nat Rev Mol Cell Biol. 15:509–524. 2014.PubMed/NCBI View Article : Google Scholar
|
|
34
|
Landgraf P, Rusu M, Sheridan R, Sewer A,
Iovino N, Aravin A, Pfeffer S, Rice A, Kamphorst AO, Landthaler M,
et al: A mammalian microRNA expression atlas based on small RNA
library sequencing. Cell. 129:1401–1414. 2007.PubMed/NCBI View Article : Google Scholar
|
|
35
|
Muljo SA, Ansel KM, Kanellopoulou C,
Livingston DM, Rao A and Rajewsky K: Aberrant T cell
differentiation in the absence of Dicer. J Exp Med. 202:261–269.
2005.PubMed/NCBI View Article : Google Scholar
|
|
36
|
Cobb BS, Nesterova TB, Thompson E,
Hertweck A, O'Connor E, Godwin J, Wilson CB, Brockdorff N, Fisher
AG, Smale ST and Merkenschlager M: T cell lineage choice and
differentiation in the absence of the RNase III enzyme Dicer. J Exp
Med. 201:1367–1373. 2005.PubMed/NCBI View Article : Google Scholar
|
|
37
|
Scherm MG, Serr I, Zahm AM, Schug J,
Bellusci S, Manfredini R, Salb VK, Gerlach K, Weigmann B, Ziegler
AG, et al: miRNA142-3p targets Tet2 and impairs Treg
differentiation and stability in models of type 1 diabetes. Nat
Commun. 10(5697)2019.PubMed/NCBI View Article : Google Scholar
|
|
38
|
Alharris E, Alghetaa H, Seth R, Chatterjee
S, Singh NP, Nagarkatti M and Nagarkatti P: Resveratrol attenuates
allergic asthma and associated inflammation in the lungs through
regulation of miRNA-34a that targets FoxP3 in mice. Front Immunol.
9(2992)2018.PubMed/NCBI View Article : Google Scholar
|
|
39
|
Kim D, Nguyen QT, Lee J, Lee SH, Janocha
A, Kim S, Le HT, Dvorina N, Weiss K, Cameron MJ, et al:
Anti-inflammatory roles of glucocorticoids are mediated by
Foxp3+ regulatory T cells via a miR-342-dependent
mechanism. Immunity. 53:581–596.e5. 2020.PubMed/NCBI View Article : Google Scholar
|
|
40
|
Perl A: Activation of mTOR (mechanistic
target of rapamycin) in rheumatic diseases. Nat Rev Rheumatol.
12:169–182. 2016.PubMed/NCBI View Article : Google Scholar
|
|
41
|
Lu LF, Thai TH, Calado DP, Chaudhry A,
Kubo M, Tanaka K, Loeb GB, Lee H, Yoshimura A, Rajewsky K and
Rudensky AY: Foxp3-dependent microRNA155 confers competitive
fitness to regulatory T cells by targeting SOCS1 protein. Immunity.
30:80–91. 2009.PubMed/NCBI View Article : Google Scholar
|
|
42
|
Zheng Y, Josefowicz SZ, Kas A, Chu TT,
Gavin MA and Rudensky AY: Genome-wide analysis of Foxp3 target
genes in developing and mature regulatory T cells. Nature.
445:936–940. 2007.PubMed/NCBI View Article : Google Scholar
|
|
43
|
Liu X, Luo M, Meng H, Zeng Q, Xu L, Hu B,
Luo Y, Liu C, Luo Z and Yang H: MiR-181a regulates CD4+
T cell activation and differentiation by targeting IL-2 in the
pathogenesis of myasthenia gravis. Eur J Immunol: Jul 26, 2019
(Epub ahead of print).
|
|
44
|
Deretic V, Saitoh T and Akira S: Autophagy
in infection, inflammation and immunity. Nat Rev Immunol.
13:722–737. 2013.PubMed/NCBI View Article : Google Scholar
|
|
45
|
Scheinecker C, Göschl L and Bonelli M:
Treg cells in health and autoimmune diseases: New insights from
single cell analysis. J Autoimmun. 110(102376)2020.PubMed/NCBI View Article : Google Scholar
|
|
46
|
Rao J, Li S, Wang Q, Cheng Q, Ji Y, Fu W,
Huang H, Shi L and Wu X: Comparison of peripheral blood regulatory
T cells and functional subsets between ocular and generalized
myasthenia gravis. Front Med (Lausanne). 9(851808)2022.PubMed/NCBI View Article : Google Scholar
|
|
47
|
Kohler S, Keil TOP, Hoffmann S, Swierzy M,
Ismail M, Rückert JC, Alexander T and Meisel A: CD4+
FoxP3+ T regulatory cell subsets in myasthenia gravis
patients. Clin Immunol. 179:40–46. 2017.PubMed/NCBI View Article : Google Scholar
|
|
48
|
Gertel-Lapter S, Mizrachi K, Berrih-Aknin
S, Fuchs S and Souroujon MC: Impairment of regulatory T cells in
myasthenia gravis: Studies in an experimental model. Autoimmun Rev.
12:894–903. 2013.PubMed/NCBI View Article : Google Scholar
|
|
49
|
Song J, Xi JY, Yu WB, Yan C, Luo SS, Zhou
L, Zhu WH, Lu JH, Dong Q, Xiao BG and Zhao CB: Inhibition of ROCK
activity regulates the balance of Th1, Th17 and Treg cells in
myasthenia gravis. Clin Immunol. 203:142–153. 2019.PubMed/NCBI View Article : Google Scholar
|