Introduction
Global incidence rate of non-tuberculous
mycobacteria (NTM) pulmonary disease has been increasing rapidly
(1,2). In the United States, the infection
rate and prevalence of NTM exceed those of tuberculosis (TB)
(3-5).
NTM pulmonary disease is globally prevalent. NTM is currently a key
public health problem (6). The
growth of NTM is slower than that of pulmonary TB, making the
disease course longer. Further, the overall cure rate is low due to
resistance to first-line anti-TB drugs. NTM predominantly affects
the lungs (7), with patients
exhibiting chronic basic diseases and low immunity being more
susceptible to NTM pulmonary disease. The imaging manifestations
and clinical features of NTM are similar to TB, resulting in a high
rate of misdiagnosis (7). If
patients with NTM pulmonary disease are treated for TB, the
treatment opportunity will be delayed (8). Sputum mycobacterium culture and
strain identification are currently the primary methods employed to
distinguish NTM pulmonary disease from TB. However, both methods
are time-consuming, arduous and require strict laboratory standards
(9). Additionally, the
identification of strains is dependent upon a positive sputum
mycobacterium culture, which poses a diagnostic challenge. However,
the employment of computed tomography (CT) offers advantages,
including rapid imaging, widespread availability and
high-resolution density, thereby enabling feasible discrimination
between diseases (10). Despite
the advantages of CT, due to the high similarity of the
pathogenesis and pathological features of NTM and TB, there is no
reliable image feature to distinguish them (11). Consolidation is a common and
important CT feature of NTM and TB (12). Consolidation characteristics of the
diseases are similar, making it difficult to distinguish with the
naked eye. CT-based radiomics has exhibited potential in the
diagnosis and differentiation of pulmonary diseases through
high-throughput extraction and mining data features (13,14).
Due to differences in pathology between these two diseases
(15), the possibility of
identifying the diseases is further enhanced. In the present study,
the value of CT-based radiomics analysis of consolidation
characteristics in differentiation of NTM pulmonary disease from TB
was investigated. The present study aimed to establish an effective
classifier to provide a novel simple diagnosis method for NTM and
TB.
Materials and methods
Patient population and ethical
approval
The present study was approved by Shandong Public
Health Clinical Center (Shandong Provincial Chest Hospital) Ethics
Committee and the requirement for consent for this retrospective
analysis was waived (approval no. 2019XKYYEC-29). Subsequently, 89
patients with NTM pulmonary disease and 104 with TB undergoing CT
imaging in the Shandong Public Health Clinical Center between
January 2013 and July 2018 were retrospectively analyzed. At the
same time, 27 patients with NTM pulmonary disease and 30 with TB
undergoing CT imaging in the Jinan Infectious Disease Hospital
(Jinan, China) were also collected for the external validation of
the model. All patients with NTM pulmonary disease were diagnosed
twice using sputum culture and strains were identified as the same
pathogenic bacteria (16,17). All patients with TB were identified
using TB diagnosis and classification standard' issued by the China
National Health Service Commission on November 9th, 2017(18). The sputum smears of each patient
was positive for acid-fast bacilli at least once and was identified
as Mycobacterium tuberculosis complex using the colloidal
gold method (19). The inclusion
criteria were as follows: i) Clinical symptoms upon laboratory
examination or imaging consistent with TB infection; ii) CT images
of the lung window and mediastinal window exhibited consolidation
and iii) treatment was effective. Exclusion criteria were as
follows: i) No consolidation features in CT images; ii) CT images
displayed motion artifacts, poor image quality, large differences
in scanning conditions or inconsistent layer thickness; iii)
clinical suspicion of mixed infection and iv) presence of
non-infectious disease with similar presentation. Based on these
criteria, 11 patients with NTM pulmonary disease and 23 with TB
were excluded, leaving a total of 75 patients with NTM pulmonary
disease, including 46 males and 29 females (mean age, 57.1±13.5
years; range 23-86 years), and 81 with TB, including 53 males and
28 females (mean age, 45.4±18.7 years; range, 17-90 years).
CT examination
All patients whose lungs had been affected underwent
a plain chest scan using a Philips 64-slice spiral CT scanner
(Philips Ingenuity) before treatment and quality correction
standards were met prior to the CT scan. The patients were in the
supine posture and underwent a scan extending from lung apices to
the upper abdomen, with imaging acquisition commencing 5 cm
inferior to the diaphragmatic dome at maximum inhalation. The CT
scanning parameters were as follows: Diameter of the inspected
detector, 64.000x0.625 mm; the rotation time was 0.5 sec; the
pitch, 1.375; the tube voltage was 120 kV; the tube current was
250-400 mA, which was modulated using an automatic tube current;
Field of view (FOV), 35-40 cm; matrix was 512x512 thickness of the
slice, 5 mm.
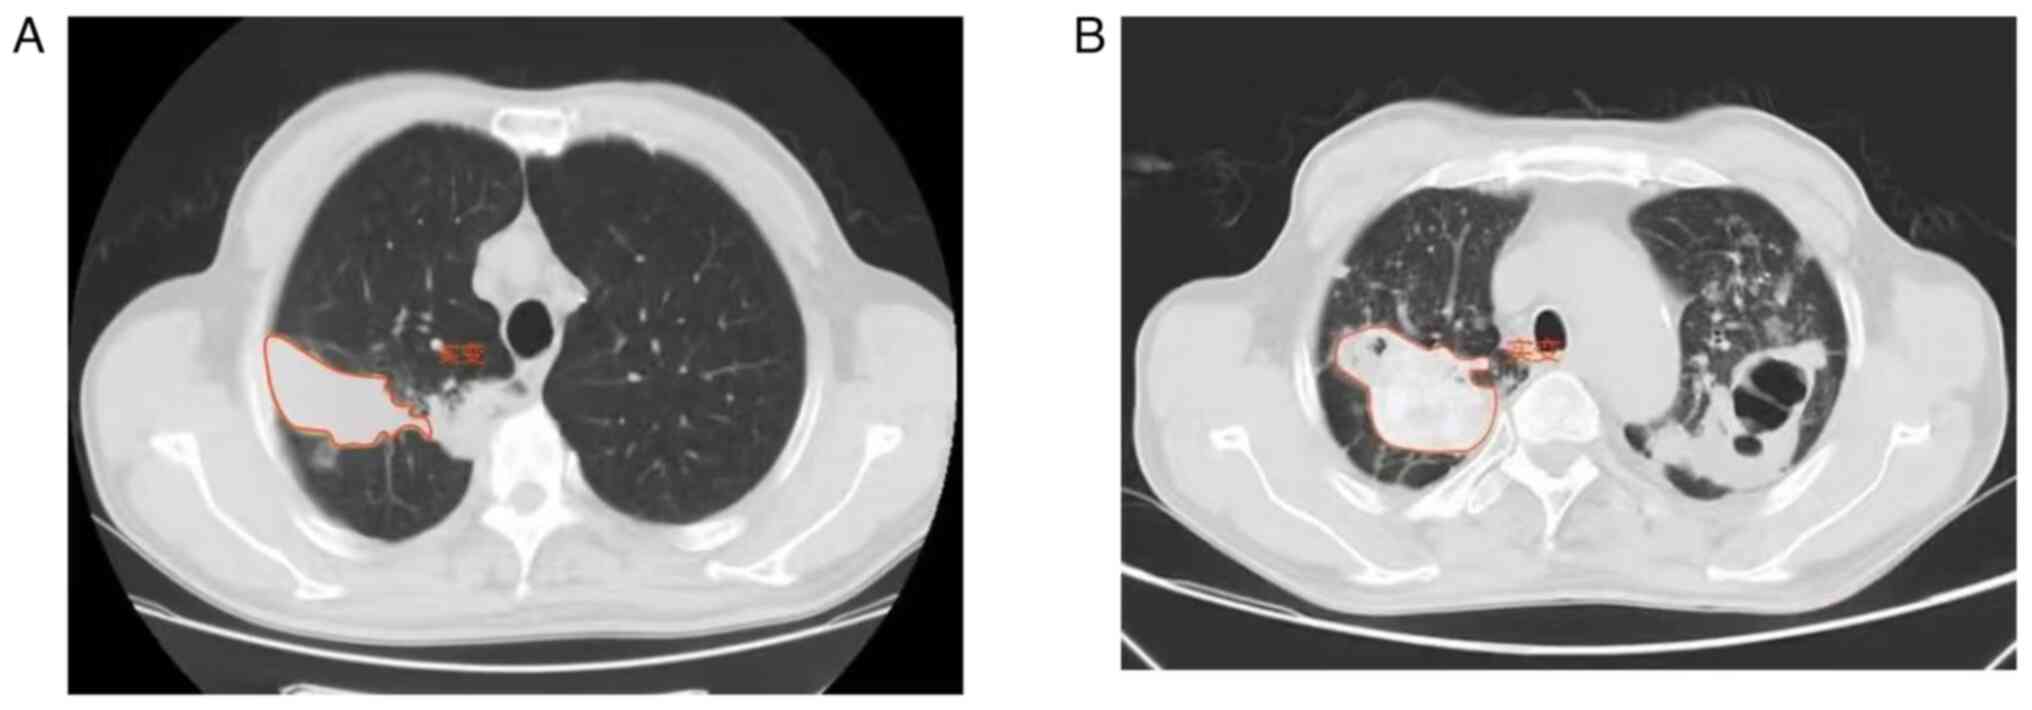
Image pre-processing, segmentation and
extraction of radiomics features
All images were uploaded to Radiance's Radcloud
platform V7.9 mics.huiyihuiying.com (Huiying Medical Technology
Co., Ltd.) for further study. A total of two radiologists (10 and
25 years of experience) with expertise in chest disease assessed
and delineated the consolidations in the lung window CT images
(Window Width 1500, Window Level-500). The radiologists were
blinded to clinical information. The radiologists delineated the
outline of the consolidation on all contiguous slices by manually
sketching the region of interest (ROI), with the contour line in
close proximity to the outer edge of the consolidation. The ROI
entirely encompassed the consolidation. If the consolidation was
close to the mediastinum, chest wall and diaphragm, the
radiologists drew 1 mm along the outside of the contour of the
mediastinum, chest wall and diaphragm to avoid delineating the
non-consolidation. The halo caused by the surrounding exudation was
not included. Finally, a senior radiologist reassessed all ROIs. If
the difference was ≥5%, the senior radiologist determined the
boundary of the ROI (20).
Radiomic feature extraction and
selection
Using Radcloud platform, 1,409 radiomics
quantitative image features were extracted from the CT images. The
functions were classified into four groups. The first group
(first-order statistics) comprised 18 features that quantitatively
described the distribution of voxel intensity in the CT images
through common and basic indicators. The second group (features
based on shape and size) contained 14 three-dimensional features
that reflected the shape and size of the area. The third group
(texture features) consisted of grey level run-length and
co-occurrence texture matrices and size zone matrix and neighboring
gray tone difference and gray level dependence matrix. The fourth
group (1,302 features through 14 filters) were exponential, square,
square root, logarithm, gradient, local binary patterns-2D and
wavelets [low-high-low (LHL), low-high-high (LHH), high-low-low
(HLL), (LLH), high-low-high (HLH), high-high-high (HHH),
high-high-low (HHL), and low-low-low (LLL)].
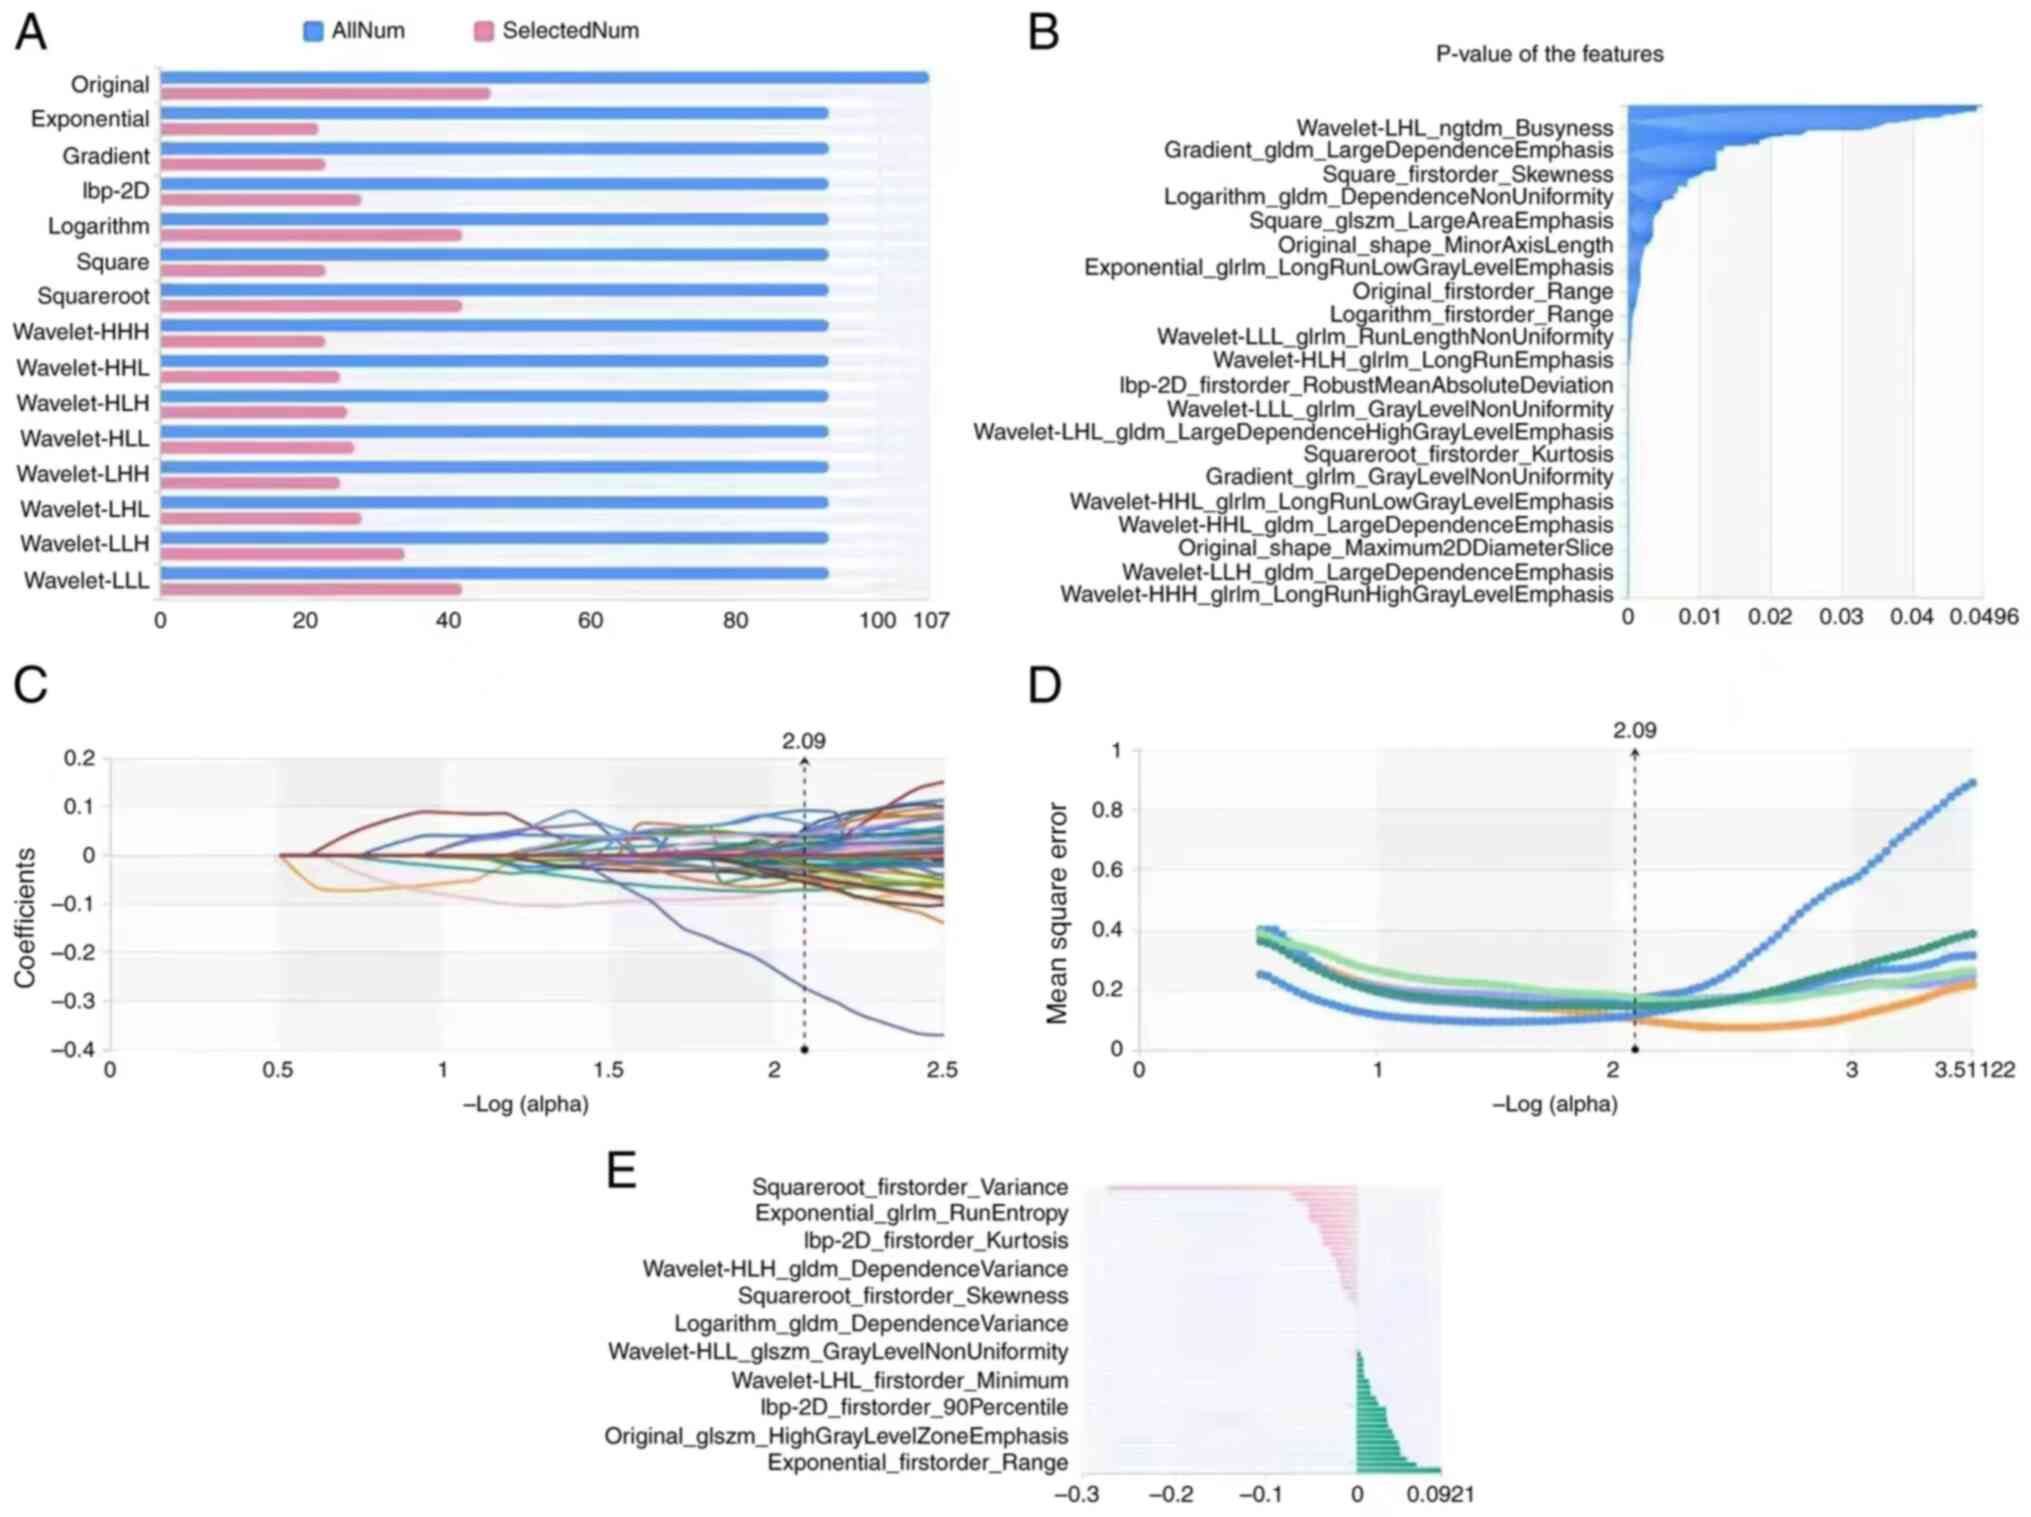
To enhance the model reliability and decrease the
feature dimension, three methods were used. Variance threshold was
used to remove features with variance <0.8. Secondly, the k-best
method (21) was employed to
remove features with P-value >0.05. To establish a more refined
model, the least absolute shrinkage and selection operator (LASSO,
version 1.0.2) algorithm was used to formulate a penalty function
to compress select regression coefficients (22). It includes three steps: LASSO path,
mean Square Error path and coefficients in LASSO model. These steps
were performed 50 times in the case of random initialization.
Finally, the most frequent fixed features were selected for
modeling.
Statistical analysis
Based on the selected features, numerous supervised
learning classifiers were used for classification (version 7.9,
Huiying Medical Technology Co., Ltd.) analysis (23). Three supervised learning models
were employed in the present study: K-nearest neighbor (KNN),
support vector machine (SVM) and logistic regression (LR). KNN is a
basic classification and regression method (24). SVM is a generalized linear
classifier for binary classification of data according to
supervised learning, with decision boundary being the maximum
margin hyperplane for learning samples (25). LR is a generalized linear model, in
which logistic function is used for regression and classification
(primarily 0/1 classification). The area analysis under the
receiver operating characteristic (ROC) curve (AUC) was used to
illustrate the predictive performance of radiomic characteristics.
When the sensitivity and specificity were the largest, the optimal
cut-off value was selected. A total of 4 indicators to evaluate the
AUC and prediction accuracy of the training and validation sets. It
includes P [accuracy=true positive/(true positive + false
positive)]; R [recall rate=true positive/(true positive + false
negative)]; F1 score [1 score=P * r * 2/(P + R)]; Support: to
evaluate the performance of the classifier. P<0.05 was
considered to indicate a statistically significant difference.
Results
A total of 381 ROIs (203 NTM pulmonary disease and
178 TB) were manually outlined (Fig.
1A and B) in the CT images of
192 patients (Table I).
Computer-generated random numbers were utilized to assign 70% of
ROI to the training data cohort and 30% to the verification data
cohort. Using the variance threshold method, 456 features were
selected for the models. Subsequently, best K method was employed
in the selection of 315 features and then the LASSO algorithm was
used to select 52 optimal features (Fig. 2). Of 52 radiomics features, 34 were
texture analysis, one was shapes and 17 were first-order
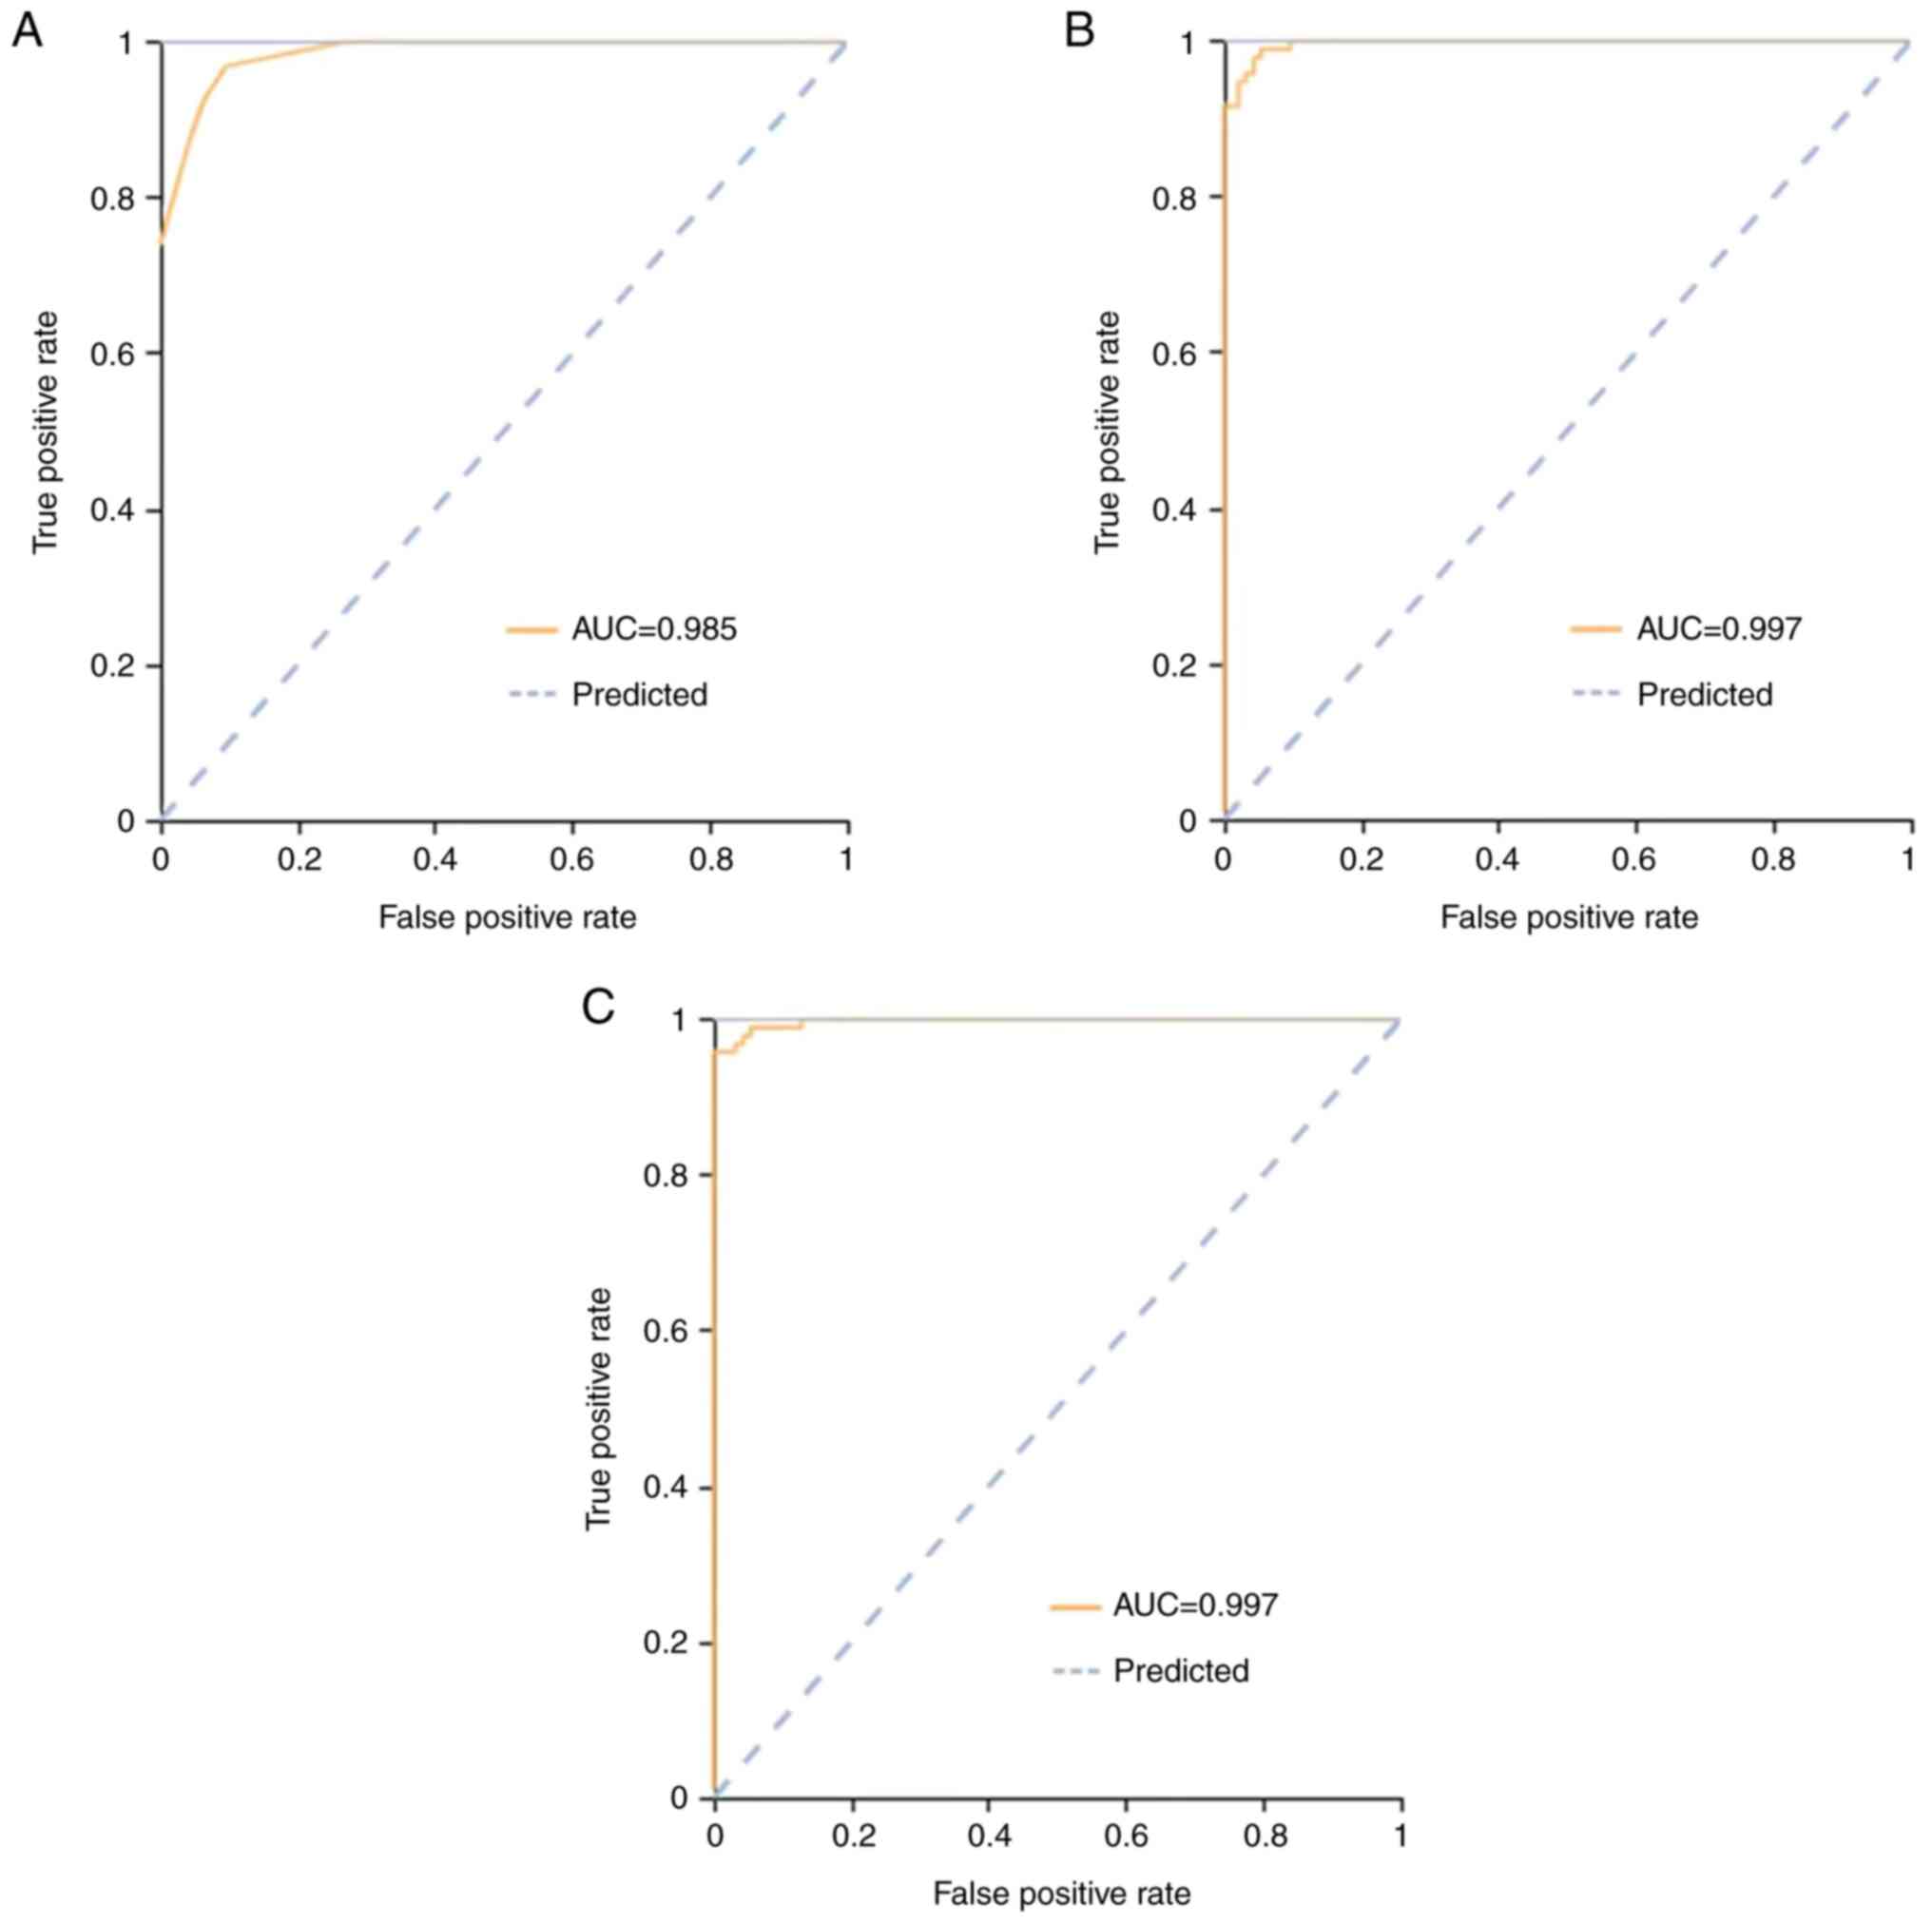
statistical feature groups. ROC curve analysis for both the
training and validation cohort for differentiating between NTM
pulmonary disease and TB is illustrated in Figs. 3 and 4.
 | Table IAllocation of ROIs to training,
validation and external verification cohort. |
Table I
Allocation of ROIs to training,
validation and external verification cohort.
| ROIs | Total | Training
cohort | Validation
cohort | External
verification cohort |
|---|
| NTM | 203 | 124 | 32 | 47 |
| TB | 178 | 119 | 30 | 29 |
Three classifiers were used to analyze the
characteristics of the radiomic AUC; 95% CI, sensitivity and
specificity of the training cohort and verification cohort are
shown in Table II. In the
training cohort, AUC [95% confidence interval (CI)], sensitivity
and specificity of the KNN, SVM, and LR classifiers were 0.98
(0.95-1.00), 0.93 and 0.94, 0.99 (0.97-1.00), 0.96 and 0.96 and
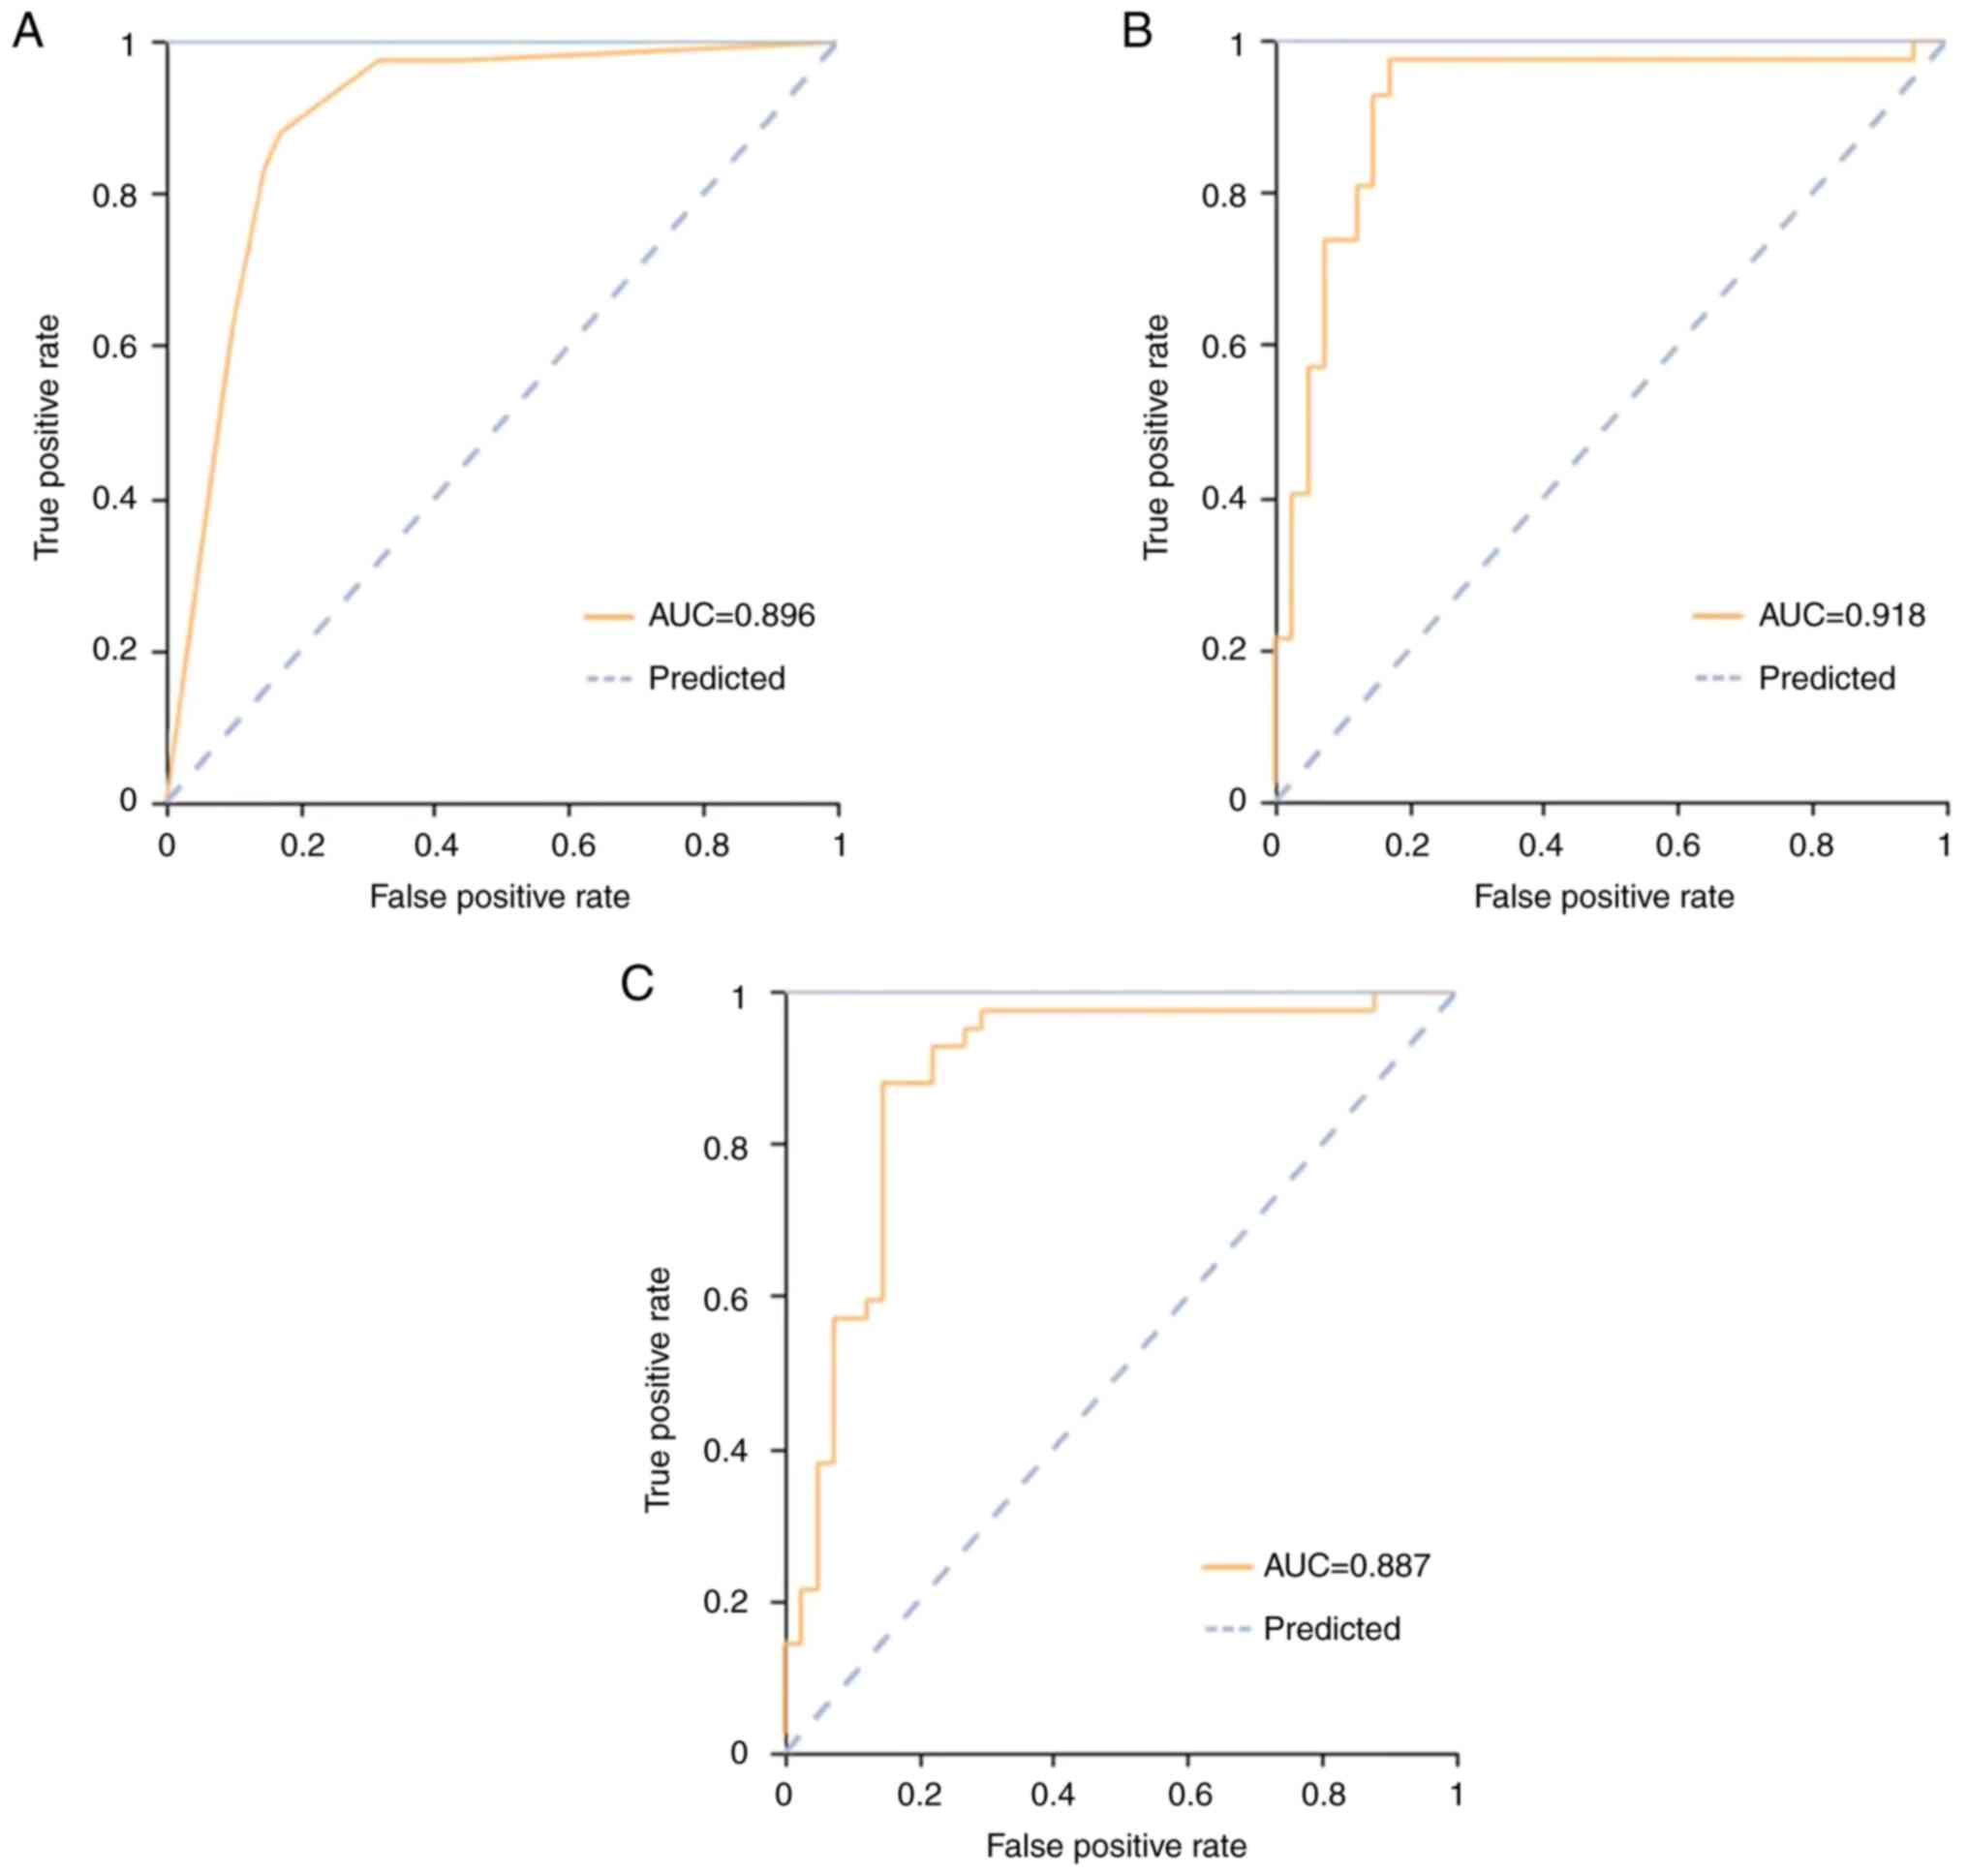
0.99 (0.97-1.00), 0.97 and 0.97, respectively. In the validation
cohort, these were 0.90 (0.82-0.97), 0.88 and 0.83, 0.92
(0.84-1.00), 0.86 and 0.85 and 0.89 (0.81-0.96), 0.88 and 0.85,
respectively. In the external verification cohort, these were 0.84
(0.66-0.82), 0.65 and 0.83, 0.90 (0.78-0.92), 0.94 and 0.77 and
0.95 (0.84-0.96), 0.94 and 0.87, respectively. The ROC curves of
the three classifiers are shown in Figs. 3 and 4. All cohorts had a significant AUC value
>0.84.
| Table IIReceiver operating characteristic
results with KNN, SVM and LR classifiers. |
Table II
Receiver operating characteristic
results with KNN, SVM and LR classifiers.
| A, Training
cohort |
|---|
| Classifier | AUC | 95% CI | Sensitivity | Specificity |
|---|
| KNN | 0.98 | 0.95-1.00 | 0.93 | 0.94 |
| SVM | 0.99 | 0.97-1.00 | 0.96 | 0.96 |
| LR | 0.99 | 0.97-1.00 | 0.97 | 0.97 |
| B, Validation
cohort |
| Classifier | AUC | 95% CI | Sensitivity | Specificity |
| KNN | 0.90 | 0.82-0.97 | 0.88 | 0.83 |
| SVM | 0.92 | 0.84-1.00 | 0.86 | 0.85 |
| LR | 0.89 | 0.81-0.96 | 0.88 | 0.85 |
| C, External
validation cohort |
| Classifier | AUC | 95% CI | Sensitivity | Specificity |
| KNN | 0.84 | 0.66-0.82 | 0.65 | 0.83 |
| SVM | 0.90 | 0.78-0.92 | 0.94 | 0.77 |
| LR | 0.95 | 0.84-0.96 | 0.94 | 0.87 |
In the training cohort, the precision of the three
models was >0.94 and recall rate and F1 score were >0.93
(Table III). In the validation
cohort, the precision of the three models was >0.83 with a
recall rate and F1 score >0.86. Combining the precision, recall
and F1 scores revealed that LR outperformed the other classifiers.
In the external verification cohort, the precision of the three
models was >0.77, the recall rate was >0.65 and F1 score was
>0.69. LR classifier had the highest precision, recall and F1
score.
| Table IIIPrecision, recall and F1 score. |
Table III
Precision, recall and F1 score.
| | Training
cohort | Validation
cohort | External
verification cohort |
|---|
| Evaluation
indicator | KNN | SVM | LR | KNN | SVM | LR | KNN | SVM | LR |
|---|
| Precision | 0.94 | 0.96 | 0.97 | 0.83 | 0.85 | 0.85 | 0.83 | 0.77 | 0.87 |
| Recall | 0.93 | 0.96 | 0.97 | 0.88 | 0.86 | 0.88 | 0.65 | 0.94 | 0.94 |
| F1 score | 0.93 | 0.96 | 0.97 | 0.86 | 0.86 | 0.87 | 0.69 | 0.82 | 0.88 |
Discussion
NTM is a conditional pathogen caused by Mycobacteria
other than M. tuberculosis complex and Mycobacterium
leprae, which commonly exist in water and soil. A total of 191
species has been discovered, but only a few can cause disease
(17,26-28).
Individuals typically contract the disease via the environment,
with water and soil being key (7,26,27).
Additionally, the incidence rate of NTM pulmonary disease is
increasing in United States, Germany, Canada and Taiwan (29-32).
The clinical symptoms and pathology of NTM pulmonary disease are
difficult to distinguish from TB and NTM is prone to natural drug
resistance. The diagnosis of NTM pulmonary disease and TB is
achieved via etiological detection. However, this is slow and
complex, negatively impacting clinical treatment (17). In the misdiagnosis of NTM pulmonary
disease as TB, the use of anti-TB treatment results in the delay of
proper treatment, a prolonged course of disease, poor prognosis and
possible treatment failure (33).
Therefore, discovering simple and effective diagnostic methods is
necessary.
Conventional CT is one of the primary detection
methods for NTM pulmonary disease and pulmonary TB. However, CT
manifestations of NTM pulmonary disease are complex and typically
perceived as conditions such as consolidation, bronchiectasis,
cavities and bronchial dissemination, which are difficult to
distinguish from TB (34,35). Koh et al (36) discovered that bronchiolitis,
consolidation and bronchiectasis can be perceived on CT images of
NTM pulmonary disease, which often involve >5 lobes. If
bronchiectasis involving the middle lobe of the right lung and the
tongue segment of the upper lobe of the left lung is observed in CT
images, along with cavities and nodules, NTM pulmonary disease
should be considered (37). In
some studies (11,15), probability of NTM consolidation is
significantly lower than that of pulmonary TB. However, in other
studies (12,34), the consolidation of conventional CT
does not significantly differentiate NTM and TB.
Necrotizing granulomatous inflammation is the key
characteristic lesion of tuberculosis, NTM pulmonary disease,
Coccidiosis and cryptococcosis (37-41).
NTM pulmonary disease is more prone to suppurative necrosis than
TB, while pink and basophilic necrosis caused by TB are more common
than NTM pulmonary disease (42).
NTM pulmonary disease possesses more giant or bizarre
multinucleated giant cells compared with TB (43). The aggregation of epithelial-like
cells leads to proliferative granuloma in NTM and caseous necrosis
is less than that in TB (15). NTM
pulmonary disease may result in atypical lesions, in which tissue
cell aggregation with no granuloma is seen, which is common in
immunodeficient patients (44,45).
Consolidation of NTM pulmonary disease is less common than TB, with
low incidence, less granuloma and more suppurative necrosis. It is
difficult to observe differences in the pathological features of
NTM and TB in conventional CT images, resulting in decreased
differential diagnosis of TB.
Radiomics has developed substantially in recent
years. Radiomics involves converting medical images into
high-dimensional images, extracting data features through
quantitative high-throughput and the analysis of the data for
decision support (46). The
sensitivity and predictive value of radiomics is significant in
screening of small pulmonary nodules and diagnosis, treatment and
prognosis of lung cancer (47-49).
Radiomics may also detect common inflammatory lesions (50,51).
Deep learning has been employed (25,52,53)
to distinguish NTM pulmonary disease and TB, along with use of the
cavity characteristics of radiomics to distinguish the two
diseases. Consolidation features are common CT features of NTM
pulmonary disease and TB. CT data extracted via high-throughput
radiology reflect differences in the pathological characteristics
of NTM and TB, compensating for fewer differences observed by the
naked eye and the loss of information.
Here, consolidations of NTM pulmonary disease and TB
were noted as ROIs. High-throughput image features were computed. A
total of 52 radiomics features were obtained from the ROIs, of
which 34 were texture analysis, one was shape and 17 were
first-order statistical feature groups. Three supervised learning
classifiers (KNN, SVM and LR) were used to analyze the extracted
lung consolidation features. In the training cohort, the AUC values
of models were all >0.98, 95% CI was 0.95-1.00, the sensitivity
was >0.93 and the specificity was >0.94. In the validation
cohort, the AUC values were all >0.89, 95% CI was 0.81-0.96, the
sensitivity was >0.86 and the specificity was >0.83. AUC
values of the ROC curve were all significant and their sensitivity
and specificity as >0.83. In the external validation set, the
AUC value was similar to that of internal validation set. In the
present study, the characteristics of the classifiers were analyzed
using clinical indicators (accuracy, recall, F1 score and support).
The precision of models was >0.77, the recall rate was >0.65
and F1 score was >0.69. Further, the LR classifier yielded the
highest precision, recall, and F1 score, which were >0.86, 0.87
and 0.87, respectively. From the results, it was observed that the
radiomics features derived from consolidations held potential in
differentiating between NTM pulmonary disease and TB. Although in
some studies, the CT imaging characteristics of NTM pulmonary
disease consolidations observed through traditional clinical
methods differ from those of TB (16,40),
results obtained by naked eye may be subjective. However, the
present radiomics characteristics of consolidations have potential
to distinguish between NTM pulmonary disease and TB. Radiomics
analysis of consolidation characteristics of pulmonary diseases has
the advantages of objectivity, quantification, stability and
non-empirical dependence. Consequently, radiomics analysis
possesses value in clinical application. Using radiomics
characteristics to distinguish NTM pulmonary disease from TB is a
promising, non-invasive and simple method. The early diagnosis of
NTM pulmonary disease may improve the quality of life of patients
and treatment of the disease, especially for resource-deficient
medical systems in developing countries (54,55).
There are certain limitations to the present study.
First, to ensure the homogeneity of the image, 5-mm-thick images
were used, which may result in loss of information. Second, the
sample size was small. Multicenter studies with larger sample sizes
are required to validate the present results. ROI segmentation was
performed manually, which may have been affected by subjective
bias. Lastly, only consolidation was investigated and other
characteristics were ignored, which may have resulted in incomplete
information.
In the present study, radiomics features based on CT
imaging were effective in identifying NTM pulmonary disease and TB
consolidation. Additionally, LR classifier outperformed the other
classifiers in the recognition of consolidation of NTM pulmonary
disease in patients.
Acknowledgements
Not applicable.
Funding
Funding: The present study was supported by Shandong Medical and
Health Science and Technology Development Plan Project (grant no.
2019WS535).
Availability of data and materials
The datasets used and/or analysed during the current
study are available from the corresponding author on reasonable
request.
Authors' contributions
QY, WZ and DY made substantial contributions to
conception and design. QY, JCu and JCh made substantial
contributions to acquisition of data. JCu, HK, JCh and ZD made
substantial contributions to analysis and interpretation of data.
QY and ZD wrote the manuscript. HK and JCu constructed figures. JCh
and JCu constructed tables. All authors have read and approved the
final manuscript. QY and JCu confirm the authenticity of all the
raw data.
Ethics approval and consent to
participate
The present study was approved by the ethics
committee of Shandong Public Health Clinical Center (Shandong
Provincial Chest Hospital) and the requirement for consent for this
retrospective analysis was waived (approval no. 2019XKYYEC-29).
Patient consent for publication
Not applicable.
Competing interests
The authors declare that they have no competing
interests.
References
|
1
|
Marshall JE, Mercaldo RA, Lipner EM and
Prevots DR: Incidence of nontuberculous mycobacteria infections
among persons with cystic fibrosis in the United States
(2010-2019). BMC Infect Dis. 23(489)2023.PubMed/NCBI View Article : Google Scholar
|
|
2
|
Dahl VN, Fløe A and Wejse C:
Nontuberculous mycobacterial infections in a Danish region between
2011 and 2021: Evaluation of trends in diagnostic codes. Infect Dis
(Lond). 55:439–443. 2023.PubMed/NCBI View Article : Google Scholar
|
|
3
|
Khan K, Wang J and Marras TK:
Nontuberculous mycobacterial sensitization in the United States:
National trends over three decades. Am J Respir Crit Care Med.
176:306–313. 2007.PubMed/NCBI View Article : Google Scholar
|
|
4
|
Khan K, Wang J, Hu W, Bierman A, Li Y and
Gardam M: Tuberculosis infection in the United States: National
trends over three decades. Am J Respir Crit Care Med. 177:455–460.
2008.PubMed/NCBI View Article : Google Scholar
|
|
5
|
Marras TK, Chedore P, Ying AM and Jamieson
F: Isolation prevalence of pulmonary non-tuberculous mycobacteria
in Ontario, 1997 2003. Thorax. 62:661–666. 2007.PubMed/NCBI View Article : Google Scholar
|
|
6
|
Thornton CS, Mellett M, Jarand J, Barss L,
Field SK and Fisher DA: The respiratory microbiome and
nontuberculous mycobacteria: An emerging concern in human health.
Eur Respir Rev. 30(200299)2021.PubMed/NCBI View Article : Google Scholar
|
|
7
|
Chinese Medical Association Tuberculosis
Branch, Editorial Board of Chinese Journal of Tuberculosis and
Respiratory Medicine. Expert consensus on diagnosis and treatment
of nontuberculous mycobacterial disease. Chin J Tubercul Respir
Dis. 35:572–580. 2012.
|
|
8
|
Gopalaswamy R, Shanmugam S, Mondal R and
Subbian S: Of tuberculosis and non-tuberculous mycobacterial
infections-a comparative analysis of epidemiology, diagnosis and
treatment. J Biomed Sci. 27(74)2020.PubMed/NCBI View Article : Google Scholar
|
|
9
|
Cao P, Liu F and Li H: Clinical analysis
of 58 cases of non-tuberculous mycobacteria. Chongqing Med J.
43:854–856. 2014.(In Chinese).
|
|
10
|
Chu HQ, Li B, Zhao L, Huang DD, Zhang ZM,
Xu JF, Zhang JB, Gui T, Xu LY and Sun XW: Chest imaging comparison
between non-tuberculous and tuberculosis mycobacteria in sputum
acid fast bacilli smear-positive patients. Eur Rev Med Pharmacol
Sci. 19:2429–2439. 2015.PubMed/NCBI View Article : Google Scholar
|
|
11
|
You Z and Zhu X: CT findings of pulmonary
nontuberculous mycobacterial disease. Chin J Clin Med Imaging.
16:141–143. 2005.
|
|
12
|
Dai J, Shi J and Liang L: Comparison of CT
findings between non tuberculous mycobacterial lung disease and
secondary pulmonary tuberculosis. Chin J Tubercul. 36:706–709.
2014.
|
|
13
|
Ma J, Zhou Z, Ren Y, Xiong J, Fu L, Wang Q
and Zhao J: Computerized detection of lung nodules through
radiomics. Med Phys. 44:4148–4158. 2017.PubMed/NCBI View
Article : Google Scholar
|
|
14
|
Coroller TP, Agrawal V, Huynh E, Narayan
V, Lee SW, Mak RH and Aerts HJWL: Radiomic-based pathological
response prediction from primary tumors and lymph nodes in NSCLC. J
Thorac Oncol. 12:467–476. 2017.PubMed/NCBI View Article : Google Scholar
|
|
15
|
Wittram C and Weisbrod GL: Mycobacterium
avium complex lung disease in immunocompetent patients:
Radiography-CT correlation. Br J Radiol. 75:340–344.
2002.PubMed/NCBI View Article : Google Scholar
|
|
16
|
Guo H: To explore the clinical value of CT
in the diagnosis and clinicopathological classification of
peripheral small lung cancer. China Contin Med Educ. 8(48)2016.(In
Chinese).
|
|
17
|
Daley CL, Iaccarino JM, Lange CG, Cambau
E, Wallace RJ Jr, Andrejak C, Böttger EC, Brozek J, Griffith DE,
Guglielmetti L, et al: Treatment of nontuberculous mycobacterial
pulmonary disease: An official ATS/ERS/ESCMID/IDSA clinical
practice guideline. Eur Respir J. 56(2000535)2020.PubMed/NCBI View Article : Google Scholar
|
|
18
|
Liu E, Zhou L and Wang L: Comprehensively
interpret the standards of 'ws 196-2017 tuberculosis
classification. Chin J Tubercul Prev. 40(5)2018.(In Chinese).
|
|
19
|
Wang Y, Lu B, Liu J, Xiao T, Wan K and
Guan C: A multicenter clinical evaluation of Mycobacterium
tuberculosis IgG/IgM antibody detection using the colloidal
gold method. Eur J Clin Microbiol Infect Dis. 33:1989–1994.
2014.PubMed/NCBI View Article : Google Scholar
|
|
20
|
Lambin P, Rios-Velazquez E, Leijenaar R,
Carvalho S, van Stiphout RG, Granton P, Zegers CM, Gillies R,
Boellard R, Dekker A and Aerts HJ: Radiomics: Extracting more
information from medical images using advanced feature analysis.
Eur J Cancer. 48:441–446. 2012.PubMed/NCBI View Article : Google Scholar
|
|
21
|
Akman DV, Malekipirbazari M, Yenice ZD,
Yeo A, Adhikari N, Wong YK, Abbasi B and Gumus AT: K-best feature
selection and ranking via stochastic approximation. Expert Syst
Appl. 213(118864)2023.
|
|
22
|
Choi H, Song E, Hwang SS and Lee W: A
modified generalized lasso algorithm to detect local spatial
clusters for count data. AStA Adv Stat Anal. 102:537–563. 2018.
|
|
23
|
Sun H, Zhou P, Chen G, Dai Z, Song P and
Yao J: Radiomics nomogram for the prediction of Ki-67 index in
advanced non-small cell lung cancer based on dual-phase enhanced
computed tomography. J Cancer Res Clin Oncol. 149:9301–9315.
2023.PubMed/NCBI View Article : Google Scholar
|
|
24
|
Hapsari DP, Utoyo I and Purnami SW:
Support vector machine optimization with fractional gradient
descent for data classification. J Appl Sci Manag Eng Technol.
2:1–6. 2021.
|
|
25
|
Zhou Z: Machine learning. Tsinghua
University Press, pp121-139, 298-300, 2016.
|
|
26
|
Wang L, Ding W, Mo Y, Shi D, Zhang S,
Zhong L, Wang K, Wang J, Huang C, Zhang S, et al: Distinguishing
nontuberculous mycobacteria from Mycobacterium tuberculosis
lung disease from CT images using a deep learning framework. Eur J
Nucl Med Mol Imaging. 8:4293–4306. 2021.PubMed/NCBI View Article : Google Scholar
|
|
27
|
Biondi G, Sotgiu G, Dore S, Molicotti P,
Ruggeri M, Aliberti S and Satta R: Beyond pulmonary nontuberculous
mycobacteria disease: Do extra-pulmonary forms represent an
emerging clinical and public health threat? ERJ Open Res.
3:00091–2017. 2017.PubMed/NCBI View Article : Google Scholar
|
|
28
|
Aboagye SY, Danso E, Ampah KA, Nakobu Z,
Asare P, Otchere ID, Röltgen K, Yirenya-Tawiah D and Yeboah-Manu D:
Isolation of nontuberculous mycobacteria from the environment of
ghanian communities where buruli ulcer is endemic. Appl Environ
Microbiol. 82:4320–4329. 2016.PubMed/NCBI View Article : Google Scholar
|
|
29
|
Chen CY, Chen HY, Chou CH, Huang CT, Lai
CC and Hsueh PR: Pulmonary infection caused by nontuberculous
mycobacteria in a medical center in Taiwan, 2005-2008. Diagn
Microbiol Infect Dis. 72:47–51. 2012.PubMed/NCBI View Article : Google Scholar
|
|
30
|
Vinnard C, Longworth S, Mezochow A,
Patrawalla A, Kreiswirth BN and Hamilton K: Deaths related to
nontuberculous mycobacterial infections in the United States,
1999-2014. Ann Am Thorac Soc. 13:1951–1955. 2016.PubMed/NCBI View Article : Google Scholar
|
|
31
|
Ringshausen FC, Wagner D, de Roux A, Diel
R, Hohmann D, Hickstein L, Welte T and Rademacher J: Prevalence of
nontuberculous mycobacterial pulmonary disease, Germany, 2009-2014.
Emerg Infect Dis. 22:1102–1105. 2016.PubMed/NCBI View Article : Google Scholar
|
|
32
|
Marras TK, Campitelli MA, Lu H, Chung H,
Brode SK, Marchand-Austin A, Winthrop KL, Gershon AS, Kwong JC and
Jamieson FB: Pulmonary nontuberculous mycobacteria-associated
deaths, Ontario, Canada, 2001-2013. Emerg Infect Dis. 23:468–476.
2017.PubMed/NCBI View Article : Google Scholar
|
|
33
|
Jing H, Wang H, Wang Y, Deng Y, Li X, Liu
Z, Graviss EA and Ma X: Prevalence of nontuberculous mycobacteria
infection, China, 2004-2009. Emerg Infect Dis. 18:527–528.
2012.PubMed/NCBI View Article : Google Scholar
|
|
34
|
Eisenberg I, Yasin A, Fuks L, Stein N,
Saliba W, Kramer MR, Adir Y and Shteinberg M: Radiologic
characteristics of non-tuberculous mycobacteria infection in
patients with bronchiectasis. Lung. 198:715–722. 2020.PubMed/NCBI View Article : Google Scholar
|
|
35
|
Kwak N, Lee JH, Kim HJ, Kim SA and Yim JJ:
New-onset nontuberculous mycobacterial pulmonary disease in
bronchiectasis: Tracking the clinical and radiographic changes. BMC
Pulm Med. 20(293)2020.PubMed/NCBI View Article : Google Scholar
|
|
36
|
Koh WJ, Lee KS, Kwon OJ, Jeong YJ, Kwak SH
and Kim TS: Bilateral bronchiectasis and bronchiolitis at
thin-section CT: Diagnostic implications in nontuberculous
mycobacterial pulmonary infection. Radiology. 235:282–288.
2005.PubMed/NCBI View Article : Google Scholar
|
|
37
|
Aksamit TR, Philley JV and Griffith DE:
Nontuberculous mycobacterial (NTM) lung disease: The top ten
essentials. Respir Med. 108:417–425. 2014.PubMed/NCBI View Article : Google Scholar
|
|
38
|
Marchevsky A, Damsker B, Gribetz A, Tepper
S and Geller SA: The spectrum of pathology of nontuberculous
mycobacterial infections in open-lung biopsy specimens. Am J Clin
Pathol. 78:695–700. 1982.PubMed/NCBI View Article : Google Scholar
|
|
39
|
Goodwin RA Jr and Snell JD Jr: The
enlarging histoplasmoma. Concept of a tumor-like phenomenon
encompassing the tuberculoma and coccidioidoma. Am Rev Respir Dis.
100:1–12. 1969.PubMed/NCBI View Article : Google Scholar
|
|
40
|
Mukhopadhyay S and Gal AA: Granulomatous
lung disease: An approach to the differential diagnosis. Arch
Pathol Lab Med. 134:667–690. 2010.PubMed/NCBI View Article : Google Scholar
|
|
41
|
Mukhopadhyay S: Role of histology in the
diagnosis of infectious causes of granulomatous lung disease. Curr
Opin Pulm Med. 17:189–196. 2011.PubMed/NCBI View Article : Google Scholar
|
|
42
|
Mu J, Liu Z and Zhang C: Pathological
characteristics of nontuberculous Mycobacterium tuberculosis
and the value of molecular pathology in its diagnosis. Chin J
Pathol. 49:562–567. 2020.PubMed/NCBI View Article : Google Scholar
|
|
43
|
O'Leary S, O'Sullivan MP and Keane J:
IL-10 blocks phagosome maturation in Mycobacterium
tuberculosis-infected human macrophages. Am J Respir Cell Mol
Biol. 45:172–180. 2011.PubMed/NCBI View Article : Google Scholar
|
|
44
|
Jannotta FS and Sidawy MK: The recognition
of mycobacterial infections by intraoperative cytology in patients
with acquired immunodeficiency syndrome. Arch Pathol Lab Med.
113:1120–1123. 1989.PubMed/NCBI
|
|
45
|
Marinelli DL, Albelda SM, Williams TM,
Kern JA, Iozzo RV and Miller WT: Nontuberculous mycobacterial
infection in AIDS: Clinical, pathologic, and radiographic features.
Radiology. 160:77–82. 1986.PubMed/NCBI View Article : Google Scholar
|
|
46
|
de la Pinta C: Radiomics in pancreatic
cancer for oncologist: Present and future. Hepatobiliary Pancreat
Dis Int. 21:356–361. 2022.PubMed/NCBI View Article : Google Scholar
|
|
47
|
Gulshan V, Peng L, Coram M, Stumpe MC, Wu
D, Narayanaswamy A, Venugopalan S, Widner K, Madams T, Cuadros J,
et al: Development and validation of a deep learning algorithm for
detection of diabetic retinopathy in retinal fundus photographs.
JAMA. 316:2402–2410. 2016.PubMed/NCBI View Article : Google Scholar
|
|
48
|
Chae HD, Park CM, Park SJ, Lee SM, Kim KG
and Goo JM: Computerized texture analysis of persistent part-solid
ground-glass nodules: Differentiation of preinvasive lesions from
invasive pulmonary adenocarcinomas. Radiology. 273:285–293.
2014.PubMed/NCBI View Article : Google Scholar
|
|
49
|
Liu Y, Kim J, Balagurunathan Y, Li Q,
Garcia AL, Stringfield O, Ye Z and Gillies RJ: Radiomic features
are associated with EGFR mutation status in lung adenocarcinomas.
Clin Lung Cancer. 17:441–448.e6. 2016.PubMed/NCBI View Article : Google Scholar
|
|
50
|
Zhang T, Yuan M, Zhong Y, Zhang YD, Li H
and Wu JF: Differentiation of focal organising pneumonia and
peripheral adenocarcinoma in solid lung lesions using thin-section
CT-based radiomics. Clin Radiol. 74:78.e23–78.e30. 2019.PubMed/NCBI View Article : Google Scholar
|
|
51
|
Yanling W, Duo G, Zuojun G, Zhongqiang S,
Yankai W, Shan L and Hongying C: Radiomics nomogram analyses for
differentiating pneumonia and acute paraquat lung injury. Sci Rep.
9(15029)2019.PubMed/NCBI View Article : Google Scholar
|
|
52
|
Yan Q, Wang W, Zhao W, Zuo L, Wang D, Chai
X and Cui J: Differentiating nontuberculous mycobacterium pulmonary
disease from pulmonary tuberculosis through the analysis of the
cavity features in CT images using radiomics. BMC Pulm Med.
22(4)2022.PubMed/NCBI View Article : Google Scholar
|
|
53
|
Xing Z, Ding W, Zhang S, Zhong L, Wang L,
Wang J, Wang K, Xie Y, Zhao X, Li N and Ye Z: Machine
learning-based differentiation of nontuberculous mycobacteria lung
disease and pulmonary tuberculosis using CT images. Biomed Res Int.
2020(6287545)2020.PubMed/NCBI View Article : Google Scholar
|
|
54
|
Tan Y, Su B, Shu W, Cai X, Kuang S, Kuang
H, Liu J and Pang Y: Epidemiology of pulmonary disease due to
nontuberculous mycobacteria in Southern China, 2013-2016. BMC Pulm
Med. 18(168)2018.PubMed/NCBI View Article : Google Scholar
|
|
55
|
Maurya AK, Nag VL, Kant S, Kushwaha RAS,
Kumar M, Singh AK and Dhole TN: Prevalence of nontuberculous
mycobacteria among extrapulmonary tuberculosis cases in tertiary
care centers in Northern India. Biomed Res Int.
2015(465403)2015.PubMed/NCBI View Article : Google Scholar
|