Introduction
Hypertrophic scar (HS) is a pathological scar that
continues to proliferate after local epithelization of wounds and
is a common clinical manifestation of excessive tissue repair after
burns, wounds or lesions. The clinical manifestations are often
pruritus and pain, which can lead to local deformity or
dysfunction, seriously affecting the normal work and daily life of
patients (1,2). At present, the etiology of HS is
still unclear, but may be related to skin lesions, inflammatory
reaction at the trauma site and gene mutation. Inflammatory
response is recognized as the initial stage of wound healing.
Excessive inflammatory reaction can induce abnormal accumulation of
extracellular matrix (ECM), resulting in the formation of HS
(3). IL-1β produced by scar cell
activation is a key step in immune inflammatory response after
trauma. IL-1 β not only directly affects the human body by
activating lymphocytes and inflammatory factors, but also regulates
the body's autoimmune system by directly stimulating the production
of abundant inflammatory factors and affects the wound surface
through autoimmune response (4).
Macrophages play an important role in body's
inflammatory response. Macrophage activation and its different
activation subtypes affect the function of macrophages and wound
healing (5,6). Macrophages include M1 and M2
subtypes. M1 macrophages exert a proinflammatory role in secreting
pro-inflammatory factors such as IL-12. M2 macrophages play an
anti-inflammatory role by secreting some anti-inflammatory factors
such as IL-10(7). Inflammatory
response usually exists in HS tissue for a long time and the
activation classification of macrophages has been implicated in the
formation and clinical staging of HS (8). Macrophage activation is an important
way to promote scar healing in hyperplasia stage and the content of
IL-1β may increase during injury or scar maturation, thereby
stimulating wound formation and accelerating the process of wound
healing (9). Therefore, exploring
the inflammatory factors that promote the formation of hyperplasia
phase is of great significance for correctly understanding the
characteristics of macrophages in scars and treating the disease
(10). The antibody array
imprinted membrane method is a determination based on the membrane
method and consisting of a pre-spotted membrane with capture
antibodies specific to multiple proteins. The sample is spotted
onto a membrane and the protein bound to the capture antibody is
detected with a second set of labeled antibodies, a method that
simultaneously detects the expression of dozens of
inflammation-associated factors (10). It is well known that HS tissue has
a long-term inflammatory response and there are obvious
hypertrophic phases, hypotropic phases and mature phases in
clinical manifestations (11).
However, whether the process of macrophage activation is involved
in and affects the formation and clinical outcome of HS remains
unclear.
In the present study, a total of 83 patients with HS
admitted to the Affiliated Hospital of Beihua University (Jilin,
China) between February 2021 and July 2021 were selected. The
current study aimed to analyze the expression of macrophage
activation-specific factors in HS tissues during hyperplasia phase
by the antibody array imprinted membrane method and to explore the
clinical significance of HS. In this way, a possible relationship
between HS and scarring was revealed, which provided a new
direction for the study of HS mechanism based on macrophages.
Materials and methods
General materials
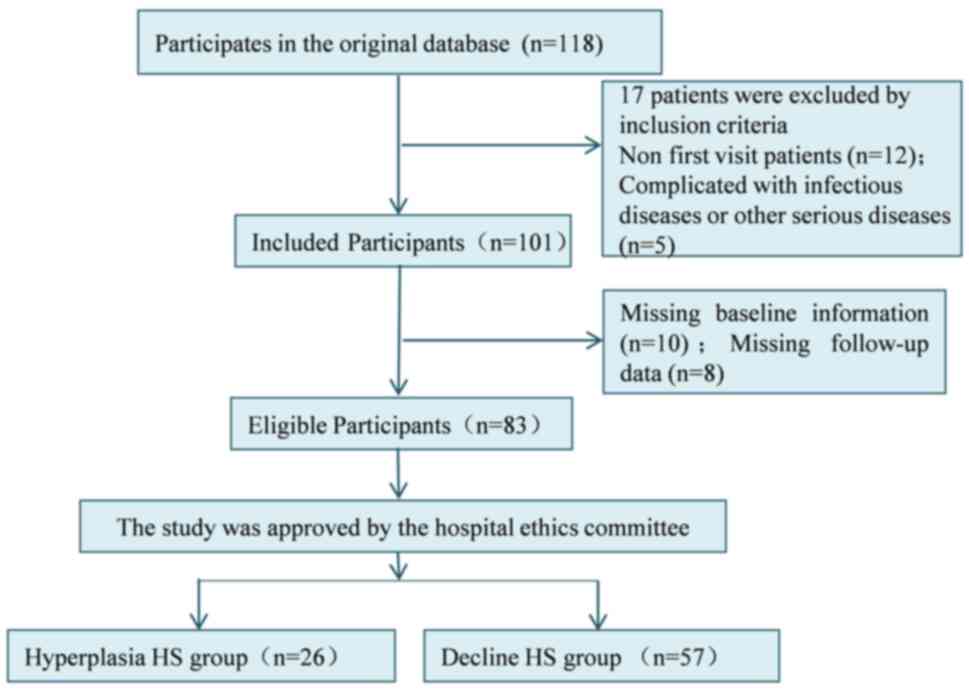
A total of 118 patients with HS admitted to the
Affiliated Hospital of Beihua University (Jilin, China) between
February 2021 and July 2021 were selected. The clinical data of the
patients were retrospectively analyzed and, according to the
inclusion and exclusion criteria (12), 83 patients with HS were finally
included as the study subjects. Inclusion criteria: i) All patients
had burns and the healing time was within 12 months; ii) it was the
first visit after injury for the patient, who had not received
relevant drug treatment before enrollment; iii) all patients
exhibited by the clinical manifestation of red cicatricial
protuberance, pain and itching; and iv) the patients and their
families all signed the informed consent and could cooperate with
the examination and treatment with good compliance. Exclusion
criteria were as follows: i) Patients with important organ
dysfunction; ii) patients during lactation or pregnancy; and iii)
the patient condition was complicated with infectious diseases or
other serious diseases. According to the description of color,
thickness, vascular distribution and softness in the Vancouver Scar
Assessment Scale (13), combined
with the specific time of scar formation and the clinical symptoms
of scarring, these patients were divided into the hyperplasia HS
group (n=26) and decline HS group (the HS tissues ceased to grow
and were in regression periods; n=57). Patients in the hyperplasia
HS group were with color (3 points), thickness (2-3 points),
vascular distribution (3 points) and softness (2-3 points), while
patients in the decline HS group were with color (2 points),
thickness (2-3 points), vascular distribution (2 points) and
softness (2-3 points). The hyperplasia HS group consisted of 14
males and 12 females, with an average age of 33.16±3.56 years and
scar formation time of 86±11 days. The decline HS group was
comprised 33 males and 24 females, with an average age of
33.38±6.12 years and a time of scar formation of 192±14 days. The
age and sex had no significant difference between groups
(P>0.05), while the time of scar formation in the decline HS
group was markedly longer than that in the hyperplasia HS group
(P<0.05). All procedures performed in studies were in accordance
with the ethical standards of the ethics committee of the
Affiliated Hospital of Beihua University (approval no. 2021016).
The selection process of general data is shown in Fig. 1.
Methods
Protein extraction: The HS tissue samples were
placed in an ice box and then were cut into 2x2-mm pieces using
ophthalmic scissors. Subsequently, 0.5 g of protein sample was
added to 1 ml PBS solution and the mixture was placed in a grinding
tube. Then three grinding balls was put into the grinding tube and
the mixture was ground for 60 sex with a homogenizer at a speed of
8 m/s. After grinding, the tissue homogenate was centrifuged for 20
min at the speed of 10,000 x g at 4˚C. The supernatant was
collected and frozen at 80˚C. The original standard protein sample
in BCA kit was diluted to prepare a standard protein solution with
the concentration of 1.0 mg/ml. Standard gradient protein samples
with concentrations of 0, 1, 5, 10 and 20 mg/ml were prepared. The
protein samples obtained in the aforementioned steps were aliquoted
into EP tubes, preferably double-welled, 1 µl sample and 19 µl
water were added to the sample wells, for a 20-fold dilution. The
standard gradient protein sample and the protein sample to be
tested were added to a 96-well plate and the BCA working solution
added from the kit (cat. no. PA115-01; Tiangen Biotech Co., Ltd.).
After standing at room temperature for 10 min, the 96-well plate
was placed on the microplate reader and the optical density (OD) of
all samples were measured at 595 m. The outer diameter of each well
was recorded. The standard curve was drawn with the protein content
of the standard as the abscissa and the OD value as the ordinate.
The OD value of the sample was substituted into the standard curve
to obtain the corresponding protein content. Finally, the actual
total protein concentration of the sample was calculated according
to the specific dilution ratio.
The levels of IL-12, IL-10, VEGF and basic
fibroblast growth factor (bFGF) were detected using antibody array
blotting membrane method. The specific steps were as follows: The
appropriate concentration range of total protein in the sample was
determined according to the instructions of the kit (cat. no.
SHC-9823; Shanghai Chunmai Biotechnology Co., Ltd.) and the total
protein amount of sample measured by the kit was adjusted according
to the total protein concentration of different samples measured
above to make it consistent. Then, the antibody array imprint
membrane (cat. no. AA0135; Wuhan Aimejie Technology Co., Ltd.) was
treated with pretreated solution and was then incubated with
samples in a shaker at 4˚C for 12 h. The sample was washed for
three times using cleaning solution for at least 5 min each time.
Then, the poly-HRP-conjugated goat anti-human antibody (cat. no.
GAHHRP-050; Guangdong Gukang Biotechnology Co., Ltd.) was added and
incubated at room temperature for 1 h. After washing with cleaning
solution three times, the special fluorescent developer (cat. no.
G9590; Shanghai Shengqizhao Biotechnology Co., Ltd.) was added and
cultured at 20-25˚C. Finally, the termination solution was added.
The imprint film was put under the Odyssey infrared laser imaging
system (Core Qidian Gene Technology (Beijing) Co., Ltd.) for
detection. The value of the standard reference point on the
antibody array imprint membrane and the value of the reaction point
of the specific factor of each group of reactions were measured
using the image analysis software provided with the imaging system.
This value was compared with the average value of the standard
reference point value to obtain the final quantitative value of the
factor expression. The final data was recorded. IL-10 and IL-12
kits were purchased from Beijing BioDee Biotechnology Co., Ltd.
VEGF and bFGF kits were purchased from Beijing Baiolaibo Technology
Co., Ltd.
Outcome measures
The expression levels of IL-10, IL-12, VEGF and bFGF
were compared among the groups. The patients' age, height of
hypertrophic protuberance, flexibility, degree of hyperemia and
concomitant symptoms were collected. The relationship between the
expression levels of IL-10, IL-12, VEGF, bFGF and the clinical
symptoms of hypertrophic scar was analyzed.
Statistical analysis
SPSS 20.0 software (IBM Corp.) was used to analyze
the experimental data. Measurement data such as the age, IL-10,
IL-12 were shown as the mean ± standard deviation and compared
using an independent-samples t-test between groups. Enumeration
data such as the sex were shown as percentage and compared using
χ2 test. Pearson correlation analysis was used to
analyze the correlation between macrophage activation specific
factor, VEGF and bFGF. P<0.05 was considered to indicate a
statistically significant difference.
Results
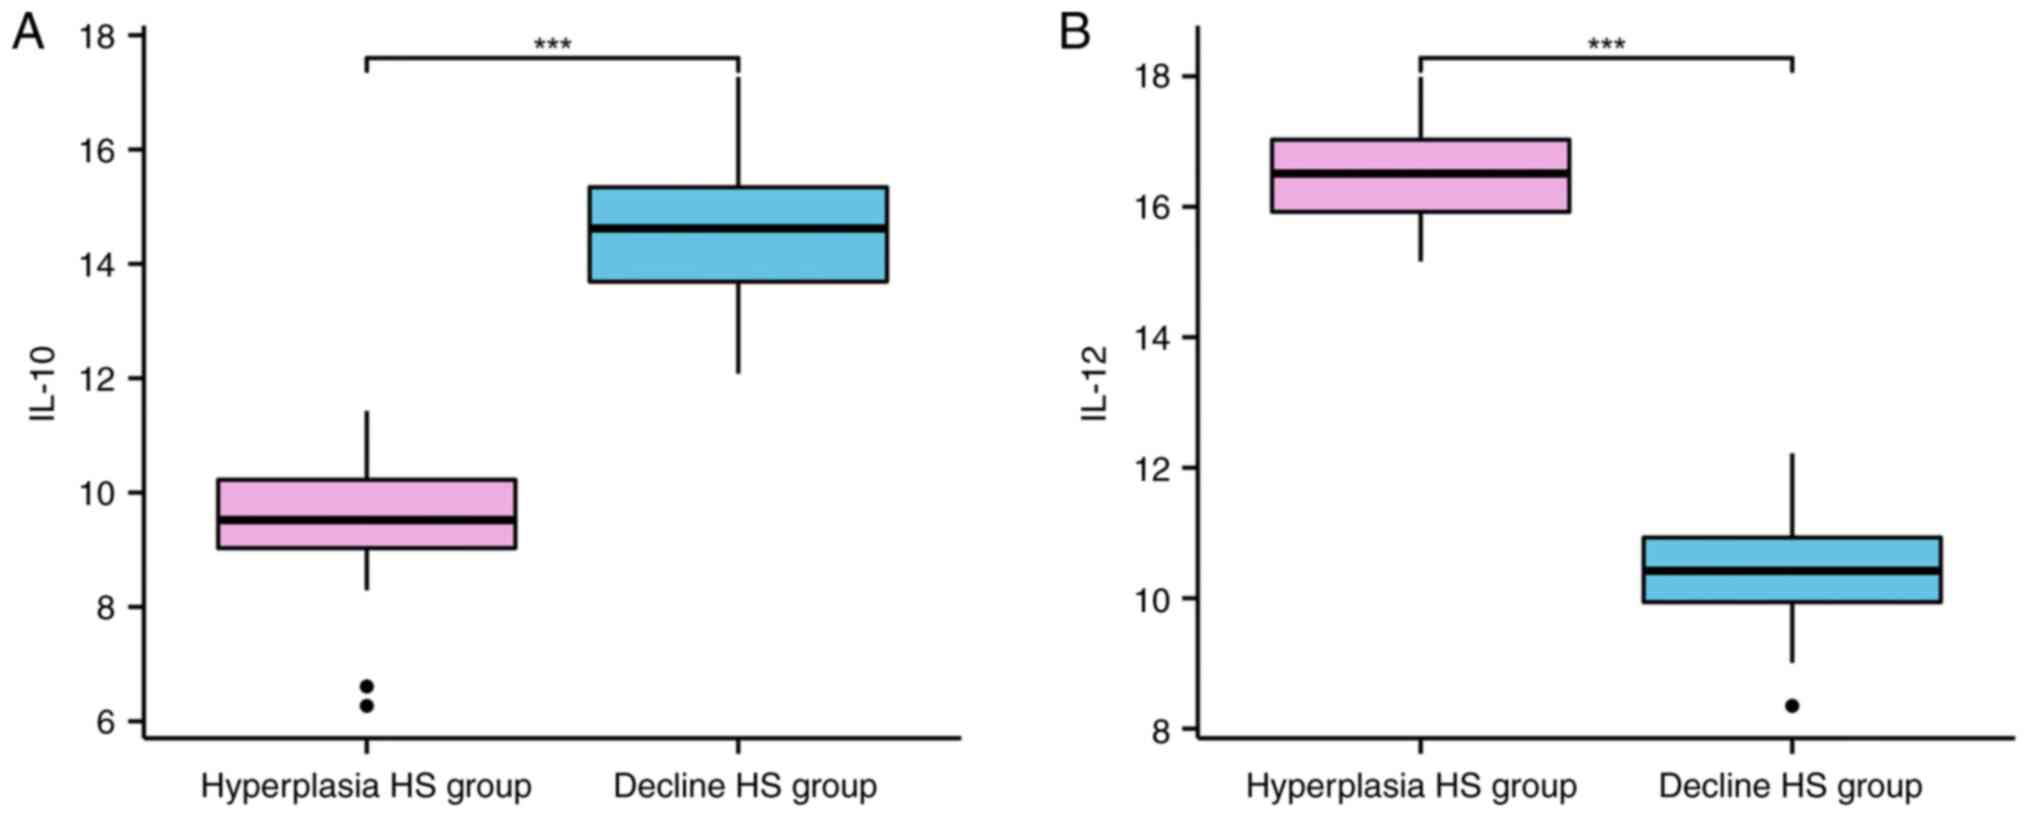
Quantitative comparison of IL-10 and
IL-12 in tissues
The content of IL-10 was lower and IL-12 levels were
higher in hyperplasia HS group compared with those in the decline
HS group (P<0.001; Table I and
Fig. 2).
 | Table IQuantitative comparison of IL-10 and
IL-12 in tissues (mean ± standard deviation). |
Table I
Quantitative comparison of IL-10 and
IL-12 in tissues (mean ± standard deviation).
| Groups | Cases, n | IL-10 (pg/ml) | IL-12 (pg/ml) |
|---|
| Hyperplasia HS
group | 26 | 9.48±1.06 | 16.45±0.85 |
| Decline HS group | 57 | 14.56±1.26 | 10.46±0.75 |
| t | | 17.861 | 32.358 |
| P-value | | <0.001 | <0.001 |
Comparison of quantitative levels of
IL-10 and IL-12 in HS tissues of patients with different clinical
characteristics in hyperplastic stage
In the hyperplasia HS group, the content of IL-10
was higher and the content of IL-12 was lower in patients aged ≥30
years, with protuberance height <2 mm, soft flexibility, low
hyperemia degree and no concomitant symptoms compared with the
patients aged <30 years, protuberance height ≥2 mm, hard
flexibility, high hyperemia degree and concomitant symptoms
(P<0.001; Table II).
| Table IIComparison of quantitative levels of
IL-10 and IL-12 in HS tissues with different clinical
characteristics during hyperplastic stage (mean ± standard
deviation). |
Table II
Comparison of quantitative levels of
IL-10 and IL-12 in HS tissues with different clinical
characteristics during hyperplastic stage (mean ± standard
deviation).
| Indicator | Cases, n | IL-10 (pg/ml) | t | P-value | IL-12 (pg/ml) | t | P-value |
|---|
| Age, years | | | 49.036 | <0.001 | | 46.649 | <0.001 |
|
<30 | 13 | 6.23±0.34 | | | 19.52±0.45 | | |
|
≥30 | 13 | 11.89±0.24 | | | 12.45±0.31 | | |
| Protuberance height,
mm | | | 65.519 | <0.001 | | 66.046 | <0.001 |
|
<2 | 19 | 11.76±0.16 | | | 11.95±0.24 | | |
|
≥2 | 7 | 6.45±0.24 | | | 18.75±0.21 | | |
| Flexibility | | | 54.948 | <0.001 | | 51.258 | <0.001 |
|
Hard | 16 | 6.37±0.21 | | | 18.79±0.34 | | |
|
Soft | 10 | 11.56±0.27 | | | 12.46±0.24 | | |
| Hyperemia degree | | | 56.096 | <0.001 | | 61.161 | <0.001 |
|
Low | 12 | 10.99±0.24 | | | 12.07±0.31 | | |
|
High | 14 | 6.85±0.12 | | | 18.67±0.24 | | |
| Concomitant
symptoms | | | 45.843 | <0.001 | | 121.639 | <0.001 |
|
Yes | 18 | 6.96±0.20 | | | 19.24±0.12 | | |
|
No | 8 | 11.23±0.26 | | | 12.37±0.16 | | |
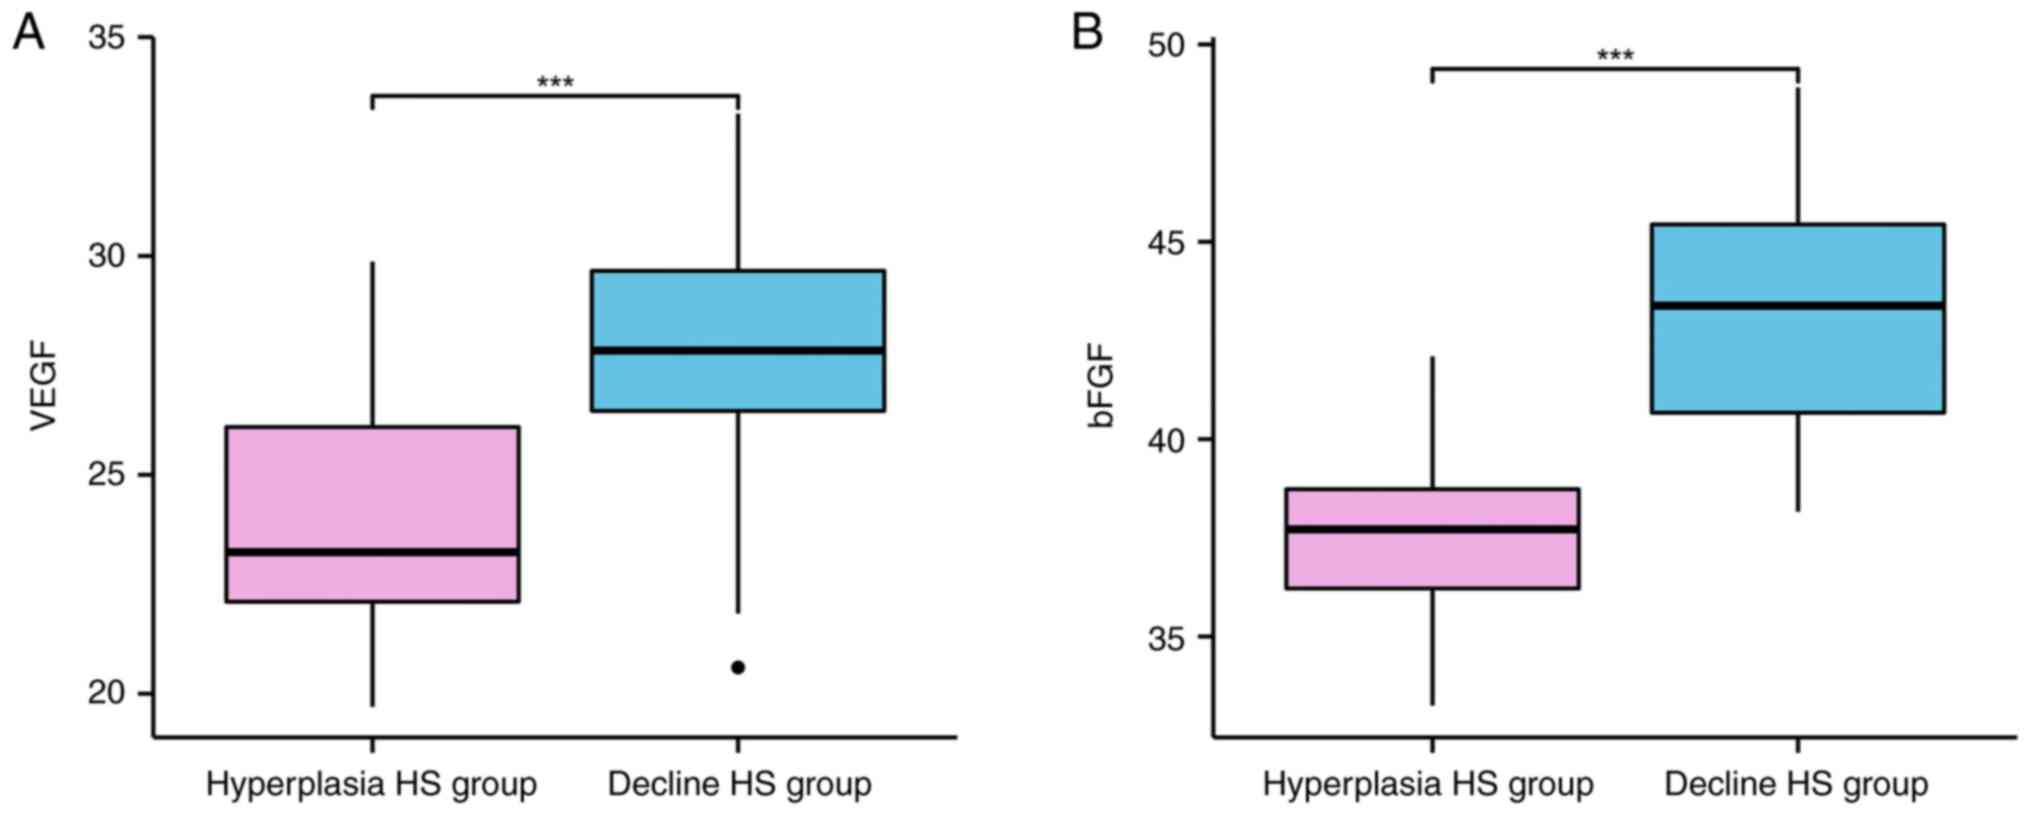
Quantitative comparison of VEGF and
bFGF in tissues
The content of VEGF and bFGF was markedly lower in
hyperplasia HS group compared with those in the decline HS group
(P<0.001; Table III and
Fig. 3).
| Table IIIQuantitative comparison of VEGF and
bFGF in tissues (mean ± standard deviation). |
Table III
Quantitative comparison of VEGF and
bFGF in tissues (mean ± standard deviation).
| Groups | Cases, n | VEGF (pg/ml) | bFGF (pg/ml) |
|---|
| Hyperplasia HS
group | 26 | 24.15±2.64 | 37.48±2.56 |
| Decline HS
group | 57 | 27.85±2.63 | 43.15±3.16 |
| t | | 5.938 | 8.019 |
| P-value | | <0.001 | <0.001 |
Comparison of quantitative levels of
VEGF and b FGF in HS tissues of patients with different clinical
characteristics in hyperplastic stage
In the hyperplasia HS group, the content of VEGF and
bFGF were higher in patients aged ≥30 years, with protuberance
height <2 mm, soft flexibility, low hyperemia degree and no
concomitant symptoms compared with the patients aged <30 years,
with protuberance height ≥2 mm, hard flexibility, high hyperemia
degree and concomitant symptoms (P<0.001; Table IV).
| Table IVComparison of quantitative levels of
VEGF and bFGF in HS tissues with different clinical characteristics
during hyperplastic stage (mean ± standard deviation). |
Table IV
Comparison of quantitative levels of
VEGF and bFGF in HS tissues with different clinical characteristics
during hyperplastic stage (mean ± standard deviation).
| Indicator | Cases, n | VEGF (pg/ml) | t | P-value | bFGF (pg/ml) | t | P-value |
|---|
| Age, years | | | 49.036 | <0.001 | | 46.649 | <0.001 |
|
<30 | 13 | 25.15±1.45 | | | 40.15±1.06 | | |
|
≥30 | 13 | 31.26±2.15 | | | 48.52±0.39 | | |
| Protuberance
height, mm | | | 12.294 | <0.001 | | 18.006 | <0.001 |
|
<2 | 19 | 30.59±1.24 | | | 48.75±1.06 | | |
|
≥2 | 7 | 24.38±0.78 | | | 40.37±1.03 | | |
| Flexibility | | | 12.727 | <0.001 | | 21.074 | <0.001 |
|
Hard | 16 | 24.89±1.35 | | | 41.06±1.34 | | |
|
Soft | 10 | 31.25±1.05 | | | 49.27±0.85 | | |
| Hyperemia
degree | | | 13.946 | <0.001 | | 21.326 | <0.001 |
|
Low | 12 | 31.04±1.28 | | | 49.85±0.48 | | |
|
High | 14 | 24.75±1.02 | | | 41.08±1.35 | | |
| Concomitant
symptoms | | | 15.810 | <0.001 | | 13.204 | <0.001 |
|
Yes | 18 | 23.59±1.34 | | | 41.67±1.06 | | |
|
No | 8 | 32.07±1.05 | | | 48.33±1.45 | | |
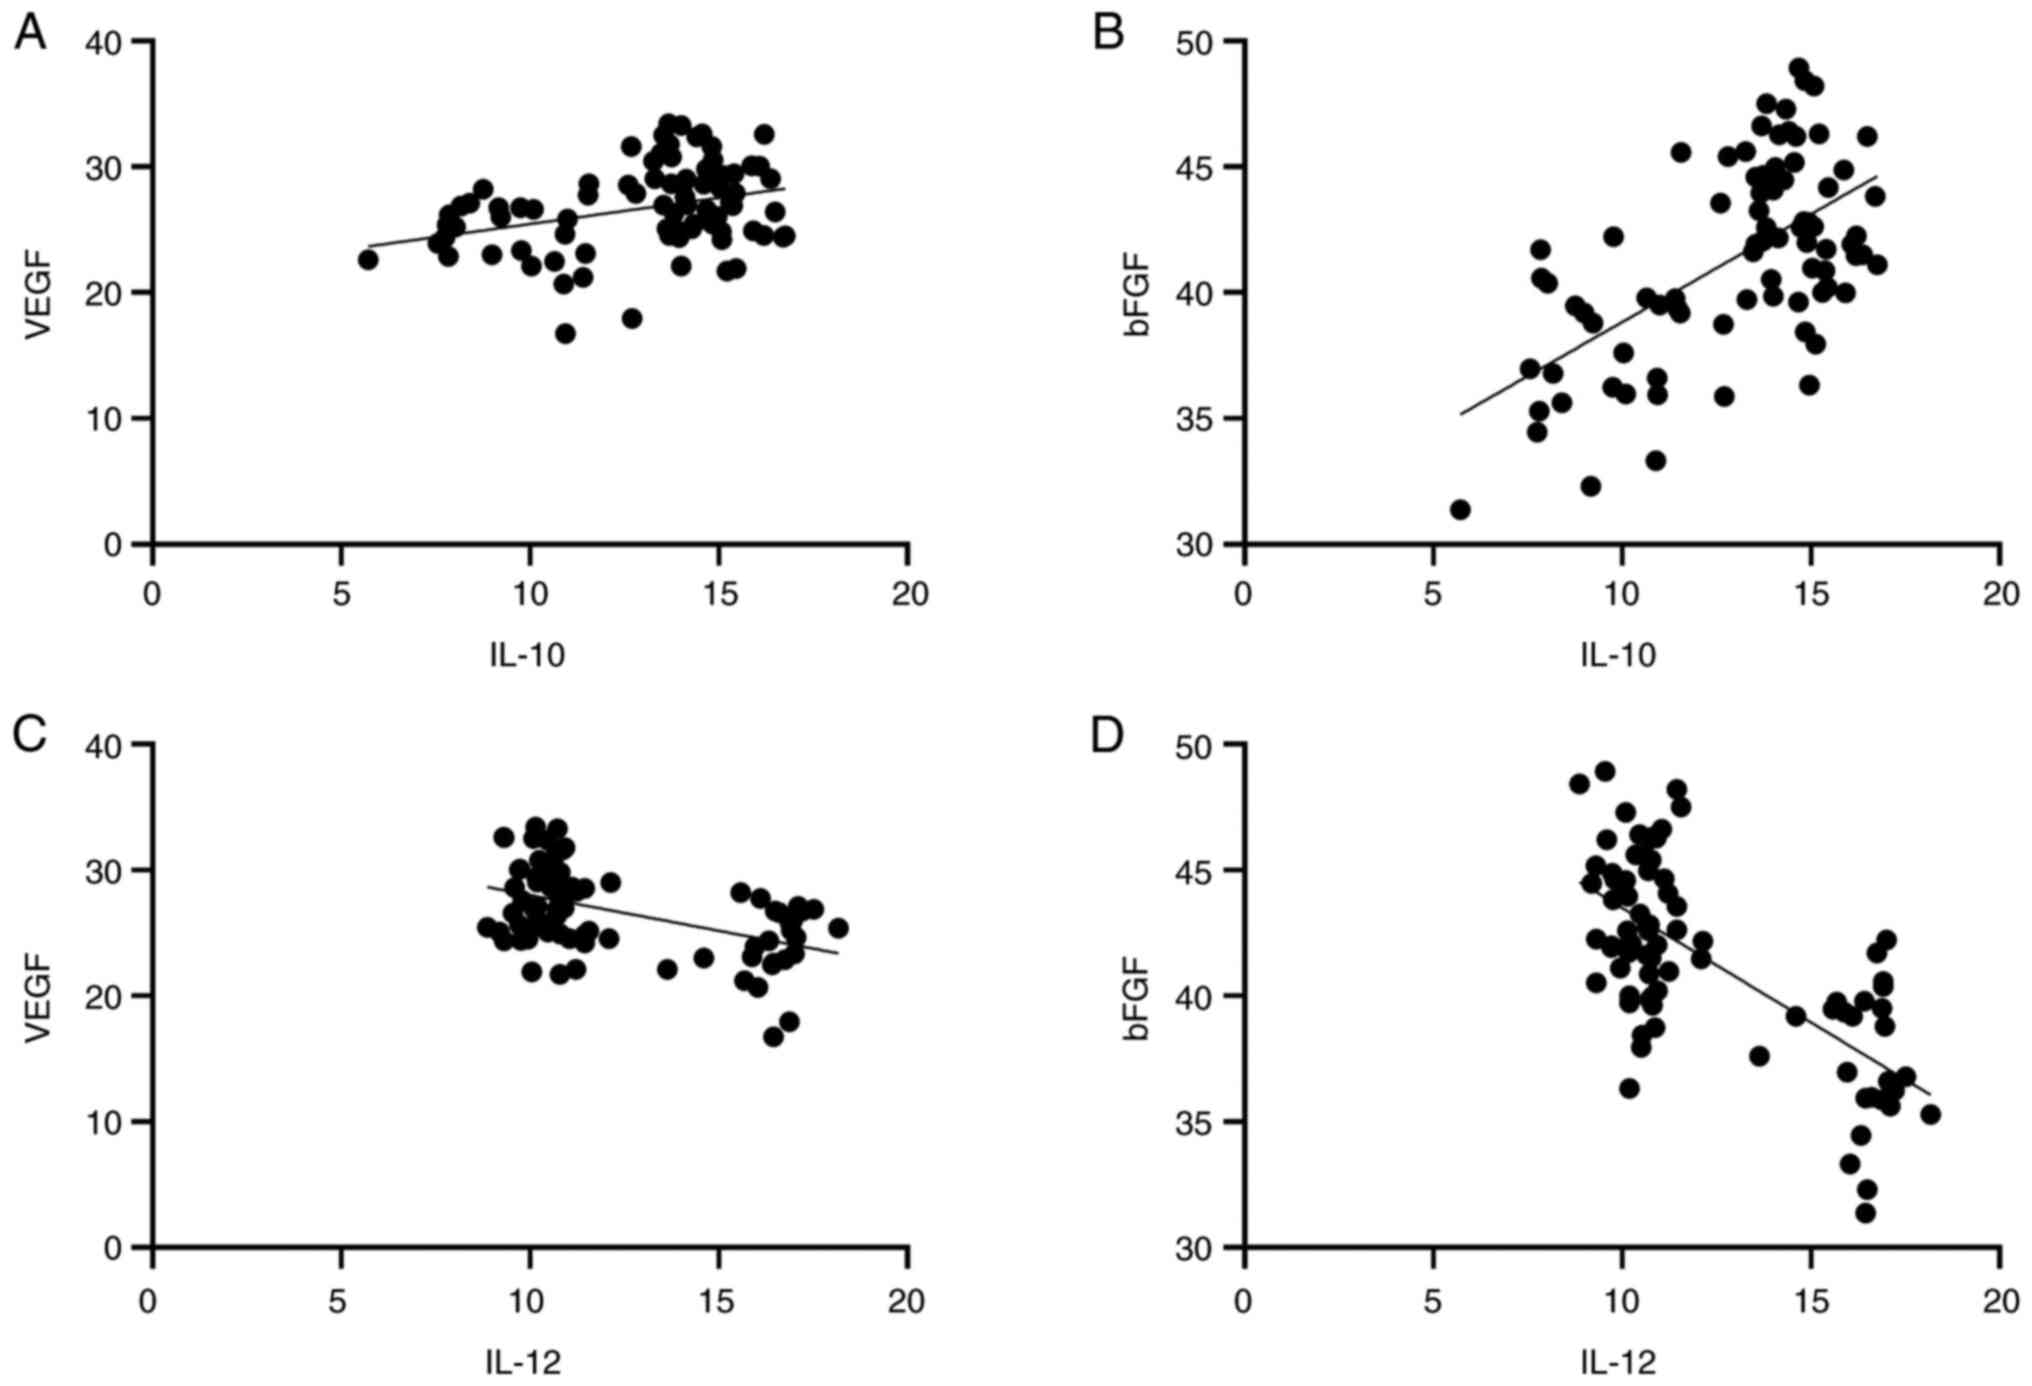
Correlation analysis of macrophage
activation specific factor with VEGF and bFGF
Pearson correlation analysis showed that IL-12 was
negatively correlated with VEGF and bFGF (r=-0.328, 0.600,
P<0.01). IL-10 was positively correlated with VEGF and bFGF
(r=0.481, 0.684, respectively; P<0.001; Table V and Fig. 4).
| Table VCorrelation analysis of macrophage
activation specific factor with VEGF and bFGF. |
Table V
Correlation analysis of macrophage
activation specific factor with VEGF and bFGF.
| | VEGF | bFGF |
|---|
| Indicator | r | P-value | r | P-value |
|---|
| IL-10 | 0.328 | 0.003 | 0.600 | <0.001 |
| IL-12 | -0.481 | <0.001 | -0.684 | <0.001 |
Discussion
Scaring is the natural repair reaction of skin
during wound healing and pathological scar is the abnormal
hyperplasia of scar, of which HS accounts for 91.40% of
pathological scars. HS can be accompanied by pain, itching and
other symptoms and not only affects the appearance and aesthetics,
but also can lead to dysfunction and affect the quality of life of
patients (14). Early evaluation
of the pathological process of HS and targeted intervention can
help to improve the symptoms and prognosis of patients. HS in
hyperplastic stage is characterized by hyperplasia of the dermis or
subcutaneous tissue, with a high degree of fibrosis. The dermis is
gray-white or gray-black in color and there are obvious
hyperplastic cells in the dermis fiber bundle (cicatricial multiple
tendinous scar) (15). HS tissue
in the hyperplastic stage can also occur on any part of the body
surface, such as the scar area of the wound after burns or the scar
area after skin grafting (16).
During the formation of HS in hyperplastic phase, two key factors
are particularly important. One is the accumulation of inflammatory
mediators in scar tissue and the other is the thickening of scar
caused by the proliferation of fibroblasts in dermis. Local
capillary congestion and collagen metabolism can lead to wound
inflammation and the proliferation of microorganisms such as
bacteria, fungi and other microorganisms, resulting in the killing
of abundant cells around the wound. At the same time, the above
toxic substances could not be absorbed by the surrounding tissues
and organs in time, thus causing inflammatory reaction and inducing
HS (17). Therefore, the
occurrence and development of HS are closely related to
inflammatory response.
Previous studies demonstrated that the lesion tissue
may have a relatively severe inflammatory reaction when dermal
tissue is seriously injured (18,19).
In order to neutralize the inflammatory response, the tissue may
evoke excessive accumulation of ECM, ultimately leading to the
occurrence of HS. IL-10 and IL-12 are specific factors for
macrophage activation, whose variant content reflect the changes in
the proportion of macrophage activation types (18,19).
M2 macrophages secrete anti-inflammatory mediator IL-10, which
inhibits the production of pro-inflammatory factors, blocks
inflammatory responses, alleviates inflammatory responses in
lesions, and promotes the remodeling and repair of local wound
tissues (20,21). M1 macrophages secrete the
pro-inflammatory mediator IL-12, which exacerbates the wound
inflammatory response and removes tissue pathogens, necrotic cells
and tissue debris by activating a variety of inflammatory factors
(22,23). The pathological process of HS
tissue is closely related to the transformation of M1 macrophages
into M2 macrophages. In the present study, the content of IL-10 was
lower and IL-12 levels were higher in the hyperplasia HS group
compared with those in the decline HS group. Furthermore, in the
hyperplasia HS group, the content of IL-10 was higher and the
content of IL-12 was lower in patients aged ≥30 years, with
protuberance height <2 mm, soft flexibility, low hyperemia
degree and no concomitant symptoms. It was hypothesized that the
proliferative scar in the clinical stage might have completed the
transformation process from M1 macrophages to M2 macrophages, which
was consistent with the different inflammatory clinical
manifestations of HS hyperplasia and hypoproliferative stages.
Thus, monitoring the changes of IL-10 and IL-12 levels can help to
evaluate the pathological process of HS.
VEGF is one of the common pro-angiogenic factors in
clinical research, which can promote vascular proliferation and
facilitate wound healing (24).
Activation of VEGF will stimulate endothelial cells to release more
angiogenic factors and cytokines, thus promoting wound healing.
Neonatal vascular endothelial cells are composed of numerous
endothelial cells that can proliferate continuously during cell
division. VEGF, which appears during the proliferation of new
endothelial cells, interacts with, and activates, inflammatory
cytokines in vivo to produce inflammatory factors, such as
autoantibodies, immunoglobulin A and its receptors (25). Early studies confirmed that
abnormal elevation of VEGF in HS tissue might participate in the
excessive proliferation of vascular endothelium in the lesion
tissue (5,26). bFGF is composed of polypeptide
complexes connected by bases or peptides and can stimulate the
proliferation and migration of fibroblasts, promote collagen
formation and accelerate the degradation of basement membrane and
ECM. In addition, bFGF regulates the production and secretion of
various cytokines, thereby regulating growth, immunity and local
tissue differentiation (26). In
the present study, the levels of VEGF and bFGF in the hyperplastic
HS group were lower than those in the decline HS group and the
levels of VEGF and bFGF were closely related to various clinical
features, indicating that VEGF and bFGF may be involved in the
occurrence and development of HS. Pearson correlation analysis
confirmed that IL-12 was negatively correlated with VEGF and bFGF
and IL-10 were positively correlated with VEGF and bFGF. Therefore,
the present study hypothesized that HS tissues in the proliferative
stage were mostly activated M1 macrophages. When M1 gradually
transformed into M2, IL-10 promoted the formation of fibroblasts
and angiogenesis by regulating the expression of VEGF and bFGF.
In general, macrophage activation-specific factors
were abnormally expressed in hyperplasia HS, most of which were
assumed to be M1 macrophages, accompanied by severe inflammatory
reaction. The transformation of M1 macrophages into M2 macrophages
might occur during the decline HS phase, which accelerates scar
formation by promoting the formation of fibroblasts and
angiogenesis. Detection of macrophage activation-specific factors
could help to evaluate the clinical stage of HS. How to inhibit the
continuous activation of M1 macrophages to make the activation of
M2 macrophages dominate, so as to make it closer to the temporal
transition of M1 and M2 macrophage activation in the process of
proliferative scarring after wound healing, may become a new
direction for the study on the mechanism of hypertrophic scaring
based on macrophages.
The formation of HS is a complex multi-factor
process. Based on the current understanding of the mechanism and
development process of scar neovascularization, the present study
found that macrophage activation-specific factors in HS may be a
potential treatment, prognosis and prediction target, which can
provide a new method and approach for the prevention and treatment
of HS. In the present study, the expression level of macrophage
activation-specific factors was determined and analyzed only for
clinical surgical removal of scar tissue, but it remains to further
verify the correlation between macrophage activation-specific
factors and scar development by using rabbit ear and rat tail wound
models and to explore and verify the mechanism of action.
Acknowledgements
Not applicable.
Funding
Funding: The present study was funded by the Jilin Provincial
Natural Science Foundation (grant no. 20210101241JC).
Availability of data and materials
The datasets used and/or analyzed during the current
study are available from the corresponding author on reasonable
request.
Authors' contributions
YZ and XZ conducted experiments, confirm the
authenticity of all the raw data and edited the manuscript. AY
designed the study, collected and processed the data. YZ and AY
conducted the statistical analysis. XZ reviewed and revised the
article. All authors read and approved the final manuscript.
Ethics approval and consent to
participate
All procedures performed in studies involving human
participants were in accordance with the ethical standards of the
institutional and/or national research committee and with the 1964
Helsinki declaration and its later amendments or comparable ethical
standards. All procedures performed in studies were in accordance
with the ethical standards of the ethics committee of the
Affiliated Hospital of Beihua University (approval no. 2021016).
Informed consent was obtained from all individual participants
included in the present study. The participating patients all
agreed to the publication of the research results.
Patient consent for publication
Not applicable.
Competing interests
The authors declare that they have no competing
interests.
References
|
1
|
Ogawa R, Dohi T, Tosa M, Aoki M and
Akaishi S: The latest strategy for keloid and hypertrophic scar
prevention and treatment: The Nippon medical school (NMS) Protocol.
J Nippon Med Sch. 88:2–9. 2021.PubMed/NCBI View Article : Google Scholar
|
|
2
|
Bi M, Sun P, Li D, Dong Z and Chen Z:
Intralesional injection of botulinum toxin type A compared with
intralesional injection of corticosteroid for the treatment of
hypertrophic scar and keloid: A systematic review and
meta-analysis. Med Sci Monit. 25:2950–2958. 2019.PubMed/NCBI View Article : Google Scholar
|
|
3
|
Nischwitz SP, Fink J, Schellnegger M, Luze
H, Bubalo V, Tetyczka C, Roblegg E, Holecek C, Zacharias M, Kamolz
LP and Kotzbeck P: The role of local inflammation and hypoxia in
the formation of hypertrophic scars-a new model in the Duroc pig.
Int J Mol Sci. 24(316)2022.PubMed/NCBI View Article : Google Scholar
|
|
4
|
Paish HL, Kalson NS, Smith GR, Del Carpio
Pons A, Baldock TE, Smith N, Swist-Szulik K, Weir DJ, Bardgett M,
Deehan DJ, et al: Fibroblasts promote inflammation and pain via
IL-1α induction of the monocyte chemoattractant chemokine (C-C
Motif) ligand 2. Am J Pathol. 188:696–714. 2018.PubMed/NCBI View Article : Google Scholar
|
|
5
|
Hedayatyanfard K, Haddadi NS, Ziai SA,
Karim H, Niazi F, Steckelings UM, Habibi B, Modarressi A and
Dehpour AR: The renin-angiotensin system in cutaneous hypertrophic
scar and keloid formation. Exp Dermatol. 29:902–909.
2020.PubMed/NCBI View Article : Google Scholar
|
|
6
|
Li J, Wang J, Wang Z, Xia Y, Zhou M, Zhong
A and Sun J: Experimental models for cutaneous hypertrophic scar
research. Wound Repair Regen. 28:126–144. 2020.PubMed/NCBI View Article : Google Scholar
|
|
7
|
Bahrami M, Haji Molla Hoseini M, Rezaei M
and Ziai SA: Umbelliprenin increases the M1/M2 ratio of macrophage
polarization and improves the M1 macrophage activity in THP-1 cells
cocultured with AGS cells. Evid Based Complement Alternat Med.
2021(9927747)2021.PubMed/NCBI View Article : Google Scholar
|
|
8
|
Wang HT, Han JT and Hu DH: Research
advances on the role and mechanism of inflammatory response in the
formation of hypertrophic scars and keloids. Zhonghua Shao Shang Za
Zhi. 37:490–494. 2021.PubMed/NCBI View Article : Google Scholar : (In Chinese).
|
|
9
|
Weber KJ, Sauer M, He L, Tycksen E,
Kalugotla G, Razani B and Schilling JD: PPARγ deficiency suppresses
the release of IL-1β and IL-1α in macrophages via a type 1
IFN-dependent mechanism. J Immunol. 201:2054–2069. 2018.PubMed/NCBI View Article : Google Scholar
|
|
10
|
Barone N, Safran T, Vorstenbosch J,
Davison PG, Cugno S and Murphy AM: Current advances in hypertrophic
scar and keloid management. Semin Plast Surg. 35:145–152.
2021.PubMed/NCBI View Article : Google Scholar
|
|
11
|
Lei JA, Zhou Y and Qin ZL: Research
advances on inflammatory responses involved in keloid development.
Zhonghua Shao Shang Za Zhi. 37:591–595. 2021.PubMed/NCBI View Article : Google Scholar : (In Chinese).
|
|
12
|
Ogawa R: The most current algorithms for
the treatment and prevention of hypertrophic scars and keloids: A
2020 update of the algorithms published 10 years ago. Plast
Reconstr Surg. 149:79e–94e. 2022.PubMed/NCBI View Article : Google Scholar
|
|
13
|
Bojanic C, To K, Hatoum A, Shea J, Seah
KTM, Khan W and Malata CM: Mesenchymal stem cell therapy in
hypertrophic and keloid scars. Cell Tissue Res. 383:915–930.
2021.PubMed/NCBI View Article : Google Scholar
|
|
14
|
Lee HJ and Jang YJ: Recent understandings
of biology, prophylaxis and treatment strategies for hypertrophic
scars and keloids. Int J Mol Sci. 19(711)2018.PubMed/NCBI View Article : Google Scholar
|
|
15
|
Frech FS, Hernandez L, Urbonas R, Zaken
GA, Dreyfuss I and Nouri K: Hypertrophic scars and keloids:
Advances in treatment and review of established therapies. Am J
Clin Dermatol. 24:225–245. 2023.PubMed/NCBI View Article : Google Scholar
|
|
16
|
Knowles A and Glass DA II: Keloids and
hypertrophic scars. Dermatol Clin. 41:509–517. 2023.PubMed/NCBI View Article : Google Scholar
|
|
17
|
Le X and Wu WW: The therapeutic effect of
Interleukin-18 on hypertrophic scar through inducing Fas ligand
expression. Burns. 47:430–438. 2021.PubMed/NCBI View Article : Google Scholar
|
|
18
|
Wei J, Wang Z, Zhong C, Ding H, Wang X and
Lu S: LncRNA MIR503HG promotes hypertrophic scar progression via
miR-143-3p-mediated Smad3 expression. Wound Repair Regen.
29:792–800. 2021.PubMed/NCBI View Article : Google Scholar
|
|
19
|
Zhang D, Li B and Zhao M: Therapeutic
strategies by regulating interleukin family to suppress
inflammation in hypertrophic scar and keloid. Front Pharmacol.
12(667763)2021.PubMed/NCBI View Article : Google Scholar
|
|
20
|
Shi J, Shi S, Xie W, Zhao M, Li Y, Zhang
J, Li N, Bai X, Cai W, Hu X, et al: IL-10 alleviates
lipopolysaccharide-induced skin scarring via IL-10R/STAT3 axis
regulating TLR4/NF-κB pathway in dermal fibroblasts. J Cell Mol
Med. 25:1554–1567. 2021.PubMed/NCBI View Article : Google Scholar
|
|
21
|
Chen J, Zhou R, Liang Y, Fu X, Wang D and
Wang C: Blockade of lncRNA-ASLNCS5088-enriched exosome generation
in M2 macrophages by GW4869 dampens the effect of M2 macrophages on
orchestrating fibroblast activation. FASEB J. 33:12200–12212.
2019.PubMed/NCBI View Article : Google Scholar
|
|
22
|
Xu X, Gu S, Huang X, Ren J, Gu Y, Wei C,
Lian X, Li H, Gao Y, Jin R, et al: The role of macrophages in the
formation of hypertrophic scars and keloids. Burns Trauma.
8(tkaa006)2020.PubMed/NCBI View Article : Google Scholar
|
|
23
|
Li T, Chen W, Zhang Q and Deng C:
Human-specific gene CHRFAM7A mediates M2 macrophage polarization
via the Notch pathway to ameliorate hypertrophic scar formation.
Biomed Pharmacother. 131(110611)2020.PubMed/NCBI View Article : Google Scholar
|
|
24
|
Wilgus TA: Vascular endothelial growth
factor and cutaneous scarring. Adv Wound Care (New Rochelle).
8:671–678. 2019.PubMed/NCBI View Article : Google Scholar
|
|
25
|
Apte RS, Chen DS and Ferrara N: VEGF in
signaling and disease: Beyond discovery and development. Cell.
176:1248–1264. 2019.PubMed/NCBI View Article : Google Scholar
|
|
26
|
Qi X, Liu Y and Yang M: Circ_0057452
functions as a ceRNA in hypertrophic scar fibroblast proliferation
and VEGF expression by regulating TGF-β2 expression and adsorbing
miR-145-5p. Am J Transl Res. 13:6200–6210. 2021.PubMed/NCBI
|