Introduction
Diabetes mellitus (DM) is a metabolic disorder with
the presence of hyperglycemia that is due to the impairment of
insulin secretion, defective insulin action or both (1). The prevalence of DM has increased
globally over the past decade, which is mainly due to the
continuous rise in the incidence of type 2 DM (2). Diabetic nephropathy (DN) is one of
the common complications in patients with DM (3,4). It
is reported that 5.02 million patients with type 1 DM suffer from
DN and 129.56 million patients with type 2 DM encounter DN in
2019(5). Clinically, albuminuria
is classic evidence for a DN diagnosis, with an aberrant level
representing a decrease in renal function that is associated with
DN progression (6-8).
As DN is a main cause of end-stage kidney disease and increases the
risk of mortality in patients with DM (5,6,9,10),
finding biomarkers that reflect the albuminuria level to further
estimate the development and progression of DN is important.
Cell division cycle 42 (CDC42), a member of the
guanosine triphosphatases (GTPase) family, regulates blood lipids,
inflammation, glycolysis and insulin secretion (11-13).
It has been recognized as an essential regulator in DM in several
studies (14-16).
For example, a previous study indicated that CDC42 promotes insulin
secretion via the Wnt/β-catenin pathway (14). Another study demonstrated that
inhibition of CDC42/β-catenin signaling suppresses the
glucose-stimulated insulin secretion, which leads to DM progression
(15). A previous mouse model
demonstrated that deletion of the CDC42 gene in pancreatic β cells
attenuates the insulin expression through inhibiting the
extracellular signal-regulated kinase 1/2 (ERK1/2)-neurogenic
differentiation 1 (NeuroD1) signaling pathway (16).
Furthermore, studies have indicated that CDC42
participates in the incidence and progression of DN (17,18).
For example, in a mouse model with DM decreased expression levels
and activity of CDC42 leads to podocyte apoptosis and proteinuria
(17). Another study reported that
CDC42 reduction under high glucose inhibits podocyte apoptosis and
affects β-cell insulin secretion in a type 2 DM-induced DN mouse
model (18). However, the clinical
role of CDC42 for estimating the development and progression of DN
in patients with DM is currently unknown.
Therefore, the aim of the present study was to
detect the serum CDC42 levels in patients with DM to investigate
its use in estimating the development and progression of DN in
these patients.
Materials and methods
Patients
During the period from February 2022 to November
2022, 306 patients with DM were consecutively enrolled in the
present study. The enrollment criteria were: i) Diagnosed with type
2 DM according to the criteria of the American Diabetes Association
(19); ii) ≥18 years old; and iii)
had the willingness for participation and the collection of
peripheral blood (PB). The exclusion criteria were: i) Had
autoimmune systemic immune diseases; ii) had hematological disease;
iii) had malignant disease; iv) had active infections; v) had other
documented renal diseases; and vi) had a history of renal surgery.
Clinicopathological characteristics of patients (including sex and
age distribution) are included in Table I. The present study was approved by
the Ethics Committee of Heilongjiang University of Chinese Medicine
(Harbin, China; approval no. HZYLL202000302). Written informed
consent was obtained from all patients.
 | Table IComparison of demographic
characteristics, disease features and biochemical indexes among
normoalbuminuria, microalbuminuria and macroalbuminuria groups. |
Table I
Comparison of demographic
characteristics, disease features and biochemical indexes among
normoalbuminuria, microalbuminuria and macroalbuminuria groups.
|
Characteristics | Normoalbuminuria
(N=185) | Microalbuminuria
(N=72) | Macroalbuminuria
(N=49) | P-value |
|---|
| Median age (IQR),
years | 56.0
(47.5-64.0) | 57.5
(51.3-64.0) | 63.0
(55.5-68.5) | <0.001 |
| Sex, n (%) | | | | 0.295 |
|
Female | 79 (42.7) | 25 (34.7) | 16 (32.7) | |
|
Male | 106 (57.3) | 47 (65.3) | 33 (67.3) | |
| Median BMI (IQR),
kg/m2 | 24.6
(22.5-27.0) | 25.6
(23.7-27.7) | 25.3
(23.0-30.1) | 0.124 |
| Smoking status, n
(%) | | | | 0.151 |
|
Never | 141 (76.2) | 47 (65.3) | 33 (67.3) | |
|
Former/current | 44 (23.8) | 25 (34.7) | 16 (32.7) | |
| Median DM duration
(IQR), years | 11.0
(7.5-15.0) | 14.0
(10.3-17.0) | 15.0
(11.0-21.0) | <0.001 |
| Median SBP (IQR),
mmHg | 129.0
(121.0-137.0) | 131.0
(123.3-138.8) | 136.0
(130.0-146.0) | 0.001 |
| Median DBP (IQR),
mmHg | 77.0
(71.0-85.0) | 78.0
(71.3-88.8) | 85.0
(72.5-93.5) | 0.042 |
| Median FBG (IQR),
mmol/l | 5.9 (4.9-8.0) | 6.4 (5.3-8.0) | 6.3 (5.4-8.8) | 0.109 |
| Median HbA1c (IQR),
% | 7.4 (6.5-8.1) | 7.6 (6.9-8.6) | 7.6 (6.8-8.8) | 0.040 |
| Median Scr (IQR),
mg/dl | 0.9 (0.8-1.0) | 1.0 (0.9-1.3) | 1.4 (1.1-1.8) | <0.001 |
| Median eGFR (IQR),
ml/min/1.73 m2 | 82.0
(69.2-97.7) | 72.6
(59.4-89.6) | 52.8
(35.9-63.7) | <0.001 |
| Median SUA (IQR),
µmol/l | 301.0
(259.0-351.5) | 320.0
(278.0-382.0) | 380.0
(322.0-451.5) | <0.001 |
| Median TG (IQR),
mmol/l | 1.2 (0.7-1.7) | 1.5 (0.9-2.2) | 1.3 (0.6-2.2) | 0.089 |
| Median TC (IQR),
mmol/l | 4.3 (3.7-5.2) | 4.9 (3.7-5.6) | 4.5 (4.0-5.4) | 0.156 |
| Median LDL-C (IQR),
mmol/l | 2.9 (2.3-3.6) | 3.2 (2.3-3.9) | 3.1 (2.5-3.9) | 0.213 |
| Median HDL-C (IQR),
mmol/l | 1.0 (0.9-1.2) | 1.1 (0.9-1.2) | 1.0 (0.9-1.1) | 0.634 |
| Median CRP (IQR),
mg/l | 3.8 (2.8-5.8) | 4.8 (3.4-7.0) | 5.9 (2.8-10.5) | 0.002 |
Grouping
In the present study, patients were divided into
three groups based on the urinary albumin-to-creatinine ratio
(UACR): i) Normoalbuminuria, UACR <30 mg/g (n=185); ii)
microalbuminuria, UACR of 30-300 mg/g (n=72); and iii)
macroalbuminuria, UACR >300 mg/g (n=49).
Measurements
Characteristics of the patients were collected after
enrollment, which included age, sex, body mass index (BMI), smoking
status, DM duration, blood pressure, fasting blood glucose (FBG),
hemoglobin A1c (HbA1c), serum creatine (Scr), serum uric acid
(SUA), lipid-related indexes and C reactive protein (CRP).
Furthermore, the estimated glomerular filtration rate (eGFR) was
calculated based on age and Scr according to the Chronic Kidney
Disease Epidemiology Collaboration equation (20).
Additionally, PB samples of the patients were
collected after enrollment, then the serum was isolated using a
centrifuge for 10 min (2,054 x g, 4˚C). The serum CDC42 was
measured using enzyme-linked immunosorbent assay (ELISA) using
human CDC42 ELISA kits (cat. no. YJ908876; Shanghai Enzyme Link
Biotechnology Co.) according to the manufacturer's protocols.
Statistical analysis
Data were processed using SPSS 26.0 (IBM Corp.).
Normality was determined using the Kolmogorov-Smirnov test. Median
values with interquartile range (IQR) were used to indicate
non-normally distributed variables. Comparisons were made using the
Wilcoxon rank sum, Kruskal-Wallis H rank sum and Chi-squared tests.
The post hoc comparisons were achieved using the Bonferroni test.
Correlations were assessed using Spearman's rank correlation test.
Whether CDC42 could distinguish between different patients was
assessed using receiver operating characteristic curves with area
under the curve (AUC) and the Youden index (sensitivity plus
specificity minus 1). Factors associated with microalbuminuria or
macroalbuminuria were screened using logistic regression analyses
with enter method. The model 1 included age and sex as factors,
which were the most common confounders; the model 2 adjusted for
factors included in model 1 and other factors including smoking
status, DM duration, systolic blood pressure (SBP), and diastolic
blood pressure (DBP); the model 3 adjusted for factors included in
model 2 and other factors including FBG, HbA1c, triglycerides (TG),
total cholesterol (TC), low density lipoprotein cholesterol
(LDL-C), high-density lipoprotein cholesterol (HDL-C), and CRP; the
model 4 adjusted for factors included in model 3 and other factors
including Scr, eGFR, and SUA. P<0.05 was considered to indicate
a statistically significant difference.
Results
Clinical characteristics
The median age was 56.0 (IQR, 47.5-64.0), 57.5 (IQR,
51.3-64.0) and 63.0 (IQR, 55.5-68.5) years in the normoalbuminuria,
microalbuminuria and macroalbuminuria groups, respectively
(P<0.001). There were 79 (42.7%) female and 106 (57.3%) male
patients in the normoalbuminuria group, 25 (34.7%) female and 47
(65.3%) male patients in the microalbuminuria group, and 16 (32.7%)
female and 33 (67.3%) male patients in the macroalbuminuria group
(P=0.295). The median DM duration was 11.0 (IQR, 7.5-15.0), 14.0
(IQR, 10.3-17.0) and 15.0 (IQR, 11.0-21.0) years in the
normoalbuminuria, microalbuminuria and macroalbuminuria groups,
respectively (P<0.001). Blood pressure indexes [including SBP
and DBP] and blood biochemical indexes (including HbA1c, Scr, SUA
and CRP) exhibited the highest levels in the macroalbuminuria
group, followed by the microalbuminuria group, and the lowest
levels in the normoalbuminuria group (all P<0.05). While eGFR
was at its lowest in the macroalbuminuria group, followed by the
microalbuminuria group, and highest in the normoalbuminuria group
(P<0.001). The detailed information is presented in Table I.
Serum CDC42 levels in patients with
DM
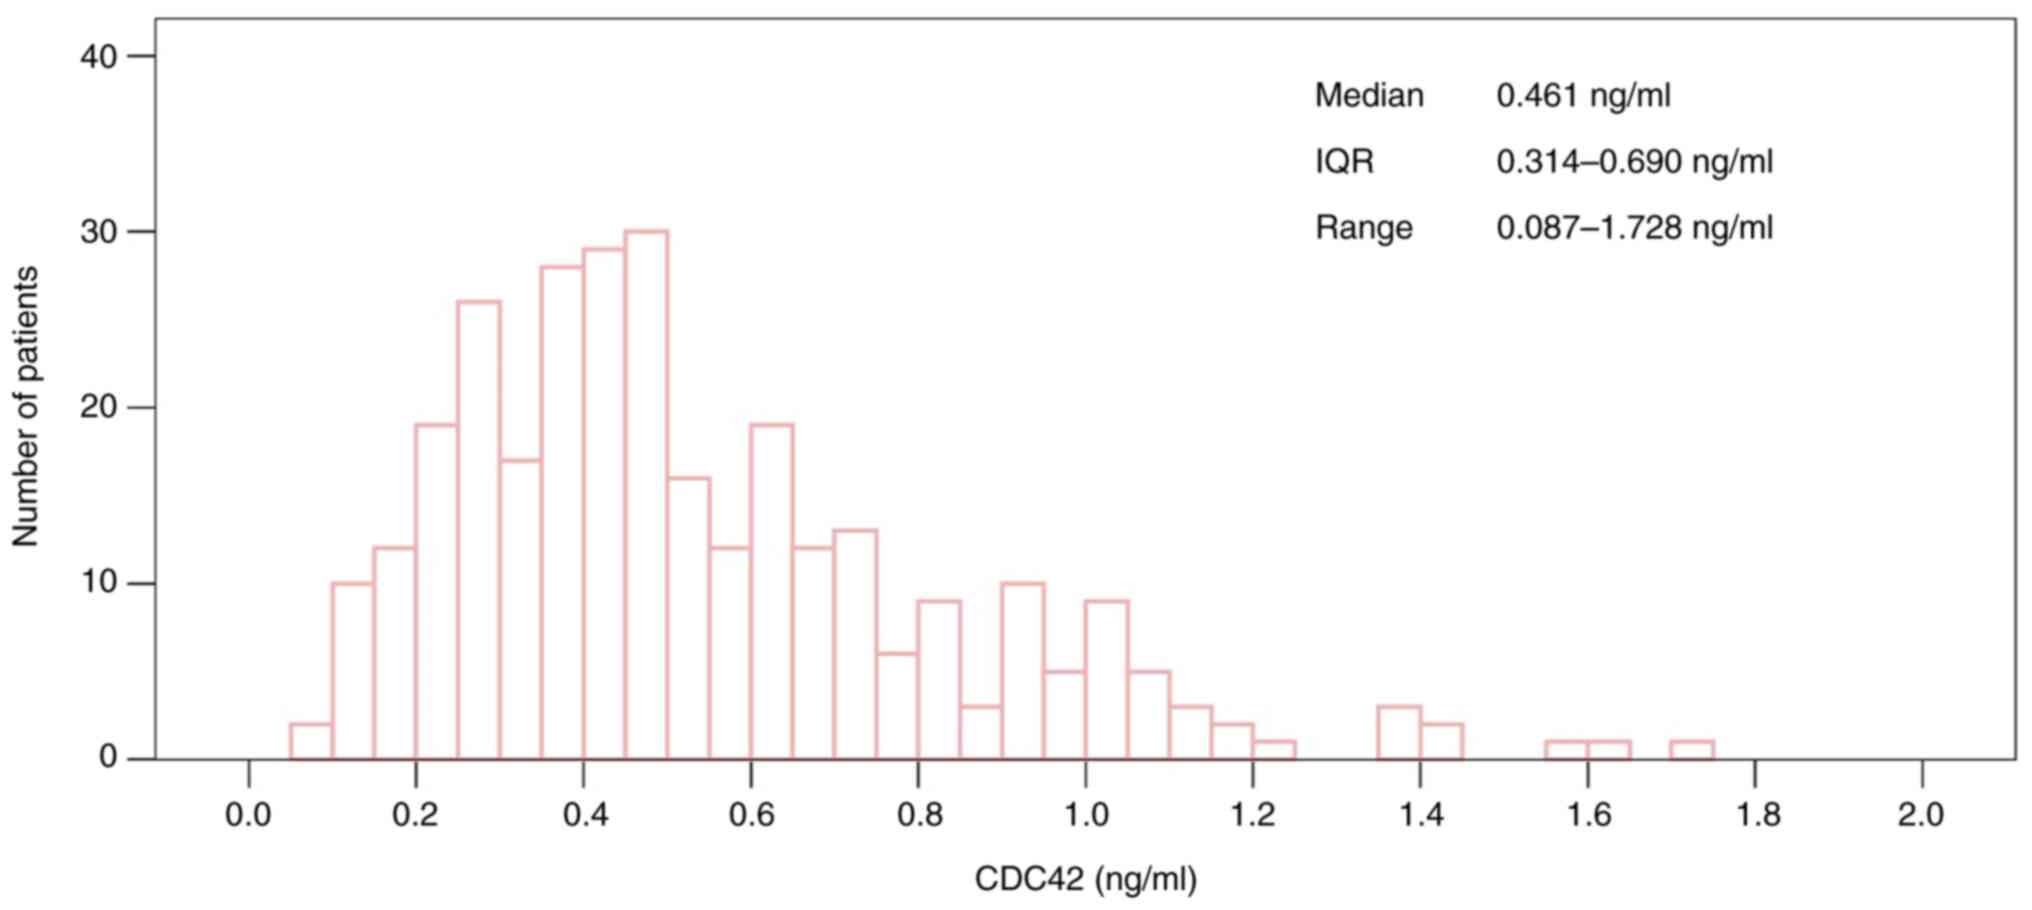
The median serum CDC42 level was 0.461 (IQR,
0.314-0.690) ng/ml in patients with DM, ranging from 0.087 to 1.728
ng/ml. The distribution of serum CDC42 levels in patients with DM
is presented in Fig. 1.
Correlation of serum CDC42 levels with
clinical characteristics of patients with DM
Serum CDC42 levels were negatively correlated with
BMI (P=0.020), SBP (P=0.016), HbA1c (P=0.027), Scr (P<0.001),
SUA (P=0.001) and CRP (P<0.001). While serum CDC42 level was
positively associated with eGFR (P<0.001). Additionally, serum
CDC42 levels were not associated with other clinical
characteristics, including age, sex, smoking status, DM duration,
DBP, FBG, TG, TC, LDL-C or HDL-C (all P>0.05) in all patients
with DM (Table II).
| Table IICorrelation of CDC42 with demographic
characteristics, disease features and biochemical indexes in
patients with DM. |
Table II
Correlation of CDC42 with demographic
characteristics, disease features and biochemical indexes in
patients with DM.
|
Characteristics | CDC42 (ng/ml),
median (IQR) | r/Z
value | P-value |
|---|
| Age,
yearsa | - | -0.092 | 0.108 |
| BMI,
kg/m2a | - | -0.133 | 0.020 |
| DM duration,
yearsa | - | -0.111 | 0.053 |
| SBP,
mmHga | - | -0.138 | 0.016 |
| DBP,
mmHga | - | -0.103 | 0.073 |
| FBG,
mmol/la | - | -0.098 | 0.085 |
| HbA1c,
%a | - | -0.127 | 0.027 |
| Scr,
mg/dla | - | -0.329 | <0.001 |
| eGFR, ml/min/1.73
m2a | - | 0.305 | <0.001 |
| SUA,
µmol/la | - | -0.190 | 0.001 |
| TG,
mmol/la | - | -0.097 | 0.090 |
| TC,
mmol/la | - | -0.102 | 0.076 |
| LDL-C,
mmol/la | - | -0.112 | 0.051 |
| HDL-C,
mmol/la | - | 0.023 | 0.684 |
| CRP,
mg/la | - | -0.213 | <0.001 |
| Sexb | | -0.828 | 0.407 |
|
Female | 0.459
(0.357-0.716) | | |
|
Male | 0.463
(0.297-0.680) | | |
| Smoking
statusb | | -1.220 | 0.222 |
|
Never | 0.477
(0.336-0.702) | | |
|
Former/current | 0.431
(0.273-0.675) | | |
Serum CDC42 levels in
normoalbuminuria, microalbuminuria and macroalbuminuria groups
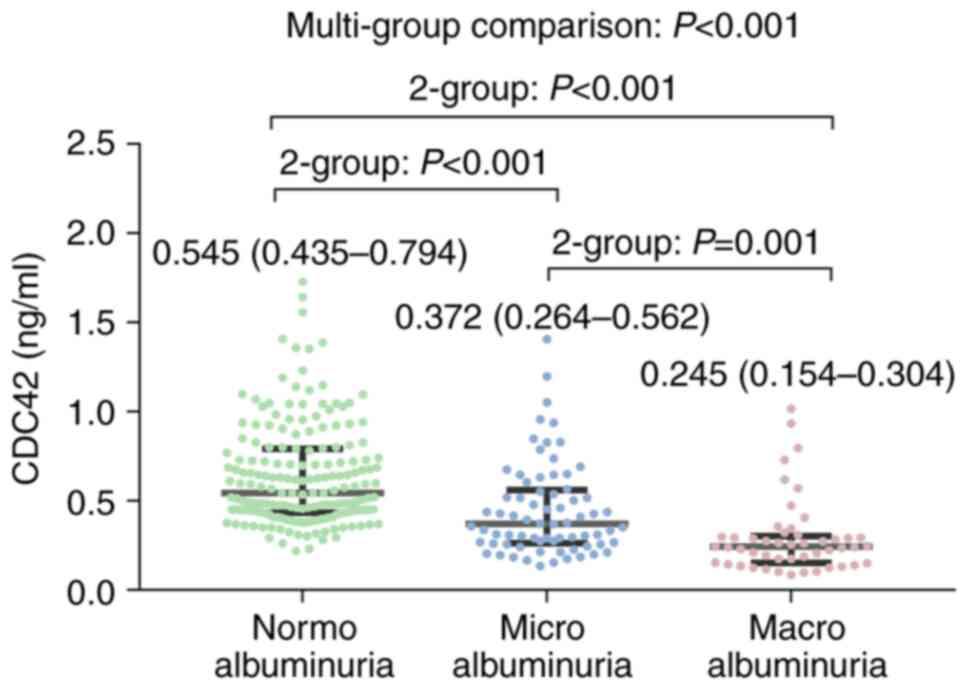
Serum CDC42 level was lowest in the macroalbuminuria
group (median, 0.245 ng/ml; IQR, 0.154-0.304 ng/ml), followed by
the microalbuminuria group (median, 0.372 ng/ml; IQR, 0.264-0.562
ng/ml) and highest in the normoalbuminuria group (median, 0.545
ng/ml; IQR, 0.435-0.794 ng/ml) (P<0.001). Two-group comparison
revealed that the serum CDC42 level was increased in the
normoalbuminuria group vs. microalbuminuria group (P<0.001), in
the normoalbuminuria group vs. macroalbuminuria group (P<0.001)
and in the microalbuminuria group vs. macroalbuminuria group
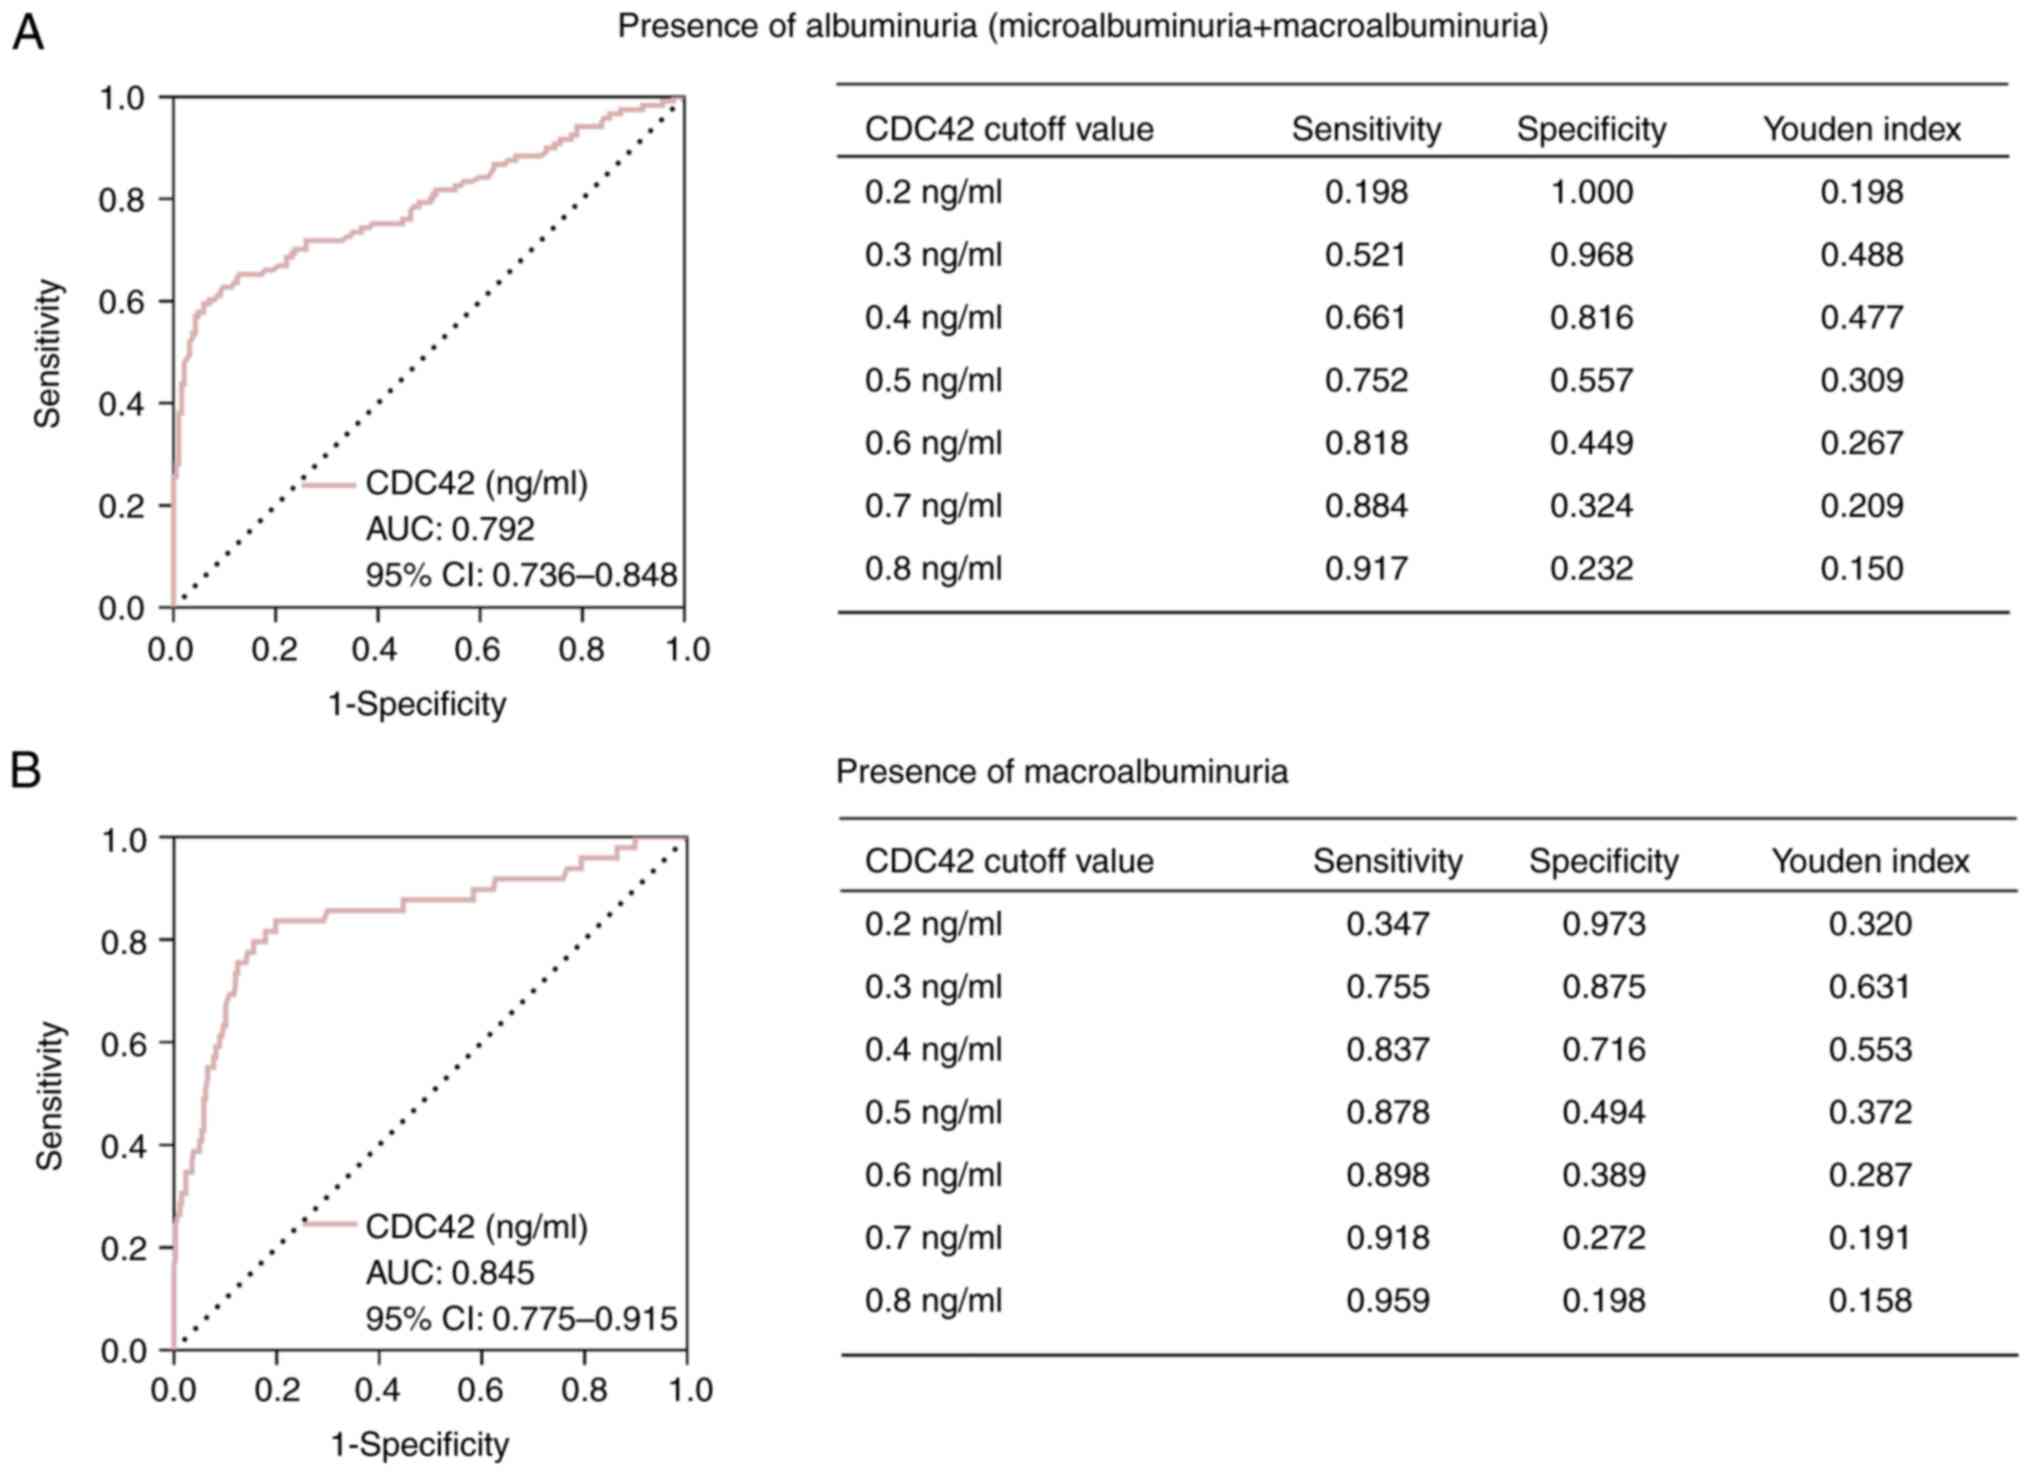
(P=0.001) (Fig. 2). In addition,
serum CDC42 levels indicated a value to distinguish albuminuria
(microalbuminuria + macroalbuminuria) from normoalbuminuria [AUC,
0.792; 95% confidence interval (CI), 0.736-0.848], with the optimal
cutoff value of 0.3 ng/ml among seven values (0.2-0.8 ng/ml)
(sensitivity, 0.521; specificity, 0.968; Youden index, 0.488)
(Fig. 3A). Furthermore, serum
CDC42 levels revealed a favorable capability for differentiating
macroalbuminuria from normoalbuminuria + microalbuminuria (AUC,
0.845; 95% CI, 0.775-0.915), with the optimal cutoff value of 0.3
ng/ml among seven values (sensitivity, 0.755; specificity, 0.875;
Youden index, 0.631) (Fig.
3B).
Associated factors for
albuminuria
Serum CDC42 levels (P<0.001) and eGFR
(P<0.001) were negatively associated with albuminuria, while age
(P<0.001), BMI (P=0.021), DM duration (P<0.001), SBP
(P=0.004), DBP (P=0.031), HbA1c (P=0.004), Scr (P<0.001), SUA
(P<0.001), TG (P=0.017) and CRP (P=0.001) were positively
correlated with albuminuria. Furthermore, serum CDC42 levels
(P<0.001) and eGFR (P<0.001) had a negative association with
macroalbuminuria, whereas age (P<0.001), BMI (P=0.025), DM
duration (P<0.001), SBP (P<0.001), DBP (P=0.020), HbA1c
(P=0.035), Scr (P<0.001), SUA (P<0.001) and CRP (P=0.001) had
a positive correlation with macroalbuminuria (Table SI). To further investigate the
predictive value of serum CDC42 levels for the presence of
albuminuria, four multivariate logistic models were established.
The four models elucidated that serum CDC42 levels were
independently negatively associated with the presence of
microalbuminuria (vs. normoalbuminuria) (all P<0.001),
macroalbuminuria (vs. normoalbuminuria) (most P<0.001),
microalbuminuria or macroalbuminuria (vs. normoalbuminuria) (all
P<0.001) and macroalbuminuria (vs. normoalbuminuria or
microalbuminuria) (all P<0.001). The detailed information is
listed in Table III.
| Table IIIFour different multivariate logistic
regression models for analyzing the correlation of CDC42 with the
presence of microalbuminuria, macroalbuminuria and microalbuminuria
+ macroalbuminuria in patients with DM. |
Table III
Four different multivariate logistic
regression models for analyzing the correlation of CDC42 with the
presence of microalbuminuria, macroalbuminuria and microalbuminuria
+ macroalbuminuria in patients with DM.
| | Model 1 | Model 2 | |
|---|
|
Characteristics | P-value | OR (95% CI) | P-value | OR (95% CI) | P-value | OR (95% CI) | P-value | OR (95% CI) |
|---|
| Presence of
microalbuminuria and macroalbuminuria | | | | | | | | |
|
Normoalbuminuria | Ref. | | Ref. | | Ref. | | Ref. | |
|
Microalbuminuria | <0.001 | 0.042
(0.010-0.172) | <0.001 | 0.045
(0.011-0.188) | <0.001 | 0.055
(0.013-0.237) | <0.001 | 0.050
(0.010-0.257) |
|
Macroalbuminuria | <0.001 | <0.001
(<0.001-0.001) | <0.001 | <0.001
(<0.001-0.003) | <0.001 | <0.001
(<0.001-0.004) | 0.007 | <0.001
(<0.001-0.044) |
| Presence of
microalbuminuria or macroalbuminuria | | | | | | | | |
|
Normoalbuminuria | Ref. | | Ref. | | Ref. | | Ref. | |
| Microalbuminuria or
macroalbuminuria | <0.001 | 0.017
(0.005-0.058) | <0.001 | 0.019
(0.005-0.069) | <0.001 | 0.023
(0.006-0.087) | <0.001 | 0.037
(0.008-0.169) |
| Presence of
macroalbuminuria | | | | | | | | |
| Normoalbuminuria or
microalbuminuria | Ref. | | Ref. | | | | Ref. | |
|
Macroalbuminuria | <0.001 | 0.001
(<0.001-0.008) | <0.001 | 0.001
(<0.001-0.016) | <0.001 | 0.001
(<0.001-0.019) | <0.001 | 0.006
(<0.001-0.094) |
Discussion
There have been a small number of studies
demonstrating the dysregulation of CDC42 in patients with metabolic
disorders (21,22). For example, a previous study
indicated that the PB CDC42 mRNA was decreased in patients with
obesity-associated metabolic syndrome compared with healthy
controls (21). Another study
demonstrated that CDC42 levels were increased in obesity-associated
asthma patients compared with normal-weight asthma patients
(22). Diabetes is also a chronic
metabolic disease, but currently, to the best of our knowledge, no
study has indicated CDC42 levels in patients with DM. The present
study quantified serum CDC42 levels and revealed the median was
0.461 ng/ml (IQR, 0.314-0.690 ng/ml) in patients with DM; range,
0.087 to 1.728 ng/ml. Compared with healthy controls in one
previous study (median, 0.668 ng/ml; IQR, 0.507-0.841 ng/ml)
(23), the serum CDC42 levels were
reduced in patients with DM in the present study. However, the
comparison of CDC42 levels between patients with DM and healthy
controls required further verification. Additionally, the present
study also revealed that serum CDC42 levels were negatively
associated with the microalbuminuria and macroalbuminuria in
patients with DM. The possible explanation could be that decreased
CDC42 inhibited actin cytoskeleton rearrangement of podocyte to
impair podocyte and induce podocyte apoptosis, while the podocyte
was essential for differentiation of glomerular epithelial cells
and the structure and function of the glomerular filtration barrier
(24,25). In addition, podocyte was exposed to
plasminogen due to the impaired glomerular filtration barrier,
resulting in further injury to kidney mediated by oxidative stress
(24-27).
Additionally, the present study also indicated that the optimal
cutoff value of serum CDC42 for identifying albuminuria and
macroalbuminuria in patients with DM might be 0.3 ng/ml, while its
utilization needed further validation.
Findings from the present study demonstrated that
increased serum CDC42 levels were correlated with increased eGFR in
patients with DM, suggesting its positive association with renal
function. The probable explanation could be: The formation and
function of glomerular filtration barrier relied on the actin-based
cytoskeleton podocyte, which was positively regulated by
CDC42(28). Moreover, CDC42
promoted the development of kidney tubules through regulating
epithelial cell polarity, lumen formation and the actin
cytoskeleton, leading to the promoted function of tubular function
(26). Meanwhile, CDC42 could
positively regulate the formation and function tubular cilia to
inhibit tubular cell apoptosis and fibrosis, leading to impaired
tubular function (29). According
to the aforementioned positive regulation of CDC42 on glomerular
and tubular function, elevated serum CDC42 levels could promote the
renal function in patients with DM. Additionally, the present study
also observed the negative correlation of serum CDC42 levels with
several indexes, including BMI, SBP, HbA1c, Scr, SUA and CRP, in
patients with DM. The possible reasons could be: First, CDC42 is
involved in cholesterol metabolism through regulating cytoskeleton,
therefore, impacting BMI (30).
Second, CDC42 participated in insulin secretion to affect blood
glucose concentration and its decrement led to increased HbA1c
(11,13). Third, CDC42 could negatively
regulate glucose as aforementioned, and the latter influenced SBP
(31). Fourth, as CDC42 was
negatively associated with glucose (as aforementioned) and SUA was
affected by glycemia, CDC42 was negatively associated with SUA
(32). Fifth, CDC42 was associated
with renal injury, which might result in increased Scr (26,28).
Finally, CDC42 was correlated with T cell activation and
inflammatory factor and suppressed immune response, affecting CRP
(33). Thus, serum CDC42 levels
were negatively correlated with these clinical characteristics in
patients with DM.
Sustained diabetes-associated metabolic and
hemodynamic perturbations can induce renal inflammation and drive
renal damage, eventually leading to renal fibrosis (34). Renal outcomes are worse in patients
with DM and albuminuria compared with normoalbuminuria; meanwhile,
patients with DN and higher levels of albuminuria exhibit worse
prognosis (35,36). Apart from previous studies in mice
with DM (17,18,26,37),
the present study confirmed that serum CDC42 levels were
independently negatively correlated with the presence of
microalbuminuria and macroalbuminuria in patients with DM,
suggesting it could estimate the attenuated severity of DN. One
possible reason could be that the low level of CDC42 under the high
glucose conditions induced podocyte apoptosis, which resulted in
unstable kidney barrier function in glomeruli and contributed to
protein loss, accelerating the development and progression of DN
(17,24,25,38,39).
Another possible reason could be that the deficiency of CDC42
promoted renal tubular epithelial cell-induced inflammation through
regulating cytoskeletal function, impacting albumin absorption and
aggravating DN (11,26,40).
Thus, the increased serum CDC42 levels reflected the attenuated
severity of DN, which might be a therapeutic strategy for
predicting DN in patients with DM. In addition, considering that
urinary albumin detection was a simple measurement for DN
diagnosis. Albuminuria was one of the most common clinical
characteristics of DN, but it was only a symptom. It was considered
that the detection of more biomarkers might help to understand the
pathogenesis of DN. Especially that CDC42 could regulate podocyte
apoptosis to take part in the development and progression of
DN.
However, the present study had a number of
limitations. First, the present study was a single-center study,
which might result in selective bias. Furthermore, the present
study only detected serum CDC42 levels in patients with DM at the
enrollment, and its level at multiple time points in the long term
as well as the corresponding value for predicting the development
and progression DN in patients with DM remained unclear. Third, the
present study found the negative correlation of serum CDC42 level
with the presence of microalbuminuria and macroalbuminuria, but not
DN risk, which required further exploration. Finally, the present
study estimated development and progression of DN through
microalbuminuria and macroalbuminuria in patients with DM; however,
the results needed to be further validated in patients who were
pathologically diagnosed as DN.
In conclusion, serum CDC42 levels were independently
negatively associated with the presence of albuminuria in patients
with DM, which may be a useful biomarker for estimating the
development and progression of DN in these patients.
Supplementary Material
Univariate logistic regression
analyses for correlation of affecting factors with the presence of
microalbuminuria + macroalbuminuria and macroalbuminuria in
patients with DM.
Acknowledgements
Not applicable.
Funding
Funding: The present study was supported by the Heilongjiang
University of Traditional Chinese Medicine ‘Double First Class’
Discipline Development Assistance Fund (grant no. HLJSYL21006) and
the Postdoctoral Foundation of Heilongjiang Province (grant no.
LBH-Z23284).
Availability of data and materials
The datasets used and/or analyzed during the current
study are available from the corresponding author on reasonable
request.
Authors' contributions
HY, JM and NZ designed the study. YG and WZ
collected the data. HY, JM, WZ and NZ analyzed the data. HY, JM and
WZ drafted the manuscript. YG and NZ revised the manuscript. JM and
NZ confirm the authenticity of all the raw data. All authors read
and approved the final manuscript.
Ethics approval and consent to
participate
The present study was approved by the Ethics
Committee of Heilongjiang University of Chinese Medicine (Harbin,
China; approval no. HZYLL202000302). Written informed consent was
obtained from all patients.
Patient consent for publication
Not applicable.
Competing interests
The authors declare that they have no competing
interests.
References
|
1
|
Schleicher E, Gerdes C, Petersmann A,
Muller-Wieland D, Muller UA, Freckmann G, Heinemann L, Nauck M and
Landgraf R: Definition, Classification and Diagnosis of Diabetes
Mellitus. Exp Clin Endocrinol Diabetes. 130(S 01):S1–S8.
2022.PubMed/NCBI View Article : Google Scholar
|
|
2
|
Lovic D, Piperidou A, Zografou I, Grassos
H, Pittaras A and Manolis A: The growing epidemic of diabetes
mellitus. Curr Vasc Pharmacol. 18:104–109. 2020.PubMed/NCBI View Article : Google Scholar
|
|
3
|
Yeram PB and Kulkarni YA: Glycosides and
vascular complications of diabetes. Chem Biodivers.
19(e202200067)2022.PubMed/NCBI View Article : Google Scholar
|
|
4
|
Eid S, Sas KM, Abcouwer SF, Feldman EL,
Gardner TW, Pennathur S and Fort PE: New insights into the
mechanisms of diabetic complications: Role of lipids and lipid
metabolism. Diabetologia. 62:1539–1549. 2019.PubMed/NCBI View Article : Google Scholar
|
|
5
|
Deng Y, Li N, Wu Y, Wang M, Yang S, Zheng
Y, Deng X, Xiang D, Zhu Y, Xu P, et al: Global, Regional, and
National Burden of diabetes-related chronic kidney disease from
1990 to 2019. Front Endocrinol (Lausanne).
12(672350)2021.PubMed/NCBI View Article : Google Scholar
|
|
6
|
Natesan V and Kim SJ: Diabetic
Nephropathy-a review of risk factors, progression, mechanism, and
dietary management. Biomol Ther (Seoul). 29:365–372.
2021.PubMed/NCBI View Article : Google Scholar
|
|
7
|
Kopel J, Pena-Hernandez C and Nugent K:
Evolving spectrum of diabetic nephropathy. World J Diabetes.
10:269–279. 2019.PubMed/NCBI View Article : Google Scholar
|
|
8
|
Sagoo MK and Gnudi L: Diabetic
nephropathy: An overview. Methods Mol Biol. 2067:3–7.
2020.PubMed/NCBI View Article : Google Scholar
|
|
9
|
Faselis C, Katsimardou A, Imprialos K,
Deligkaris P, Kallistratos M and Dimitriadis K: Microvascular
complications of type 2 diabetes mellitus. Curr Vasc Pharmacol.
18:117–124. 2020.PubMed/NCBI View Article : Google Scholar
|
|
10
|
Selby NM and Taal MW: An updated overview
of diabetic nephropathy: Diagnosis, prognosis, treatment goals and
latest guidelines. Diabetes Obes Metab. 22 (Suppl 1):S3–S15.
2020.PubMed/NCBI View Article : Google Scholar
|
|
11
|
Huang QY, Lai XN, Qian XL, Lv LC, Li J,
Duan J, Xiao XH and Xiong LX: Cdc42: A novel regulator of insulin
secretion and diabetes-associated diseases. Int J Mol Sci.
20(179)2019.PubMed/NCBI View Article : Google Scholar
|
|
12
|
Tackenberg H, Moller S, Filippi MD and
Laskay T: The Small GTPase Cdc42 is a major regulator of neutrophil
effector functions. Front Immunol. 11(1197)2020.PubMed/NCBI View Article : Google Scholar
|
|
13
|
Moller LLV, Klip A and Sylow L: Rho
GTPases-Emerging regulators of glucose homeostasis and metabolic
health. Cells. 8(434)2019.PubMed/NCBI View Article : Google Scholar
|
|
14
|
Xiao XH, Huang QY, Qian XL, Duan J, Jiao
XQ, Wu LY, Huang QY, Li J, Lai XN, Shi YB and Xiong LX: Cdc42
Promotes ADSC-Derived IPC induction, proliferation, and insulin
secretion via wnt/beta-catenin signaling. Diabetes Metab Syndr
Obes. 12:2325–2339. 2019.PubMed/NCBI View Article : Google Scholar
|
|
15
|
Duan J, Qian XL, Li J, Xiao XH, Lu XT, Lv
LC, Huang QY, Ding W, Zhang HY and Xiong LX: miR-29a negatively
affects glucose-stimulated insulin secretion and MIN6 cell
proliferation via Cdc42/β-Catenin signaling. Int J Endocrinol.
2019(5219782)2019.PubMed/NCBI View Article : Google Scholar
|
|
16
|
He XQ, Wang N, Zhao JJ, Wang D, Wang CJ,
Xie L, Zheng HY, Shi SZ, He J, Zhou J, et al: Specific deletion of
CDC42 in pancreatic beta cells attenuates glucose-induced insulin
expression and secretion in mice. Mol Cell Endocrinol.
518(111004)2020.PubMed/NCBI View Article : Google Scholar
|
|
17
|
Huang Z, Zhang L, Chen Y, Zhang H, Zhang
Q, Li R, Ma J, Li Z, Yu C, Lai Y, et al: Cdc42 deficiency induces
podocyte apoptosis by inhibiting the Nwasp/stress fibers/YAP
pathway. Cell Death Dis. 7(e2142)2016.PubMed/NCBI View Article : Google Scholar
|
|
18
|
Jiang S, Xu CM, Yao S, Zhang R, Li XZ,
Zhang RZ, Xie TY, Xing YQ, Zhang Q, Zhou XJ, et al: Cdc42
upregulation under high glucose induces podocyte apoptosis and
impairs β-cell insulin secretion. Front Endocrinol (Lausanne).
13(905703)2022.PubMed/NCBI View Article : Google Scholar
|
|
19
|
American Diabetes Association. Diagnosis
and classification of diabetes mellitus. Diabetes Care. 35 (Suppl
1):S64–S71. 2012.PubMed/NCBI View Article : Google Scholar
|
|
20
|
Levey AS, Stevens LA, Schmid CH, Zhang YL,
Castro AF III, Feldman HI, Kusek JW, Eggers P, Van Lente F, Greene
T, et al: A new equation to estimate glomerular filtration rate.
Ann Intern Med. 150:604–612. 2009.PubMed/NCBI View Article : Google Scholar
|
|
21
|
Tabur S, Oztuzcu S, Oguz E, Korkmaz H,
Eroglu S, Ozkaya M and Demiryurek AT: Association of Rho/Rho-kinase
gene polymorphisms and expressions with obesity-related metabolic
syndrome. Eur Rev Med Pharmacol Sci. 19:1680–1688. 2015.PubMed/NCBI
|
|
22
|
Rastogi D, Nico J, Johnston AD, Tobias
TAM, Jorge Y, Macian F and Greally JM: CDC42-related genes are
upregulated in helper T cells from obese asthmatic children. J
Allergy Clin Immunol. 141:539–548 e7. 2018.PubMed/NCBI View Article : Google Scholar
|
|
23
|
Feng Q, Guo J, Hou A, Guo Z, Zhang Y, Guo
Y, Liu S, Cheng Z, Sun L, Meng L and Han S: The clinical role of
serum cell division control 42 in coronary heart disease. Scand J
Clin Lab Invest. 83:45–50. 2023.PubMed/NCBI View Article : Google Scholar
|
|
24
|
Ahmadian E, Eftekhari A, Atakishizada S,
Valiyeva M, Ardalan M, Khalilov R and Kavetskyy T: Podocytopathy:
The role of actin cytoskeleton. Biomed Pharmacother.
156(113920)2022.PubMed/NCBI View Article : Google Scholar
|
|
25
|
Sun Y, Cui S, Hou Y and Yi F: The updates
of podocyte lipid metabolism in proteinuric kidney disease. Kidney
Dis (Basel). 7:438–451. 2021.PubMed/NCBI View Article : Google Scholar
|
|
26
|
Elias BC, Das A, Parekh DV, Mernaugh G,
Adams R, Yang Z, Brakebusch C, Pozzi A, Marciano DK, Carroll TJ and
Zent R: Cdc42 regulates epithelial cell polarity and cytoskeletal
function during kidney tubule development. J Cell Sci.
128:4293–4305. 2015.PubMed/NCBI View Article : Google Scholar
|
|
27
|
Raij L, Tian R, Wong JS, He JC and
Campbell KN: Podocyte injury: The role of proteinuria, urinary
plasminogen, and oxidative stress. Am J Physiol Renal Physiol.
311:F1308–F1317. 2016.PubMed/NCBI View Article : Google Scholar
|
|
28
|
Steichen C, Herve C, Hauet T and
Bourmeyster N: Rho GTPases in kidney physiology and diseases. Small
GTPases. 13:141–161. 2022.PubMed/NCBI View Article : Google Scholar
|
|
29
|
Choi SY, Chacon-Heszele MF, Huang L,
McKenna S, Wilson FP, Zuo X and Lipschutz JH: Cdc42 deficiency
causes ciliary abnormalities and cystic kidneys. J Am Soc Nephrol.
24:1435–1450. 2013.PubMed/NCBI View Article : Google Scholar
|
|
30
|
Nofer JR, Feuerborn R, Levkau B, Sokoll A,
Seedorf U and Assmann G: Involvement of Cdc42 signaling in
apoA-I-induced cholesterol efflux. J Biol Chem. 278:53055–53062.
2003.PubMed/NCBI View Article : Google Scholar
|
|
31
|
Cinar Y, Senyol AM and Duman K: Blood
viscosity and blood pressure: Role of temperature and
hyperglycemia. Am J Hypertens. 14 (5 Pt 1):433–438. 2001.PubMed/NCBI View Article : Google Scholar
|
|
32
|
Volpe A, Ye C, Hanley AJ, Connelly PW,
Zinman B and Retnakaran R: Changes over time in uric acid in
relation to changes in insulin sensitivity, beta-cell function, and
glycemia. J Clin Endocrinol Metab. 105:e651–e659. 2020.PubMed/NCBI View Article : Google Scholar
|
|
33
|
Li Y, Yang W and Wang F: The relationship
of blood CDC42 level with Th1 cells, Th17 cells, inflammation
markers, disease risk/activity, and treatment efficacy of
rheumatoid arthritis. Ir J Med Sci. 191:2155–2161. 2022.PubMed/NCBI View Article : Google Scholar
|
|
34
|
Bai S, Zeng R, Zhou Q, Liao W, Zhang Y, Xu
C, Han M, Pei G, Liu L, Liu X, et al: Cdc42-interacting protein-4
promotes TGF-B1-induced epithelial-mesenchymal transition and
extracellular matrix deposition in renal proximal tubular
epithelial cells. Int J Biol Sci. 8:859–869. 2012.PubMed/NCBI View Article : Google Scholar
|
|
35
|
Lee YH, Kim KP, Kim YG, Moon JY, Jung SW,
Park E, Kim JS, Jeong KH, Lee TW, Ihm CG, et al:
Clinicopathological features of diabetic and nondiabetic renal
diseases in type 2 diabetic patients with nephrotic-range
proteinuria. Medicine (Baltimore). 96(e8047)2017.PubMed/NCBI View Article : Google Scholar
|
|
36
|
Wada T, Shimizu M, Toyama T, Hara A,
Kaneko S and Furuichi K: Clinical impact of albuminuria in diabetic
nephropathy. Clin Exp Nephrol. 16:96–101. 2012.PubMed/NCBI View Article : Google Scholar
|
|
37
|
Blattner SM, Hodgin JB, Nishio M, Wylie
SA, Saha J, Soofi AA, Vining C, Randolph A, Herbach N, Wanke R, et
al: Divergent functions of the Rho GTPases Rac1 and Cdc42 in
podocyte injury. Kidney Int. 84:920–930. 2013.PubMed/NCBI View Article : Google Scholar
|
|
38
|
Rico-Fontalvo J, Aroca G, Cabrales J,
Daza-Arnedo R, Yanez-Rodriguez T, Martinez-Avila MC, Uparella-Gulfo
I and Raad-Sarabia M: Molecular mechanisms of diabetic kidney
disease. Int J Mol Sci. 23(8668)2022.PubMed/NCBI View Article : Google Scholar
|
|
39
|
Samsu N: Diabetic nephropathy: Challenges
in pathogenesis, diagnosis, and treatment. Biomed Res Int.
2021(1497449)2021.PubMed/NCBI View Article : Google Scholar
|
|
40
|
Jia Y, Zheng Z, Xue M, Zhang S, Hu F, Li
Y, Yang Y, Zou M, Li S, Wang L, et al: Extracellular vesicles from
albumin-induced tubular epithelial cells promote the M1 macrophage
phenotype by targeting klotho. Mol Ther. 27:1452–1466.
2019.PubMed/NCBI View Article : Google Scholar
|