Introduction
Spinal cord injury (SCI) is a severe complication of
spinal fractures, where the spinal cord or cauda equina sustains
varying degrees of damage due to vertebral displacement or bone
fragments invading the spinal canal (1). The necrotic and apoptotic cells at
the site of SCI release various neuroinflammatory signals
recruiting local and infiltrating immune cells and regulating
inflammatory cascade reactions. Sensory, motor and autonomic
dysfunction caused by SCI leaves patients unable to care for
themselves, resulting in a significant economic burden on their
family and on society (2). Despite
significant advances in medical care for SCI, it remains a
challenge for clinical physicians for a number of years and current
treatment plans primarily focus on providing supportive measures
(3,4).
Microglia are permanent immune cells widely
distributed in the central nervous system (CNS), contributing to
the maintenance of neuronal function and playing a crucial role in
phagocytosis, immune regulation and neural repair (5). Under physiological conditions,
microglia can actively monitor the CNS environment and respond to
disruptive signals, clearing cell debris and modulating synaptic
transmission (6). The microglial
population is dynamic in regulating the innate immune response of
the CNS (7). Additionally, the
functional phenotype of microglia varies when different regions of
the CNS are damaged (8,9). Compared with neurotrauma in brain
regions, microglia play a more pronounced dual role in the
pathophysiological processes following SCI, acting both
beneficially and harmfully (10).
In the early stages of SCI, microglia rapidly gather around the
lesion to provide protection, but with the continued accumulation
of injury factors, over-activated microglia produce harmful
substances, exacerbating spinal cord tissue damage and affecting
functional recovery (11).
Although numerous studies demonstrate the crucial role of microglia
post-SCI (10-14),
the potential mechanisms require further exploration.
Microglia are macrophages resident in the CNS,
maintaining tissue homeostasis through phagocytosis (15). The apoptotic cell clearance is the
final step in efferocytosis (16).
Efferocytosis mainly comprises four steps: Identification of
apoptotic cells, recognition of apoptotic cells adjacent to
engulfing cells, internalization of apoptotic cells by engulfing
cells and degradation of apoptotic cells within engulfing cells
(17). Multiple signaling
molecules cooperate to regulate the entire phagocytic clearance
process, from ‘find me’ signals to ‘eat me’ signals and beyond
(18). The distinct expression of
apoptotic cell surface markers initiates the migration and
recognition of early phagocytic cells, triggering timely and
efficient phagocytosis to avoid inflammation spreading or to
maintain homeostatic balance (19). The clearance of apoptotic cells by
microglia not only serves a significant neuroprotective role in
degenerative diseases (20) but
also has positive effects in neuronal death and clearance in acute
brain trauma (21) and brain
ischemia-hypoxia (22). Despite
the considerable attention focused on efferocytosis, the mechanisms
of microglial clearance of apoptotic cells following SCI have been
overlooked and require further research for clarification.
Bioinformatics, as a practical interdisciplinary
field combining molecular biology and information technology, has
partially revealed the potential mechanisms of diseases at the
molecular level, providing new avenues for the diagnosis and
treatment of human diseases (23).
High-throughput chip sequencing technology rapidly captures
differential gene expression profiles and efficiently acquires
biological information on a large scale and is widely employed in
basic medical research and disease diagnostics (24). Machine learning refers to a
category of algorithms aiming to extract hidden rules from
extensive historical data for prediction or classification purposes
(25). Due to the expanding scale
of biological data and the inherent complexity of machine learning,
it has been widely and deeply applied in bioinformatics to aid in
establishing predictive and analytical models explaining potential
biological processes (25).
Innovations in technologies such as high-throughput sequencing have
brought new advancements in the study of microglial heterogeneity
(26). The present study aimed to
explore the mechanism of apoptosis clearance of microglia post-SCI
using various machine-learning algorithms.
Mertk, a member of the TAM (Tyro3, Axl, Mertk)
receptor tyrosine kinase family, is primarily expressed by
microglial cells (27,28). A number of studies indicate that
Mertk regulates the phagocytic clearance of apoptotic cells and
myelin debris by microglia and macrophages (29-31).
UNC569 is an ATP-competitive, reversible, orally active
MerTK-specific inhibitor that can inhibit the clearance function of
microglia (32). It is well-known
that stimulating microglia with lipopolysaccharide (LPS) can
simulate neuroinflammation in microglia (33-35),
with multiple studies demonstrating the feasibility of this method
(36-39).
The present study comprehensively analyzed the data
from GSE96055(40) using various
machine learning algorithms and bioinformatics tools to uncover the
crucial mechanisms and key genes of microglia involved in SCI and
experimentally validate them through treatment with LPS + UNC569 on
the BV2 cell line. The present study provided unique insights into
the mechanisms through which microglia regulate inflammation
following SCI and their involvement in neuronal regulation,
offering potential targets and theoretical foundations for the
diagnosis and treatment of SCI.
Materials and methods
Download expression matrix data
The expression matrix for GSE96055(40) was derived from the GEO database
(https://www.geoncbi.nlm.nih.gov/). The
age of rats used in the data set is ~12 weeks and the data set is
based on GPL17021 platform analysis (40). Microglia were purified by flow
cytometry fluorescence sorter (FACS) in non-injured CX3CR1+/eGFP
mice and at 3 time points (3, 7 and 14 days) following moderate and
severe SCI (40). Gene profiles
were then compared (Fig. 1A).
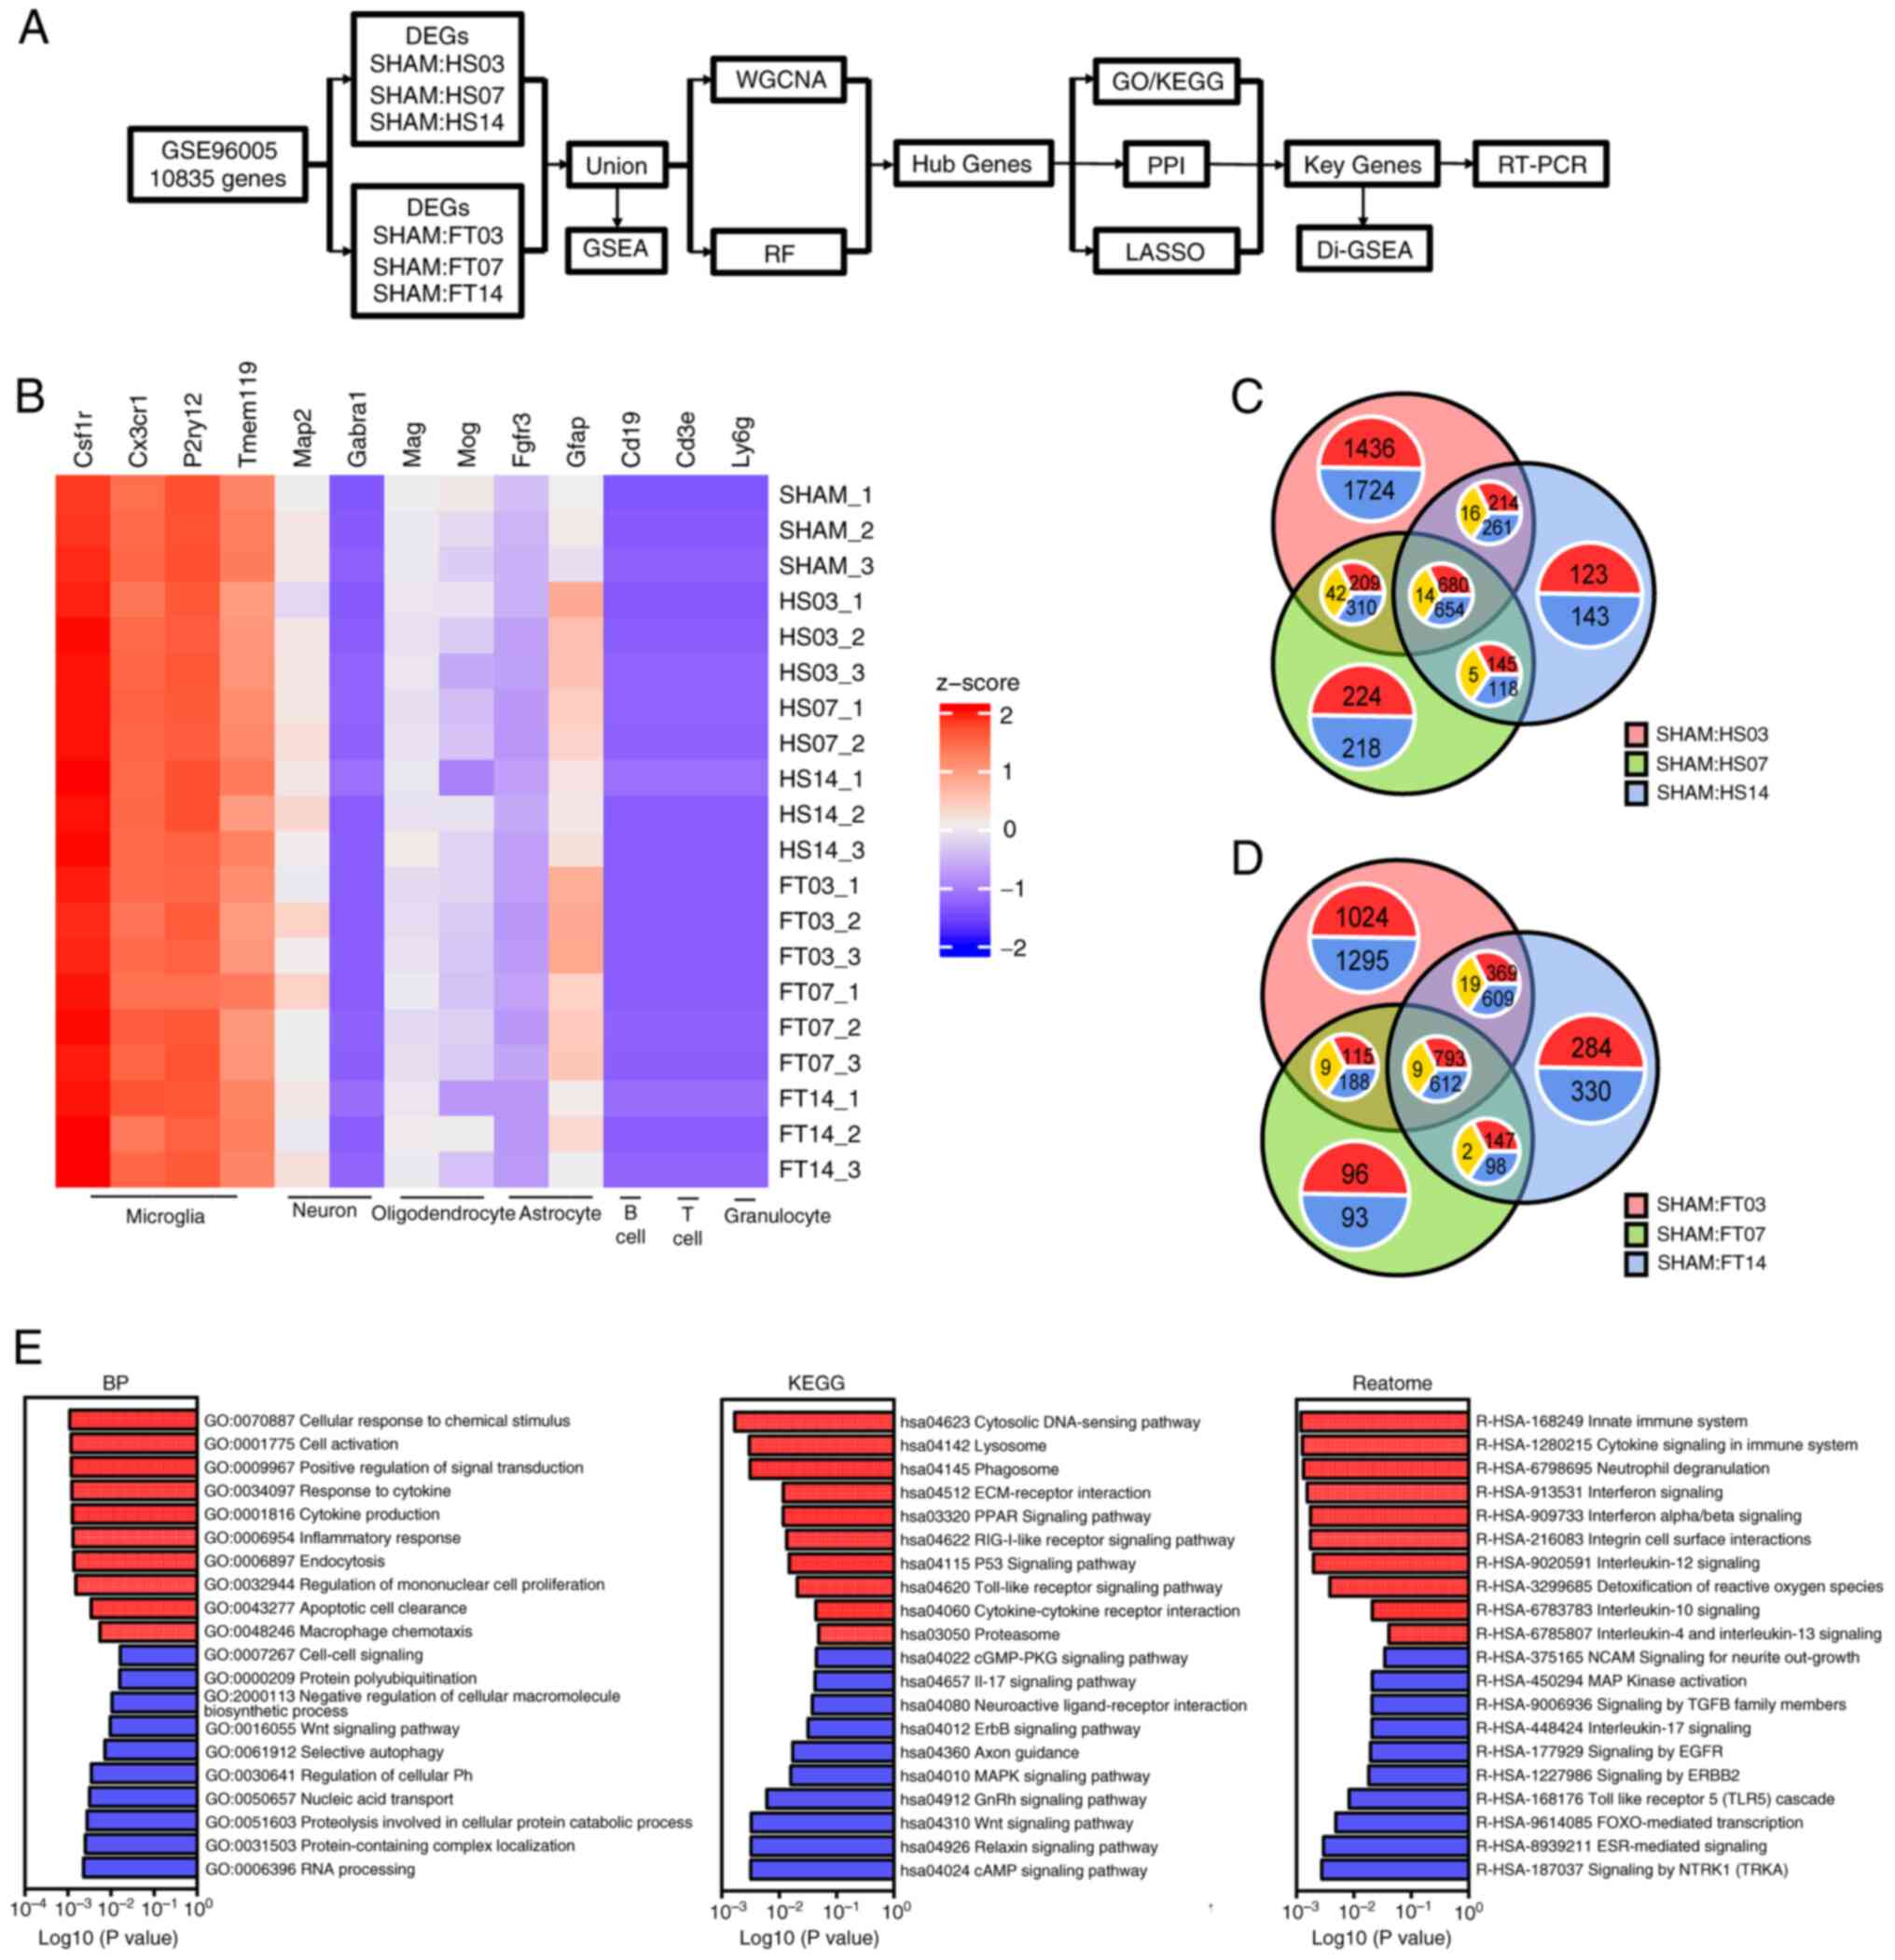 | Figure 1Identification of DEGs. (A) Research
roadmap. (B) Heat map of relative expression levels of various
cellular markers for 20 samples in the data set, with the deepest
blue representing 0. Venn diagram of DEGs between the SHAM
operation group and at 3, 7 and 14 days after SCI of the (C) HS and
the (D) FT, respectively. In each annotation circle, red
represented the number of upregulated genes, blue represented the
number of downregulated genes and yellow represented the number of
genes with the opposite trend in the intersection set. (E) BP, KEGG
and Reactome analysis in GSEA between the SHAM and the SCI group.
DEGs, differentially expressed genes; SCI, spinal cord injury; HS,
hemiparaplegia injury group; FT, complete paraplegia injury group;
BP, biological process; KEGG, Kyoto Encyclopedia of Genes and
Genomes; GSEA, Gene Set Enrichment Analysis; WGCNA, weighted
correlation network analysis; RF, random forest; PPI,
protein-protein interaction network; RT-PCR, reverse
transcription-quantitative PCR. |
Data preprocessing and identification
of differentially expressed genes (DEGs)
The expression matrix was subjected to batch effect
elimination and batch normalization using R software (v4.1.3;
https://www.r-project.org/) and
R-package SVA (v3.3; https://www.bioconductor.org/packages/release/bioc/html/sva.html)
(41). The Limma package (v3.4;
http://www.bioconductor.org/packages/release/bioc/html/limma.html)
was used to identify DEGs by comparing expression values between
the sham and SCI group (42). The
adjusted P<0.05 and |logFC|>1 were used as the selection
criteria (42).
Weighted correlation network analysis
(WGCNA) and Random forest analysis (RF)
WGCNA (v1.6.1; cran.r-project.org/web/packages/WGCNA/index.html) is a
tool (43) for constructing gene
co-expression networks and identifying gene clusters or modules,
which was used to analyze highly relevant native gene clusters or
modules for SCI. Based on the conventional gene screening method of
WGCNA (44), the following
parameters were set in the present study: A total of ≥10 cut-off
genes, cutting height=0.90, Z-score ≥5 and stability-related
stability correlation P≤0.05; the connection of nodes (genes)
between the two was used to calculate the dataset and genes with
the correlation coefficient <0.5 were excluded. The conservation
status of the WGCNA module and the traits-related characteristics
were analyzed. RF (v4.7.1; https://www.bioconductor.org/packages/release/bioc/html/randomForest.html)
is an integrated algorithm composed of decision trees and one of
the commonly used machine learning algorithms (45). It can be used for both
classification problems and regression problems (45). This algorithm was used to screen
genes with variable importance >0 for subsequent analysis.
Functional enrichment analysis and
protein-protein interaction network (PPI) analysis
Gene Set Enrichment Analysis (GSEA) (46) is a computational method that
determines whether an a priori defined set of genes shows
statistically significant, concordant differences between two
biological states and its R package is clusterProfiler (47) (v4.0.5; https://www.bioconductor.org/packages/release/bioc/html/clusterProfiler.html).
The Kyoto Encyclopedia of Genes and Genomes (KEGG), Gene Ontology
(GO) and protein-protein interaction network (PPI) analysis was
performed using the Metascape website (http://www.metascape.org/) (48). The connectivity (degree) and hub
nodes (genes) in PPI (49) were
obtained using scale-free property (48). The results of PPI were imported
into Cytoscape software (v3.9.1; http://www.cytoscape.org/) and further analyzed in
combination with the results of DEGs.
Comparison of expression of hub
genes
The heat map was generated using R-packages
Complex-Heatmap (v3.1; https://cran.r-project.org/web/packages/ComplexHeatmap/index.html)
and GGplots (v3.0; https://cran.r-project.org/web/packages/ggplots/index.html)
to compare the expression levels of hub genes (50). The least absolute shrinkage and
selection operator (LASSO) analysis (51) (v4.1.4; https://cran.r-project.org/web/packages/glmnet/index.html)
is also one of the commonly used machine learning algorithms, which
is characterized by variable selection and regularization while
fitting the generalized linear model. The degree of adjustment of
the regression complexity of LASSO is controlled by the parameter λ
(51). The larger λ is, the
stronger the penalization for the linear model with more variables
(51). The goal is to choose the λ
model corresponding to the minimum variable characteristics and
errors as much as possible because after the λ value reaches a
certain size, continuing to increase the number of
model-independent variables or reducing the λ value cannot
significantly improve the model performance. Thus, a model with
fewer variables is obtained finally. The present study calculated
LASSO-Cox coefficients using a Lasso regression model to select key
genes in microglia following SCI.
Cell culture and reverse
transcription-quantitative (RT-q) PCR
The microglia cell line BV2 was purchased from the
China Academy of Sciences Cell Bank. LPS can stimulate microglia to
switch to M1 phenotype to express pro-inflammatory cytokines
(52). The present study used LPS
to simulate the neuroinflammatory state. The relative expression
levels of the common pro-inflammatory factors IL1b, IL6 and TNF
were measured to verify whether the BV2 cells were converted to M1
type. Following resuscitation of BV2 microglia, 10% fetal bovine
serum (cat. no. 30067334; Invitrogen; Thermo Fisher Scientific,
Inc.) was added into DMEM medium (cat. no. 11320033; Invitrogen;
Thermo Fisher Scientific, Inc.) and incubated at 37˚C and 5%
CO2 for at least 8 h. The medium was changed every other
day and passaged every 2 days. The morphology of the cells was
observed under a light microscope at a magnification of x20. After
the BV2 microglia entered the logarithmic phase, the cells were
stimulated with LPS (100 ng/ml) for 6, 12 and 24 h. Total RNA was
isolated using TRIzol® reagent (Thermo Fisher
Scientific, Inc.) and reverse transcribed into cDNA according to
the manufacturer's instructions. TRIzol® (500 µl) was
added and mixed well. A total of 200 µl chloroform was added,
shaken and allowed to stand for 5 min. The mixture was centrifuged
at 4˚C, 4,000 x g for 15 min and collected the upper phase. An
equal amount of isoamyl alcohol was added, mixed evenly and allowed
to stand for 5 min. After centrifuging at 4˚C, 4,000 g for 10 min,
the supernatant was discarded. 1 ml of 75% ethanol was added with
gentle oscillation. The RNA concentration was determined after
drying. The cell density for RNA extraction is approximately
8x10⁵/ml, and RNA purity and quantification are tested
by spectrophotometry. RNA extraction, cDNA synthesis, and qPCR are
performed according to the manufacturer's protocol. RT-qPCR was
performed using SYBR green dye (Takara Biotechnology Co., Ltd.)
under the following parameters: Initial denaturation step at 95˚C
for 30 min; 40 cycles at 95˚C for 5 sec; and 60˚C for 30 sec. Each
sample was repeated three times independently and the PCR results
were statistically analyzed by the 2-ΔΔCq method
(53). The entire experimental
procedure was completed independently for each sample. The mRNA
primers are shown in Table I.
 | Table IGene primers used in the present
study. |
Table I
Gene primers used in the present
study.
| Gene | Name | Forward primer
5'- | Reverse primer
3'- |
|---|
| GAPDH |
Glyceraldehyde-3-Phosphate
Dehydrogenase |
ACAGCAACAGGGTGGTGGAC |
TTTGAGGGTGCAGCGAACTT |
| IL1b | Interleukin 1
β |
GCCAGTGAAATGATGGCTTATT |
AGGAGCACTTCATCTGTTTAGG |
| IL6 | Interleukin 6 |
CACTGGTCTTTTGGAGTTTGAG |
GGACTTTTGTACTCATCTGCAC |
| TNFα | Tumor necrosis
factor α |
AAGGACACCATGAGCACTGAAAGC |
AGGAAGGAGAAGAGGCTGAGGAAC |
| Anxa2 | Annexin A2 |
CTGGGGACTGACGAGGACT |
GTTGATCTCTTGCAGCTCCTG |
| Myo1e | Myosin IE |
AGAGCAAAGTCAACCCTCCTG |
GGTTCCAGCTGTTGAAGTGC |
| Spp1 | Secreted
phosphoprotein 1 |
AGCTGGATGAACCAAGTCTGG |
GGCTGTGAAACTTGTGGCTC |
ELISA
The expression levels of Anxa2 (cat. no. E1944r;
ElAab Biotechnology Inc.), Myo1e (cat. no. KTE61422; Abbkine
Scientific Co., Ltd.) and Spp1 (cat. no. E0899m; ElAab
Biotechnology, Inc.) in BV2 cells were determined by ELISA kits.
The sample were stored at -80˚C before measurement. The optical
density at 450 nm was calculated by subtracting the background
value and the standard curve was drawn.
Data analysis
SPSS 22.0 software (IBM Corp.) was used for all
statistical analyses. One-way ANOVA was used for comparison between
groups. All experiments were independently repeated three times.
Tukey's honestly significant difference test was conducted as
post-hoc analyses. All data are presented as the mean ± SEM.
GraphPad Prism 6 (Dotmatics) was used for plotting. P<0.05 was
considered to indicate a statistically significant difference.
Results
Identification of DEGs
Following standardized pretreatment of microarray
results from GSE96055, the present study compared the expression
levels of microglia and other cell marker genes. The analysis
revealed that the sequencing target in the dataset was microglia
following SCI (Fig. 1B). DEGs were
identified by comparing the SHAM group with the SCI group at 3, 7
and 14 days, leading to the detection of a total of 6,513 DEGs in
the hemiparaplegia injury group as moderate SCI and 1,348 DEGs in
the common intersection of the three groups (Fig. 1C). In comparison with the SHAM
group, the 3-day group exhibited 1,724 downregulated genes and
1,436 upregulated genes, while the 7-day group showed 218
downregulated genes and 224 upregulated genes and the 14-day group
displayed 143 downregulated genes and 123 upregulated genes
(Fig. 1C). In the complete
paraplegia injury group, as severe SCI, 6,076 DEGs were detected,
with 1,414 DEGs at the intersections shared by the three groups
(Fig. 1D). The SHAM group
demonstrated 1,295 downregulated genes and 1,024 upregulated genes
compared with the 3-day group, 93 downregulated genes and 96
upregulated genes compared with the 7-day group and 330
downregulated genes and 284 upregulated genes compared with the
14-day group (Fig. 1D).
Altogether, 7,340 DEGs were identified across both groups with
varying degrees of SCI. GSEA performed on these genes indicated
their close association with the progression of neuroinflammation,
highlighting enhanced recruitment of microglia, heightened
endocytosis and intensified inflammatory responses, along with
increased expression levels of various inflammatory cytokine
signaling pathways (Fig. 1E).
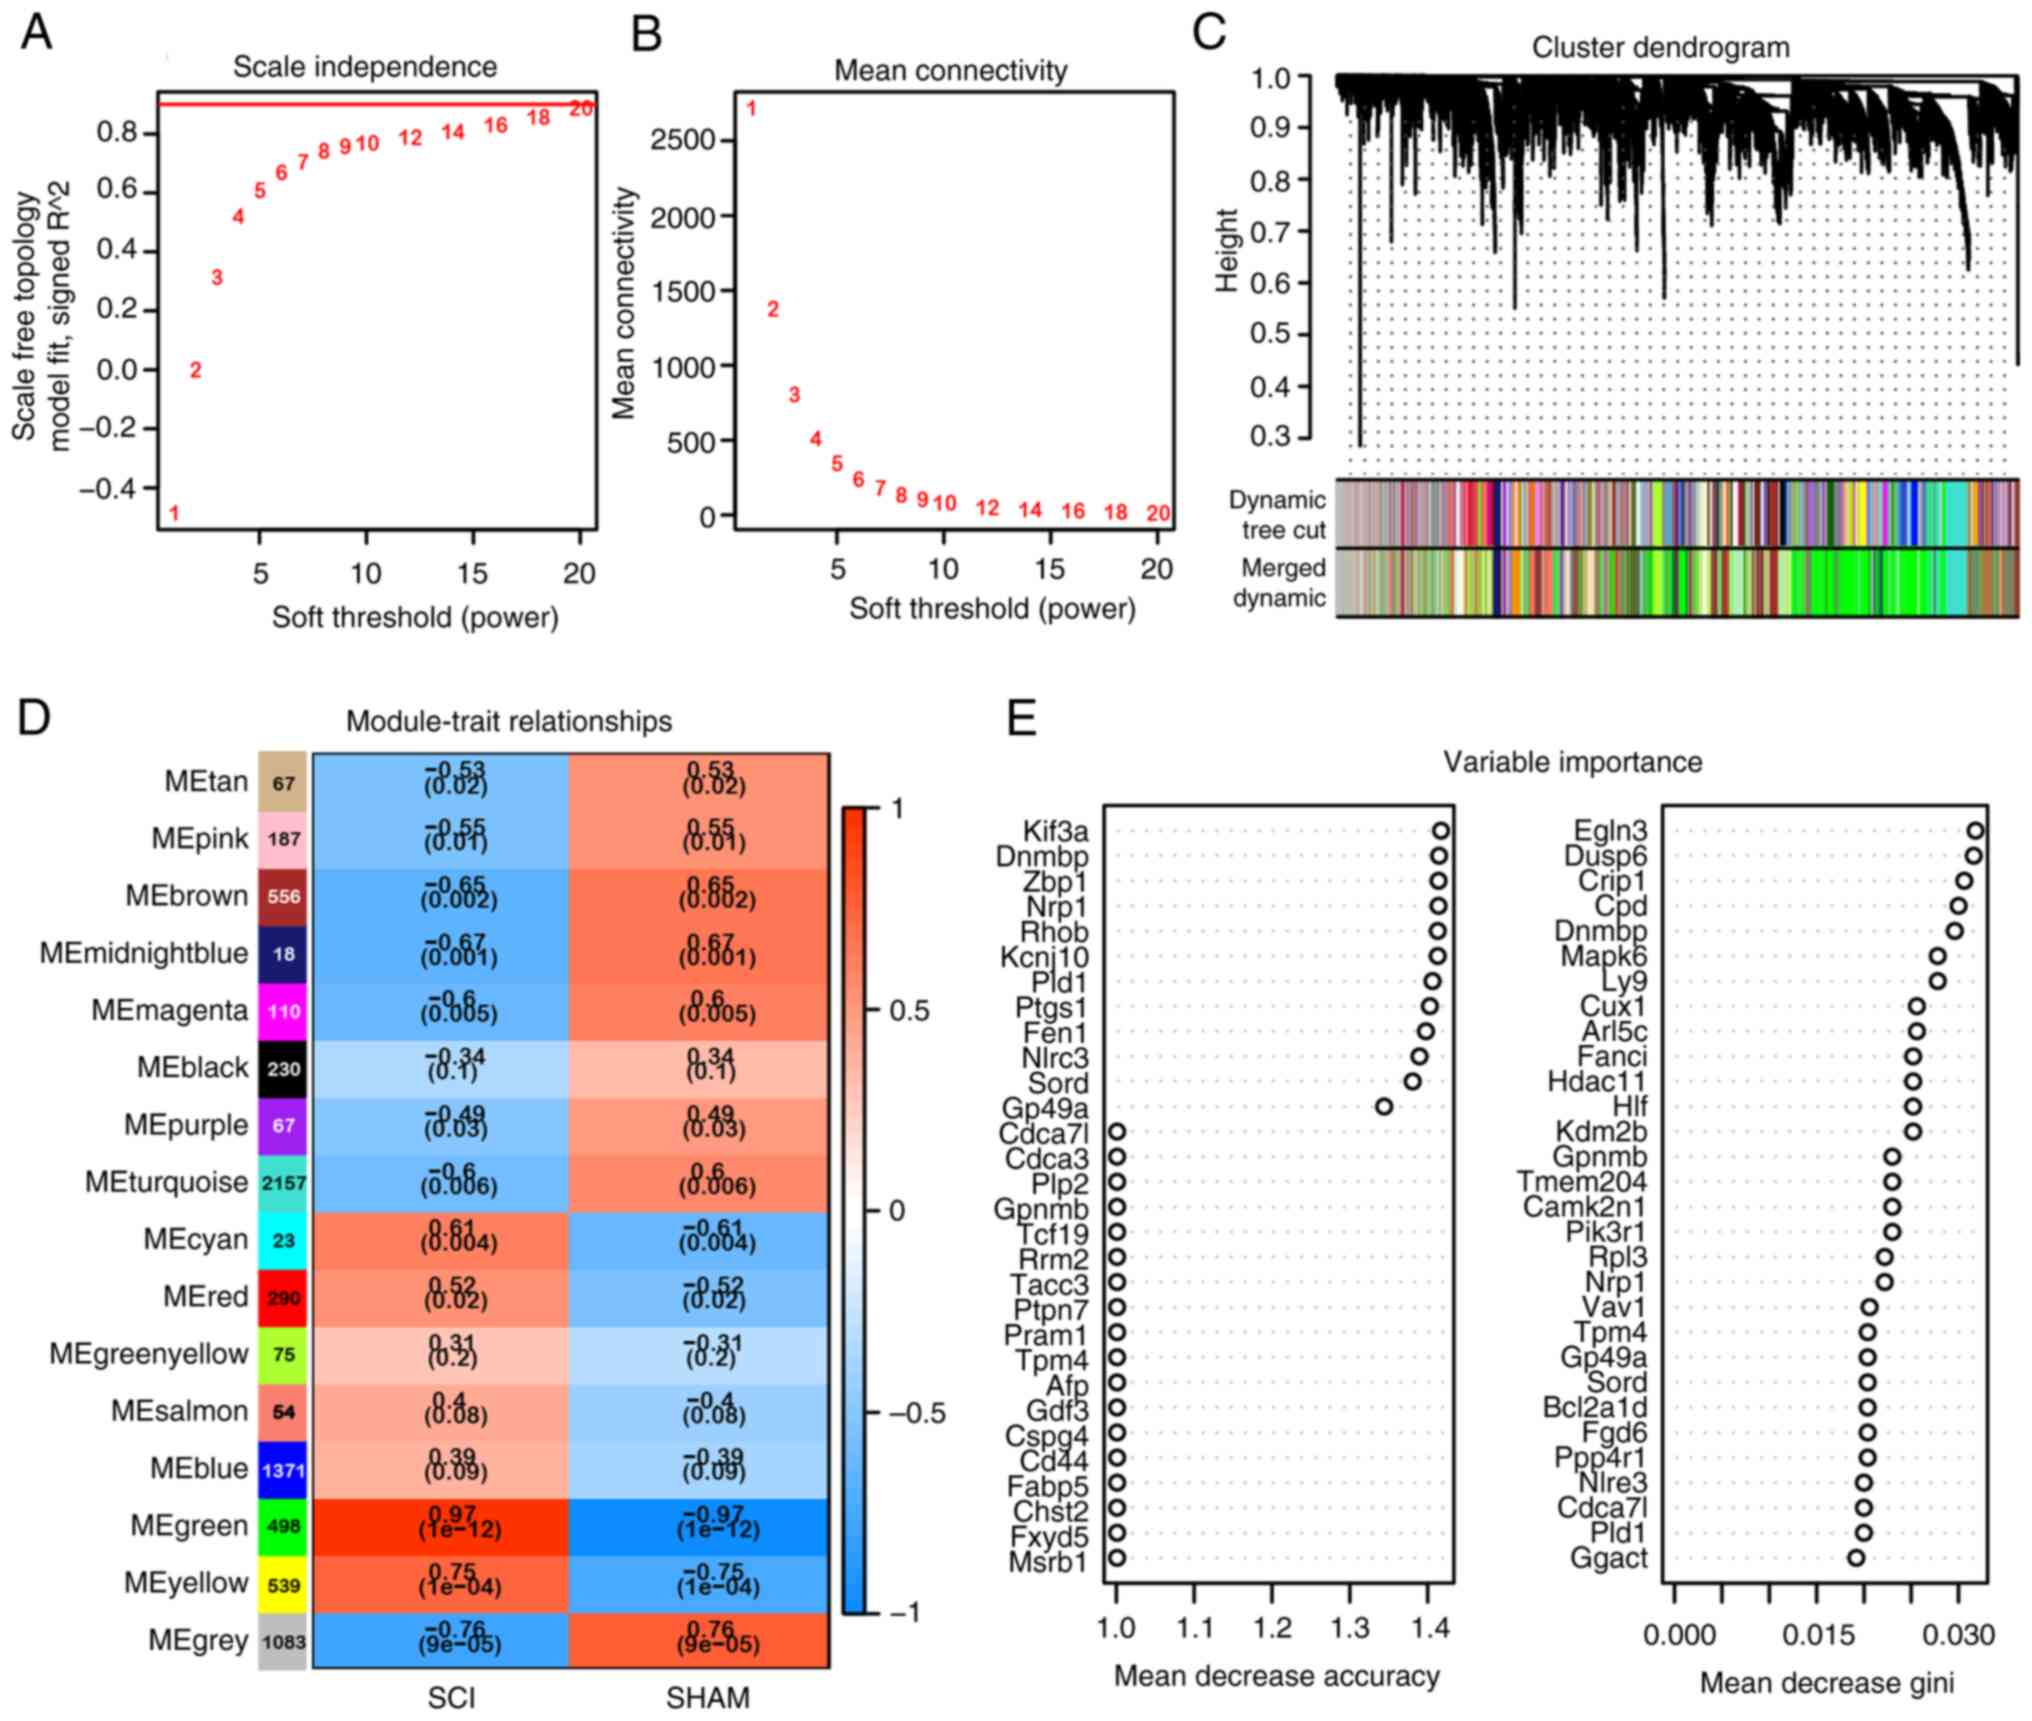
WGCNA and RF analysis of DEGs
The expression matrix of 7,340 DEGs was used for
network construction. A soft threshold power of 18 was determined
for the adjacency matrix and module recognition in WGCNA was
carried out based on a gene correlation coefficient >0.90
(Fig. 2A). The resulting gene
modules demonstrated a near scale-free topology standard (Fig. 2B). After determining the soft
threshold, the expression matrix of differential genes was further
processed to identify modules using hierarchical clustering and the
dynamic cutting algorithm (Fig.
2C). A total of 15 different co-expression modules were
identified and visualized in different colors, with the Green
module displaying the highest correlation coefficient with SCI
(ρ=0.97) and the smallest P value (P=10-12), indicating
strong association with subacute SCI (Fig. 2D). This module comprised 498 genes.
Subsequently, RF analysis was conducted on the 7,340 DEGs to select
genes highly relevant to microglia following SCI, resulting in the
identification of 458 genes (Fig.
2E).
Functional enrichment, PPI and LASSO
of hub genes
The intersection of 498 genes in the green module of
WGCNA and 458 genes in RF yielded 301 hub genes (Fig. 3A). Further analysis of the GO
functions and KEGG pathways of these hub genes suggested a close
association between post-SCI microglia and neuroinflammation,
participating in the regulation of apoptosis (Fig. 3B and Table II). PPI revealed that 205 genes
could serve as central nodes, with the expression levels of 111
genes upregulated and 94 genes downregulated post-SCI (Fig. 3C). Subsequently, through LASSO
analysis of the 205 hub nodes (Fig.
3D and E), key genes were
identified. The two dashed lines in Fig. 3E represent two specific λ values,
namely λmin and λ1se, which were 0.03236614 and 0.0763,
respectively. λ-min is the average minimum targeted parameter value
of all λ values. The λ1se value represents a model with good
performance and minimal parameters. When selecting λ1se, the
performance of the model is optimal. Ultimately, the top three key
genes in LASSO based on parameter values were identified as Anxa2,
Myo1e and Spp1.
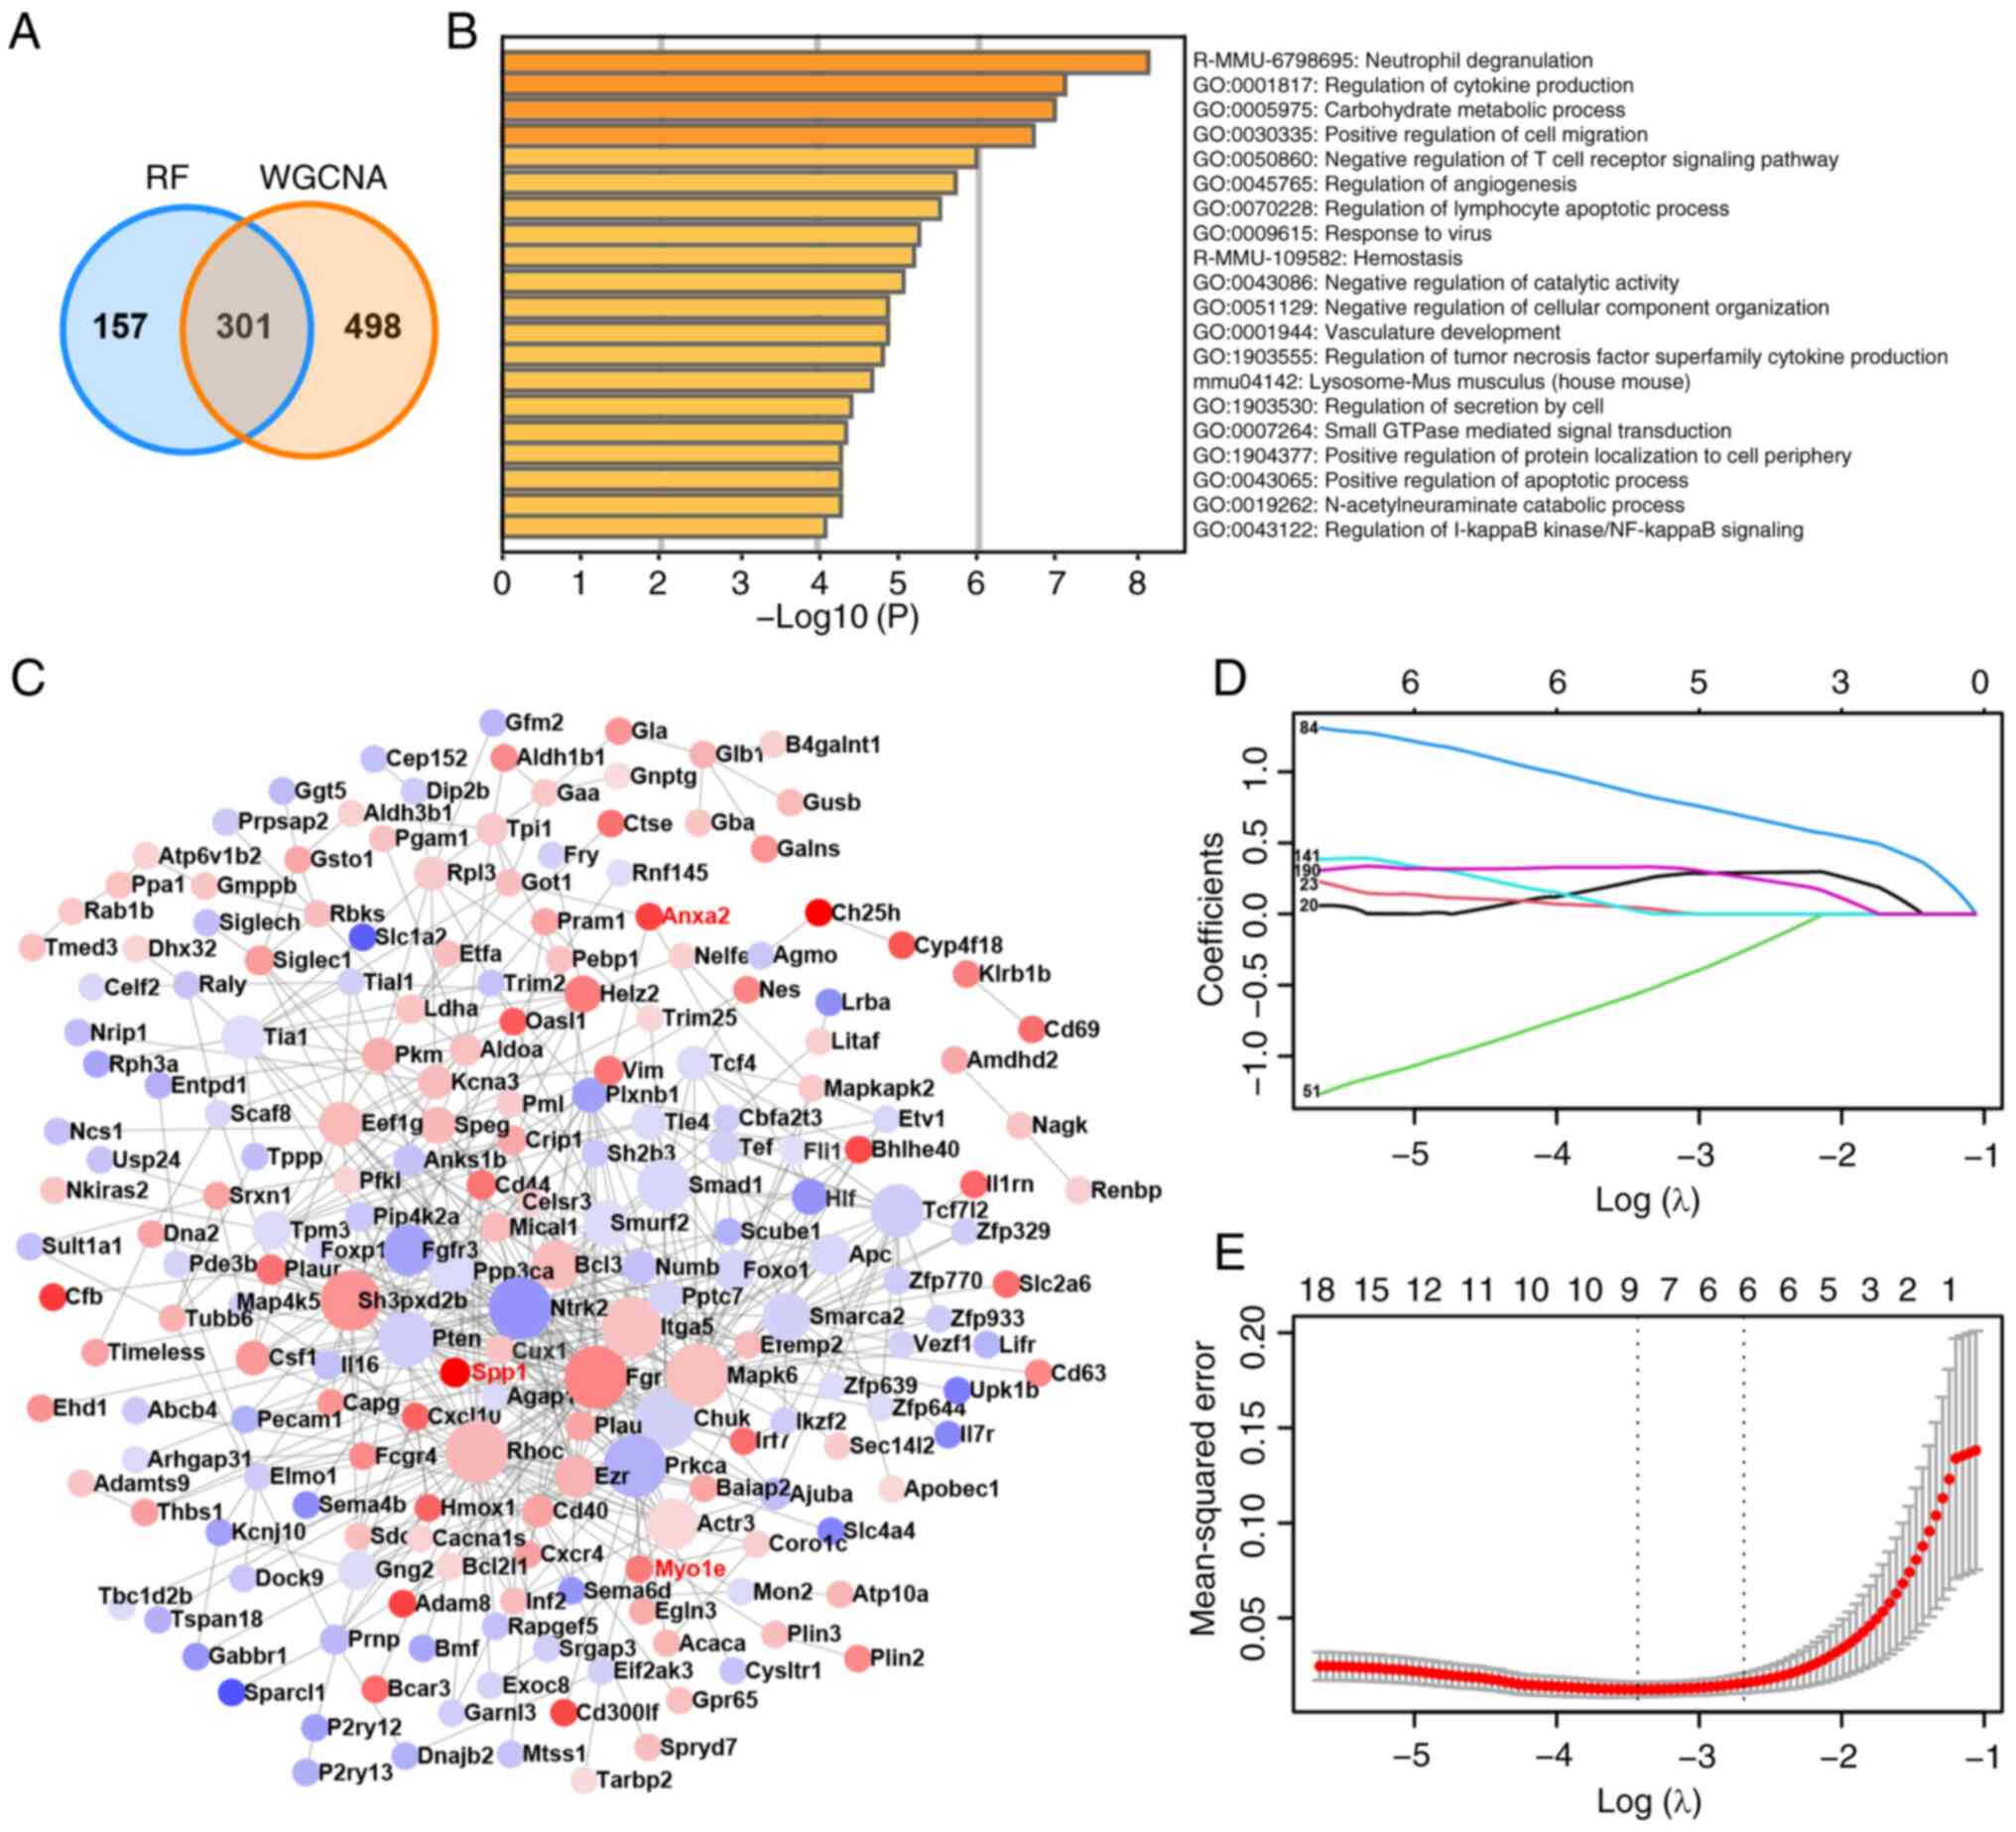 | Figure 3Functional enrichment, PPI and LASSO
analysis of hub genes. (A) Venn diagram of intersection genes
between WGCNA and RF. (B) Functional enrichment analysis for 301
hub genes. (C) PPI analysis of hub genes. Red indicates that the
gene expression level is upregulated after SCI and blue indicates
that the gene expression level is downregulated. The darker the
color, the greater the difference in expression level. (D) The
locus of change of independent variable coefficient of LASSO
analysis. Each curve in the figure represents the change trace of
coefficient of each independent variable. The ordinate is the value
of the coefficient, the lower abscissa is log(λ) and the upper
abscissa is the number of non-zero coefficients in the model at
this time. The later the coefficient is compressed to 0, the more
important the variable is as the value of λ changes. (E) Model
error diagram of LASSO analysis. On the ordinate is Mean-Squared
Error. Cross Validation of LASSO analysis allows that for each λ
value, around the mean of the target parameter shown by the red
dot, one can obtain the confidence interval of the target
parameter. There are two numerical dashed lines, the line with the
lowest error on the left (λmin) and the line with the least feature
on the right (λ1se), which are 0.03236614 and 0.0763 respectively.
λmin is the average of the minimum objective parameters that give
all λ values. The value of λ1se is a model with good performance
but the least parameters. When λ1se was chosen, the performance of
the model is the best. PPI, protein-protein interaction; LASSO,
least absolute shrinkage and selection operator; WGCNA, weighted
correlation network analysis; RF, random forest; SCI, spinal cord
injury; PPI, protein-protein interaction network; GO, Gene
Ontology. |
| Table IITop 20 results of the GO function and
KEGG pathway of 301 hub genes. |
Table II
Top 20 results of the GO function and
KEGG pathway of 301 hub genes.
| Category | GO | Description | PARENT_GO | Genes | LogP-value | Enrichment |
|---|
| Reactome gene
sets | R-MMU-6798695 | Neutrophil
degranulation | - | Adam8 Aldoa Glb1
Anxa2 Cd44 Cd63 Fgr Gaa Lilrb4b Lilrb4a Clec4d Pecam1 Pfkl Pgam1
Pkm Plau Plaur Syngr1 Galns Aldh3b1 Bst2 Glipr1 Qsox1 Olr1 Cyb5r3
Gusb Fcgr4 | -8.24468 | 3.7055244 |
| GO Biological
processes | GO:0001817 | Regulation of
cytokine production | 19_GO:0032501
multicellular organsmal process | Adam8 Bcl3 Tspo
Chuk Eif2ak3 Fgr Gba Lilrb4b Lilrb4a Hmox1 Il16 Mapkapk2 Cd244a Pml
Prnp Thbs1 Tia1 Cd40 Tnfsf9 Ezr Clec4a2 Tlr5 Irf7 Litaf Bst2 Sulf2
Foxp1 Cgas Cd300ld Oas2 Nlrc3 Akirin2 | -7.18245 | 2.9129408 |
| GO Biological
processes | GO:0005975 | Carbohydrate
metabolic process | 19_GO:0008152
metabolic process | Gla Aldoa Glb1 Gaa
Ggta1 Got1 Gsto1 Ldha Pfkl Pgam1 Pkm Pten Renbp Tcf7l2 Tpi1 Chst7
Rbks Gusb Kbtbd2 Pgghg Slc39a14 Gnptg Amdhd2 | -7.03583 | 3.6779535 |
| GO biological
processes | GO:0030335 | Positive regulation
of cell migration | 19_GO:0040011
locomotion | Adam8 Aldoa Apc
Rhoc Cxcr4 Csf1 Fgr Gcnt2 Hmox1 Cxcl10 Itga5 Lgals3 Numb Pecam1
Prkca Plau Ppp3ca Sema4b Thbs1 Cd40 Elp5 Smurf2 P2ry12 Actr3 Foxp1
Sema6d | -6.74981 | 3.2225668 |
| GO biological
processes | GO:0050860 | Negative regulation
of T cell receptor signaling pathway | 19_GO:0002376
immune system process | Lilrb4b Lilrb4a
Lgals3 Prnp Ezr Dgkz | -6.00218 | 17.193633 |
| GO Biological
processes | GO:0045765 | Regulation of
angiogenesis | 19_GO:0032502
developmental process | Cxcr4 Hmox1 Cxcl10
Itga5 Lgals3 Sh2b3 Smad1 Pde3b Pkm Prkca Pml Tcf4 Thbs1 Cd40
Cysltr1 Ecscr Adamts9 | -5.76361 | 3.9541635 |
| GO Biological
processes | GO:0070228 | Regulation of
lymphocyte apoptotic process | 19_GO:0050789
regulation of biological process | Adam8 Bcl3 Cd44
Il7r Lgals3 Pten Siglec1 Prelid1 Foxp1 | -5.53873 | 7.5854264 |
| GO Biological
processes | GO:0009615 | Response to
virus | 19_GO:0044419
biological process involved in inter-species interaction between
organisms | Apobec1 Bcl2l1 Bcl3
Chuk Cxcl10 Pml Cd40 Serinc3 Irf7 Zmynd11 Bst2 Ifi27l2a Cgas Trim25
Oasl1 Oas2 | -5.2859 | 3.833586 |
| Reactome gene
sets | R-MMU-109582 | Hemostasis | - | Aldoa Anxa2 Cd44
Cd63 Ehd1 Fgr Gng2 Itga5 Sh2b3 Cd244a Pecam1 Prkca Plau Plaur Scg3
Sdc3 Tubb6 P2ry12 Qsox1 Dgkz Olr1 | -5.2376 | 3.0765704 |
| GO biological
processes | GO:0043086 | Negative regulation
of catalytic activity | 19_GO:0065007
biological regulation | Gla Apc Cd44 Gba
Lilrb4b Lilrb4a Ajuba Sh2b3 Nes Pecam1 Pip4k2a Prkca Plaur Pml Prnp
Pten Renbp Thbs1 Coro1c Pebp1 Gabbr1 Camk2n1 P2ry13 Mical1
Slc39a14 | -5.10305 | 2.6891944 |
| GO Biological
processes | GO:0051129 | Negative regulation
of cellular component organization | 19_GO:0048519
negative regulation of biological process | Apc Apobec1 Bcl2l1
Tspo Capg Ch25h Fgfr3 Gba Cxcl10 Lgals3 Nrxn1 Pecam1 Pml Ppp3ca
Prnp Pten Sema4b Vim Coro1c Dnajb2 Prelid1 Actr3 Scaf8 Sema6d Dip2b
Nlrc3 | -4.94884 | 2.5727122 |
| GO Biological
processes | GO:0001944 | Vasculature
development | 19_GO:0032502
developmental process | Adam8 Anxa2 Cxcr4
Eif2ak3 Hmox1 Itga5 Nrxn1 Ntrk2 Pde3b Pecam1 Prkca Plau Pten Tcf7l2
Thbs1 Vezf1 Foxo1 Efemp2 Smarca2 Ecscr Myo1e Adamts9 Tmem204 | -4.9376 | 2.7692827 |
| GO Biological
processes | GO:1903555 | Regulation of tumor
necrosis factor superfamily cytokine production | 19_GO:0032501
multicellular organismal process | Adam8 Bcl3 Tspo
Lilrb4b Lilrb4a Mapkapk2 Thbs1 Clec4a2 Foxp1 Cd300ld Oas2
Nlrc3 | -4.83124 | 4.5485802 |
| KEGG Pathway | mmu04142 | Lysosome-Mus
musculus (house mouse) | - | Gla Glb1 Cd63 Ctse
Gaa Gba Galns Litaf Gusb Gnptg | -4.69035 | 5.3066769 |
| GO biological
processes | GO:1903530 | Regulation of
secretion by cell | 19_GO:0051179
localization | Bcl2l1 Tspo Anxa2
Entpd1 Fgr Ncs1 Hmox1 Il1rn Lgals3 Ntrk2 Pde3b Pfkl Prkca Ppp3ca
Rph3a Spp1 Tcf7l2 Ezr Gabbr1 Camk2n1 P2ry12 Mical1 Rhbdf2
Pram1 | -4.43565 | 2.5100194 |
| GO biological
processes | GO:0007264 | Small GTPase
ediated signal transduction | 19_GO:0023052
signaling | Rhoc Arhgap31 Chuk
Csf1 Hmox1 Pecam1 Bcar3 Nkiras2 Dgkz Dock9 Baiap2 Elmo1
Rapgef5 | -4.34358 | 3.785861 |
| GO Biological
processes | GO:1904377 | Positive regulation
of protein localization to cell periphery | 19_GO:0051179
localization | Lgals3 Nrxn1 Prnp
Ezr Actr3 Efcab7 Atp2c1 | -4.30585 | 7.2678401 |
| GO Biological
processes | GO:0043065 | Positive regulation
of apoptotic process | 19_GO:0048518
positive regulation of biological process | Adam8 Apc Bcl2l1
Tspo Cd44 Eif2ak3 Fgfr3 Hmox1 Ldha Pml Prnp Pten Siglec1 Tcf7l2
Thbs1 Tia1 Cd40 Serinc3 Foxo1 Prelid1 Ecscr Bmf | -4.32452 | 2.5965124 |
| GO biological
processes | GO:0019262 | N-acetylneuraminate
catabolic process | 19_GO:0008152
metabolic process | Renbp Nagk
Amdhd2 | -4.28246 | 35.820069 |
| GO Biological
processes | GO:0043122 | regulation of I-κB
inase/NF-κB signaling | 19_GO:0023052
signaling | Chuk Lilrb4b
Lilrb4a Ajuba Clec4d Cd40 Zmynd11 Nkiras2 Trim25 Card6 Nlrc3 | -4.09049 | 4.1258718 |
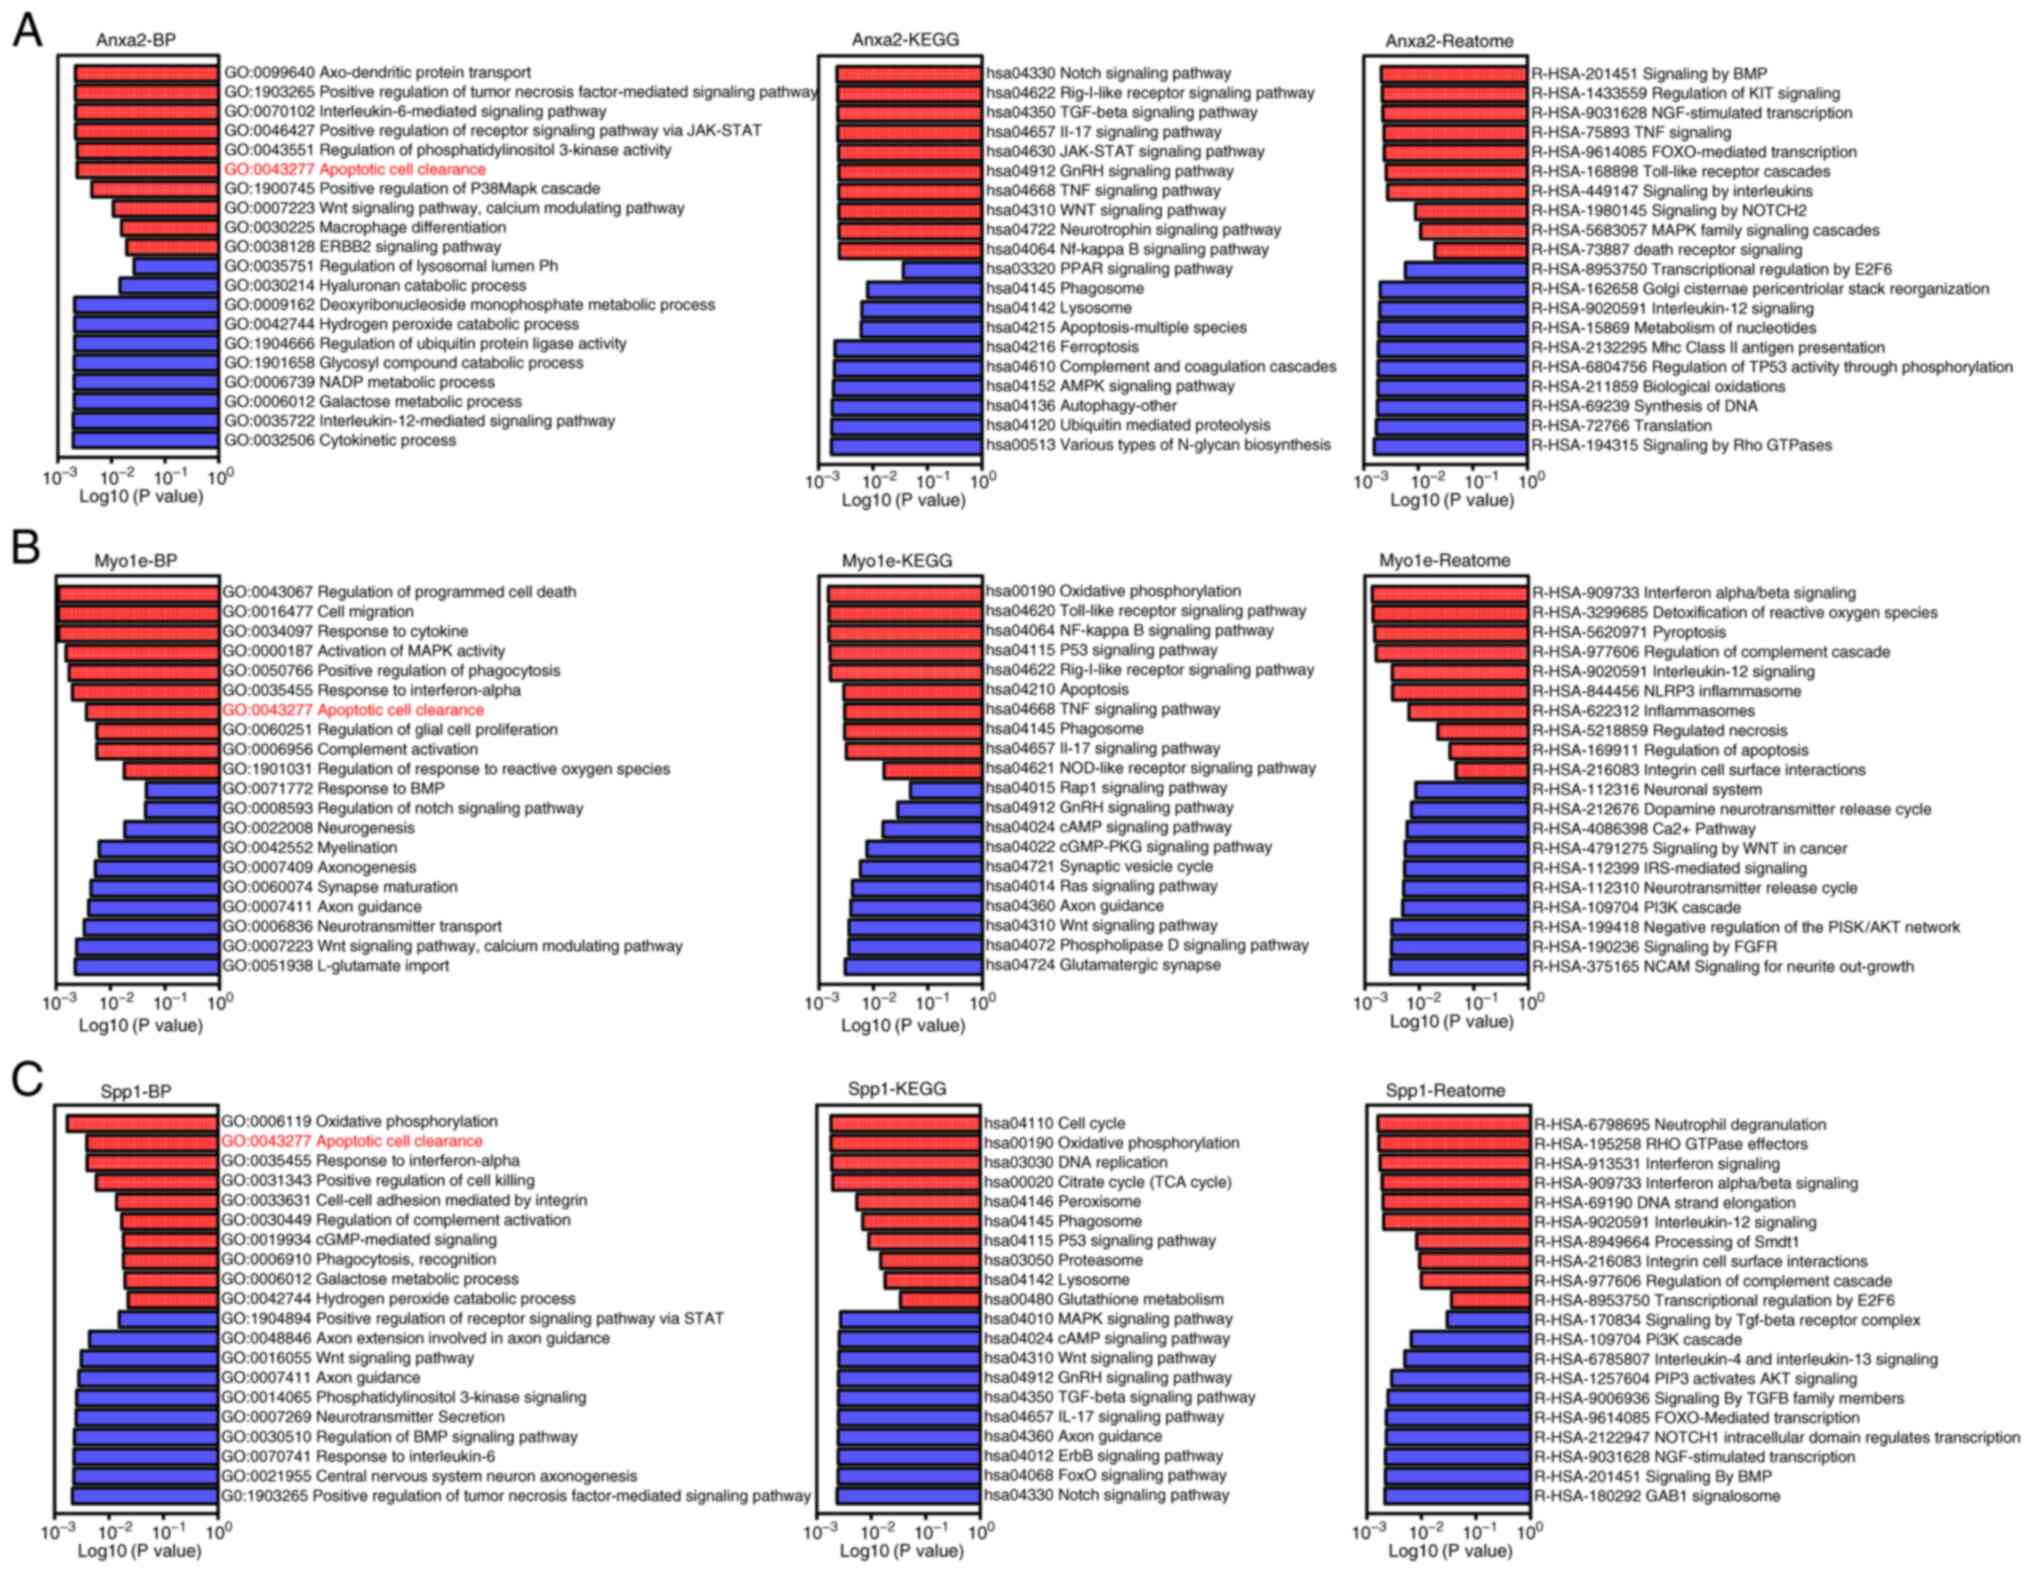
Single-gene GSEA analysis of key
genes
To further investigate the specific functional
mechanisms of these three key genes, single gene GSEA analysis was
conducted, dividing 20 samples into corresponding high and low
expression groups based on the expression levels of Anxa2, Myo1e
and Spp1. The results showed a close correlation between the
upregulation of Anxa2 in post-SCI microglia and inflammatory
factors such as IL-6, IL-17 and TNF signaling pathways (Fig. 4A). Similarly, activation of
JAK-STAT, p38MAPK cascade and Notch signaling pathways was observed
(Fig. 4A). In addition, Myo1e was
upregulated in post-SCI microglia and may participate in mechanisms
such as enhanced responsiveness to interferons, increased
expression of inflammatory signaling pathways and NF-κB activation
(Fig. 4B). Spp1 was closely
associated with enhanced phagocytic activity and complement
activation in post-SCI microglia (Fig.
4C). Notably, in the biological functional analysis of these
three genes, all three key genes were closely related to the gene
set involved in the clearance of apoptotic cells, suggesting that
these key genes may play important roles in the mechanism of
clearing apoptotic cells in post-SCI microglia (Fig. 4A-C).
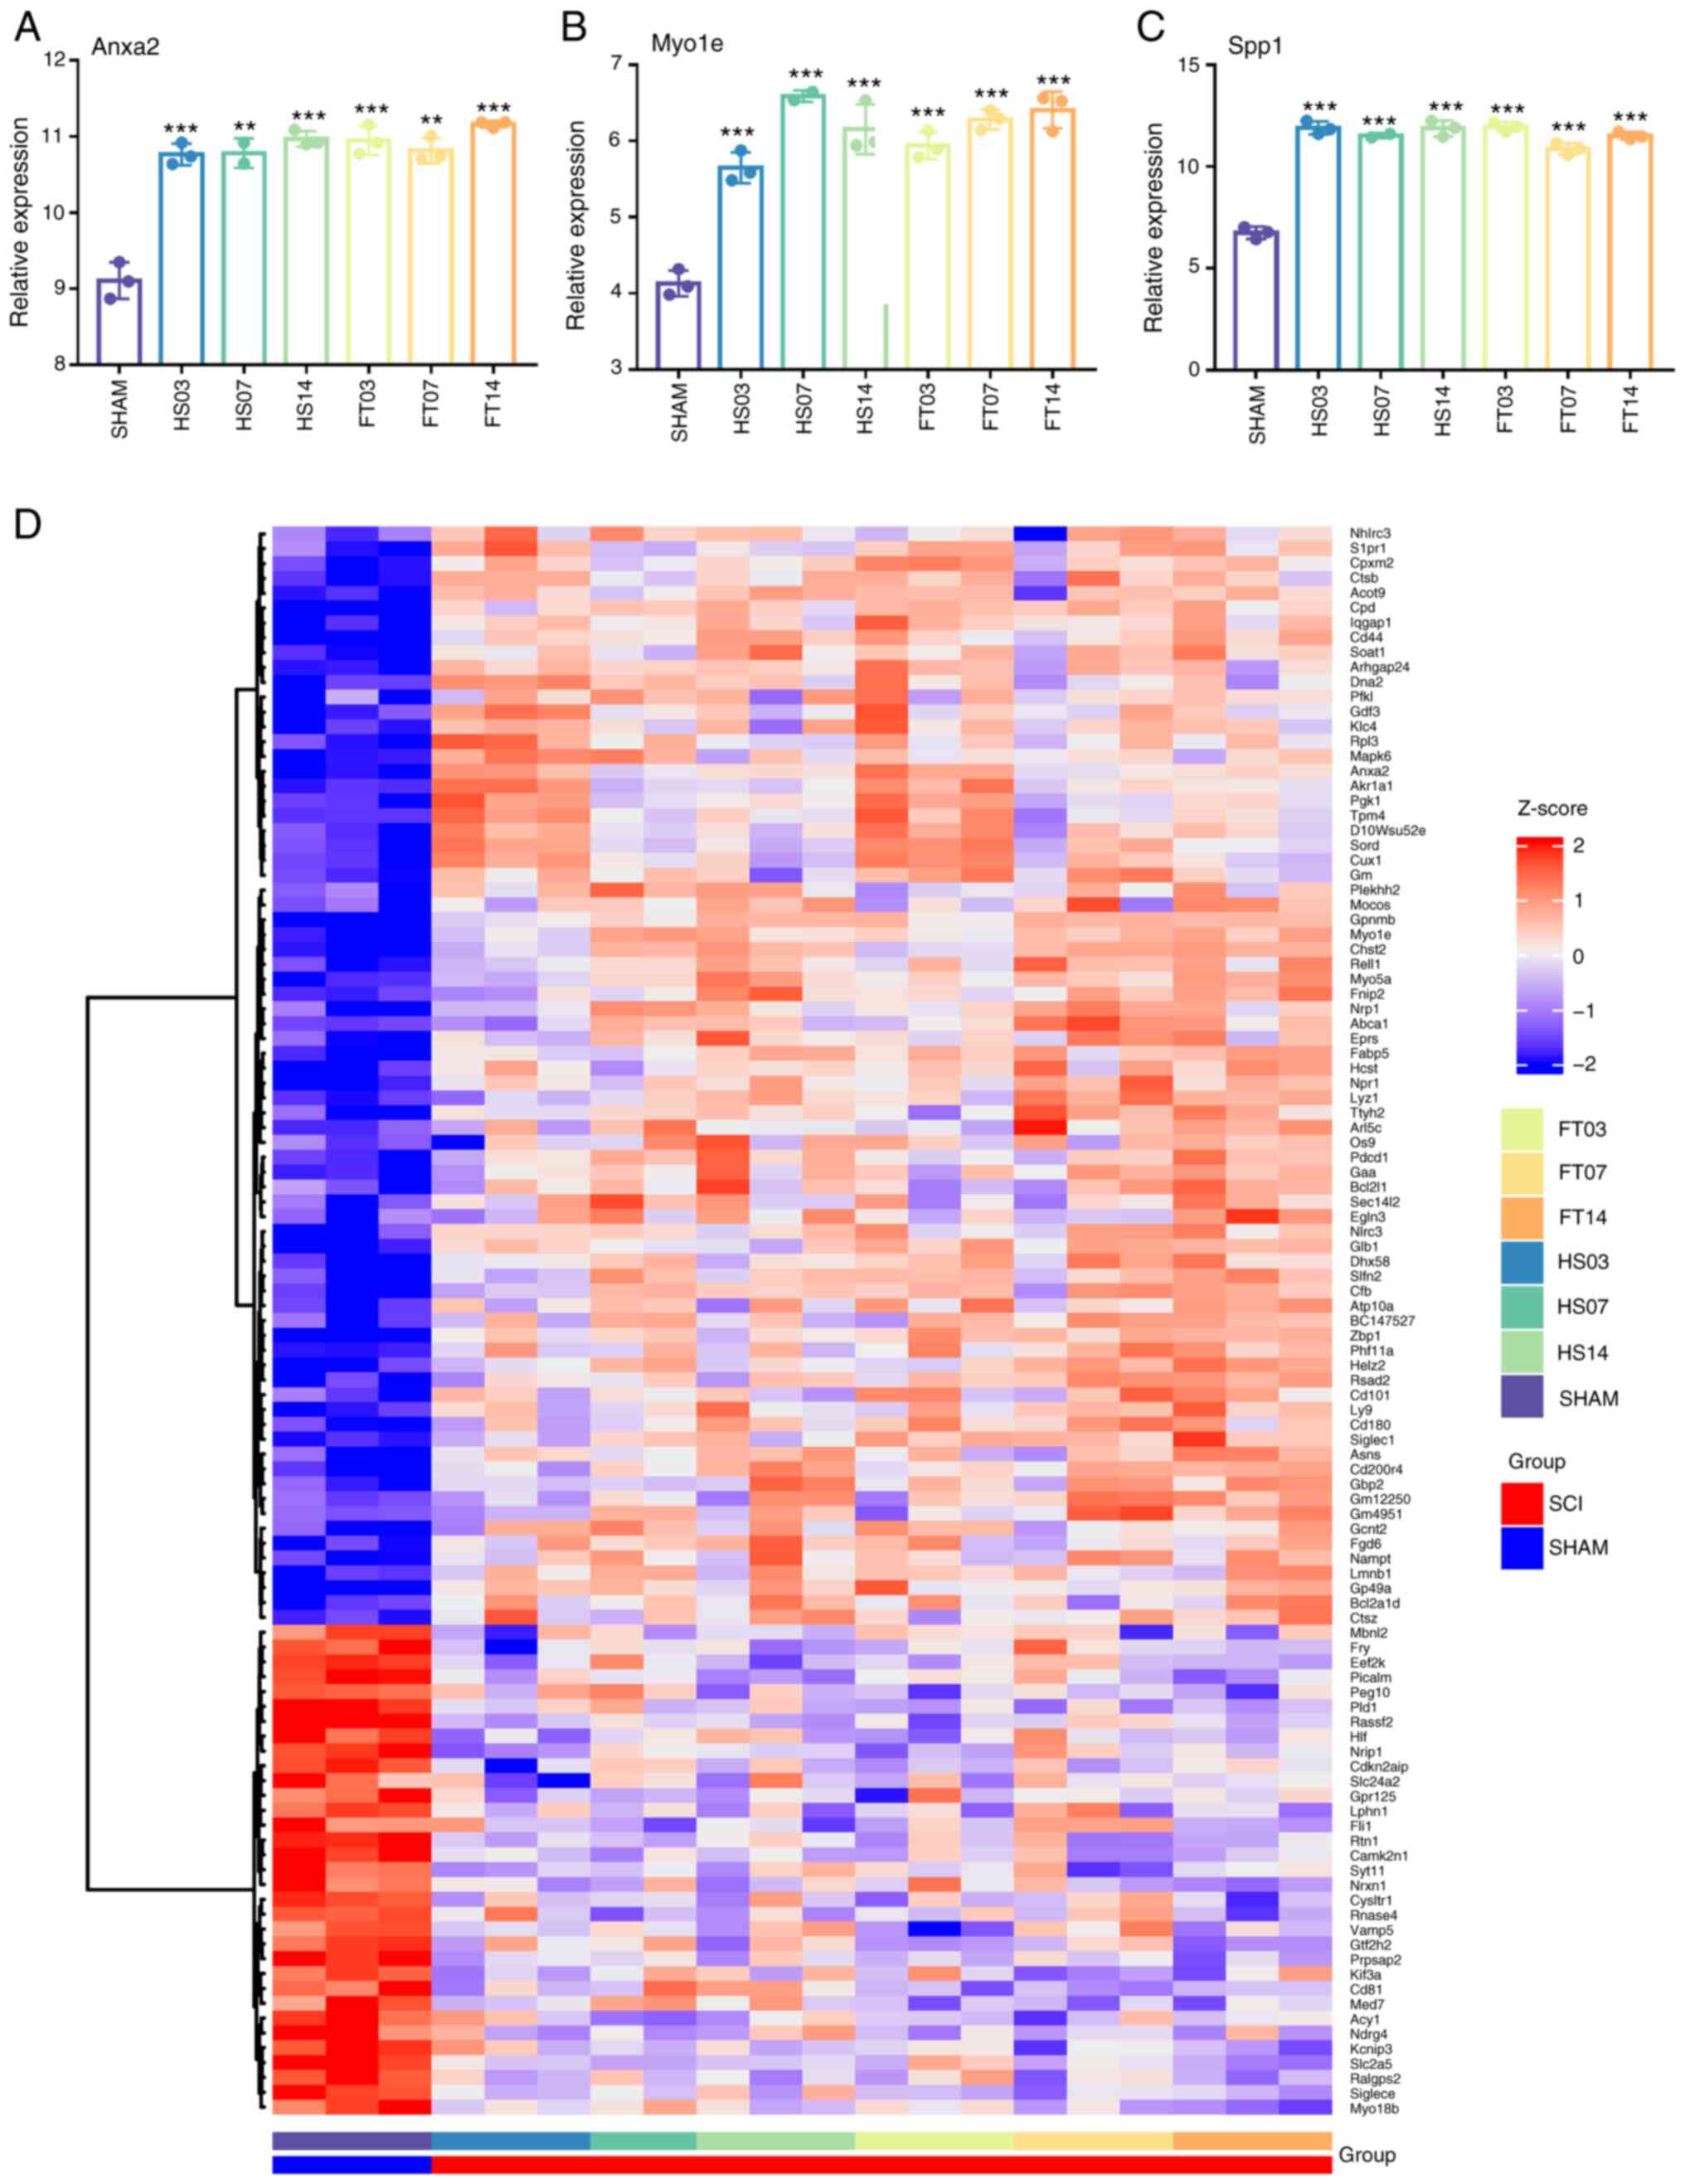
Comparison and verification of
expression of key genes
The present study analyzed the relative expression
levels of three key genes from the GSE96055 dataset to study their
expression patterns in post-SCI microglia, considering changes in
time and severity of injury (Fig.
5A-C). The expression levels of Anxa2 and Spp1 appeared to be
minimally affected by injury time and severity, while the
expression level of Myo1e slightly increased with time post-injury.
In addition, the expression levels of 203 central genes in the
dataset were examined and a heatmap generated (Fig. 5D). Heatmap analysis revealed that
genes with upregulated expression in the upper part were more
influenced by the injury time than the severity, whereas genes in
the lower part exhibited the opposite trend (Fig. 5D).
It is known that the phagocytic cell receptor MerTK
regulates phagocytic activity in BV2 cells (54). To determine whether key genes are
involved in the clearance of apoptotic cells in BV2 cells, cells
were treated with LPS (100 nM) and the MerTK-specific inhibitor
UNC569 (500 nM) and changes in gene expression monitored. Compared
with the control group, Anxa2, Myo1e and Spp1 mRNA levels were
upregulated in the LPS group, indicating increased expression in
pro-inflammatory microglial states, while they were downregulated
in the LPS + UNC569 group, suggesting that inhibition of
phagocytosis also suppressed their expression (Fig. 6A-C). Consistent with mRNA results,
protein levels of Anxa2, Myo1e and Spp1 exhibited a similar trend
(Fig. 6D-F).
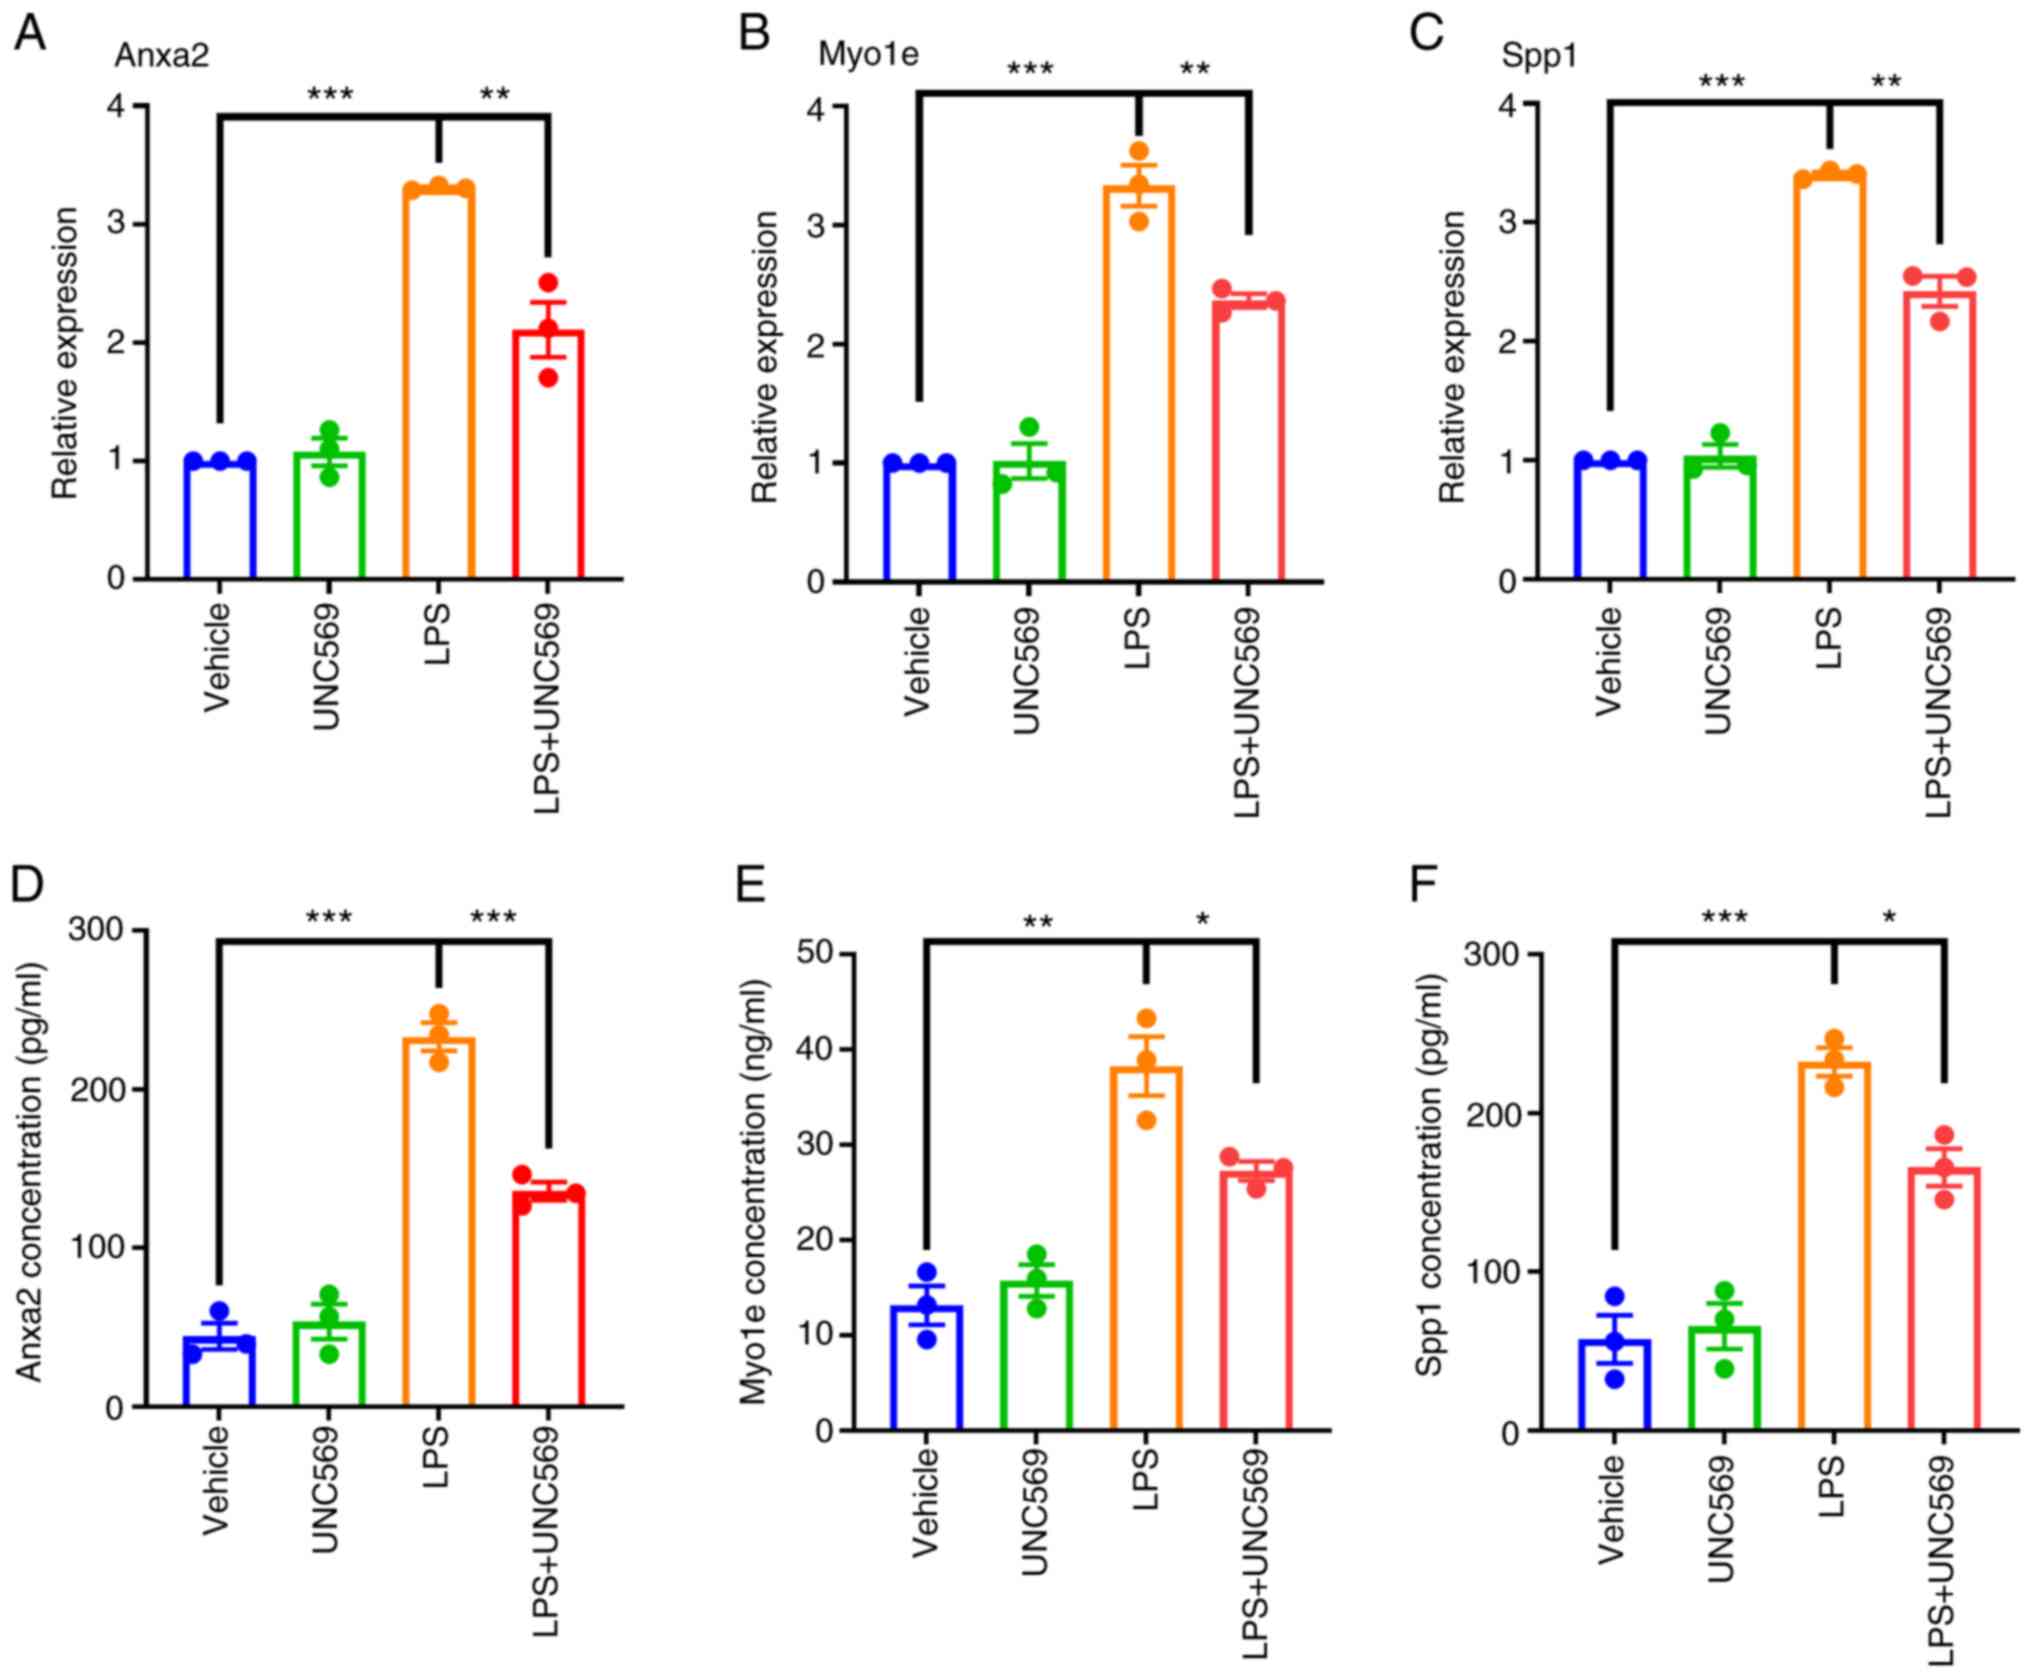 | Figure 6RT-qPCR and ELISA validation. The
mRNA expression levels of (A) Anxa2, (B) Myo1e and (C) Spp1. (The
protein expression levels of three key genes, (D) Anxa2, (E) Myo1e
and (F) Spp1. A total of three samples per group in duplicate were
summarized as the mean ± SEM with P<0.05. BV2 microglia were
stimulated with 100 ng/ml LPS for 6, 12 and 24 h, compared with the
unstimulated group, respectively. One-way ANOVA was performed.
*P<0.05, **P<0.01,
***P<0.001. RT-qPCR, reverse
transcription-quantitative PCR; SCI, spinal cord injury; SE,
standard error; LPS, lipopolysaccharide. |
Discussion
In the present study, through bioinformatics
analysis, a close correlation was discovered between microglia
after SCI and neuroinflammation and efferocytosis. It is worth
noting that the expression levels of Anxa2, Myo1e and Spp1 in
microglia following SCI were significantly upregulated. These three
genes are closely associated with various biological functions,
such as signaling pathways involved in the release of inflammatory
factors, amplification of inflammatory cascades and phagocytosis.
Notably, they are all significantly enriched in the gene set
related to the clearance of apoptotic cells.
GSEA results for the SHAM group and SCI group
revealed that microglia mainly play an immunomodulatory role and
participate in the polarization and recruitment of macrophages
derived from microglia and monocytes at the site of injury.
Additionally, they regulate the secretion of interleukins and
interferons. These results indicated that microglia primarily play
a pro-inflammatory role at the site of SCI, consistent with the
views of other researchers (12-14).
Widely used machine learning algorithms, WGCNA, RF and LASSO
analysis, have been employed in biomedical research, typically used
individually (55,56). The present study integrated these
three different algorithms for key gene screening and analysis for
the first time, to the best of the authors' knowledge. WGCNA
focuses on specific phenotypes and co-expression modules, where
genes within the same module are considered functionally related
with higher reliability and biological significance (56). RF evaluates the importance of
variables in determining categories (57,58),
while LASSO effectively selects features and addresses
multicollinearity issues (59).
Conventional bioinformatics analysis relies on
researchers manually designing rules and processes, which
introduces subjectivity and limitations, potentially hindering the
full exploration of potential patterns and information within the
data, as well as struggling to effectively handle complex data
structures and relationships. The present study effectively
identified and predicted biological characteristics, gene
expression patterns and disease-related genes of microglial cells
post-SCI using the GSE96055 dataset for machine learning
algorithms, thereby enhancing the accuracy and precision of data
analysis. It identified a characteristic gene set of microglia
after SCI and found that key genes Anxa2, Myo1e and Spp1 are
closely associated with the clearance of apoptotic cells.
The clearance of apoptotic cells is crucial for the
restoration of extracellular environment homeostasis (60). Despite extensive attention to
efferocytosis in inflammatory macrophages (61) and cancerous macrophages (62), specific research on the mechanisms
of microglia in the nervous system, particularly after SCI, is
lacking. The MerTK signaling pathway plays a vital role in the
clearance of apoptotic cells by microglia (63). In the present study, the
MerTK-specific inhibitor UNC569 was used to suppress the clearance
of apoptotic cells in microglia, widely utilized for the phagocytic
clearance function of microglia (54). Finally, the results of analysis
were validated using BV2 cells in vitro, consistent with the
findings of the bioinformatics analysis.
Anxa2, a member of the calcium-dependent
phospholipid-binding protein family, plays a role in cell growth
regulation and signal transduction pathways (64,65).
Anxa2 is involved in various cellular processes such as
proliferation, differentiation, apoptosis, migration, membrane
repair, immune suppression and inflammatory responses, closely
associated with the prognosis and severity of various diseases
(66-68).
GSEA analysis of Anxa2 suggested its involvement in regulating
relevant inflammatory factor signaling pathways, consistent with
the findings of other researchers. Previous studies have shown that
Anxa2 promotes phagocytic cell assembly, regulates the endosomal
recycling pathway and multicellular endosome biogenesis (69,70).
Anxa1 has been implicated in the efferocytosis of microglia. In
addition, GSEA analysis of Myo1e and Spp1 indicated their
participation in regulating inflammation responses and inflammatory
factor signaling pathways related to microglia. Myo1e, as an
unconventional myosin, plays various critical roles in
physiological processes such as cell adhesion, migration,
phagocytosis and cell expulsion based on its motility and
structural features (71,72). Spp1, a non-collagenous bone
protein, has been shown to modulate macrophage polarization
(73). Recent studies suggest a
crucial role for Spp1 in monitoring and regulating acute and
chronic neuroinflammation (74,75).
Notably, SPP1 induces phagocytic and synaptic engulfment of
microglia in an Alzheimer's disease mouse model (76).
These research findings are consistent with the
discoveries of the present study. In the results of single-gene
GSEA analysis, the three key genes Anxa2, Myo1e and Spp1 not only
play a negative role in regulating inflammation but also actively
participate in the clearance of apoptotic cells, which may be a
critical manifestation of the dual role of microglia after SCI.
However, there is a lack of literature on their specific roles in
clearing apoptotic cells. The present study suggested that they may
be involved in regulating efferocytosis mechanisms, serving as
important targets for treating SCI. Whether these three key genes
can be used as indicators to determine the progression of SCI
requires extensive clinical research practice.
Despite significant progress in research on the
clearance of apoptotic cells, the study of efferocytosis mechanisms
in the CNS is still in its early stages. Combining results from
studies of other diseases, the type of disease and the duration of
the disease, efferocytosis may have different effects on disease
progression (11). Studies have
indicated significant differences in the phagocytic response of
peripheral macrophages and microglia and variations in the
efficiency of neuronal apoptosis clearance. Additionally, compared
with brain injuries, the phagocytic capacity and phagocytic cell
ratio of microglia after SCI are quite heterogeneous (77-79).
There is a lack of literature on specific mechanisms, necessitating
further research. In SCI, current research suggests that white
matter and gray matter microglia have different transcriptional
profiles in disease progression and spatial axes (7,10).
However, their contributions to the clearance of apoptotic cells
remain unknown, highlighting the need for further
investigation into the efferocytosis functions of microglia with
different functional phenotypes and how to regulate microglia to
exert neuroprotective effects.
However, the present study had some limitations. The
data used for analysis came from experimental animal models, which
may have limitations in the applicability of the analysis results
to human disease models due to genomic differences between species.
Subsequent studies should establish disease models using different
animal species, compare the consistency and differences in various
models and validate the results in human tissues to enhance the
reliability and applicability of the findings. In addition, future
research should integrate proteomic, single-cell sequencing and
spatial transcriptomic data to comprehensively reflect the
functional mechanisms of microglia post-SCI, providing clues to
uncover the pathological mechanisms of SCI.
In conclusion, the present study showed that
microglia after SCI play essential roles not only in
neuroinflammation but also in the mechanism of apoptotic cell
clearance. Notably, the expression levels of Anxa2, Myo1e and Spp1
in microglia after SCI are significantly upregulated, potentially
participating in the regulation of apoptotic cell clearance
mechanisms. The present study suggested that Anxa2, Myo1e and Spp1
may be potential targets for future SCI treatments, providing a
scientific basis for the development of new therapeutic approaches
and drugs for SCI.
Acknowledgements
Not applicable.
Funding
Funding: The present study was supported by the Project of
Nantong Municipal Health Commission (grant no. MS2022016), the
Project of Nantong First People's Hospital (grant no. YPYJJZD008),
the Postgraduate Research & Practice Innovation Program of
Jiangsu Province (grant no. KYCX21_3107), Project of Jiangsu
Administration of Traditional Chinese Medicine (grant no.
MS2022090), the General Project of Nantong Basic Scientific
Research (grant no. JC22022067), The Scientific Research Innovation
Team Project of Nanjing Medical University Kangda College (grant
no. KD2022KYCXTD011) and the special key project of clinical basic
research in Nantong University (grant no. 2022JZ004).
Availability of data and materials
The data generated in the present study may be
requested from the corresponding author.
Authors' contributions
LY conceived and designed the experiments, analyzed
the data and prepared figures and/or tables. Data collections were
performed by LLW, CC, JYH, GHX, JWJ, JJC, CSW and HXH. ZMC
contributed to the study conception and design. The first draft of
the manuscript was written by LY and all authors commented on
previous versions of the manuscript. LY and ZMC confirm the
authenticity of all the raw data. All authors read and approved the
final manuscript.
Ethics approval and consent to
participate
Not applicable.
Patient consent for publication
Not applicable.
Competing interests
The authors declare that they have no competing
interests.
References
|
1
|
Anjum A, Yazid MD, Daud MF, Idris J, Ng
AMH, Naicker AS, Ismail OHR, Kumar RK and Lokanathan Y: Spinal cord
injury: Pathophysiology, multimolecular interactions, and
underlying recovery mechanisms. Int J Mol Sci.
21(7533)2020.PubMed/NCBI View Article : Google Scholar
|
|
2
|
Hu X, Xu W, Ren Y, Wang Z, He X, Huang R,
Ma B, Zhao J, Zhu R and Cheng L: Spinal cord injury: Molecular
mechanisms and therapeutic interventions. Signal Transduct Target
Ther. 8(245)2023.PubMed/NCBI View Article : Google Scholar
|
|
3
|
Calvert JS, Grahn PJ, Zhao KD and Lee KH:
Emergence of epidural electrical stimulation to facilitate
sensorimotor network functionality after spinal cord injury.
Neuromodulation. 22:244–252. 2019.PubMed/NCBI View Article : Google Scholar
|
|
4
|
Thomaz SR, Cipriano G Jr, Formiga MF,
Fachin-Martins E, Cipriano GFB, Martins WR and Cahalin LP: Effect
of electrical stimulation on muscle atrophy and spasticity in
patients with spinal cord injury-a systematic review with
meta-analysis. Spinal Cord. 57:258–266. 2019.PubMed/NCBI View Article : Google Scholar
|
|
5
|
Brockie S, Hong J and Fehlings MG: The
role of microglia in modulating neuroinflammation after spinal cord
injury. Int J Mol Sci. 22(9706)2021.PubMed/NCBI View Article : Google Scholar
|
|
6
|
Nimmerjahn A, Kirchhoff F and Helmchen F:
Resting microglial cells are highly dynamic surveillants of brain
parenchyma in vivo. Science. 308:1314–1318. 2005.PubMed/NCBI View Article : Google Scholar
|
|
7
|
van der Poel M, Ulas T, Mizee MR, Hsiao
CC, Miedema SSM, Adelia Schuurman KG, Helder B, Tas SW, Schultze
JL, et al: Transcriptional profiling of human microglia reveals
grey-white matter heterogeneity and multiple sclerosis-associated
changes. Nat Commun. 10(1139)2019.PubMed/NCBI View Article : Google Scholar
|
|
8
|
Paolicelli RC, Sierra A, Stevens B,
Tremblay ME, Aguzzi A, Ajami B, Amit I, Audinat E, Bechmann I,
Bennett M, et al: Microglia states and nomenclature: A field at its
crossroads. Neuron. 110:3458–3483. 2022.PubMed/NCBI View Article : Google Scholar
|
|
9
|
Parajuli B and Koizumi S: Strategies for
manipulating microglia to determine their role in the healthy and
diseased brain. Neurochem Res. 48:1066–1076. 2023.PubMed/NCBI View Article : Google Scholar
|
|
10
|
Freyermuth-Trujillo X, Segura-Uribe JJ,
Salgado-Ceballos H, Orozco-Barrios CE and Coyoy-Salgado A:
Inflammation: A target for treatment in spinal cord injury. Cells.
11(2692)2022.PubMed/NCBI View Article : Google Scholar
|
|
11
|
Deng J, Meng F, Zhang K, Gao J, Liu Z, Li
M, Liu X, Li J, Wang Y, Zhang L and Tang P: Emerging roles of
microglia depletion in the treatment of spinal cord injury. Cells.
11(1871)2022.PubMed/NCBI View Article : Google Scholar
|
|
12
|
Devanney NA, Stewart AN and Gensel JC:
Microglia and macrophage metabolism in CNS injury and disease: The
role of immunometabolism in neurodegeneration and neurotrauma. Exp
Neurol. 329(113310)2020.PubMed/NCBI View Article : Google Scholar
|
|
13
|
Shields DC, Haque A and Banik NL:
Neuroinflammatory responses of microglia in central nervous system
trauma. J Cereb Blood Flow Metab. 40:S25–S33. 2020.PubMed/NCBI View Article : Google Scholar
|
|
14
|
Mesquida-Veny F, Del Rio JA and Hervera A:
Macrophagic and microglial complexity after neuronal injury. Prog
Neurobiol. 200(101970)2021.PubMed/NCBI View Article : Google Scholar
|
|
15
|
Verkhratsky A, Sun D and Tanaka J:
Snapshot of microglial physiological functions. Neurochem Int.
144(104960)2021.PubMed/NCBI View Article : Google Scholar
|
|
16
|
Savill J and Fadok V: Corpse clearance
defines the meaning of cell death. Nature. 407:784–788.
2000.PubMed/NCBI View
Article : Google Scholar
|
|
17
|
Hochreiter-Hufford A and Ravichandran KS:
Clearing the dead: Apoptotic cell sensing, recognition, engulfment,
and digestion. Cold Spring Harb Perspect Biol.
5(a008748)2013.PubMed/NCBI View Article : Google Scholar
|
|
18
|
Moon B, Yang S, Moon H, Lee J and Park D:
After cell death: The molecular machinery of efferocytosis. Exp Mol
Med. 55:1644–1651. 2023.PubMed/NCBI View Article : Google Scholar
|
|
19
|
Doran AC, Yurdagul A Jr and Tabas I:
Efferocytosis in health and disease. Nat Rev Immunol. 20:254–267.
2020.PubMed/NCBI View Article : Google Scholar
|
|
20
|
Andrews SJ, Renton AE, Fulton-Howard B,
Podlesny-Drabiniok A, Marcora E and Goate AM: The complex genetic
architecture of Alzheimer's disease: Novel insights and future
directions. EBioMedicine. 90(104511)2023.PubMed/NCBI View Article : Google Scholar
|
|
21
|
Balena T, Lillis K, Rahmati N, Bahari F,
Dzhala V, Berdichevsky E and Staley K: A dynamic balance between
neuronal death and clearance after acute brain injury. bioRxiv.
14(2023.02.14.528332)2023.PubMed/NCBI View Article : Google Scholar
|
|
22
|
Mike JK and Ferriero DM: Efferocytosis
mediated modulation of injury after neonatal brain
hypoxia-ischemia. Cells. 10(1025)2021.PubMed/NCBI View Article : Google Scholar
|
|
23
|
Ortuno FM, Torres C, Glosekotter P and
Rojas I: New trends in biomedical engineering and bioinformatics
applied to biomedicine-special issue of IWBBIO 2014. Biomed Eng
Online. 14 (Suppl 2)(I1)2015.PubMed/NCBI View Article : Google Scholar
|
|
24
|
van Dijk EL, Auger H, Jaszczyszyn Y and
Thermes C: Ten years of next-generation sequencing technology.
Trends Genet. 30:418–426. 2014.PubMed/NCBI View Article : Google Scholar
|
|
25
|
Greener JG, Kandathil SM, Moffat L and
Jones DT: A guide to machine learning for biologists. Nat Rev Mol
Cell Biol. 23:40–55. 2022.PubMed/NCBI View Article : Google Scholar
|
|
26
|
Masuda T, Sankowski R, Staszewski O and
Prinz M: Microglia heterogeneity in the single-cell era. Cell Rep.
30:1271–1281. 2020.PubMed/NCBI View Article : Google Scholar
|
|
27
|
Grommes C, Lee CY, Wilkinson BL, Jiang Q,
Koenigsknecht-Talboo JL, Varnum B and Landreth GE: Regulation of
microglial phagocytosis and inflammatory gene expression by Gas6
acting on the Axl/Mer family of tyrosine kinases. J Neuroimmune
Pharmacol. 3:130–140. 2008.PubMed/NCBI View Article : Google Scholar
|
|
28
|
Ji R, Tian S, Lu HJ and Lu Q, Zheng Y,
Wang X, Ding J, Li Q and Lu Q: TAM receptors affect adult brain
neurogenesis by negative regulation of microglial cell activation.
J Immunol. 191:6165–6177. 2013.PubMed/NCBI View Article : Google Scholar
|
|
29
|
Scott RS, McMahon EJ, Pop SM, Reap EA,
Caricchio R, Cohen PL, Earp HS and Matsushima GK: Phagocytosis and
clearance of apoptotic cells is mediated by MER. Nature.
411:207–211. 2001.PubMed/NCBI View Article : Google Scholar
|
|
30
|
Healy LM, Perron G, Won SY,
Michell-Robinson MA, Rezk A, Ludwin SK, Moore CS, Hall JA, Bar-Or A
and Antel JP: MerTK is a functional regulator of myelin
phagocytosis by human myeloid cells. J Immunol. 196:3375–3384.
2016.PubMed/NCBI View Article : Google Scholar
|
|
31
|
Fourgeaud L, Traves PG, Tufail Y,
Leal-Bailey H, Lew ED, Burrola PG, Callaway P, Zagórska A, Rothlin
CV, Nimmerjahn A and Lemke G: TAM receptors regulate multiple
features of microglial physiology. Nature. 532:240–244.
2016.PubMed/NCBI View Article : Google Scholar
|
|
32
|
Christoph S, Deryckere D, Schlegel J,
Frazer JK, Batchelor LA, Trakhimets AY, Sather S, Hunter DM,
Cummings CT, Liu J, et al: UNC569, a novel small-molecule mer
inhibitor with efficacy against acute lymphoblastic leukemia in
vitro and in vivo. Mol Cancer Ther. 12:2367–2377. 2013.PubMed/NCBI View Article : Google Scholar
|
|
33
|
Kalyan M, Tousif AH, Sonali S, Vichitra C,
Sunanda T, Praveenraj SS, Ray B, Gorantla VR, Rungratanawanich W,
Mahalakshmi AM, et al: Role of endogenous lipopolysaccharides in
neurological disorders. Cells. 11(4038)2022.PubMed/NCBI View Article : Google Scholar
|
|
34
|
Brown GC, Camacho M and Williams-Gray CH:
The endotoxin hypothesis of Parkinson's disease. Mov Disord.
38:1143–1155. 2023.PubMed/NCBI View Article : Google Scholar
|
|
35
|
Atta AA, Ibrahim WW, Mohamed AF and
Abdelkader NF: Microglia polarization in nociplastic pain:
Mechanisms and perspectives. Inflammopharmacology. 31:1053–1067.
2023.PubMed/NCBI View Article : Google Scholar
|
|
36
|
Zhou X, Zhao R, Lv M, Xu X, Liu W, Li X,
Gao Y, Zhao Z, Zhang Z, Li Y, et al: ACSL4 promotes
microglia-mediated neuroinflammation by regulating lipid metabolism
and VGLL4 expression. Brain Behav Immun. 109:331–343.
2023.PubMed/NCBI View Article : Google Scholar
|
|
37
|
Wang M, Yang Y, Guo Y, Tan R, Sheng Y,
Chui H, Chen P, Luo H, Ying Z, Li L, et al: Xiaoxuming decoction
cutting formula reduces LPS-stimulated inflammation in BV-2 cells
by regulating miR-9-5p in microglia exosomes. Front Pharmacol.
14(1183612)2023.PubMed/NCBI View Article : Google Scholar
|
|
38
|
Wu J, Han Y, Xu H, Sun H, Wang R, Ren H
and Wang G: Deficient chaperone-mediated autophagy facilitates
LPS-induced microglial activation via regulation of the
p300/NF-κB/NLRP3 pathway. Sci Adv. 9(eadi8343)2023.PubMed/NCBI View Article : Google Scholar
|
|
39
|
He Y, Wang Y, Yu H, Tian Y, Chen X, Chen
C, Ren Y, Chen Z, Ren Y, Gong X, et al: Protective effect of Nr4a2
(Nurr1) against LPS-induced depressive-like behaviors via
regulating activity of microglia and CamkII neurons in anterior
cingulate cortex. Pharmacol Res. 191(106717)2023.PubMed/NCBI View Article : Google Scholar
|
|
40
|
Noristani HN, Gerber YN, Sabourin JC, Le
Corre M, Lonjon N, Mestre-Frances N, Hirbec HE and Perrin FE:
RNA-Seq analysis of microglia reveals time-dependent activation of
specific genetic programs following spinal cord injury. Front Mol
Neurosci. 10(90)2017.PubMed/NCBI View Article : Google Scholar
|
|
41
|
Leek JT, Johnson WE, Parker HS, Jaffe AE
and Storey JD: The sva package for removing batch effects and other
unwanted variation in high-throughput experiments. Bioinformatics.
28:882–883. 2012.PubMed/NCBI View Article : Google Scholar
|
|
42
|
Ritchie ME, Phipson B, Wu D, Hu Y, Law CW,
Shi W and Smyth GK: limma powers differential expression analyses
for RNA-sequencing and microarray studies. Nucleic Acids Res.
43(e47)2015.PubMed/NCBI View Article : Google Scholar
|
|
43
|
Langfelder P and Horvath S: WGCNA: An R
package for weighted correlation network analysis. BMC
Bioinformatics. 9(559)2008.PubMed/NCBI View Article : Google Scholar
|
|
44
|
Horvath S and Dong J: Geometric
interpretation of gene coexpression network analysis. PLoS Comput
Biol. 4(e1000117)2008.PubMed/NCBI View Article : Google Scholar
|
|
45
|
Wang H and Zhou L: Random survival forest
with space extensions for censored data. Artif Intell Med.
79:52–61. 2017.PubMed/NCBI View Article : Google Scholar
|
|
46
|
Han H, Lee S and Lee I: NGSEA:
Network-based gene set enrichment analysis for interpreting gene
expression phenotypes with functional gene sets. Mol Cells.
42:579–588. 2019.PubMed/NCBI View Article : Google Scholar
|
|
47
|
Wu T, Hu E, Xu S, Chen M, Guo P, Dai Z,
Feng T, Zhou L, Tang W, Zhan L, et al: clusterProfiler 4.0: A
universal enrichment tool for interpreting omics data. Innovation
(Camb). 2(100141)2021.PubMed/NCBI View Article : Google Scholar
|
|
48
|
Zhou Y, Zhou B, Pache L, Chang M,
Khodabakhshi AH, Tanaseichuk O, Benner C and Chanda SK: Metascape
provides a biologist-oriented resource for the analysis of
systems-level datasets. Nat Commun. 10(1523)2019.PubMed/NCBI View Article : Google Scholar
|
|
49
|
Jeong H, Mason SP, Barabasi AL and Oltvai
ZN: Lethality and centrality in protein networks. Nature.
411:41–42. 2001.PubMed/NCBI View Article : Google Scholar
|
|
50
|
Ito K and Murphy D: Application of ggplot2
to pharmacometric graphics. CPT Pharmacometrics Syst Pharmacol.
2(e79)2013.PubMed/NCBI View Article : Google Scholar
|
|
51
|
Tibshirani R, Bien J, Friedman J, Hastie
T, Simon N, Taylor J and Tibshirani RJ: Strong rules for discarding
predictors in lasso-type problems. J R Stat Soc Series B Stat
Methodol. 74:245–266. 2012.PubMed/NCBI View Article : Google Scholar
|
|
52
|
Orihuela R, McPherson CA and Harry GJ:
Microglial M1/M2 polarization and metabolic states. Br J Pharmacol.
173:649–665. 2016.PubMed/NCBI View Article : Google Scholar
|
|
53
|
Livak KJ and Schmittgen TD: Analysis of
relative gene expression data using real-time quantitative PCR and
the 2(-Delta Delta C(T)) method. Methods. 25:402–408.
2001.PubMed/NCBI View Article : Google Scholar
|
|
54
|
Nomura K, Vilalta A, Allendorf DH, Hornik
TC and Brown GC: Activated microglia desialylate and phagocytose
cells via neuraminidase, galectin-3, and mer tyrosine kinase. J
Immunol. 198:4792–4801. 2017.PubMed/NCBI View Article : Google Scholar
|
|
55
|
Barberis E, Khoso S, Sica A, Falasca M,
Gennari A, Dondero F, Afantitis A and Manfredi M: Precision
medicine approaches with metabolomics and artificial intelligence.
Int J Mol Sci. 23(11269)2022.PubMed/NCBI View Article : Google Scholar
|
|
56
|
Sanchez-Baizan N, Ribas L and Piferrer F:
Improved biomarker discovery through a plot twist in transcriptomic
data analysis. BMC Biol. 20(208)2022.PubMed/NCBI View Article : Google Scholar
|
|
57
|
Liu T, Wang Y, Wang Y, Cheung SK, Or PM,
Wong CW, Guan J, Li Z, Yang W, Tu Y, et al: The mitotic regulator
RCC2 promotes glucose metabolism through BACH1-dependent
transcriptional upregulation of hexokinase II in glioma. Cancer
Lett. 549(215914)2022.PubMed/NCBI View Article : Google Scholar
|
|
58
|
Yan L, Fu J, Dong X, Chen B, Hong H and
Cui Z: Identification of hub genes in the subacute spinal cord
injury in rats. BMC Neurosci. 23(51)2022.PubMed/NCBI View Article : Google Scholar
|
|
59
|
Alhamzawi R and Ali HTM: The Bayesian
adaptive lasso regression. Math Biosci. 303:75–82. 2018.PubMed/NCBI View Article : Google Scholar
|
|
60
|
Zhao J, Zhang W, Wu T, Wang H, Mao J, Liu
J, Zhou Z, Lin X, Yan H and Wang Q: Efferocytosis in the central
nervous system. Front Cell Dev Biol. 9(773344)2021.PubMed/NCBI View Article : Google Scholar
|
|
61
|
Poon IKH and Ravichandran KS: Targeting
efferocytosis in inflammaging. Annu Rev Pharmacol Toxicol.
23:339–357. 2023.PubMed/NCBI View Article : Google Scholar
|
|
62
|
Nagata S: Apoptosis and clearance of
apoptotic cells. Annu Rev Immunol. 36:489–517. 2018.PubMed/NCBI View Article : Google Scholar
|
|
63
|
Zhou L and Matsushima GK: Tyro3, Axl,
Mertk receptor-mediated efferocytosis and immune regulation in the
tumor environment. Int Rev Cell Mol Biol. 361:165–210.
2021.PubMed/NCBI View Article : Google Scholar
|
|
64
|
Wang CY and Lin CF: Annexin A2: Its
molecular regulation and cellular expression in cancer development.
Dis Markers. 2014(308976)2014.PubMed/NCBI View Article : Google Scholar
|
|
65
|
Christensen MV, Hogdall CK, Jochumsen KM
and Hogdall EVS: Annexin A2 and cancer: A systematic review. Int J
Oncol. 52:5–18. 2018.PubMed/NCBI View Article : Google Scholar
|
|
66
|
Mickleburgh I, Burtle B, Hollas H,
Campbell G, Chrzanowska-Lightowlers Z, Vedeler A and Hesketh J:
Annexin A2 binds to the localization signal in the 3' untranslated
region of c-myc mRNA. FEBS J. 272:413–421. 2005.PubMed/NCBI View Article : Google Scholar
|
|
67
|
Grewal T, Wason SJ, Enrich C and Rentero
C: Annexins-insights from knockout mice. Biol Chem. 397:1031–1053.
2016.PubMed/NCBI View Article : Google Scholar
|
|
68
|
Wang T, Wang Z, Niu R and Wang L: Crucial
role of Anxa2 in cancer progression: Highlights on its novel
regulatory mechanism. Cancer Biol Med. 16:671–687. 2019.PubMed/NCBI View Article : Google Scholar
|
|
69
|
Mayran N, Parton RG and Gruenberg J:
Annexin II regulates multivesicular endosome biogenesis in the
degradation pathway of animal cells. EMBO J. 22:3242–3253.
2003.PubMed/NCBI View Article : Google Scholar
|
|
70
|
Zobiack N, Rescher U, Ludwig C, Zeuschner
D and Gerke V: The annexin 2/S100A10 complex controls the
distribution of transferrin receptor-containing recycling
endosomes. Mol Biol Cell. 14:4896–4908. 2003.PubMed/NCBI View Article : Google Scholar
|
|
71
|
Navines-Ferrer A and Martin M: Long-tailed
unconventional class I myosins in health and disease. Int J Mol
Sci. 21(2555)2020.PubMed/NCBI View Article : Google Scholar
|
|
72
|
Giron-Perez DA, Vadillo E, Schnoor M and
Santos-Argumedo L: Myo1e modulates the recruitment of activated B
cells to inguinal lymph nodes. J Cell Sci.
133(jcs235275)2020.PubMed/NCBI View Article : Google Scholar
|
|
73
|
Zhang Y, Du W, Chen Z and Xiang C:
Upregulation of PD-L1 by SPP1 mediates macrophage polarization and
facilitates immune escape in lung adenocarcinoma. Exp Cell Res.
359:449–457. 2017.PubMed/NCBI View Article : Google Scholar
|
|
74
|
Yim A, Smith C and Brown AM:
Osteopontin/secreted phosphoprotein-1 harnesses glial-, immune-,
and neuronal cell ligand-receptor interactions to sense and
regulate acute and chronic neuroinflammation. Immunol Rev.
311:224–233. 2022.PubMed/NCBI View Article : Google Scholar
|
|
75
|
Rosmus DD, Lange C, Ludwig F, Ajami B and
Wieghofer P: The role of osteopontin in microglia biology: Current
concepts and future perspectives. Biomedicines.
10(840)2022.PubMed/NCBI View Article : Google Scholar
|
|
76
|
De Schepper S, Ge JZ, Crowley G, Ferreira
LSS, Garceau D, Toomey CE, Sokolova D, Rueda-Carrasco J, Shin SH,
Kim JS, et al: Perivascular cells induce microglial phagocytic
states and synaptic engulfment via SPP1 in mouse models of
Alzheimer's disease. Nat Neurosci. 26:406–415. 2023.PubMed/NCBI View Article : Google Scholar
|
|
77
|
Andoh M and Koyama R: Comparative review
of microglia and monocytes in CNS phagocytosis. Cells.
10(2555)2021.PubMed/NCBI View Article : Google Scholar
|
|
78
|
Fang YP, Qin ZH, Zhang Y and Ning B:
Implications of microglial heterogeneity in spinal cord injury
progression and therapy. Exp Neurol. 359(114239)2023.PubMed/NCBI View Article : Google Scholar
|
|
79
|
Kroner A and Almanza JA: Role of microglia
in spinal cord injury. Neurosci Lett. 709(134370)2019.PubMed/NCBI View Article : Google Scholar
|