Introduction
The spinal cord is an important part of the central
nervous system that connects the brain and peripheral nerves.
Spinal cord injury (SCI) is caused directly or indirectly by
various factors, including sports injuries, traffic accidents,
tumors, infections and toxins. The number of annual new cases of
SCI has reached 500,000 worldwide (1). SCI is usually divided into two stages
according to the chronological order of damage: Primary and
secondary. Primary injury occurs unexpectedly and refers to the
initial traumatic injury. Secondary injury occurs as a consequence
of the changes induced by a primary injury, such as inflammation,
fibrotic scar formation and oxidative stress (2-4).
In cross-sections, the peripheral region of the
spinal cord contains neuronal white matter tracts. The gray matter,
which is mainly composed of neuron bodies, is internal to the white
matter. The gray matter is butterfly-shaped, with the four ‘wings’
called horns. The two ventral horns contain motor neurons while the
two dorsal horns contain sensory neurons (5,6).
Previous studies on SCI have only discussed metabolite changes in
the spinal cord as a whole (7,8). As
the spinal cord is composed of the aforementioned different
physiological structures, we hypothesized that metabolite changes
may differ in these structures after injury.
Metabolites are small molecules produced by
metabolic reactions catalyzed by various enzymes, such as aldolase
and phosphofructokinase in glucose metabolism. They are fundamental
components of organisms and cells, providing energy and
transmitting signals (9) In
previous years, various metabolites that change after SCI have been
detected (10). For example,
catecholamines and norepinephrine accumulate in the spinal cord,
causing vasospasm and accelerating inflammatory storms. The release
of aspartate and glutamate following SCI has been observed to
induce neurotoxicity, while retinoic acid has a neuroprotective
effect (7,8). However, the aforementioned studies
have not provided information about the chemical and metabolic
processes involved in the different anatomical structures of the
spinal cord.
Spatial metabolomics is a rapidly emerging field
fueled by the development of mass spectrometry imaging and
hyperspectral imaging data analysis. The technique can characterize
biological phenomena in situ and detect changes in
metabolites, lipids and drugs in tissue sections (11). The present study employed spatial
metabolomics to explore SCI-induced metabolite changes in different
regions, including the white and gray matter, and the ventral and
dorsal horns. This analysis offers precise characterization of the
metabolite profiles across various anatomical regions of the spinal
cord following SCI.
Materials and methods
Animal model preparation
The animal experiments in the current study were
approved by the Chongqing Medical University Ethics Committee on
Animal Research (Chongqing, China; approval no. 2022-0115).
Following the Resource Equation Approach formula, the sample size
for each group was set at 6(12).
A total of 12 adult female Sprague-Dawley rats (6-7 weeks old,
weighing 180-220 g) were obtained from the Experimental Animal
Center of Chongqing Medical University, China. The rats were housed
under standard conditions at room temperature with a 12-h
light/dark cycle and had free access to food and water. Anesthesia
was induced with 3% isoflurane and maintained at a concentration of
2%. Approximately 1 cm of the T10 spinal cord was exposed in both
groups. In the sham group (n=6), the spinal cord was left
untreated. In the SCI group (n=6), ophthalmic scissors were used to
transect the spinal cord, and ~2 mm of tissue from the center of
the exposed area was removed. A needle was passed back and forth
through the gap several times to ensure complete severance of the
nerve before the wound was sutured. The animals underwent daily
bladder expression for urination until euthanasia. The Basso,
Beattie and Bresnahan (BBB) locomotor rating scale was used on the
third postoperative day to confirm the complete loss of hind limb
function (Fig. S1A) (13). The health and welfare of the rats
were regularly monitored. Humane endpoints included weight loss
>20%, persistent refusal to eat or drink for >24 h and signs
of respiratory distress, such as labored breathing, wheezing or
cyanosis. However, none of the rats died or reached the defined
humane endpoints. After 7 days, the animals were euthanized by
cervical dislocation following anesthesia with 2% pentobarbital
sodium (200 mg/kg), administered via intraperitoneal injection.
Death was verified by the cessation of circulatory and respiratory
functions, along with the loss of reflexes. The spinal cord was
removed, and the rostral spinal cord was quickly stored at -80˚C
until further use.
Mass spectrometry imaging (MSI)
The primary injury stage, occurring 0-14 days after
SCI, is also considered the acute phase (2-4).
Therefore, in the present study, the seventh day post-injury was
selected to detect metabolite changes induced by traumatic injury.
The tissue samples were sectioned (15 µm) at -20˚C by a Leica
CM1950 cryostat. After fixation in 4% paraformaldehyde at room
temperature for 30 sec, one section was subjected to H&E
staining. Hematoxylin staining was performed at room temperature
for 5 min, followed by eosin counterstaining for 1 min. The stained
section was then examined using a bright-field microscope (Leica,
Inc.). The MSI data were acquired via an air flow-assisted
ionization-MSI platform [Victor (Beijing) Technology Co., Ltd.] and
a Q Exactive Orbitrap mass spectrometer (Thermo Fisher Scientific,
Inc.). Mass spectrometry data acquisition was performed in
progressive scanning mode. The experimental platform parameters
were set as follows: Capillary temperature at 350˚C, scan range
from 70 to 1,000 Da, spray gas pressure at 0.6 MPa, spray angle at
60˚, extraction gas flow at 45 l/min, X-axis scan speed of 0.16
mm/sec, Y-axis step spacing of 0.04 mm, and a delay time of 7 sec.
The scanning length for both the X-axis and Y-axis was 10 mm. Data
acquisition was performed via Xcalibur 4.2 software (Thermo Fisher
Scientific, Inc.), which recorded the spatial location and
intensity of all the detected ions. Both positive and negative ion
modes were used for MSI analysis. For the positive ion scanning
mode, the spray solvent composition was acetonitrile:water=80:20
(v/v), containing 0.1% formic acid. For the negative ion scanning
mode, the solvent composition was acetonitrile:water=80:20 (v/v)
without formic acid. The flow rate of the spray solvent was 5
µl/min.
MSI data analysis
The raw mass spectrometry data were further
processed through data filtering, compression, dimensionality
reduction, feature extraction and image reconstruction using an R
package (Cardinal MSI; version 3.0) (14). To visualize the results of
clustering the overall expression levels, cluster analysis was
performed using spatially shrunken centroid clustering (k-means) to
identify different regions within the tissue. The Pearson
correlation coefficient was used to measure the degree of linear
correlation between two clusters. The correlations were computed
based on the ion intensities detected within each cluster, and the
Bonferroni correction was applied to control the family-wise error
rate across all Pearson correlation analyses. The orthogonal
partial least squares-discriminant analysis (OPLS-DA) approach and
permutation test was used to discriminate between the two groups
(SIMCA 14.1 Umetrics). Next, a comparative analysis was conducted
to identify the differentially expressed mass-to-charge (m/z)
signals between different regions of interest in the tissue
sections. In addition, the variable importance in projection (VIP)
values and fold changes (FCs) were calculated, and a Student's
t-test was conducted to compare the significance of m/z signals
between groups. The VIP values, P-values and FCs were visualized
using volcano plots, which facilitated the identification of
differential m/z signals. The signals with VIP values >1 and
P-values <0.05 were considered to exhibit significant and
reliable changes. An in-house SmetDB database (Shanghai Luming
Biotechnology Co., Ltd.) was used to annotate the m/z signal data
and identify the altered metabolites. Functional enrichment of
differential metabolites was performed using the Kyoto Encyclopedia
of Genes and Genomes database (https://www.kegg.jp/). The hypergeometric test was
used to identify significantly enriched terms (P<0.05), and the
results are displayed using bubble charts.
Quantitative analysis of
metabolites
Spinal cord samples were homogenized in 4.5 ml
CHCl3/MeOH (2:1, v/v) and centrifuged at 10,000 x g for
5 min at 4˚C to remove debris. The supernatant was then mixed with
1.25 ml distilled H2O to induce phase separation. The
lower (chloroform) organic phase was collected, and the upper phase
was mixed with 2 ml CHCl3/MeOH/H2O (86:14:1,
v/v/v) to perform a second extraction. The organic phases from both
extractions were combined and subsequently dried in a vacuum
centrifuge at 200 x g and 15˚C for 60 min. The resulting residue
was then dissolved in 200 µl CHCl3/MeOH/H2O
(60:30:4.5, v/v/v). The following ELISA kits were used to detect
metabolite contents according to the manufacturers' protocols:
Phosphatidylserine (PS; cat. no. EKU08732; Biomatik),
phosphatidylethanolamine (PE; cat. no. MAK361; MilliporeSigma),
cholesterol (CE; cat. no. CS0005; MilliporeSigma), ceramide (Cer;
cat. no. A326471; Antibodies) and phosphatidic acid (PA; cat. no.
MET-5019; Cell Biolab). The concentration of each metabolite in the
samples was calculated using a standard curve. The data were
normalized to the mean value of the sham group.
Statistical analysis
GraphPad 9.5 software (Dotmatics) was used for
statistical analysis. The data are presented as the mean ± standard
deviation. Unpaired Student's t-test was used for comparisons
between two groups, while the BBB score was analyzed using the
non-parametric Mann-Whitney U test. P<0.05 was considered to
indicate a statistically significant difference.
Results
Different anatomical structures of
spinal cord exhibit various metabolite profiles after SCI
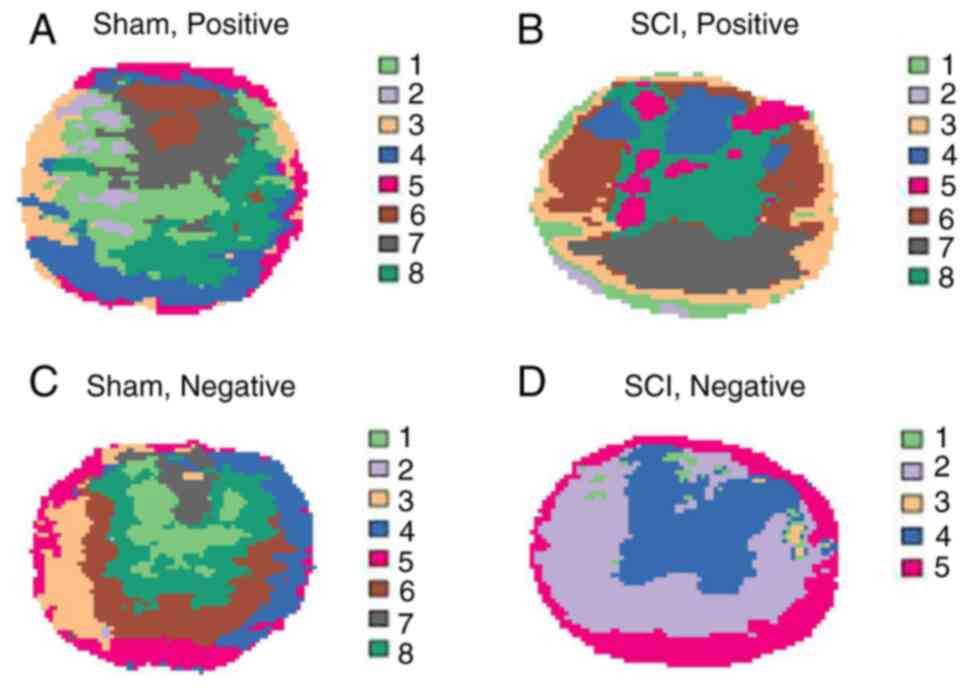
Contiguous spinal cord sections with intact
morphology (without any breaks or crushing) were selected for MSI
analysis in both positive and negative modes (Fig. S1B). The data were then subjected
to unsupervised clustering analysis, specifically, spatially
shrunken centroid clustering analysis, as shown in Fig. 1. These clusters largely
corresponded to the different structures of the spinal cord in the
two-dimensional plane. This indicated that the metabolites in
different regions of the spinal cord may exhibit certain
specificity, especially after SCI. For example, in the negative
mode, cluster 4 was highly matched with the gray matter, whereas
clusters 2 and 5 were predominantly located in the white
matter.
Correlation analysis of these clusters revealed
strong positive correlations between clusters located in the same
morphological structure (Fig.
S1C). For instance, in the SCI group under the positive mode,
clusters 6 and 7, located in the white matter, exhibited strong
positive correlations, similar to clusters 5 and 8 in the gray
matter. Conversely, the clusters located in different structures
displayed strong negative correlations, such as clusters 3 and 8 in
the SCI group under the positive mode. Therefore, it is necessary
to separately analyze the metabolic changes in different structures
of the spinal cord to obtain more detailed and accurate
results.
Differential changes in gray and white
matter metabolites after SCI
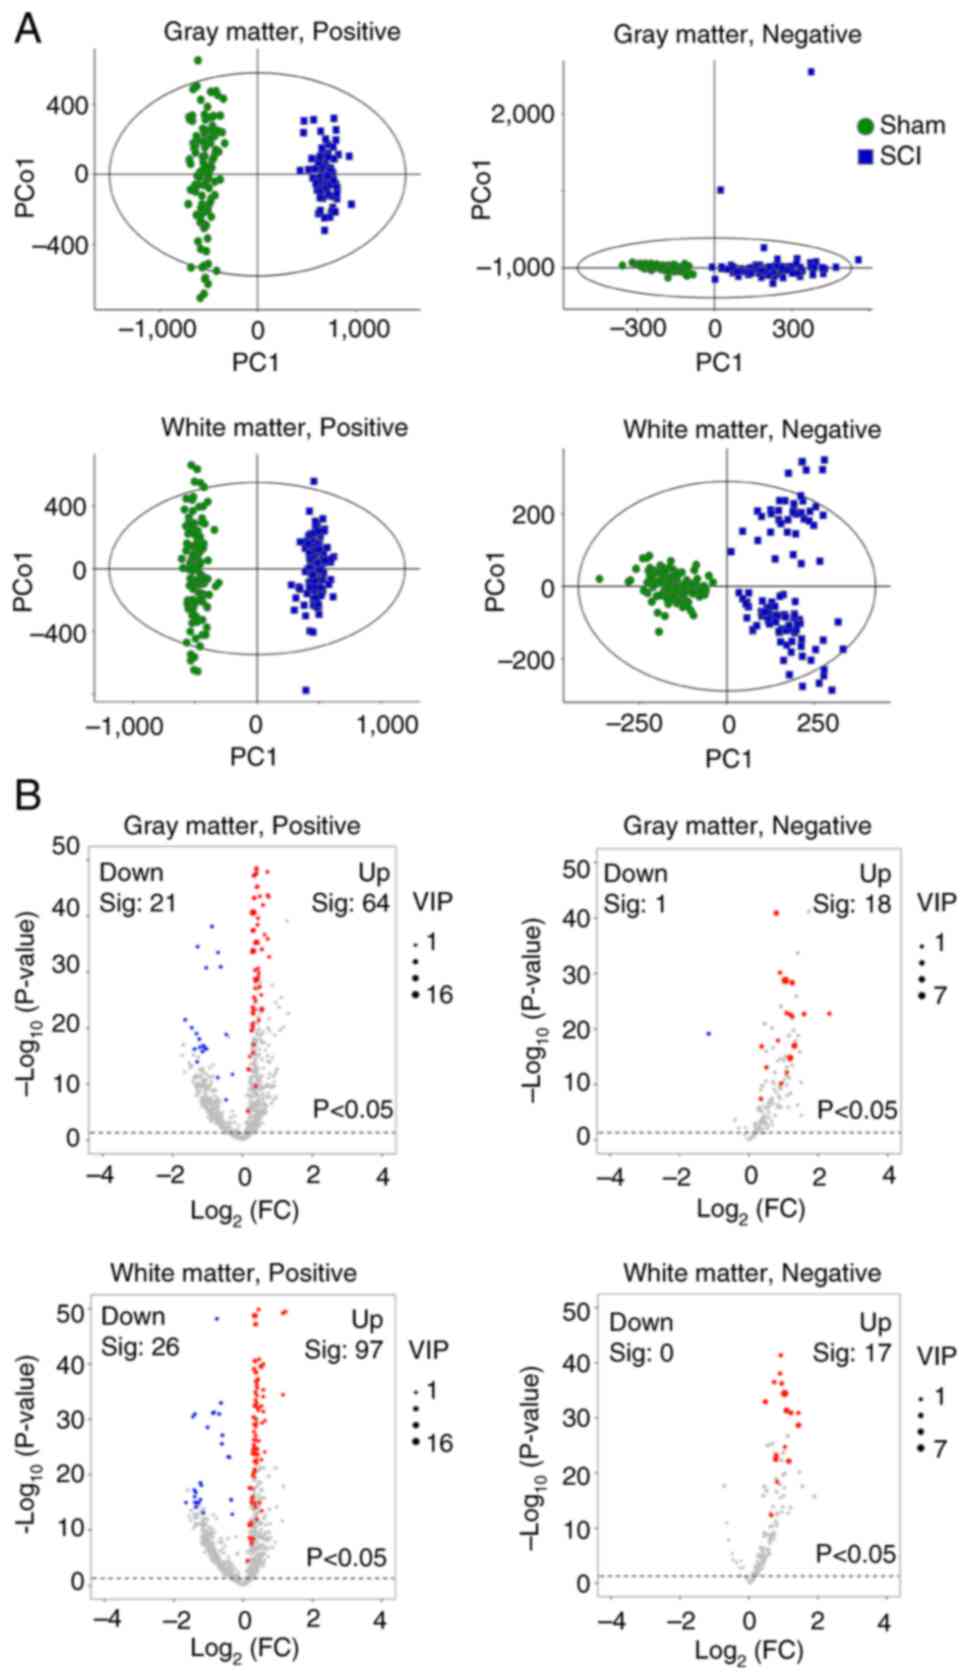
Mass spectrometry results showed that a total of
3,077 m/z signals were collected, including 255 signals in the
negative mode and 2,822 signals in the positive mode. Based on the
coordinates, mass spectrometry data for the white and gray matter
were separated and subjected to multivariate statistical analysis
(OPLS-DA) to distinguish the overall differences in metabolic
profiles between the groups (Fig.
2A). To prevent model overfitting, seven-fold cross-validation
and 200 response permutation tests were used to assess the validity
of the model (Fig. S2). The
reliability of the OPLS-DA model was assessed using the
R2Y and Q2Y parameters. If the R2Y
and Q2Y values are close to 1 (the slopes of the
R2 and Q2 lines are closer to 45˚), the
models have high goodness-of-fit and predictive abilities. The
results showed that all these values were >0.5. For example, in
the gray matter, under positive ion mode, R²Y=0.982 and Q²Y=0.965;
under negative ion mode, R²Y=0.854 and Q²Y=0.814. These data
indicate that the OPLS-DA results are reliable (15). Additionally, the VIP values were
calculated. Higher VIP values indicated a greater contribution of
the variable to group separation. In the present study, m/z signals
with VIP values >1 were further analyzed for differential
metabolites.
Subsequently, the P-values and FCs for each m/z
signal after SCI were calculated. A total of 104 signals VIP values
>1 with P<0.05 were identified in the gray matter. Of these,
85 were in the positive mode, with 64 metabolites elevated and 21
decreased, while 19 were in the negative mode, with 18 elevated and
1 decreased in the SCI model compared with those in the sham group.
A total of 140 signals VIP values >1 with P<0.05 were
identified in the white matter. Of these, 123 were in the positive
mode, with 97 elevated and 26 decreased, while all 17 signals in
negative mode were elevated, with none showing a decrease under SCI
conditions. (Fig. 2B). These mass
spectrometry data were further annotated to metabolites via the
SmetDB database. The results revealed 315 differential metabolites
in the gray matter and 404 differential metabolites in the white
matter (Table SI). Comparative
analysis of these differential metabolites showed that 205
metabolites were increased in both the gray and white matter,
whereas 32 metabolites were decreased in both the gray and white
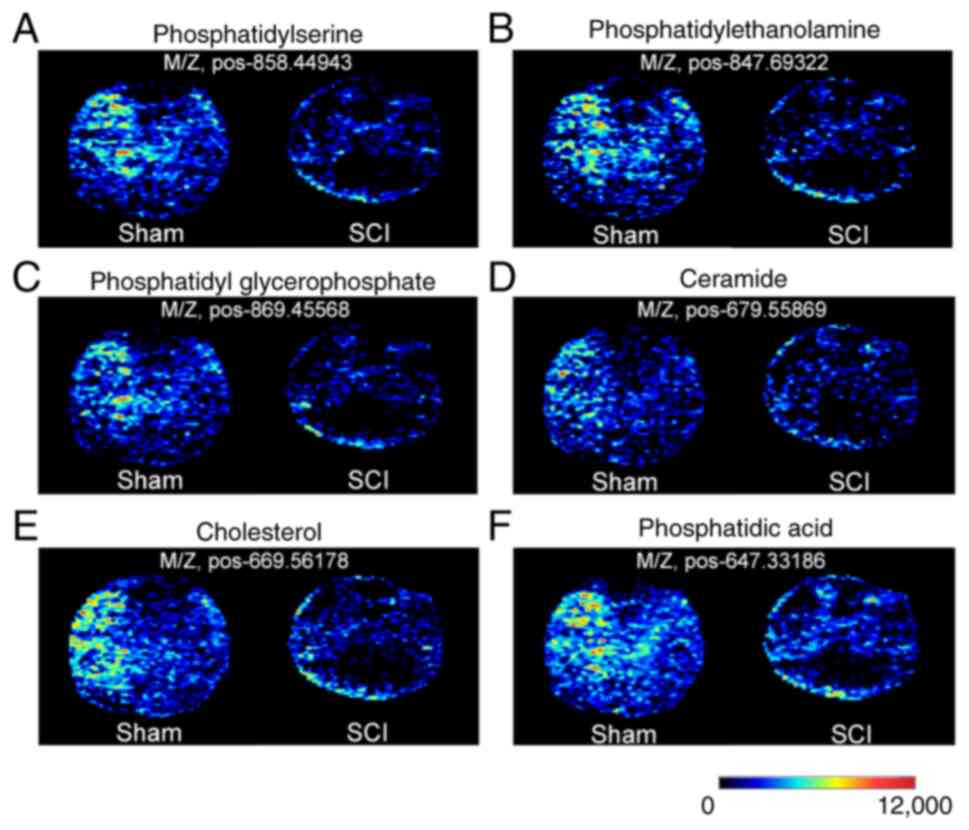
matter. Overall, a large number of metabolites were elevated in the
SCI group. And a substantial portion of the decreased metabolites
were lipid. For instance, PS, PE and PGP mainly decreased in the
gray matter, CE and Cer mainly decreased in the white matter, and
PA decreased in both the gray and white matter (Table SII). The raw m/z signal heatmaps
for these representative metabolites were also displayed in
Fig. 3.
Differential changes in metabolites in
the ventral horn and dorsal horn
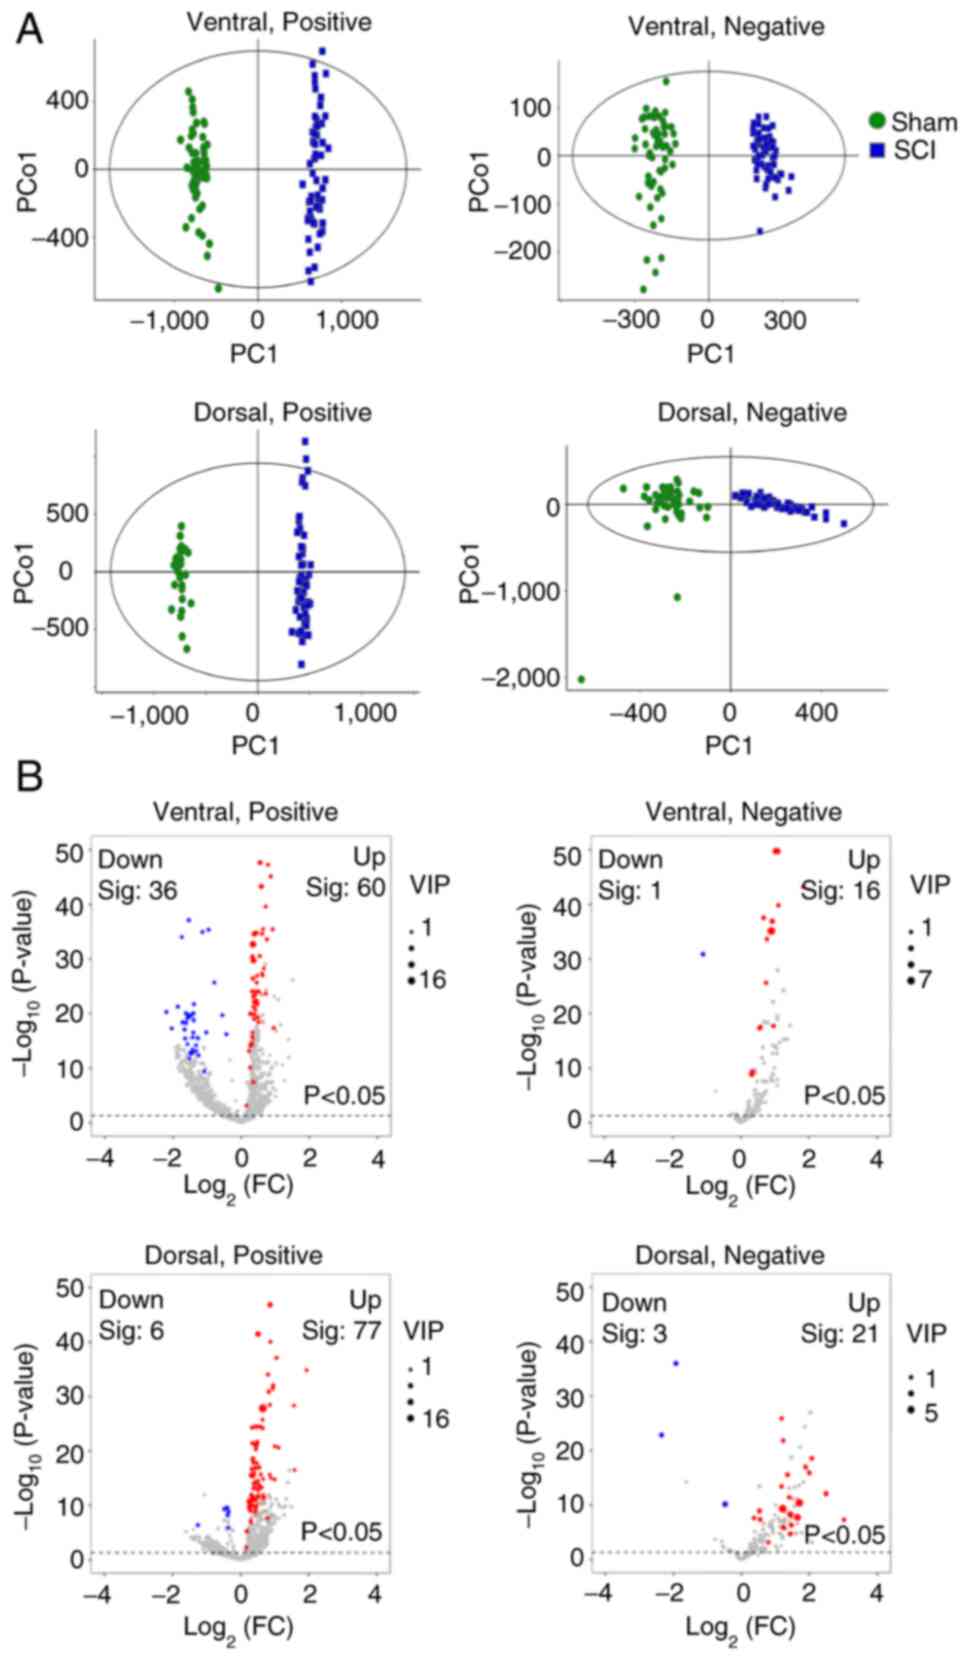
The mass spectrometry data of the ventral and dorsal
horns of the gray matter were further separated based on the
coordinates, and OPLS-DA was performed to distinguish the overall
metabolic profile differences between the groups (Fig. 4A). The reliability of the OPLS-DA
model was assessed using the R2Y and Q2Y
parameters, such as in the ventral horn, under positive ion mode,
R²Y=0.99 and Q²Y=0.971; under negative ion mode, R²Y=0.974 and
Q²Y=0.953. As shown in Fig. S3,
the R2Y and Q2Y values of the data indicated
that the models had high goodness-of-fit and predictive
ability.
Subsequently, screening was conducted based on the
VIP value, P-value and FC of each m/z signal. After SCI, 113
differential data points were observed in the ventral horn with VIP
values >1 and P<0.05, 96 of which were in the positive mode
and 17 of which were in the negative mode. The dorsal horn had 107
differential data points with VIP values >1 and P<0.05, 83 of
which were in the positive mode and 24 of which were in the
negative mode (Fig. 4B). Further
analysis of these annotated m/z signals revealed 315 differential
metabolites in the ventral horn and 258 differential metabolites in
the dorsal horn after SCI (Table
SIII). A total of 134 metabolites increased in both the ventral
and dorsal horns, whereas 10 metabolites decreased in both the
ventral and dorsal horns. Similar to the gray and white matter, the
number of metabolites was increased after injury in both the
ventral and dorsal horns. The decreased metabolites contain large
amounts of lipids. For example, PS, PA and PGP were mainly
decreased in the ventral horn, whereas PE was mainly decreased in
the dorsal horn (Table SIV). The
raw m/z signal intensity images are also presented in Fig. 3.
Functional enrichment analysis of
differential metabolites
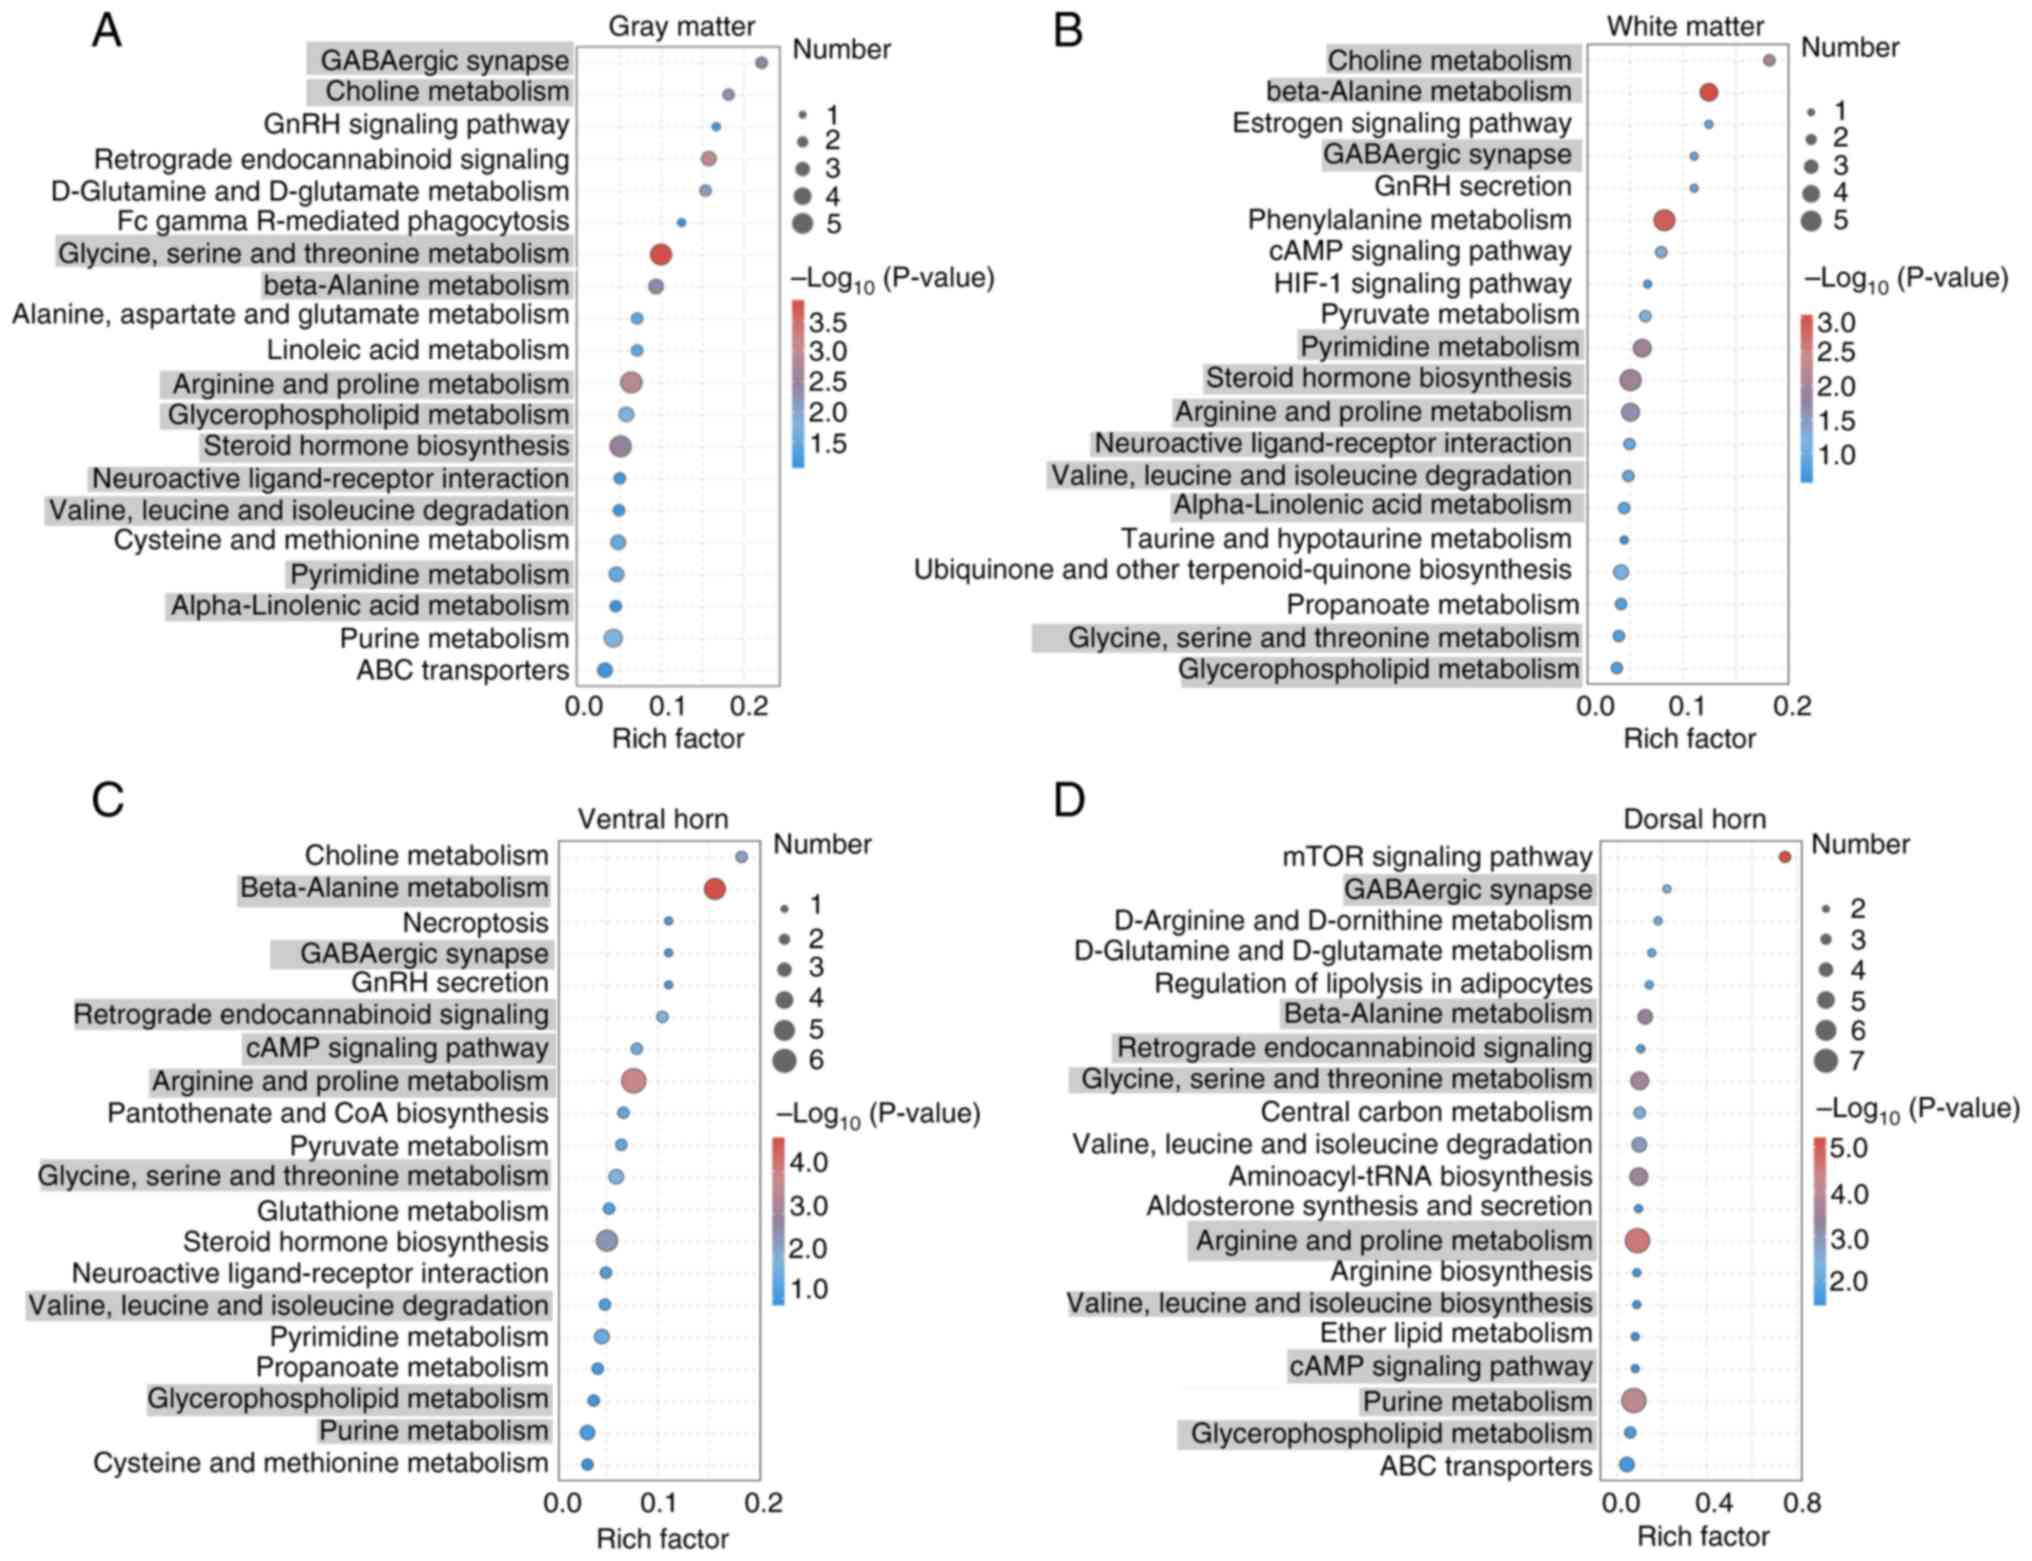
Next, functional enrichment analysis of these
differential metabolites was performed, with the top 20 terms shown
in Fig. 4. The Y-axis represents
the functional terms, and the X-axis represents the Rich factor
(number of significantly different metabolites/number of total
metabolites in the term). The larger the Rich factor, the greater
the degree of enrichment. The color code from blue to red indicates
the sequential decrease of the P-value, while the dot size
indicates the number of metabolites. The larger the dot, the
greater the number of metabolites enriched in the pathway.
The analysis revealed that certain terms were
specific to one anatomical structure, while others were common to
both. For example, ‘ABC transporters’, ‘purine metabolism’ and
‘cysteine and methionine metabolism’ were exclusively enriched in
gray matter, whereas ‘propanoate metabolism’, ‘ubiquinone and other
terpenoid-quinone biosynthesis’ and ‘taurine and hypotaurine
metabolism’ were uniquely enriched in the white matter. Several
amino acid metabolism terms, such as ‘glycine, serine and threonine
metabolism’, ‘arginine and proline metabolism’ and ‘beta-alanine
metabolism’, were enriched in both the gray and white matter. In
these terms, inosine, which is involved in ‘purine metabolism’, was
upregulated in the gray matter, while lactic acid, which is
involved in ‘propanoate metabolism’, was upregulated in the white
matter. Additionally, spermidine, which contributes to ‘arginine
and proline metabolism’, was upregulated in both the gray and white
matter (Fig. 5A and B). ‘Cysteine and methionine metabolism’,
‘glutathione metabolism’ and ‘neuroactive ligand-receptor
interaction’ were exclusively enriched in the ventral horn, whereas
‘ether lipid metabolism’, ‘aldosterone synthesis and secretion’ and
‘aminoacyl-tRNA biosynthesis’ were uniquely enriched in the dorsal
horn. Several terms, such as ‘retrograde endocannabinoid signaling’
and ‘purine metabolism’ were enriched in both the ventral and
dorsal horns. In these terms, glutamine, which is involved in
‘glutathione metabolism’, was upregulated in the gray matter, while
arginine, leucine and isoleucine, which are involved in
‘aminoacyl-tRNA biosynthesis’, were upregulated in the dorsal horn.
Additionally, inosine, which contributes to ‘purine metabolism’,
was upregulated in both the ventral and dorsal horns (Fig. 5C and D). These metabolites play crucial roles
in SCI, and their implications are further discussed below.
Verification of the mass spectrometry
results
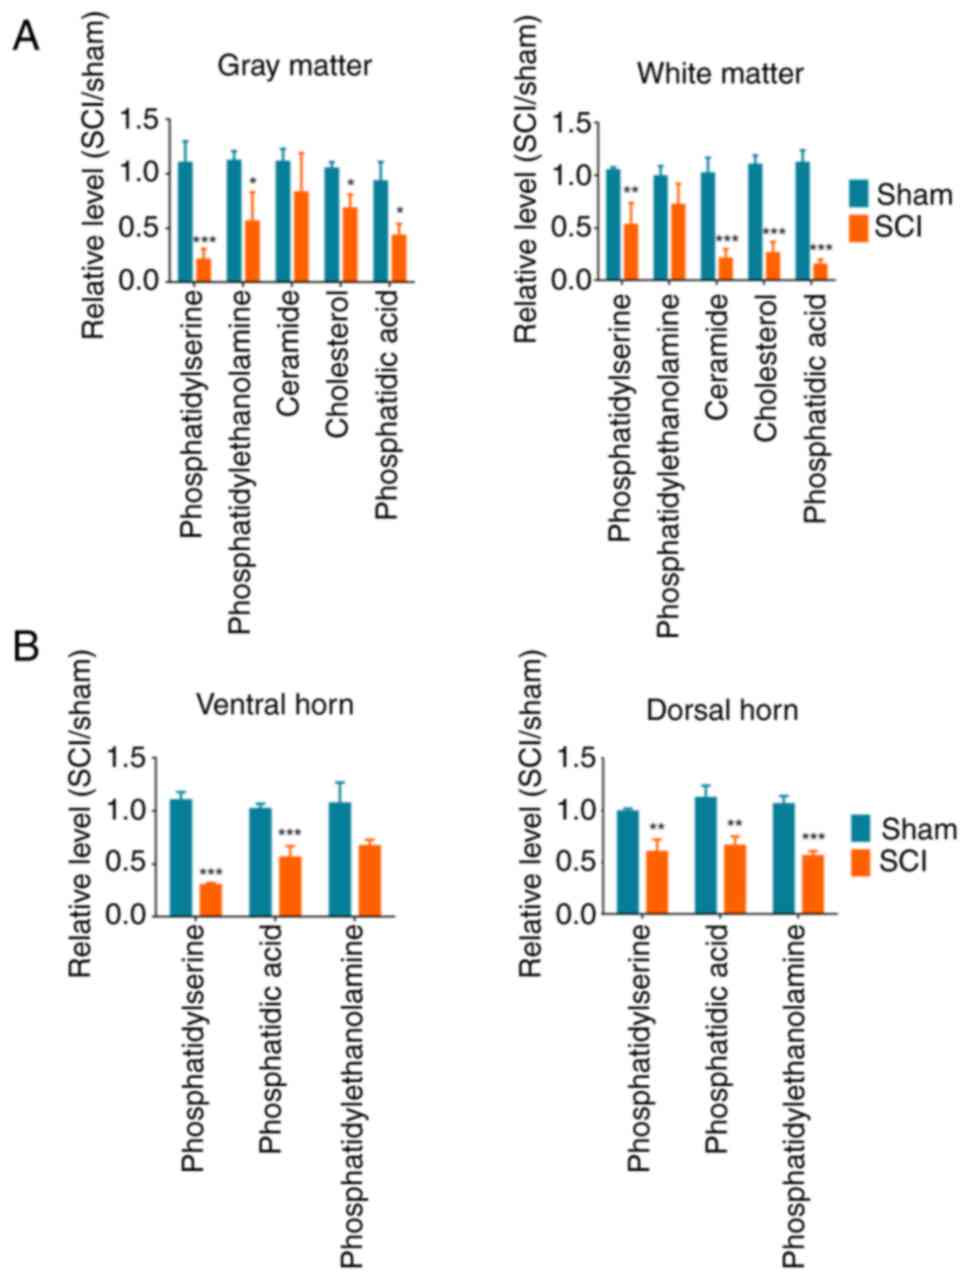
As aforementioned, numerous lipid metabolites were
reduced after SCI. Typical lipid metabolites were selected for
ELISA quantitative analysis, which confirmed the observed changes
by metabolomics. Among these, PS was significantly decreased in the
gray matter, whereas CE and Cer were significantly decreased in the
white matter in the SCI group compared with those in the sham
group. PA exhibited significant differences in both the gray and
white matter. In addition, PS was significantly decreased in the
ventral horn, whereas PE was significantly decreased in the dorsal
horn in the SCI group compared with those in the sham group
(Fig. 6). These results indicated
that different metabolite changes were observed among the gray and
white matter, and the ventral and dorsal horns after SCI.
Discussion
Bulk metabolomics requires homogenization of the
sample and is thus unable to discern metabolic differences at the
cellular or tissue level (11,16,17).
A recent study attempted to explore the metabolic changes on
single-cell resolution (18). The
spinal cord contains mainly neuronal white matter tracts and gray
matter cell bodies. A transverse section reveals a distinct
‘butterfly’ pattern of gray matter surrounded by white matter
(6). This indicates that bulk
metabolomics is not suitable for analyzing metabolite differences
between the white matter and the gray matter after SCI. Spatial
metabolomics can directly obtain the content and spatial
distribution of known or unknown metabolites in specific anatomical
tissues or organs, such as the spinal cord. Spatial metabolomics
has been used to evaluate liver diseases, kidney repair, cancer and
cerebral ischemia (19-22).
The primary stage of SCI, occurring 0-14 days
post-injury, is also considered the acute phase that begins
immediately following traumatic injury. The present study employed
a spinal cord transection model and spatial metabolomics to reveal
the metabolic profiles of the gray and white matter on the seventh
day post-injury. While the current findings provide valuable
insights, incorporating data from multiple time points would
enhance the depth of understanding of the metabolic changes. The
lack of temporal data represents an important limitation, as it
constrains the ability to comprehensively assess the progression
and temporal dynamics of metabolic changes following SCI.
Metabolite levels in spinal cord are expected to vary substantially
across different stages of injury, spanning the acute, subacute and
chronic phases. For example, glutamate levels were transiently
elevated during the acute phase, while a gradual decline in
N-acetyl aspartate was often observed in the chronic phase
(23,24). By focusing on a single time point,
critical fluctuations or patterns that could elucidate the
mechanisms underlying injury progression and recovery may have been
overlooked in the present study. Additionally, prior studies
suggest that following spinal cord transection, animals exhibit
slight motor function recovery at ~14 days post-injury, although
the precise mechanisms driving this recovery remain unclear
(2,5,25).
This is considered to be a distinct area for further investigation.
Future studies should adopt a longitudinal design, incorporating
multiple sampling points throughout the injury timeline. This
approach would enable a more comprehensive analysis of the dynamic
interplay between metabolic changes and physiological processes,
offering a holistic understanding of SCI pathology and recovery.
Such data could also refine therapeutic windows and guide the
development of personalized treatment strategies tailored to the
temporal profile of metabolic alterations.
The results of the present study demonstrated that
the metabolite profiles of the white and gray matter, as well as
those of the ventral and dorsal horns, differ following SCI. A
substantial portion of the decreased metabolites were lipids, which
attracted our attention. PS and PE mainly decreased in the gray
matter, CE and Cer mainly decreased in the white matter, and PA
decreased in both the gray and white matter. PS is a phospholipid
component of the cell membrane that is abundant in the central
nervous system. During apoptosis, PS is exposed on the outer
leaflet of the plasma membrane, while under normal conditions, PS
restricted to the inner leaflet regulates signaling pathways such
as the protein kinase C and PI3K/AKT pathways (26). It has been shown that PS exerts
anti-inflammatory effects on the central nervous system. PS has
been indicated to inhibit the pro-inflammatory cytokines TNF-α and
IL-1β induced by lipopolysaccharide, and promote the production of
the anti-inflammatory cytokines TGF-β and prostaglandin E2 in
microglia (27). In
ischemia/reperfusion injury of the spinal cord, PS levels decreased
during ischemia and were only partially restored after long-term
reperfusion (28). These findings
indicate that if PS levels in the gray matter can be upregulated,
it may promote the survival of neurons after SCI.
PE is synthesized from cytidine, ethanolamine,
diphosphate and diglycerides. In mammals, PE is found particularly
in the nervous tissue, where it constitutes 45% of all
phospholipids (29). The results
of the present study revealed a decrease in PE levels in the gray
matter, particularly in the dorsal horn. Spinal cord ischemia has
been indicated to cause notable degradation of PE in the dorsal
horns (28). PE has a marked
anti-inflammatory effect, particularly on oxidized low-density
lipoprotein-induced macrophage inflammation. Cellular PE levels
were significantly decreased in response to oxidized low-density
lipoprotein induction, while exogenous PE could alleviate
inflammation in oxidized low-density lipoprotein-stimulated cells
(30). In a previous study,
treatment with phosphatidylethanolamine-binding protein 1 decreased
oxidative stress and inflammation, improving neuronal survival
after spinal cord ischemia (31).
Therefore, decreased PE in the gray matter may contribute to
neuroinflammatory and oxidative damage after SCI.
CE and Cer levels were significantly reduced in the
white matter after SCI. CE is widely distributed in body tissues,
particularly in the brain and spinal cord. It is not only the basic
structural component of cell membranes, but also a precursor of
several lipid metabolites, such as steroids, hormones and bile
acids (32). Although some
patients with SCI have reduced blood CE levels, there is no
evidence that CE can alleviate or worsen SCI (33). The current opinion is that CE is
not directly involved in inflammatory responses, as CE is not among
the inflammatory proteins produced by the immune system. However,
evidence shows that CE accumulation in immune cells promotes
inflammatory responses, such as the activation of toll-like
receptor signaling and inflammasomes (32). Cer is another important metabolite
composed of sphingosine and fatty acids connected by amide bonds
and is present in large amounts in the cell membrane (34). Researchers have demonstrated that
exogenous Cer promotes the survival or death of spinal motor
neurons by regulating apoptosis in a dose-dependent manner.
Inhibition of Cer biosynthesis improved motor function and reduced
neutrophil infiltration and cytokine production in an animal model
of SCI (35). Therefore, decreased
CE levels in the spinal cord may have no obvious physiological or
pathological significance. Cer may have bidirectional regulatory
effects on the spinal cord via complex underlying mechanisms.
In addition to lipids, numerous other metabolites
were significantly altered and may play important roles in SCI.
Inosine levels were elevated in the gray matter. Inosine is a
purine nucleoside in which hypoxanthine is attached to ribofuranose
via a β-N (9)-glycosidic bond.
Inosine has been shown to enhance axon sprouting and motor
recovery, as well as reduce secondary degeneration and cell death
in adult SCI rats (25,36). Hu et al (37) reported that overall lactate levels
are increased in the spinal cord to promote microglial scar
formation following SCI. The present study also identified a
specific elevation of lactic acid in the white matter.
Additionally, it was observed that spermidine was upregulated in
both the gray and white matter. Spermidine has been demonstrated to
have protective effects against neurotrauma (38). In our previous studies, eukaryotic
translation initiation factor 5A, which is hypusinated by
spermidine, was not only shown to enhance neuromuscular junction
connectivity but also promote synaptic plasticity in SCI rats
(2,5). These findings suggest that spermidine
may play a role in promoting spinal cord repair following
injury.
Amino acids presented significant metabolic changes
after SCI in both the gray and white matter. Several studies have
focused on changes in amino acid levels in the spinal cord.
High-performance liquid chromatography results showed that
glutamate and aspartate levels decreased after SCI (39). Arginine is a semi-essential amino
acid involved in neuronal cell survival and functionality. After
SCI, arginine was demonstrated to enhance the inflammatory
response, thereby exacerbating secondary injuries (40). Injury causes the spinal cord to
release neurotoxic amino acids, particularly glutamate. It has been
shown that the concentration of amino acids increases locally after
injury and decreases with increasing distance from the center of
the injury. A number of glutamate receptors are present on the cell
membrane. When glutamate released by injury binds to its receptors,
the membrane potential changes, thereby damaging the cells.
Therefore, modifying the activity of glutamate receptors on the
cell membrane using glutamate release inhibitors can result in
antioxidant, nourishing and neuroprotective effects (41).
In conclusion, the present study demonstrated that
the metabolic profiles of the gray matter, white matter, dorsal
horn and ventral horn following SCI were different. Altered
metabolites may be important in the pathogenesis of secondary SCI
and may consequently represent potential therapeutic targets for
treatment.
Supplementary Material
(A) Box-and-whisker plot showing the
BBB scores, which confirm the successful establishment of the
model. In SCI rats, the scores were 0, 0, 1, 0, 1 and 0, while all
sham rats maintained a score of 21, indicating no neurological
impairment. (B) Contiguous spinal cord sections with intact spinal
cord morphology were selected for mass spectrometry imaging
analysis. (C) Correlation analysis of the spatially shrunken
centroid clustering results indicates the degree of the correlation
between different clusters. The Pearson correlation coefficient
followed by Bonferroni correction was used to measure the degree of
linear correlation between two clusters. Red indicates a positive
correlation, and blue indicates a negative correlation. The dot
size represents the absolute value of the correlation coefficient.
SCI, spinal cord injury; BBB, Basso, Beattie and Bresnahan scale.
*P<0.05, **P<0.01 and
***P<0.001 vs. sham or the correlated cluster.
Validation plot of the OPLS-DA model
for the gray and white matter. Seven-fold cross-validation and 200
response permutation testing were used to examine the quality of
the OPLS-DA. The model parameters for each group were as follows:
Gray matter, positive: R2Y=0.98, Q2Y=0.97,
R2=(0.00, 0.50) and Q2=(0.00, -0.53); gray
matter, negative: R2Y=0.85, Q2Y=0.81,
R2=(0.00, 0.05) and Q2=(0.00, -0.17); white
matter, positive: R2Y=0.99, Q2Y=0.97,
R2=(0.00, 0.55) and Q2=(0.00, -0.64); white
matter, negative: R2Y=0.89, Q2Y=0.84,
R2=(0.00, 0.21) and Q2=(0.00, -0.34).
R2Y represents the proportion of variation in the
response variable (Y) that the model can explain, serving as a
measure of the model’s goodness-of-fit. Q2Y indicates
the model’s predictive accuracy, determined through
cross-validation. R2 refers to the overall proportion of
variance explained by the model. Q2 similarly represents
the cross-validated predictive power of the model. High
R2Y and Q2Y values (with Q2Y
ideally >0.5) suggest a robust and reliable model. Additionally,
in permutation tests, a negative Q2 intercept is a good
indicator that the model is not overfitted. OPLS-DA, orthogonal
partial least squares-discriminant analysis.
Validation plot of the OPLS-DA model
for the ventral and dorsal horns. Seven-fold cross-validation and
200 response permutation testing were used to examine the validity
of OPLS-DA. The model parameters for each group were as follows:
Ventral horn, positive: R2Y=0.99, Q2Y=0.97,
R2=(0.00, 0.51) and Q2=(0.00, -0.54); ventral
horn, negative: R2Y=0.97, Q2Y=0.95,
R2=(0.00, 0.33) and Q2=(0.00, -0.53); dorsal
horn, positive: R2Y=1.00, Q2Y=0.99,
R2=(0.00, 0.55) and Q2=(0.00, -0.68); dorsal
horn, negative: R2Y=0.85, Q2Y=0.55,
R2=(0.00, 0.10) and Q2=(0.0, -0.30).
R2Y represents the proportion of variation in the
response variable (Y) that the model can explain, serving as a
measure of the model’s goodness-of-fit. Q2Y indicates
the model’s predictive accuracy, determined through
cross-validation. R2 refers to the overall proportion of
variance explained by the model. Q2 similarly represents
the cross-validated predictive power of the model. OPLS-DA,
orthogonal partial least squares-discriminant analysis; SCI, spinal
cord injury.
Differentially expressed metabolites
in gray and white matter.
Differentially expressed metabolites
in gray and white matter after spinal cord injury.
Differentially expressed metabolites
in the dorsal and ventral horns.
Differentially expressed metabolites
in the ventral and dorsal horns after spinal cord injury.
Acknowledgements
The authors would like to thank Shanghai Luming
Biotechnology Co., Ltd., for performing the metabolomics data
analysis.
Funding
Funding: The present study was supported by the National Natural
Science Foundation of China (grant nos. 82271354 and 82001269) and
the Natural Science Foundation of Chongqing (grant no.
CSTB2023NSCQ-MSX0717).
Availability of data and materials
The metabolomics data generated in the present study
may be found in Proteomics Identification Database under accession
no. PXD060179 or at the URL: https://www.ebi.ac.uk/pride/archive/projects/PXD060179.
The other data generated in the present study may be requested from
the corresponding author.
Authors' contributions
FFS designed the study. CL and YT performed the
experiments. CL and FFS analyzed the data. CL and FFS confirm the
authenticity of all the raw data, and wrote the manuscript. All
authors read and approved the final manuscript.
Ethics approval and consent to
participate
The animal experiments were approved by the
Chongqing Medical University Ethics Committee on Animal Research
(Chongqing, China; approval no. 2022-0115).
Patient consent for publication
Not applicable.
Competing interests
The authors declare that they have no competing
interests.
References
|
1
|
GBD Spinal Cord Injuries Collaborators.
Global, regional, and national burden of spinal cord injury,
1990-2019: A systematic analysis for the Global Burden of Disease
Study 2019. Lancet Neurol. 22:1026–1047. 2023.PubMed/NCBI View Article : Google Scholar
|
|
2
|
Shang FF, Zhao W, Zhao Q, Liu J, Li DW,
Zhang H, Zhou XF, Li CY and Wang TH: Upregulation of eIF-5A1 in the
paralyzed muscle after spinal cord transection associates with
spontaneous hindlimb locomotor recovery in rats by upregulation of
the ErbB, MAPK and neurotrophin signal pathways. J Proteomics.
91:188–199. 2013.PubMed/NCBI View Article : Google Scholar
|
|
3
|
Liu W, Shang FF, Xu Y, Belegu V, Xia L,
Zhao W, Liu R, Wang W, Liu J, Li CY and Wang TH: eIF5A1/RhoGDIα
pathway: A novel therapeutic target for treatment of spinal cord
injury identified by a proteomics approach. Sci Rep.
5(16911)2015.PubMed/NCBI View Article : Google Scholar
|
|
4
|
Zheng Q, Lin R, Wang D, Zheng C and Xu W:
Effects of circulating inflammatory proteins on spinal degenerative
diseases: Evidence from genetic correlations and Mendelian
randomization study. JOR Spine. 7(e1346)2024.PubMed/NCBI View Article : Google Scholar
|
|
5
|
Shang FF, Xia QJ, Liu W, Xia L, Qian BJ,
You L, He M, Yang JL and Wang TH: miR-434-3p and DNA
hypomethylation co-regulate eIF5A1 to increase AChRs and to improve
plasticity in SCT rat skeletal muscle. Sci Rep.
6(22884)2016.PubMed/NCBI View Article : Google Scholar
|
|
6
|
Varma AK, Das A, Wallace G IV, Barry J,
Vertegel AA, Ray SK and Banik NL: Spinal cord injury: A review of
current therapy, future treatments, and basic science frontiers.
Neurochem Res. 38:895–905. 2013.PubMed/NCBI View Article : Google Scholar
|
|
7
|
Fujieda Y, Ueno S, Ogino R, Kuroda M,
Jönsson TJ, Guo L, Bamba T and Fukusaki E: Metabolite profiles
correlate closely with neurobehavioral function in experimental
spinal cord injury in rats. PLoS One. 7(e43152)2012.PubMed/NCBI View Article : Google Scholar
|
|
8
|
Peng J, Zeng J, Cai B, Yang H, Cohen MJ,
Chen W, Sun MW, Lu CD and Jiang H: Establishment of quantitative
severity evaluation model for spinal cord injury by metabolomic
fingerprinting. PLoS One. 9(e93736)2014.PubMed/NCBI View Article : Google Scholar
|
|
9
|
Baker SA and Rutter J: Metabolites as
signalling molecules. Nat Rev Mol Cell Biol. 24:355–374.
2023.PubMed/NCBI View Article : Google Scholar
|
|
10
|
Gorgey AS, Dolbow DR, Dolbow JD, Khalil
RK, Castillo C and Gater DR: Effects of spinal cord injury on body
composition and metabolic profile - part I. J Spinal Cord Med.
37:693–702. 2014.PubMed/NCBI View Article : Google Scholar
|
|
11
|
Alexandrov T: Spatial metabolomics: From a
niche field towards a driver of innovation. Nat Metab. 5:1443–1445.
2023.PubMed/NCBI View Article : Google Scholar
|
|
12
|
Arifin WN and Zahiruddin WM: Sample size
calculation in animal studies using resource equation approach.
Malays J Med Sci. 24:101–105. 2017.PubMed/NCBI View Article : Google Scholar
|
|
13
|
Scheff SW, Saucier DA and Cain ME: A
statistical method for analyzing rating scale data: The BBB
locomotor score. J Neurotrauma. 19:1251–1260. 2002.PubMed/NCBI View Article : Google Scholar
|
|
14
|
Bemis KA, Föll MC, Guo D, Lakkimsetty SS
and Vitek O: Cardinal v. 3: A versatile open-source software for
mass spectrometry imaging analysis. Nat Methods. 20:1883–1886.
2023.PubMed/NCBI View Article : Google Scholar
|
|
15
|
Triba MN, Le Moyec L, Amathieu R, Goossens
C, Bouchemal N, Nahon P, Rutledge DN and Savarin P: PLS/OPLS models
in metabolomics: The impact of permutation of dataset rows on the
K-fold cross-validation quality parameters. Mol Biosyst. 11:13–19.
2015.PubMed/NCBI View Article : Google Scholar
|
|
16
|
Chen X, Shu W, Zhao L and Wan J: Advanced
mass spectrometric and spectroscopic methods coupled with machine
learning for in vitro diagnosis. View. 4(20220038)2023.
|
|
17
|
Zhang J, Hu A, Chen X, Shen F, Zhang L,
Lin Y and Shen H: Pan-targeted quantification of deep and
comprehensive cancer serum proteome improves cancer detection.
View. 4(20220039)2023.
|
|
18
|
Cao J, Yao QJ, Wu J, Chen X, Huang L, Liu
W, Qian K, Wan JJ and Zhou BO: Deciphering the metabolic
heterogeneity of hematopoietic stem cells with single-cell
resolution. Cell Metab. 36:209–221.e6. 2024.PubMed/NCBI View Article : Google Scholar
|
|
19
|
Wang H, Li Z, Cao G, Tang L, Zhou R, Li C,
Zhang J, Wu H, Li X and Yang H: Targeted energy metabolomics
combined with spatial metabolomics study on the efficacy of guhong
injection against cerebral ischemia reperfusion. Mol Neurobiol.
60:5533–5547. 2023.PubMed/NCBI View Article : Google Scholar
|
|
20
|
Santos AA, Delgado TC, Marques V,
Ramirez-Moncayo C, Alonso C, Vidal-Puig A, Hall Z, Martínez-Chantar
ML and Rodrigues CMP: Spatial metabolomics and its application in
the liver. Hepatology. 79:1158–1179. 2024.PubMed/NCBI View Article : Google Scholar
|
|
21
|
Young LEA, Conroy LR, Clarke HA, Hawkinson
TR, Bolton KE, Sanders WC, Chang JE, Webb MB, Alilain WJ, Vander
Kooi CW, et al: In situ mass spectrometry imaging reveals
heterogeneous glycogen stores in human normal and cancerous
tissues. EMBO Mol Med. 14(e16029)2022.PubMed/NCBI View Article : Google Scholar
|
|
22
|
Zheng Q, Wang D, Lin R, Li Z, Chen Y, Chen
R, Zheng C and Xu W: Effects of circulating inflammatory proteins
on osteoporosis and fractures: Evidence from genetic correlation
and Mendelian randomization study. Front Endocrinol (Lausanne).
15(1386556)2024.PubMed/NCBI View Article : Google Scholar
|
|
23
|
Afjehi-Sadat L, Brejnikow M, Kang SU,
Vishwanath V, Walder N, Herkner K, Redl H and Lubec G: Differential
protein levels and post-translational modifications in spinal cord
injury of the rat. J Proteome Res. 9:1591–1597. 2010.PubMed/NCBI View Article : Google Scholar
|
|
24
|
Di Giulio F, Castellini C, Palazzi S,
Tienforti D, Antolini F, Felzani G, Baroni MG and Barbonetti A:
Correlates of metabolic syndrome in people with chronic spinal cord
injury. J Endocrinol Invest. 47:2097–2105. 2024.PubMed/NCBI View Article : Google Scholar
|
|
25
|
Kim D, Zai L, Liang P, Schaffling C,
Ahlborn D and Benowitz LI: Inosine enhances axon sprouting and
motor recovery after spinal cord injury. PLoS One.
8(e81948)2013.PubMed/NCBI View Article : Google Scholar
|
|
26
|
Ma X, Li X, Wang W, Zhang M, Yang B and
Miao Z: Phosphatidylserine, inflammation, and central nervous
system diseases. Front Aging Neurosci. 14(975176)2022.PubMed/NCBI View Article : Google Scholar
|
|
27
|
De SR, Ajmone-Cat MA, Nicolini A and
Minghetti L: Expression of phosphatidylserine receptor and
down-regulation of pro-inflammatory molecule production by its
natural ligand in rat microglial cultures. J Neuropathol Exp
Neurol. 61:237–244. 2002.PubMed/NCBI View Article : Google Scholar
|
|
28
|
Lukacova N, Halát G, Chavko M and Marsala
J: Ischemia-reperfusion injury in the spinal cord of rabbits
strongly enhances lipid peroxidation and modifies phospholipid
profiles. Neurochem Res. 21:869–873. 1996.PubMed/NCBI View Article : Google Scholar
|
|
29
|
Vance JE and Tasseva G: Formation and
function of phosphatidylserine and phosphatidylethanolamine in
mammalian cells. Biochim Biophys Acta. 1831:543–554.
2013.PubMed/NCBI View Article : Google Scholar
|
|
30
|
Hao T, Fang W, Xu D, Chen Q, Liu Q, Cui K,
Cao X, Li Y, Mai K and Ai Q: Phosphatidylethanolamine alleviates
OX-LDL-induced macrophage inflammation by upregulating autophagy
and inhibiting NLRP1 inflammasome activation. Free Radic Biol Med.
208:402–417. 2023.PubMed/NCBI View Article : Google Scholar
|
|
31
|
Kim W, Cho SB, Jung HY, Yoo DY, Oh JK,
Choi GM, Cho TG, Kim DW, Hwang IK, Choi SY and Moon SM:
Phosphatidylethanolamine-binding protein 1 ameliorates
ischemia-induced inflammation and neuronal damage in the rabbit
spinal cord. Cells. 8(1370)2019.PubMed/NCBI View Article : Google Scholar
|
|
32
|
Tall AR and Yvan-Charvet L: Cholesterol,
inflammation and innate immunity. Nat Rev Immunol. 15:104–116.
2015.PubMed/NCBI View Article : Google Scholar
|
|
33
|
Syed MUS, Khan Z, Zulfiqar A, Basham MA,
Abdul Haseeb H, Azizullah S, Ismail H, Elbahnasawy M, Nadeem Z and
Karimi S: Electrocardiographic abnormalities in patients with
spinal cord injury with deranged lipid profile. Cureus.
13(e18246)2021.PubMed/NCBI View Article : Google Scholar
|
|
34
|
Arana L, Gangoiti P, Ouro A, Trueba M and
Gómez-Muñoz A: Ceramide and ceramide 1-phosphate in health and
disease. Lipids Health Dis. 9(15)2010.PubMed/NCBI View Article : Google Scholar
|
|
35
|
Cuzzocrea S, Deigner HP, Genovese T,
Mazzon E, Esposito E, Crisafulli C, Di Paola R, Bramanti P,
Matuschak G and Salvemini D: Inhibition of ceramide biosynthesis
ameliorates pathological consequences of spinal cord injury. Shock.
31:634–644. 2009.PubMed/NCBI View Article : Google Scholar
|
|
36
|
Liu F, You SW, Yao LP, Liu HL, Jiao XY,
Shi M, Zhao QB and Ju G: Secondary degeneration reduced by inosine
after spinal cord injury in rats. Spinal Cord. 44:421–426.
2006.PubMed/NCBI View Article : Google Scholar
|
|
37
|
Hu X, Huang J, Li Z, Li J, Ouyang F, Chen
Z, Li Y, Zhao Y, Wang J, Yu S, et al: Lactate promotes microglial
scar formation and facilitates locomotor function recovery by
enhancing histone H4 lysine 12 lactylation after spinal cord
injury. J Neuroinflammation. 21(193)2024.PubMed/NCBI View Article : Google Scholar
|
|
38
|
Huang J, Zhang H, Zhang J, Yu H, Lin Z and
Cai Y: Spermidine exhibits protective effects against traumatic
brain injury. Cell Mol Neurobiol. 40:927–937. 2020.PubMed/NCBI View Article : Google Scholar
|
|
39
|
Watanabe M, Fujimura Y, Nakamura M, Yato
Y, Ohta K, Okai H and Ogawa Y: Changes of amino acid levels and
aspartate distribution in the cervical spinal cord after traumatic
spinal cord injury. J Neurotrauma. 15:285–293. 1998.PubMed/NCBI View Article : Google Scholar
|
|
40
|
Erens C, Van Broeckhoven J, Bronckaers A,
Lemmens S and Hendrix S: The dark side of an essential amino acid:
L-Arginine in spinal cord injury. J Neurotrauma. 40:820–832.
2023.PubMed/NCBI View Article : Google Scholar
|
|
41
|
Liu X, Zhang Y, Wang Y and Qian T:
Inflammatory response to spinal cord injury and its treatment.
World Neurosurg. 155:19–31. 2021.PubMed/NCBI View Article : Google Scholar
|