Introduction
Hypertension plays a causative role in the onset of
stroke, myocardial infarction, heart failure, peripheral arterial
disease, and chronic kidney disease. Hypertension can be classified
as either essential or secondary. Due to a similar pathophysiology,
spontaneously hypertensive rats (SHR) are widely used as an animal
model for essential hypertension in humans (1). The SHR strain was derived from
outbred Wistar-Kyoto (WKY) rats by selective breeding of animals
that had high blood pressure. Thus, the normotensive WKY rats were
used as controls for SHR (2).
Currently, antihypertensive drugs include thiazide
diuretics, angiotensin converting enzyme (ACE) inhibitors, calcium
channel blockers, β-blockers, and angiotensin II receptor
antagonists (3). Enalapril is an
ACE inhibitor that lowers blood pressure by reducing plasma levels
of angiotensin II (4). Enalapril
has also been shown to reduce progression of carotid intimal and
medial thickening, constriction of blood vessels and aldosterone
secretion in patients with hypertension and/or diabetes (5). Nifedipine is an L-type calcium
channel blocker of the dihydropyridine family, which inhibits the
transmembrane influx of calcium ions into cardiac and vascular
smooth muscle cells (6).
Nifedipine causes arterial vasodilation, reduced muscle
contraction, inhibition of reactive oxygen species (ROS)
production, and vascular smooth muscle cell proliferation (7). However, the therapeutic target
molecules regulated by the action of enalapril and nifedipine
remain to be fully identified.
To identify the genes involved in the pathogenesis
of cardiovascular diseases, including hypertension, we used DNA
microarray analysis to establish gene expression profiles in heart,
brain, and liver tissues from SHR, compared with the WKY controls,
as well as after administration of antihypertensive drugs. The aim
of this study was to: i) identify target genes that are
specifically regulated by enalapril and nifedipine in an
established animal model of essential hypertension, and ii) provide
novel insight into therapeutic antihypertension strategies using
enalapril and nifedipine.
Materials and methods
Administration of antihypertensive drugs
in WKY and SHR
Enalapril and nifedipine were obtained from
Sigma-Aldrich (St. Louis, MO, USA). Specific pathogen free
8–9-week-old male SHR and WKY rats were obtained from the Samtaco
Animal Breeding Company (Osan, South Korea). All in vivo
studies were approved by the Institutional Animal Care and Use
Committee, Chonnam National University. Enalapril (40 mg/kg/day) or
nifedipine (30 mg/kg/day) were administered orally every day for 3
weeks. The dosage and duration of administration were calculated
considering the maximum therapeutic dose in humans and based on
previous studies (8,9).
Measurement of systolic blood
pressure
Systolic blood pressure (SBP) was measured using the
CODA system (Kent Scientific Corporation, Torrington, CT, USA) as
previously described (10). SBP
and body weight were evaluated every week. After 3 weeks of
administration, the rats were sacrificed and tissue weights of the
heart, brain and liver were determined.
RNA extraction
Samples of heart, brain and liver were homogenized,
and total RNA was extracted using TRIzol® reagent
(Molecular Research Center, Inc., Cincinnati, OH, USA). The
concentration and purity of the total RNA were determined
spectrophotometrically at 260 and 280 nm using an Agilent™
Bioanalyzer (Agilent Technologies, Palo Alto, CA, USA).
DNA microarray analysis
Differential gene expression was measured using
CodeLink Rat Whole Genome Bioarrays (<34,000 genes; Amersham,
Piscataway, NJ, USA) following the manufacturer's protocol, and the
data were analyzed as previously described (11). Briefly, for first-strand cDNA
synthesis, 5 μg of total RNA was heated at 70°C for 10 min with
control bacterial mRNA and a T7 oligo(dT) primer, followed by
incubation with first-strand reaction components (10X buffer, 5 mM
dNTP, RNase inhibitor and reverse transcriptase) for 1 h at 42°C.
The second strand was produced by incubation of first-strand cDNA
products with second-strand reaction components (10X buffer, 5 mM
dNTP, RNase H, DNA polymerase) for 2 h at 16°C. Double-stranded
cDNA was purified using a QIAquick purification kit (Qiagen,
Valencia, CA, USA). Purified double-stranded cDNA was incubated at
37°C for 14 h with IVT mix (10X reaction buffer, biotinylated UTP,
UTP, ATP, CTP, GTP and T7 enzyme) to enable in vitro
transcription of cRNA. The biotin-labeled cRNA was purified using
the Qiagen RNeasy mini kit (Qiagen). A mixture of 10 μg of cRNA and
5X fragmentation buffer was incubated at 94°C for 20 min, and then
hybridized at 90°C for 5 min. After chilling on ice for 10 min, the
hybridization mixtures were slowly injected into sealed microarray
slides. The slides were shaken at 37°C and 300 rpm for 18–24 h
prior to incubation at 46°C for 1 h with preheated 0.75X TNT buffer
[1X TNT: 0.1 M Tris-HCl (pH 7.6), 0.15 M NaCl, and 0.05% Tween-20],
followed by incubation at room temperature for 30 min with 3.4 ml
of Cy5-streptavidin working solution. The slides were washed four
times with 1X TNT buffer for 5 min and then rinsed with 0.1X
SSC/0.05% Tween™ for 30 sec. Hybridization to the arrays was
detected using a ScanArray Express scanner (Packard BioScience,
Meriden, CT, USA) with the laser set at 635 nm. After scanning, the
array images were analyzed by ImaGene 6.0 and GeneSight 4.1
software.
Treatment of MOVAS cells with
interleukin-24 (IL-24)
MOVAS cells (1x10⁵/ml), an immortalized
mouse vascular aorta smooth muscle cells, were grown in DMEM
supplemented with 10% FBS and 1% penicillin-streptomycin
(Gibco-BRL, Rockville, NY, USA) at 37°C in a humidified atmosphere
containing 5% CO2. When the cells were 70% confluent,
the medium was replaced with serum-free DMEM. After serum
starvation for 12 h, the cells were treated with 0.3 mM
H2O2 (Merck, Darmstadt, Germany) for 6 h in
the presence or absence of recombinant human (rh) IL-24 (50 ng/ml;
R&D Systems, Inc., Minneapolis, MN, USA).
RT-PCR and real-time PCR
Total RNA was isolated using TRIzol®
reagent (Molecular Research Center, Inc.). First-strand cDNA was
synthesized from 5.0 μg of total RNA using an M-MLV reverse
transcriptase kit (Promega, Madison, WI, USA), according to the
manufacturer's instructions. For RT-PCR, the synthesized cDNAs were
added to a PCR mixture consisting of 10X PCR buffer, 0.25 mM dNTP,
0.5 unit TaqDNA polymerase and 10 pmol of gene-specific primers.
Primers used for PCR were: angiotensinogen,
5′-gtacagacagcaccctactt-3′ and 5′-cacgtcacggagaagttgtt-3′;
endothelin-1, 5′-agctggtggaaggaaggaaactacg-3′ and
5′-gacagtgcagaaaggtgaggtagac-3′; angiotensin II type 1
receptor-associated protein (ATRAP), 5′-tgcttggggcaacttcactatc-3′
and 5′-acggtgcatgtggtagacgag-3′; platelet-derived growth factor
(PDGF), 5′-tccagcgacaaggaacagaacg-3′ and
5′-ggagattcagattcaccactttgc-3′; β-actin,
5′-gagatggccactgccgcatcctct-3′ and 5′-atggtgctaggagccagagcagta-3′.
PCR amplification was performed using 26 cycles (β-actin) or 28
cycles (all others) at 95°C for 1 min, 56°C for 1 min, and 72°C for
2 min, followed by a final extension for 10 min at 72°C. Equal
volumes of reaction mixture from each sample were loaded onto 1%
agarose gels and visualized by ethidium bromide staining.
Real-time PCR amplifications were performed in
48-well plates in a MiniOpticon™ Real-Time PCR Detection System
(Bio-Rad Laboratories, Inc., USA) in a total volume of 10 μl,
including 1 μl of template cDNA, 10 pmol of gene-specific primers
and iQ SYBR-Green Supermix (Bio-Rad Laboratories, Inc.). Each
sample was analyzed in triplicate. Primers used for PCR were:
myocyte enhancer factor 2D (Mef2d), 5′-cagcagccagcactacagag-3′ and
5′-ggcagggatgaccttgttta-3′; IL-24, 5′-ggcctgagcctaatccttct-3′ and
5′-ctgcagaacctgtggtttca-3′; occludin, 5′-gagggtacacagaccccaga-3′
and 5′-caggattgcgctgactatga-3′; peroxisome proliferator-activated
receptor δ (Pparδ), 5′-aacatccccaacttcagcag-3′ and
5′-tactgcgcaagaactcatgg-3′; triadin, 5′-gcttccagacctgctttgtc-3′ and
5′-ggctcttttcctttcccatc-3′; moesin, 5′-cccaaagagtcttggagcag-3′ and
5′-atgttgagacccaaggcatc-3′; guanosine monophosphate reductase
(Gmpr), 5′-gatgtggccaatgggtattc-3′ and 5′-ccgactcccactttgatgat-3′;
β-actin, 5′-attgttaccaactgggacgacatg-3′ and
5′-cttcatgaggtagtctgtcaggtc-3′. PCR amplification was performed as
follows: 95°C for 15 min, followed by 48 cycles at 95°C for 30 sec,
55°C for 30 sec, and 72°C for 30 sec. All data were normalized to
β-actin expression levels.
Statistical analysis
For statistical analysis of data, P-values were
analyzed using a two-way ANOVA and post-hoc test. Results are
expressed as the means ± SEM, and differences are considered
statistically significant when P<0.05.
Results
SBP, body and tissue weights
SBP levels of SHR were higher than those of WKY rats
(128±11 mmHg in WKY vs. 186±10 mmHg in SHR, P<0.05), while
administration with enalapril or nifedipine for 3 weeks
significantly decreased SBP levels of SHR (186±10 mmHg in SHR vs.
144±9 mmHg in enalapril-treated SHR, P<0.05 or 142±8 mmHg in
nifedipine-treated SHR, P<0.05) (Table I). SHR had a lower body weight
than WKY (233±6 g in WKY vs. 228±6 g in SHR, Day 0; 254±5 g in WKY
vs. 246±7 g in SHR, Day 21) (Table
I). The heart weights of SHR were greater than those of the WKY
rats (1.00±0.05 g in WKY vs. 1.22±0.05 g in SHR, Day 0; 1.09±0.004
g in WKY vs. 1.30±0.05 g in SHR, Day 21, P<0.05), but weights of
the brain and liver did not show apparent differences between SHR
and WKY rats. Administration with enalapril or nifedipine did not
significantly affect the body and tissue weights in SHR (Table I).
 | Table ISystolic blood pressure, body and
tissue weights of WKY and SHR. |
Table I
Systolic blood pressure, body and
tissue weights of WKY and SHR.
| WKY | SHR |
|---|
|
|
|
|---|
| Untreated | Untreated |
Enalapril-treated |
Nifedipine-treated |
|---|
|
|
|
|
|
|---|
| Day 0 | Day 21 | Day 0 | Day 21 | Day 0 | Day 21 | Day 0 | Day 21 |
|---|
| Blood pressure,
mmHg | 118±7 | 128±11 | 177±12a | 186±10a | 178±11 | 144±9b | 176±8 | 142±8c |
| Body weight, g | 233±6 | 254±5 | 228±4 | 246±7 | 226±5 | 238±3 | 227±5 | 241±4 |
| Tissue weight,
g |
| Heart | 1.00±0.05 | 1.09±0.04 | 1.22±0.05a | 1.30±0.05a | 1.20±0.03 | 1.25±0.06 | 1.21±0.05 | 1.24±0.04 |
| Brain | 1.4±0.03 | 1.5±0.02 | 1.4±0.05 | 1.4±0.06 | 1.4±0.04 | 1.4±0.04 | 1.4±0.03 | 1.4±0.05 |
| Liver | 10.2±0.5 | 10.9±0.6 | 11.0±0.5 | 12.1±0.5 | 11.1±0.4 | 11.9±0.5 | 11.2±0.4 | 11.8±0.6 |
Effects of nifedipine and enalapril on
differential gene expression in the heart, brain and liver from
SHR
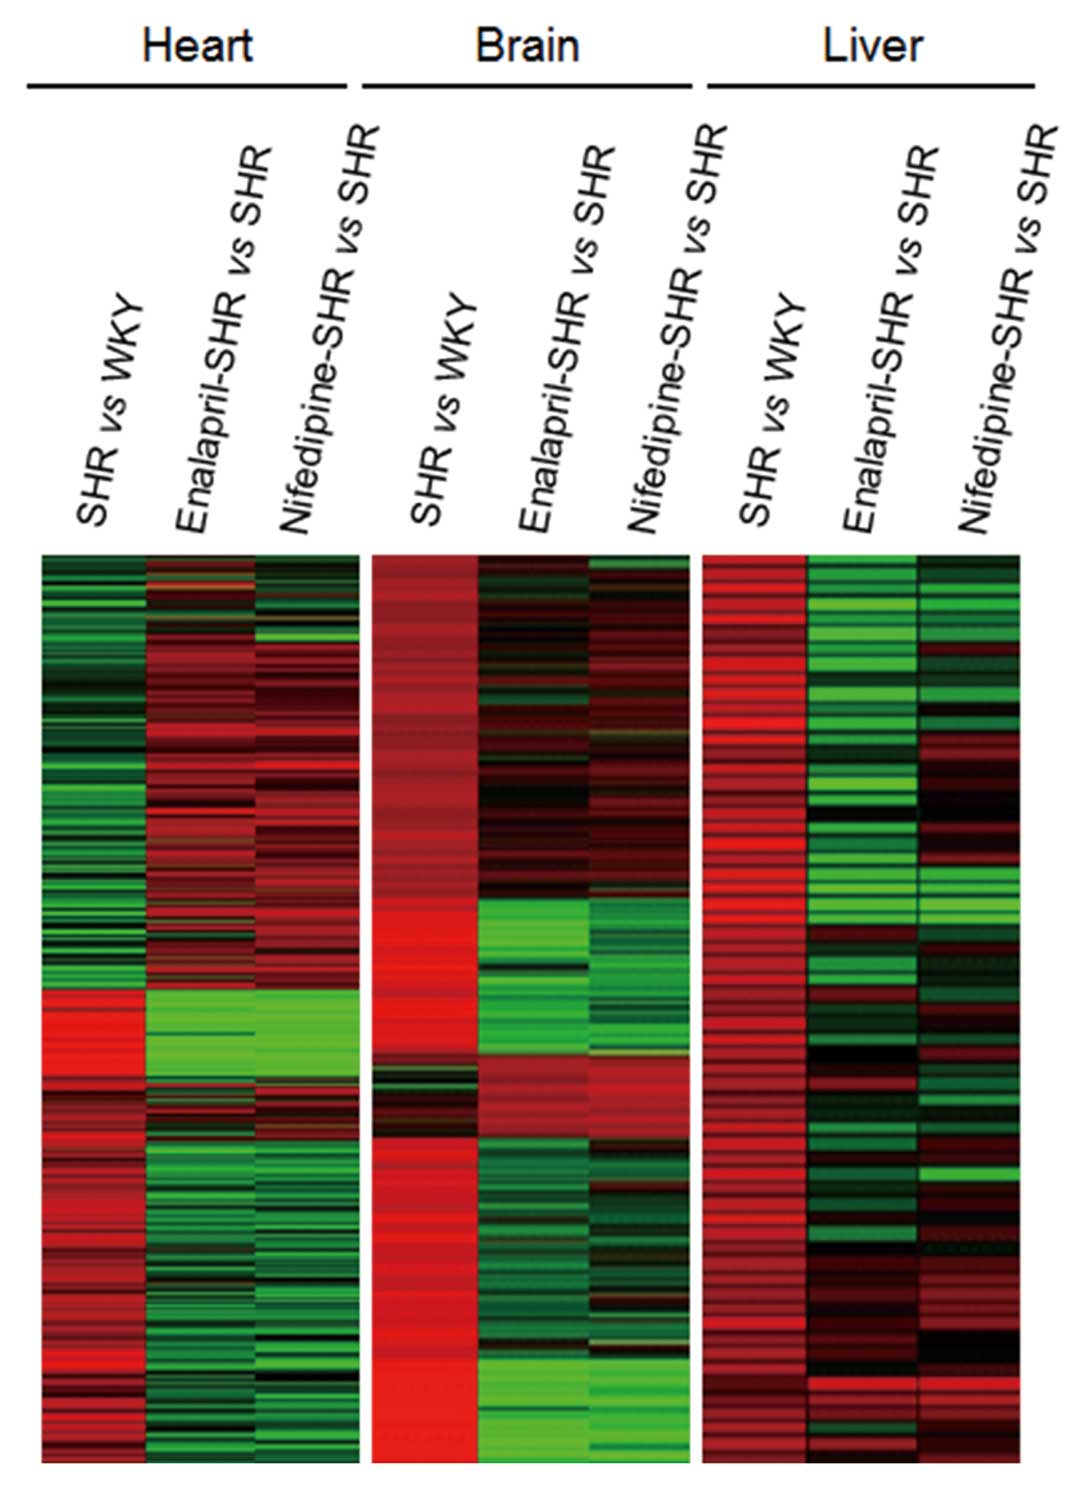
We used 34K gene chip microarray analysis to
identify differentially expressed genes in the heart, brain, and
liver from WKY and SHR as well as SHR treated with antihypertensive
drugs. In total, 4,020 genes were found to be differentially
expressed, with expression profiles clustering into three different
groups using the K-means algorithm (Fig. 1). Heart, brain and liver samples
showed 1,146, 265 and 172 upregulated genes, respectively, in SHR
compared with the WKY controls. Administration of enalapril in SHR
decreased the expression of 948, 104 and 45 of these same genes in
the heart, brain and liver, respectively, compared with the
untreated SHR. Similarly, nifedipine administration decreased the
expression of 921, 111 and 69 of these genes in the heart, brain
and liver, respectively.
In the converse analysis, 1,887, 283 and 267 genes
showed decreased expression in the heart, brain and liver,
respectively, from SHR compared with the WKY controls. Among these
downregulated genes, expression of 1,490, 36 and 50 genes in the
heart, brain and liver, respectively, was increased in SHR treated
with enalapril compared with untreated SHR. Similarly, the
expression of 1,564, 102 and 47 of these genes in the heart, brain
and liver, respectively, was increased by nifedipine
administration.
Several of the differentially expressed genes are
known to be involved in the pathogenesis of cardiovascular
diseases, as shown in Table II.
Expression of 23 genes was markedly elevated in these three tissues
from SHR compared with the WKY controls, whereas 10 genes showed
decreased expression. Among these differentially regulated genes,
analysis of heart samples from SHR showed that the expression of 11
genes was increased, while the expression of 7 genes was decreased.
The expression of 9 genes was increased in brain samples from SHR,
while the expression of 2 genes was decreased. Analysis of liver
samples showed that the expression of 3 genes was elevated, while 1
was decreased. Markedly, these gene expression patterns were
reversed by administration of either enalapril or nifedipine. We
also identified 16 differentially expressed genes that had not
previously been reported to be involved in the pathogenesis of
cardiovascular diseases (Table
III). In heart samples from SHR, 5 genes were upregulated
compared with the WKY controls, and 3 genes were downregulated. In
brain samples from SHR, 2 genes were upregulated, while 2 genes
were downregulated. In liver samples from SHR, 3 genes were
upregulated, while 1 gene was downregulated. Among these three
tissues, the most prominent changes in gene expression were
observed in the heart. These data show that administration of SHR
with antihypertensive drugs led to changes in gene expression in a
drug- and tissue-specific manner.
| Table IIGenes showing significant changes in
gene expression between WKY and SHR or between SHR and
antihypertensive drug-treated SHR. |
Table II
Genes showing significant changes in
gene expression between WKY and SHR or between SHR and
antihypertensive drug-treated SHR.
| | | | Fold changes |
|---|
| | | |
|
|---|
| Tissue | Accession no. | Gene
description | Gene category | SHR vs. WKY | Enalapril vs.
vehicle | Nifedipine vs.
vehicle |
|---|
| Heart | NM_030840 | Solute carrier
family 26, member 5 (Slc26a5) | Transportation | 10.47 | −12.32 | −7.92 |
| NM_181364 | Thyrotropin
releasing hormone receptor 2 (Trhr2) | Signal
transduction | 7.45 | −4.95 | −5.38 |
| NM_031818 | Chloride
intracellular channel 4 (Clic4) | Transportation | 7.39 | −7.04 | −6.44 |
| NM_012852 | 5-hydroxytryptamine
(serotonin) receptor 1D (Htr1d) | Signal
transduction | 5.88 | −0.61 | −1.54 |
| NM_001037632 | Sp7 transcription
factor (Sp7) |
Differentiation | 5.81 | −8.52 | NC |
| NM_012654 | Solute carrier
family 9 (sodium/hydrogen exchanger), member 3 (Slc9a3) | Transportation | 5.75 | −0.70 | −1.35 |
| NM_175595 | Calcium channel,
voltage-dependent, α2/δ subunit 3 (Cacna2d3) | Transportation | 5.75 | −5.83 | −4.65 |
| NM_017089 | Ephrin B1
(Efnb1) | Development | 4.97 | −3.41 | −0.64 |
| NM_183331 | Coagulation factor
VIII, procoagulant component (F8) | Coagulation | 4.04 | −5.01 | −2.56 |
| NM_022221 | Matrix
metalloproteinase-8 (Mmp8) | Proteolysis | 3.66 | −6.37 | NC |
| NM_030860 | Myocyte enhancer
factor 2D (Mef2d) | Development | 3.04 | NC | −0.05 |
| NM_031329 | Occludin
(Ocln) | Metabolism | −8.13 | NC | 0.70 |
| NM_053491 | Plasminogen
(Plg) | Coagulation | −6.24 | 1.16 | NC |
| NM_033237 | Galanin
prepropeptide (Gal) | Immune
response | −5.94 | 3.06 | 1.69 |
| NM_017074 | Cystathionine
γ-lyase (Cth) | Metabolism | −4.04 | NC | 2.84 |
| NM_013141 | Peroxisome
proliferator activated receptor δ (Ppard) | Metabolism | −3.81 | NC | 5.20 |
| NM_175758 | Solute carrier
family 1, member 7 | Transportation | −3.57 | 1.51 | 2.53 |
| NM_017034 | Pim-1 oncogene
(Pim1) | Signal
transduction | −3.19 | 0.58 | NC |
| Brain | NM_133575 | Interleukin 1
receptor-like 2 (Il1rl2) | Immune
response | 10.54 | NC | −6.71 |
| NM_012537 | Cytochrome P450,
family 11, subfamily b, polypeptide 1 (Cyp11b1) | Metabolism | 7.54 | NC | −3.22 |
| NM_021666 | Triadin (Trdn) | Homeostasis | 6.43 | −5.33 | −5.09 |
| NM_012687 | Thromboxane A
synthase 1 (Tbxas1) | Metabolism | 6.12 | −5.54 | −4.98 |
| NM_023092 | Myosin IC
(Myo1c) | Transportation | 5.66 | −4.10 | −4.41 |
| NM_017265 | Hydroxy-δ-5-steroid
dehydrogenase, 3 β- and steroid δ-isomerase 6 (Hsd3b6) | Metabolism | 5.61 | −6.35 | NC |
| NM_020071 | Fibrinogen β chain
(Fgb) | Coagulation | 4.20 | −3.54 | −3.77 |
| NM_030863 | Moesin (Msn) | Migration | 3.88 | −3.83 | −3.40 |
| NM_001109880 | Adducin 2, β
(Add2) | Cell structure | 3.63 | −4.04 | −4.01 |
| NM_017017 | Hepatocyte growth
factor (Hgf) | Cell growth | −5.26 | 0.92 | NC |
| NM_030851 | Bradykinin receptor
B1 (Bdkrb1) | Cell growth | −3.62 | NC | 1.88 |
| Liver | M75148 | Kinesin light chain
C (Klc1) | Transportation | 6.70 | −5.00 | −6.47 |
| XM_001071882 | Dynein, axonemal,
heavy polypeptide 10 (Dnah10) | Transportation | 5.50 | −7.01 | −9.36 |
| NM_057188 | Guanosine
monophosphate reductase (Gmpr) | Metabolism | 4.39 | NC | −6.59 |
| NM_022399 | Calreticulin
(Calr) | Protein
folding | −1.09 | 0.77 | 1.03 |
| Table IIIGenes not previously known to be
involved in the pathogenesis of cardiovascular diseases. |
Table III
Genes not previously known to be
involved in the pathogenesis of cardiovascular diseases.
| | | | Fold changes |
|---|
| | | |
|
|---|
| Tissue | Accession no. | Gene
description | Gene category | SHR vs. WKY | Enalapril vs.
vehicle | Nifedipine vs.
vehicle |
|---|
| Heart |
| Downregulated | NM_183330 | Cathepsin Z
(Ctsz) | Proteolysis | 5.66 | −6.25 | −6.62 |
| NM_017004 | Carboxylesterase 1C
(Ces1c) | Metabolism | 4.16 | −0.06 | −0.85 |
| NM_172022 | ProSAPiP1 protein
(Prosapip1) | Cell structure | 2.48 | −0.46 | −1.57 |
| NM_080901 | Recoverin
(Rcvrn) | Transportation | 2.25 | 0.13 | 0.33 |
| NM_023955 | Secretory carrier
membrane protein 2 (Scamp2) | Transportation | 1.88 | −1.69 | −4.90 |
| Upregulated | NM_144759 | Acetylserotonin
O-methyltransferase (Asmt) | Metabolism | −4.58 | 1.17 | 1.93 |
| NM_053643 | Phosphatidate
cytidylyltransferase 2 (Cds2) | Metabolism | −4.38 | −0.64 | −1.35 |
| NM_133311 | Interleukin-24
(IL-24) | Cell survival | −2.30 | 0.96 | 1.68 |
| Brain |
| Downregulated | NM_144752 | 2–5 oligoadenylate
synthetase 1B (Oas1b) | Immune
response | 6.06 | −6.42 | −6.44 |
| NM_053487 | Peroxisomal
biogenesis factor 11 α (Pex11a) |
Differentiation | 2.57 | −3.41 | −1.73 |
| Upregulated | NM_019149 | Matrin 3
(Matr3) | Cell structure | −2.42 | NC | 1.58 |
| NM_001172305 | Protein kinase C, β
1 (Prkcb) | Signal
transduction | −1.16 | NC | 1.25 |
| Liver |
| Downregulated | NM_130756 | Acyl-coenzyme A
thioesterase 8 (Acot8) | Metabolism | 1.65 | −1.20 | −1.34 |
| NM_022382 | Phosphodiesterase
4D interacting protein (Pde4dip) | Signal
transduction | 1.25 | −1.40 | −1.45 |
| NM_001004133 | SH3 and multiple
ankyrin repeat domains protein 2 (Shank2) | Development | 0.87 | −1.23 | −1.64 |
| Upregulated | NM_031533 | UDP
glycosyltransferase 2 family, polypeptide B (Ugt2b) | Metabolism | −1.50 | 1.56 | 1.36 |
Validation of microarray data by
real-time PCR
To validate the microarray data, the expression
levels of 7 genes were measured using real-time PCR (Table IV). Expression of IL-24 in heart
samples from SHR was increased by enalapril compared with SHR
controls, but the expression of occludin and Pparδ did not change.
Expression of triadin and moesin was elevated in brain samples of
SHR compared with WKY controls, but it was decreased after
administration of enalapril. Gmpr and Mef2d showed no change in
expression in the heart or liver from SHR compared with WKY
controls. In addition, the elevated expression of triadin, moesin,
Gmpr and Mef2d in the heart, brain, and liver of SHR was lowered by
nifedipine, while decreased expression of IL-24, occludin and Pparδ
in the heart of SHR was raised by nifedipine. These results
correlate with those from our microarray data.
| Table IVComparison of differential gene
expression measurements between microarray and real-time PCR
analyses. |
Table IV
Comparison of differential gene
expression measurements between microarray and real-time PCR
analyses.
| | Microarray (fold
changes) | Real-time PCR (fold
changes) |
|---|
| |
|
|
|---|
| Tissue | Gene
description | SHR vs. WKY | Enalapril vs.
vehicle | Nifedipine vs.
vehicle | SHR vs. WKY | Enalapril vs.
vehicle | Nifedipine vs.
vehicle |
|---|
| Heart | Myocyte enhancer
factor 2D (Mef2d) | 3.04 | NC | −0.05 | 2.27±0.01 | NC | −0.05±0.01 |
| Interleukin-24
(IL-24) | −2.30 | 0.96 | 1.68 | −1.01±0.11 | 0.94±0.22 | 0.42±0.12 |
| Occludin
(Ocln) | −8.13 | NC | 0.70 | −0.45±0.03 | NC | 0.53±0.02 |
| Peroxisome
proliferator-activated receptor δ (Pparδ) | −3.81 | NC | 5.20 | −1.67±0.05 | NC | 1.83±0.08 |
| Brain | Triadin (Trdn) | 6.43 | −5.33 | −5.09 | 1.83±1.67 | −2.91±0.03 | −2.39±0.03 |
| Moesin (Msn) | 3.88 | −3.83 | −3.40 | 1.77±0.03 | −0.19±0.01 | −0.14±0.01 |
| Liver | Guanosine
monophosphate reductase (Gmpr) | 4.39 | NC | −6.59 | 0.62±0.02 | NC | −0.17±0.01 |
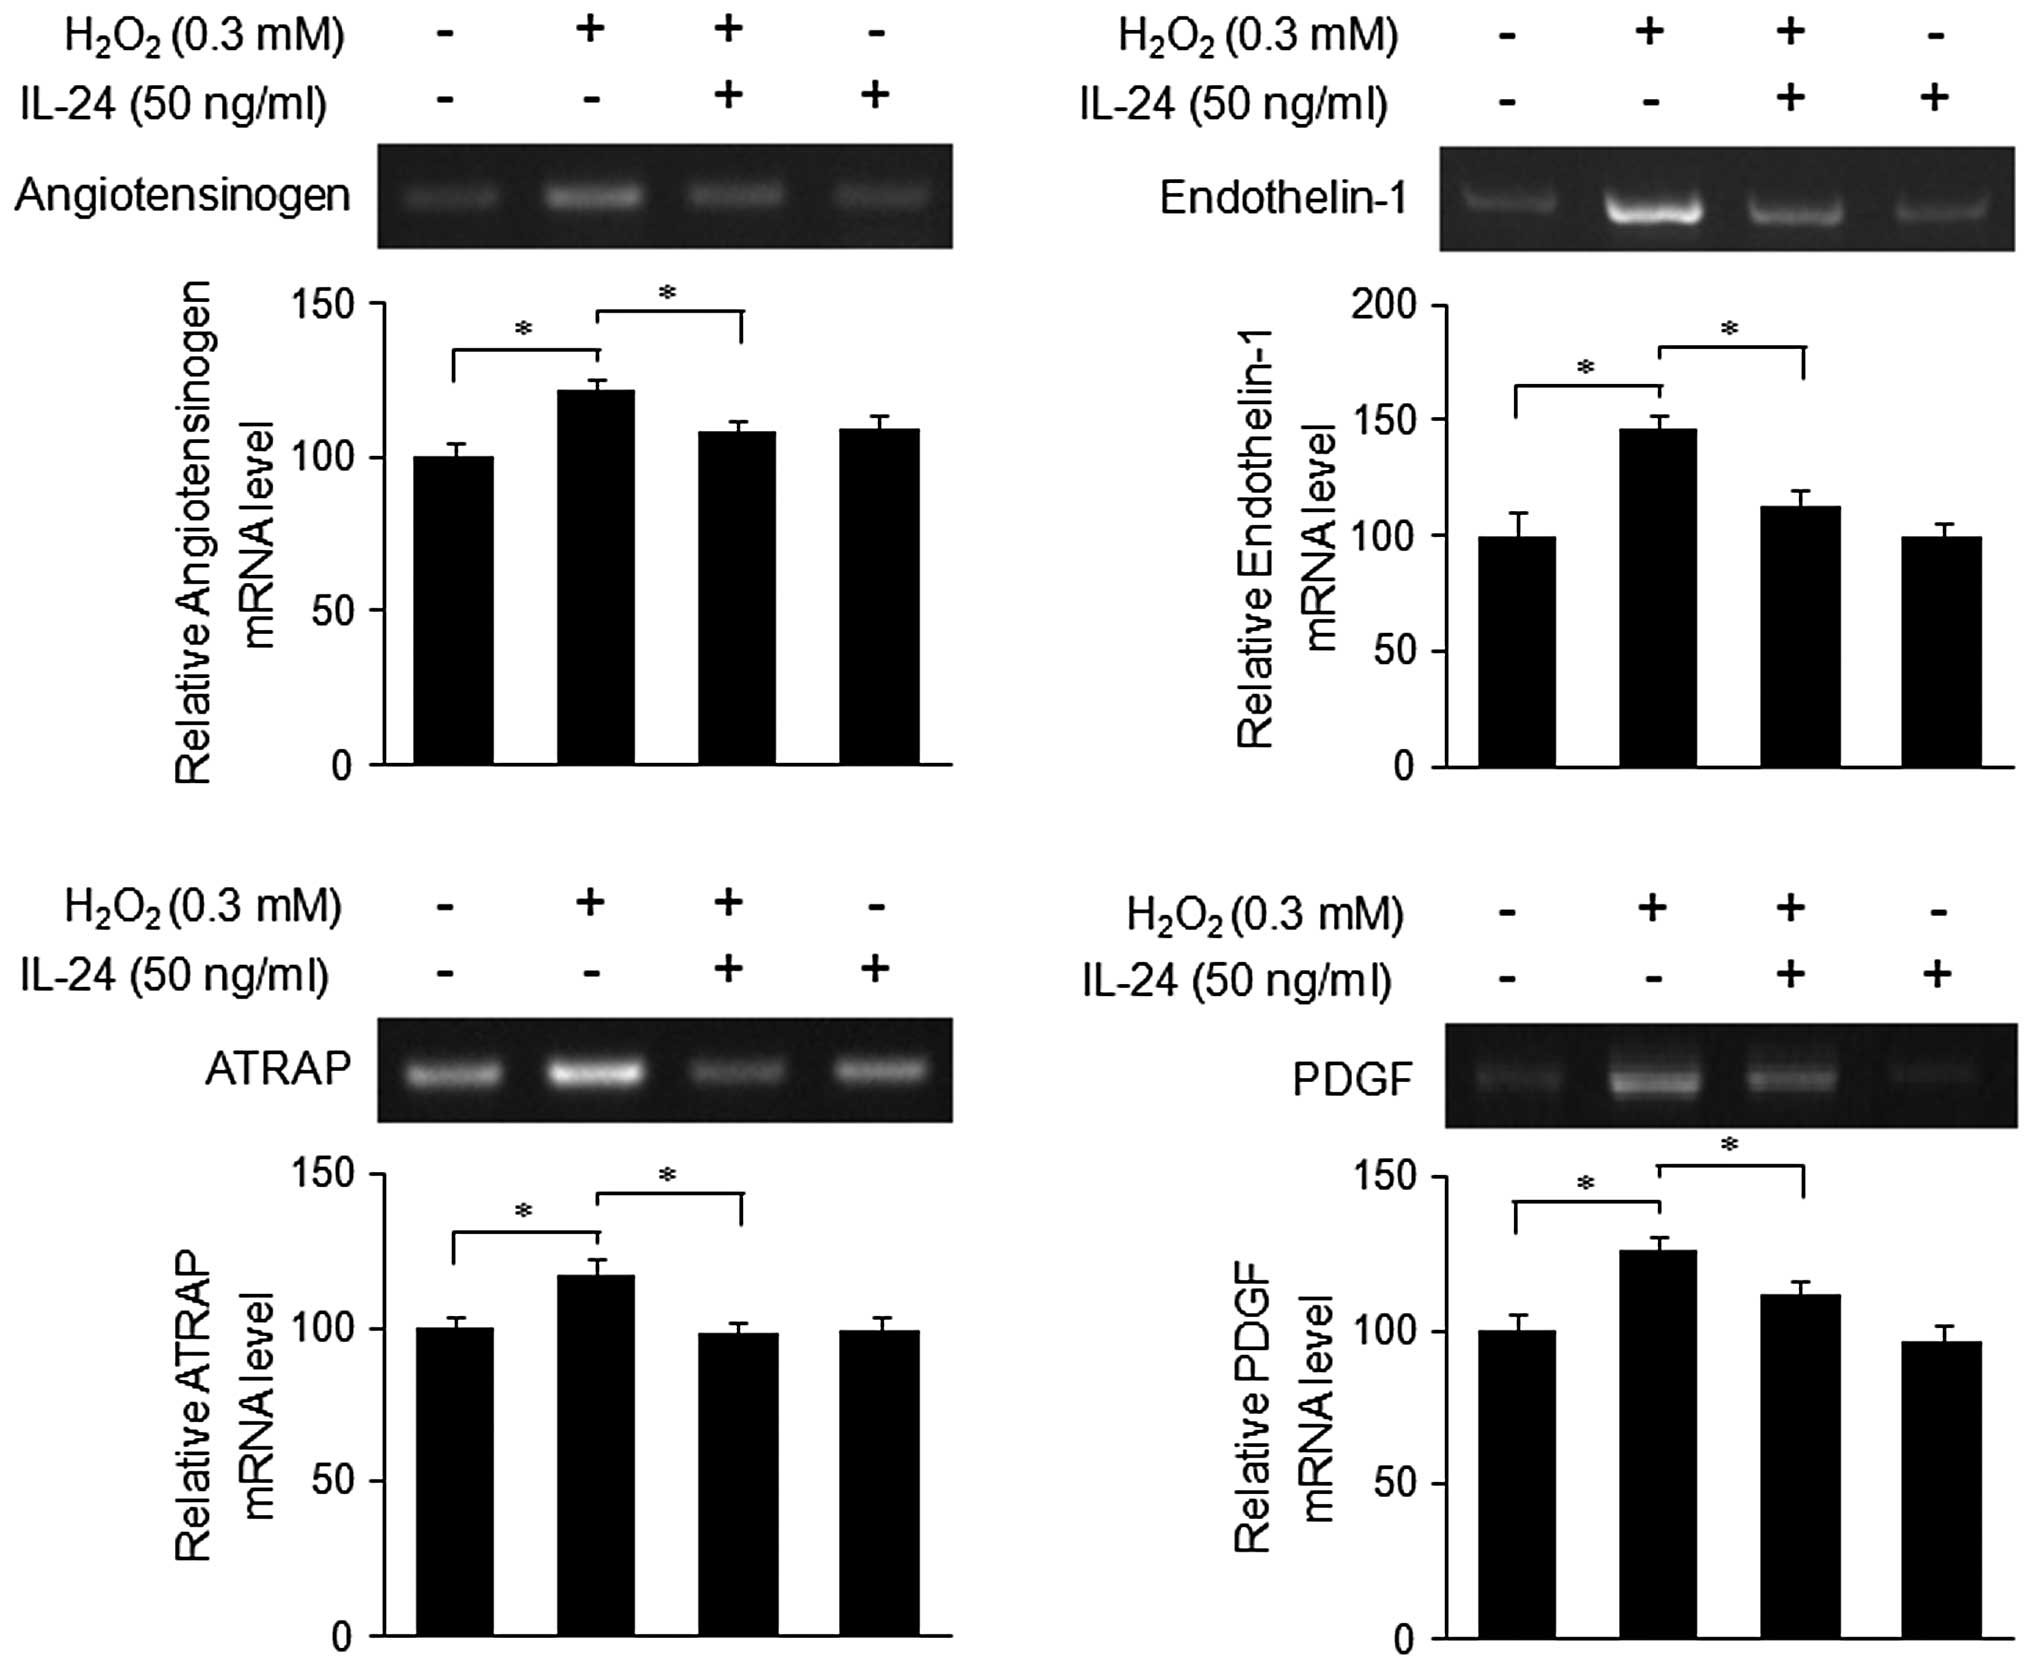
Effect of IL-24 on the expression of
genes associated with cardiovascular disease in MOVAS cells treated
with H2O2
The overproduction of intracellular ROS, such as
superoxide anions (O2−), hydrogen peroxide
(H2O2), and hydroxyl radicals
(OH-), has been implicated in the pathogenesis of
cardiovascular diseases, including hypertension, heart failure,
atherosclerosis and diabetes (12). ROS can induce the expression of
genes associated with cardiovascular diseases in vascular smooth
muscle cells (VSMCs) (13,14).
IL-24 is among the differentially expressed genes described above,
but no role of IL-24 in cardiovascular disease has been reported.
To investigate the effect of IL-24 on ROS-mediated gene expression,
RT-PCR was performed in MOVAS cells treated with
H2O2 in the presence or absence of rhIL-24.
The expression of angiotensinogen, endothelin-1, ATRAP and PDGF was
increased by treatment with H2O2, but reduced
by rhIL-24 (Fig. 2). There was no
effect of IL-24 alone on the expression of the above genes. These
data suggest that IL-24 might play a role in the suppression of
ROS-induced gene expression in cardiovascular disease.
Discussion
Hypertension is a key risk factor for cardiovascular
mortality through target-tissue damage induced on the heart, brain,
liver, kidney and vessels by its various effects (15,17). It has been reported that the heart
and brain tissues are damaged by high blood pressure, leading to
heart hypertrophy and stroke (16). In addition, the liver is the main
tissue of angiotensinogen synthesis, and angiotensin II causes
liver fibrosis, which results in portal hypertension (17). Previous studies found that
administration of SHR with antihypertensive drugs caused changes in
gene expression in the kidney and bladder tissues (18,19). However, there are few similar
studies using the heart, brain or liver tissue from SHR treated
with the antihypertensive drugs enalapril or nifedipine.
The objective of our study was to determine how
these drugs affect gene expression in SHR tissues other than kidney
or bladder. In the heart, brain, and liver tissues from SHR, we
found that oral administration of these drugs altered the
expression of 33 genes involved in cardiovascular disease
pathogenesis. In these tissues, we also identified 16
differentially expressed genes that were not previously known to be
involved in cardiovascular disease pathogenesis (Table III). We confirmed the
differential gene expression found using microarray analysis
(Table II) by real-time PCR on
selected genes, including Mef2d, IL-24, occludin, Pparδ, triadin,
moesin and Gmpr (Table IV). The
biological roles of these genes in cardiovascular disease have been
demonstrated, but no studies have shown changes in their expression
in an animal model of hypertension as a result of administration
with enalapril and nifedipine. Our identification of genes known to
be associated with cardiovascular disease validates this
experimental system.
Our microarray analysis also identified 16 genes
that have not been implicated in cardiovascular disease or shown to
be regulated by antihypertensive drugs (Table III). Among these is cathepsin, a
lysosomal cysteine protease that is associated with the
pathogenesis of cancer, bone remodeling, and cardiovascular disease
through degradation of extracellular matrix (ECM) proteins
(20,21). ECM degradation activity of
cathepsin contributes to the pathogenesis of various diseases,
including cancer and cardiovascular disease (20,22). Cathepsin Z, listed in Table III, is the only carboxypeptidase
in the cathepsin family (23)
that is highly expressed in gastric cancer and hepatocellular
carcinoma and contributes to tumor development (24,25). Secretory carrier membrane protein
(SCAMP), a family of highly conserved tetraspanning transmembrane
proteins, has been known to play a role as a carrier to the cell
surface in post-golgi recycling pathways (26) and to be involved in endocytosis
(27) and exocytosis (28,29). SCAMP2 has been characterized as a
novel serotonin transporter (SERT)-interacting protein that
regulates the subcellular distribution of SERT (30). It is known that mice
overexpressing SERT generate pulmonary arterial hypertension
(31,32). In this context, the genes listed
in Table III including
cathepsin Z and SCAMP2 may be novel therapeutic targets in
cardiovascular disease. However, this needs to be further defined
for correlation with cardiovascular disease.
Among the differentially expressed genes found in
this study is IL-24, which was previously known as melanoma
differentiation antigen 7 (mda-7) exhibiting proapoptotic activity
in a variety of tumor cells and belonging to the IL-10 family of
cytokines (which also includes IL-19, IL-20, IL-22 and IL-26)
(33). Recent studies have
reported several anticancer functions of IL-24, including
cancer-specific induction of apoptosis, cell cycle regulation, and
the ability to inhibit angiogenesis (34). IL-24 has also been known to
selectively inhibit the growth and migration of mouse VSMCs (MOVAS
cells), but the precise mechanisms involved remain unclear
(35). A series of the molecular
pathogenesis are common in cancer and vascular diseases, such as
atherosclerosis and hypertension (36), but little is known about the role
of IL-24 on the pathogenesis of cardiovascular diseases. In this
study, we are the first to show that IL-24 might be capable of
inhibiting expression of cardiovascular disease-associated genes in
ROS-treated mouse VSMCs (MOVAS cells). ROS play important roles in
the pathophysiology of cardiovascular diseases, such as
hyperlipidemia, diabetes mellitus, hypertension, ischemic heart
disease, and chronic heart failure. In addition,
H2O2 itself promotes rat VSMC proliferation
(37), and exogenous
H2O2 can induce production of endogenous
H2O2 by activating cellular NAD(P)H oxidase
(38). We found that IL-24
regulates the expression of inflammation- and hypertension-related
genes, such as angiotensinogen, endothelin-1, ATRAP and PDGF, in
H2O2-treated MOVAS cells. These data suggest
that IL-24 may be a novel therapeutic target for hypertension as
well as cardiovascular disease.
In conclusion, our study is the first report on the
gene expression profiles from the heart, brain and liver of SHR
orally treated with enalapril or nifedipine. These data may aid in
the delineation of the molecular mechanisms that underlie the
potential efficacy of enalapril and nifedipine against
cardiovascular disease. In addition, the differentially expressed
genes identified here may be potential biomarkers as well as novel
targets for the prevention of cardiovascular disease, potentially
providing valuable information for the development of
antihypertensive drugs.
Acknowledgements
This study was supported by the Korea Science and
Engineering Foundation through the Research Center for Women's
Diseases (R11-2005-017-02002) and the Bio-industry Technology
Development Program (111066-3), Ministry for Food, Agriculture,
Forestry and Fisheries, Republic of Korea.
References
|
1
|
Trippodo NC and Frohlic ED: Similarities
of genetic (spontaneous) hypertension. Man and rat Circ Res.
48:309–319. 1981. View Article : Google Scholar : PubMed/NCBI
|
|
2
|
Okamoto K and Aoki K: Development of a
strain of spontaneously hypertensive rats. Jpn Circ J. 27:282–293.
1963. View Article : Google Scholar : PubMed/NCBI
|
|
3
|
Klingbeil AU, Schneider M, Martus P, et
al: A meta-analysis of the effects of treatment on left ventricular
mass in essential hypertension. Am J Med. 115:41–46. 2003.
View Article : Google Scholar : PubMed/NCBI
|
|
4
|
Ménard J, Campbell DJ, Azizi M and
Gonzales MF: Synergistic effects of ACE inhibition and Ang II
antagonism on blood pressure, cardiac weight, and renin in
spontaneously hypertensive rats. Circulation. 96:3072–3078.
1997.PubMed/NCBI
|
|
5
|
Hosomi N, Mizushige K and Ohyama H:
Angiotensin-converting enzyme inhibition with enalapril slows
progressive intima-media thickening of the common carotid artery in
patients with non-insulin-dependent diabetes mellitus. Stroke.
32:1539–1545. 2001. View Article : Google Scholar
|
|
6
|
Croom KF and Wellington K: A Review of the
use of modified-release formulations in the treatment of
hypertension and angina pectoris. Drugs. 66:497–528.
2006.PubMed/NCBI
|
|
7
|
Ueng KC, Lin MC, Chan KC and Lin CS:
Nifedipine gastrointestinal therapeutic system: an overview of its
antiatherosclerotic effects. Expert Opin Drug Metab Toxicol.
3:769–780. 2007. View Article : Google Scholar : PubMed/NCBI
|
|
8
|
Tostes JM: Effects of hypertension on
abdominal wall healing: experimental study in rats. Surg Today.
37:215–219. 2007. View Article : Google Scholar : PubMed/NCBI
|
|
9
|
Yono M, Yamamoto Y, Yoshida M, Ueda S, et
al: Effects of doxazosin on blood flow and mRNA expression of
nitric oxide synthase in the spontaneously hypertensive rat
genitourinary tract. Life Sciences. 81:218–222. 2007. View Article : Google Scholar : PubMed/NCBI
|
|
10
|
Spijkers LJ, Janssen BJ, Nelissen J, et
al: Antihypertensive treatment differentially affects vascular
sphingolipid biology in spontaneously hypertensive rats. PLoS One.
6:e292222011. View Article : Google Scholar
|
|
11
|
Sul D, Kim H, Oh E, Phark S, et al: Gene
expression profiling in lung tissues from rats exposed to
formaldehyde. Arch Toxicol. 81:589–597. 2007. View Article : Google Scholar : PubMed/NCBI
|
|
12
|
Touyz RM and Schiffrin EL: Reactive oxygen
species in vascular biology: implications in hypertension.
Histochem Cell Biol. 122:339–352. 2004. View Article : Google Scholar : PubMed/NCBI
|
|
13
|
Ruef J, Hu ZY, Yin LY, Wu Y, et al:
Induction of vascular endothelial growth factor in balloon-injured
baboon arteries. Circ Res. 81:24–33. 1997. View Article : Google Scholar : PubMed/NCBI
|
|
14
|
Chua CC, Hamdy RC and Chua BH:
Upregulation of vascular endothelial growth factor by
H2O2 in rat heart endothelial cells. Free
Radic Biol Med. 25:891–897. 1998. View Article : Google Scholar : PubMed/NCBI
|
|
15
|
Cohuet G and Struijker-Boudier H:
Mechanisms of target organ damage caused by hypertension:
therapeutic potential. Pharmacol Ther. 111:81–98. 2006. View Article : Google Scholar : PubMed/NCBI
|
|
16
|
Mancia G, De Backer G, Dominiczak A,
Cifkova R, et al: 2007 guidelines for the management of arterial
hypertension: the Task Force for the Management of Arterial
Hypertension of the European Society of Hypertension (ESH) and of
the European Society of Cardiology (ESC). Eur Heart J.
28:1462–1536. 2007.
|
|
17
|
Lugo-Baruqui A, Muñoz-Valle JF,
Arévalo-Gallegos S, et al: Role of angiotensin II in liver
fibrosis-induced portal hypertension and therapeutic implications.
Hepatol Res. 40:95–104. 2010. View Article : Google Scholar : PubMed/NCBI
|
|
18
|
Okuda T, Sumiya T, Mizutani K, et al:
Analyses of differential gene expression in genetic hypertensive
rats by microarray. Hypertens Res. 25:249–255. 2002. View Article : Google Scholar : PubMed/NCBI
|
|
19
|
Yono M, Yoshida M, Yamamoto Y, et al:
Identification of potential therapeutic targets in
hypertension-associated bladder dysfunction. BJU Int. 105:877–883.
2009. View Article : Google Scholar : PubMed/NCBI
|
|
20
|
Liu J, Sukhova GK, Sun JS, Xu WH, et al:
Lysosomal cysteine proteases in atherosclerosis. Arterioscler
Thromb Vasc Biol. 24:1359–1366. 2004. View Article : Google Scholar : PubMed/NCBI
|
|
21
|
Sevenich L, Schurigt U, Sachse K, Gajda M,
et al: Synergistic antitumor effects of combined cathepsin B and
cathepsin Z deficiencies on breast cancer progression and
metastasis in mice. Proc Natl Acad Sci USA. 107:2497–2502. 2010.
View Article : Google Scholar : PubMed/NCBI
|
|
22
|
Chapman HA, Riese RJ and Shi GP: Emerging
roles for cysteine proteases in human biology. Annu Rev Physiol.
59:63–88. 1997. View Article : Google Scholar : PubMed/NCBI
|
|
23
|
Nägler DK, Storer AC, Portaro FC, Carmona
E, et al: Major increase in endopeptidase activity of human
cathepsin B upon removal of occluding loop contacts. Biochemistry.
36:12608–12615. 1997.PubMed/NCBI
|
|
24
|
Krueger S, Kalinski T, Hundertmark T, Wex
T, et al: Upregulation of cathepsin X in Helicobacter pylori
gastritis and gastric cancer. J Pathol. 207:32–42. 2005. View Article : Google Scholar : PubMed/NCBI
|
|
25
|
Wang J, Chen L, Li Y and Guan XY:
Overexpression of cathepsin Z contributes to tumor metastasis by
inducing epithelial-mesenchymal transition in hepatocellular
carcinoma. PLoS One. 6:e249672001. View Article : Google Scholar : PubMed/NCBI
|
|
26
|
Castle A and Castle D: Ubiquitously
expressed secretory carrier membrane proteins (SCAMPs) 1–4 mark
different pathways and exhibit limited constitutive trafficking to
and from the cell surface. J Cell Sci. 118:3769–3780. 2005.
|
|
27
|
Fernández-Chacón R and Südhof TC: Novel
SCAMPs lacking NPF repeats: ubiquitous and synaptic
vesicle-specific forms implicate SCAMPs in multiple
membrane-trafficking functions. J Neurosci. 20:7941–7950.
2000.PubMed/NCBI
|
|
28
|
Fernández-Chacón R, Achiriloaie M, Janz R,
et al: SCAMP1 function in endocytosis. J Biol Chem.
275:12752–12756. 2000.
|
|
29
|
Guo Z, Liu L, Cafiso D and Castle D:
Perturbation of a very late step of regulated exocytosis by a
secretory carrier membrane protein (SCAMP2)-derived peptide. J Biol
Chem. 277:35357–35363. 2002. View Article : Google Scholar : PubMed/NCBI
|
|
30
|
Liao H, Ellena J, Liu L, Szabo G, et al:
Secretory carrier membrane protein SCAMP2 and phosphatidylinositol
4,5-bisphosphate interactions in the regulation of dense core
vesicle exocytosis. Biochemistry. 46:10909–10920. 2007. View Article : Google Scholar : PubMed/NCBI
|
|
31
|
Müller HK, Wiborg O and Haase J:
Subcellular redistribution of the serotonin transporter by
secretory carrier membrane protein 2. J Biol Chem. 281:28901–28909.
2006.PubMed/NCBI
|
|
32
|
MacLean MR, Deuchar GA, Hicks MN, et al:
Overexpression of the 5-hydroxytryptamine transporter gene: effect
on pulmonary hemodynamics and hypoxia-induced pulmonary
hypertension. Circulation. 109:2150–2155. 2004. View Article : Google Scholar : PubMed/NCBI
|
|
33
|
Sainz-Perez A, Gary-Gouy H, Gaudin F, et
al: IL-24 induces apoptosis of chronic lymphocytic leukemia B cells
engaged into the cell cycle through dephosphorylation of STAT3 and
stabilization of p53 expression. J Immunol. 181:6051–6060. 2008.
View Article : Google Scholar : PubMed/NCBI
|
|
34
|
Lebedeva IV, Emdad L, Su ZZ, Gupta P, et
al: mda-7/IL-24, novel anticancer cytokine: Focus on bystander
antitumor, radiosensitization and antiangiogenic properties and
overview of the phase I clinical experience (Review). Int J Oncol.
31:985–1007. 2007.
|
|
35
|
Chen J, Chada S, Mhashilkar A and Miano
JM: Tumor suppressor MDA-7/IL-24 selectively inhibits vascular
smooth muscle cell growth and migration. Mol Ther. 8:220–229. 2003.
View Article : Google Scholar : PubMed/NCBI
|
|
36
|
Ross JS, Stagliano NE, Donovan MJ,
Breitbart RE, et al: Atherosclerosis: a cancer of the blood
vessels? Am J Clin Pathol. 116(Suppl): S97–S107. 2001.PubMed/NCBI
|
|
37
|
Rao GN and Berk BC: Active oxygen species
stimulate vascular smooth muscle cell growth and proto-oncogene
expression. Circ Res. 70:593–599. 1992. View Article : Google Scholar : PubMed/NCBI
|
|
38
|
Li WG, Miller FJ Jr, Zhang HJ, Spitz DR,
et al: Active oxygen species stimulate vascular smooth muscle cell
growth and proto-oncogene expression. J Biol Chem. 276:29251–29256.
2001.
|