Introduction
Metabolic diseases, such as diabetes, hypertension,
high cholesterol levels and coronary heart disease, have become
increasingly prevalent (1,2).
Therefore, finding a reasonable method of reducing the risk of
developing metabolic disease has become a global concern. Insulin
resistance, defined as the diminished ability of insulin-sensitive
tissues to respond to insulin, plays a central role in the
development of metabolic diseases. Insulin resistance is caused by
the decreased ability of peripheral target tissues, including
liver, muscle and fat, to respond properly to normal circulating
concentrations of insulin (3,4).
Studies have shown that the prolonged lack of exercise and a
high-fat diet are the main causes of insulin resistance, whereas
regular exercise, moderate weight loss, as well as a low-fat and
low-calorie diet can improve insulin sensitivity (5–7).
High energy intake from a high-fat diet may result
in fat deposition in the liver and skeletal muscle (8). A large number of epidemiological
data have demonstrated that the incidence of insulin resistance and
type 2 diabetes in individuals consuming a high-fat diet for a
prolonged period of time is significantly higher than that in the
‘normal’ population (9,10). Animal experiments have also
confirmed that fat deposition can damage the insulin-sensitive
organs, such as skeletal muscle and the liver (11). Recent studies have suggested that
lipid accumulation in skeletal muscle and the liver correlates
closely with insulin resistance (12,13).
The liver and skeletal muscles are the main organs
of the body where glucose and lipid uptake and utilization occur;
they are also the most important sites for energy metabolism based
on the role of insulin. Increased fatty acid intake and/or
decreased lipid oxidative capacity are the main causes of lipid
accumulation in the liver and skeletal muscle (14–16).
Exercise can rapidly increase energy consumption,
promote aerobic oxidation in vivo, and increase the activity
of lipoprotein lipase and β oxidation of fatty acid, thus reducing
fat deposition (16). Decreased
fat accumulation in the liver and skeletal muscle may increase the
insulin receptor (INSR) binding activity to insulin on the cell
membrane, and improve insulin resistance (15). Swimming is a popular sport, and
may be beneficial in the prevention and treatment of metabolic
diseases.
In the present study, a rat model of insulin
resistance was established by feeding rats a high-fat diet, and the
effects of swimming on fat deposition and insulin resistance were
observed. The ultrastructural changes in liver tissue were also
observed. Furthermore, fat metabolism, energy metabolism and the
expression of genes related to the insulin signaling pathway were
detected in the liver and muscle tissue in order to explore the
effects of swimming on high-fat diet-induced insulin
resistance.
Materials and methods
Animals and groups
Male Sprague-Dawley (SD) rats weighing approximately
200–220 g were housed in wire-bottom cages to prevent coprophagia.
The environment was controlled in terms of light (12:12-h
light-dark cycle commencing at 6:00 a.m.), humidity and room
temperature (20–23°C). Apart from pre-test overnight fasting and
the immediate post-operative period, the animals were allowed free
access to water and chow. The normal rodent chow diet was obtained
from the Hebei Medical University Animal Laboratory (Hebei, China)
and contained 10.3% fat, 24.2% protein and 65.5% carbohydrate
(kcal). The high-fat diet consisted of 59.8% fat, 20.1% protein and
20.1% carbohydrate (kcal). The animal experiments were conducted
according to protocols reviewed and approved by the Animal
Experimental Ethics Committee of Hebei General Hospital,
Shijiazhuang, China (approval ID: HBGH-2012005).
Seven days after their arrival, the rats were
randomly divided into 4 groups (n=10 per group): i) the normal
control group (Con) group fed the control (normal) diet for 8
weeks, ii) the high-fat (HF) group fed the high-fat-diet for 8
weeks, iii) the swimming treatment (ST) group fed the high-fat-diet
for 8 weeks and trained with swimming sports from the end of the
4th week and iv) the swimming prevention (SP) group fed the
high-fat-diet and trained with swimming exercise from the beginning
of the epxeriment. Body weight, food and water intake, fasting
glucose, insulin lipids and insulin sensitivity were measured at
the end of the 4th and the 8th week; the rats were then sacrificed,
and the liver and skeleton muscle tissue samples were taken
immediately and kept at −80°C after being quick-frozen in liquid
nitrogen.
Swimming
Swimming was performed in a 100×50×50 cm aquarium,
containing clean tap water to a depth of approximately 2/3. Water
temperature was maintained at 30±2°C. The animals in the Con group
were placed into the water, but were taken out immediately without
any swimming exercise. The animals in the other groups swam for 10
min daily in the initial 2 days, and then their swimming time was
gradually increased to 45 min daily. All rats swam 5 days/week (2
days of rest). Rats in the SP group swam for 8 weeks, while the ST
rats swam from the 5th to the 8th week.
Biochemistry assay
Blood samples were obtained from the abdominal
aorta. Blood glucose (BG) levels were measured using an Accu-chek
Active Meter (ACCU-CHEK® Active; Roche Diagnostics GmbH,
Mannheim, Germany) and insulin levels were analyzed using a Rat
Insulin ELISA kit (Crystal Chem Inc., Downers Grove, IL, USA).
Total cholesterol (TC)and triglyceride (TG) levels were measured on
an automatic biochemistry analyzer (Beckman X20; Beckman Coulter,
Brea, CA, USA).
Lee index
The body weight and length of the rats from nose to
anus were measured on the 4th and 8th week, and the Lee index was
calculated using the following formula: [3√weight g)/length (cm)]
×1,000.
Oil Red O staining
Frozen sections of liver tissues were used for Oil
Red O staining of lipid deposits. The selected specimens were
thin-sectioned, viewed and photographed under an electron
microscope (Hitachi H7500; Hitachi Ltd., Tokyo, Japan).
Hyperinsulinemic euglycemic clamp
The insulin sensitivity of the rats was measured
using a hyperinsulinemic euglycemic clamp as previously described
(11). The rats were put under
general anesthesia (3% pelltobarbitalum natricum; 60 mg/kg,
intraperitoneally), then catheters were inserted into the right
jugular vein and carotid arteries of the rats; the catheters were
subcutaneously exteriorized from the back of the neck. The
catheters were flushed with isotonic saline containing heparin (50
U/ml). The rats were allowed to recover for 3 days.
Hyperinsulinemic euglycemic clamps were used on fasted, awake and
unrestrained animals. Insulin (4 mU/kg/min) was infused through the
jugular vein catheter for 0 to 90 min. A variable rate infusion of
30% glucose was used. BG levels were monitored using a glucometer
(ACCU-CHEK® Active; Roche Diagnostics GmbH) and the
glucose infusion rate (GIR) was adjusted every 5 min as required.
Stable GIRs were obtained within approximately 60 min of the
insulin infusion and maintained thereafter.
Electron microscopy
Tissue samples were cut into small sections (1×1×2
mm) and fixed in 2.5% glutaraldehyde, post-fixed in 1% osmium
tetroxide, dehydrated and then the orientated longitudinal sections
were embedded in Epon. The initial low-power screening of semi-thin
(300 nm) sections stained with Toluidine blue was then carried out
to optimize the plane of sectioning, then ultra-thin (60 nm)
longitudinal sections of each sample were cut. The sections were
mounted on copper grids and then stained with lead citrate and
uranyl acetate. Each sample was examined using a transmission
electron microscope (TEM; Hitachi H-7500; Hitachi Ltd.) at an
accelerating voltage of 80 kV.
Quantitative RT-PCR
Total RNA of all samples was extracted using a
standard TRIzol (Invitrogen Life Technologies, Carlsbad, CA, USA)
RNA isolation method. Reverse transcription was carried out
according to the instructions of the Easy Script First-Strand cDNA
Synthesis Super Mix kit (TransGen Biotech Co., Ltd., Beijing,
China). Quantitative PCR was performed on an ABI-7300 PCR System
(Applied Biosystems, Foster City, CA, USA) using the SYBR-Green I
GoTaq® qPCR Master Mix (Promega, Madison, WI, USA) kit.
PCR was performed as follows: 1 cycle at 95°C for 5 min, followed
by 40 cycles at 95°C for 15 sec, 58°C for 20 sec and 72°C for 30
sec. The primer sequences for PCR are presented in Table I. The gene expression of each
sample was analyzed in duplicate and normalized against the
internal control gene, GAPDH. The results were expressed as
relative gene expression as 2−ΔΔCt values. The relative
expression of the target genes was obtained using the software SDS
v1.3.2 provided with the PCR machine.
 | Table IPrimer sequences for PCR. |
Table I
Primer sequences for PCR.
| Gene | Size (bp) | Forward
(5′→3′) | Reverse
(5′→3′) | GenBank no. |
|---|
| GLUT4 | 62 |
CCCACAAGGCACCCTCACTA |
TGCCACCCACAGAGAAGATG | NM_012751 |
| AMPKα2 | 133 |
ACAGAAGCCAAATCAGGGACT |
CACGGATGAGGTAAGAGAGACT | NM_019142 |
| PPARα | 71 |
GGACTTGAATGACCAGGTTACC |
AGGAGGACAGCATCGTGAAG | NM_013196 |
| PPARγ | 68 |
ACCAGGGAGTTCCTCAAAAGC |
GCAAACTCAAACTTAGGCTCCATAA | NM_013124 |
| CPT1B | 87 |
CCAGGCAAAGAGACAGACTTG |
GCCAAACCTTGAAGAAGCGA | NM_013200 |
| CPT1A | 132 |
TTATCGTGGTGGTGGGTGT |
CGCTCACAATGTTCTTCGTCT | NM_031559 |
| PGC1α | 168 |
AGCCACTACAGACACCGCAC |
CCTTTCAGACTCCCGCTTC | NM_031347 |
| PGC1β | 72 |
GATTCCGAGTTCTTCCAGATTG |
GTCATCCAGGGTCTTGGTAAG | NM_176075 |
| MFN2 | 160 |
AGCGTCCTCTCCCTCTGACA |
TTCCACACCACTCCTCCGAC | NM_130894 |
| INSR | 135 |
TTTGCCCAACCATCTGTAAG |
GACCATCCAGGTAGAAGTTTCG | NM_017071 |
| IRS1 | 95 |
AAGGAGGTCTGGCAGGTTATC |
ATGGTCTTGCTGGTCAGGC | NM_012969 |
| PI3K/p85 | 135 |
GCCTGCTCTGTAGTGGTAGATG |
GGAGGTGTGTTGGTAATGTAGC | NM_013005 |
| AKT2 | 79 |
CTGAGATGATGGAGGTAGCG |
CCGAGGAGTTTGAGATAATCG | NM_017093 |
| FAT | 71 |
GTTCAGAAACCAAGTGACCG |
CTCCAACACCAAGTAAGACCAT | NM_031561 |
| FABP1 | 78 |
TCAAAGGCATAAAGTCCGTG |
TGTAGACGATGTCACCCAGTG | NM_012556 |
| FABP3 | 91 |
AAGGTCAAGTCGGTCGTGA |
TTAGTTCCCGTGTAAGCGTAGT | NM_024162 |
| GAPDH | 120 |
TGAACGGGAAGCTCACTGG |
GCTTCACCACCTTCTTGATGTC | NM_017008 |
Western blot analysis
Western blot analysis was performed as previously
described (17). In brief, the
tissues were treated with lysis buffer [1% Triton X-100, 150 mM
NaCl, 10 mM Tris-HCl (pH 7.4); 1 mM EDTA, 1 mM EGTA (pH 8.0); 0.2
mM phenylmethylsulfonyl fluoride, 0.2 mM
Na3VO4 and 0.5% NP-40]. Equal amounts of
protein from each sample were separated by 10% SDS-PAGE and
electrotransferred onto PVDF membranes (Millipore, Bedford, MA,
USA). The PVDF membranes were blocked with 5% BSA for 2 h at room
temperature, and were subsequently incubated with the appropriate
diluted primary antibodies to glucose transporter (GLUT)4,
AMP-activated protein kinase (AMPK)α2, peroxisome
proliferator-activated receptor (PPAR)α, PPARγ, carnitine
palmitoyltransferase (CPT)1B, CPT1A, peroxisome proliferator
activated receptor γ co-activator (PGC)1α, PGC1β, mitofusin (MFN)2,
INSR, insulin receptor substrates (IRS)1, fatty acid translocase
(FAT), fatty acid binding protein (FABP)1, FABP3, β-actin (all from
Santa Cruz Biotechnology, Inc., Santa Cruz, CA, USA),
phosphatidylinositol-3-kinase (PI3K), p-PI3K/p85, protein kinase B
(AKT) or p-AKT2 (all from Cell Signaling Technology, Inc.,
Billerica, MA, USA) overnight at 4°C.. All the membranes were then
incubated with the relevant secondary antibodies for 2 h at room
temperature. Bands were detected with the enhanced
chemiluminescence (ECL) detection system. β-actin served as an
internal control protein.
Statistical analysis
Data are represented as the means ± SD. Statistical
analyses were performed using the SPSS statistical package (SPSS
13.0 software). One-way ANOVA was used to determine statistically
significant differences between all groups. A value of P<0.05
was considered to indicate a statistically significant
difference.
Results
General changes in rats at the 4th
week
As shown in Table
II, at the 4th week, no obvious changes were observed in the
body weight, the TC levels or the Lee index of the rats in any of
the groups (P>0.05). However, the fasting blood glucose (FBG),
fasting serum insulin (FINS) and TG levels of the HF rats
increased, while the GIR markedly decreased in the HF rats compared
with the Con group (P<0.05). Furthermore, the FINS and TG levels
of the rats in the SP group rats markedly decreased compared with
those of the rats in the HF group (P<0.05). In particular, the
TG levels in muscle tissue markedly increased in the HF rats
compared with the Con group, but markedly decreased in the ST and
SP group rats (P<0.05).
| Table IIGeneral changes in rats at the end of
the 4th week. |
Table II
General changes in rats at the end of
the 4th week.
| Factor | Con | HF | ST | SP |
|---|
| BW (g) | 264.3±7.2 | 276.4±10.5 | 276.4±10.5 | 267.1±6.4 |
| FBG
(mmol/l−1) | 3.51±0.25 | 3.93±0.27a | 3.93±0.27 | 3.64±0.27 |
| FINS
(mU/l−1) | 21.66±2.86 | 26.17±2.56a | 26.17±2.56 | 22.78±2.53b |
| Blood TG
(mmol/l−1) | 0.72±0.14 | 1.03±0.22a | 1.03±0.22 | 0.75±0.24b |
| Muscle TG
(μmol/g) | 1.87±0.22 | 4.68±0.67a | 2.94±0.24b | 2.64±0.44b |
| TC
(mmol/l−1) | 0.86±0.04 | 1.04±0.17 | 1.04±0.17 | 0.91±0.16 |
| Lee index | 301.18±5.52 | 311.20±4.69 | 311.20±4.69 | 303.40±4.56 |
| GIR
(mg/kg−1·min−1) | 11.42±1.29 | 9.15±1.24a | 9.15±1.24 | 10.93±1.33 |
General changes in rats at the 8th
week
As shown in Table
III, at the 8th week, no obvious changes were
observed in the TC levels in any of the groups (P>0.05).
However, the BG, FBG, FINS, TG and muscle TG levels, as well as the
Lee index grade of the HF rats markedly increased compared with the
rats in the Con group (P<0.05). Moreover, all of these
indicators decreased in the SP group rats in comparison with the HF
group rats (P<0.05). Most importantly, the GIR in the HF group
rats markedly decreased when compared with that in the rats from
the Con group (P<0.05); however, it returned to normal in the SP
group (P<0.05). Nevertheless, there were no significant
differences between the ST and the HF group as regards the
above-mentioned indicators (P>0.05).
| Table IIIGeneral changes in rats at the end of
the 8th week. |
Table III
General changes in rats at the end of
the 8th week.
| Factor | Con | HF | ST | SP |
|---|
| BW (g) | 285.4±8.5 | 305.8±11.7a | 292.6±9.8 | 289.3±7.9b |
| FBG
(mmol/l−1) | 3.62±0.26 | 4.52±0.24a | 4.04±0.32 | 3.71±0.22b |
| FINS
(mU/l−1) | 22.27±2.41 | 32.33±4.98a | 25.57±4.19 | 23.90±2.92b |
| Blood TG
(mmol/l−1) | 0.76±0.10 | 1.16±0.22a | 0.93±0.11 | 0.81±0.20b |
| Muscle TG
(μmol/g) | 2.30±0.28 | 6.50±0.94a | 4.18±0.63b | 3.61±0.44b |
| TC
(mmol/l−1) | 0.87±0.09 | 1.10±0.19 | 0.95±0.13 | 0.95±0.13 |
| Lee Index | 304.67±5.04 | 320.71±5.05a | 309.48±5.33 | 306.02±8.19b |
| GIR
(mg/kg−1·min−1) | 10.95±1.73 | 8.19±1.77a | 9.43±1.51 | 10.32±1.58b |
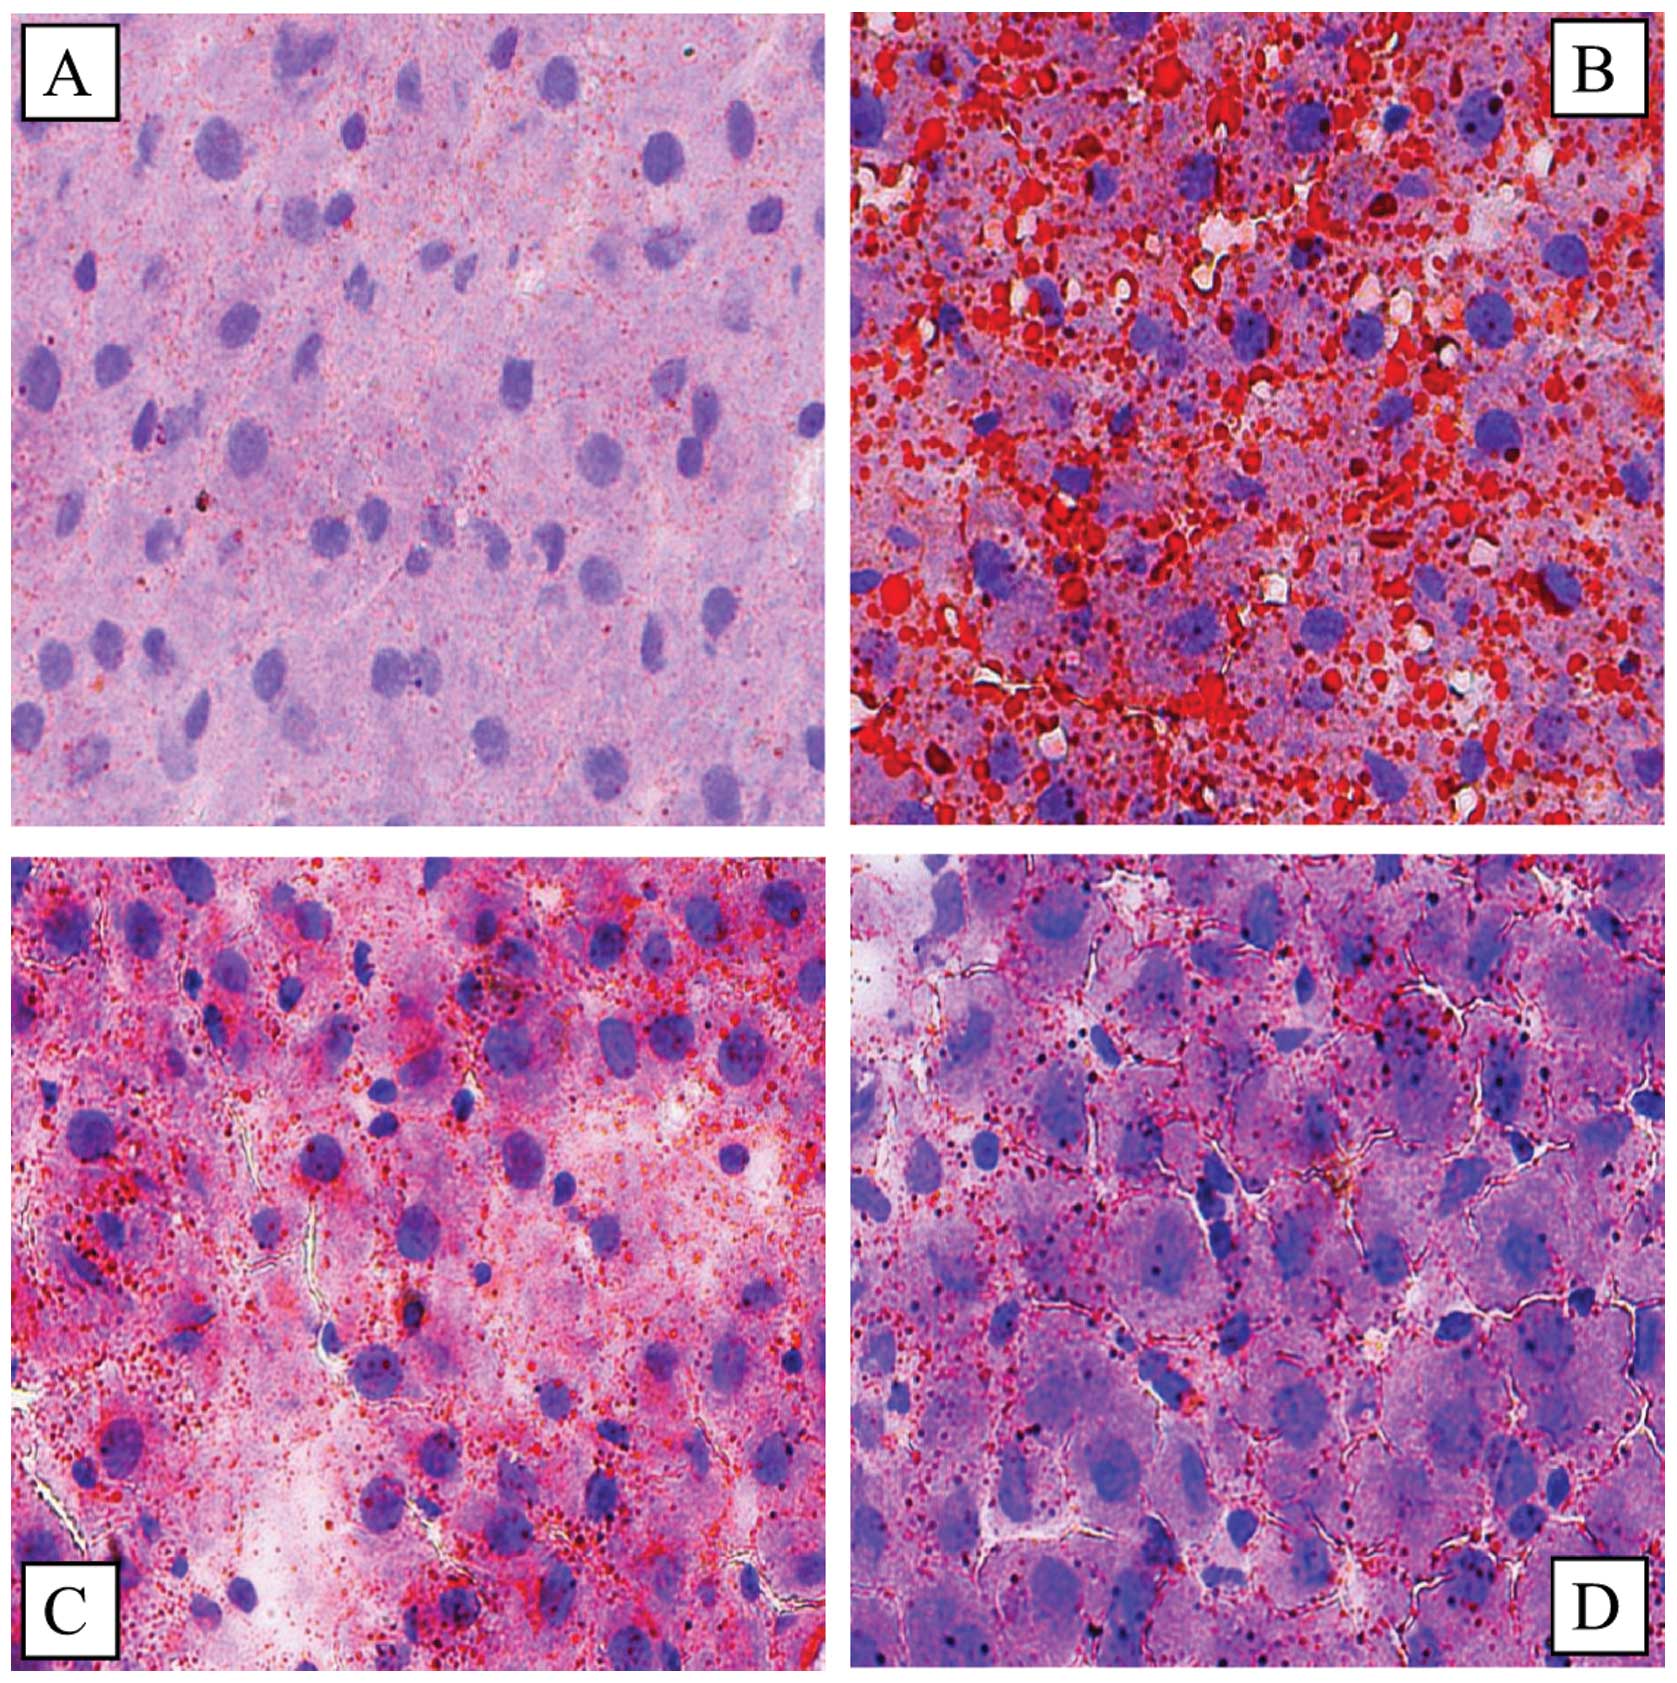
Swimming reduces lipid accumulation in
the liver and improves ultrastructural damage to liver cells
The results of Oil Red O staining of the liver
tissue indicated that there was a significant lipid deposition in
the HF group rats; by contrast, in the ST and SP groups, lipid
deposition was markedly reduced (Fig.
1).
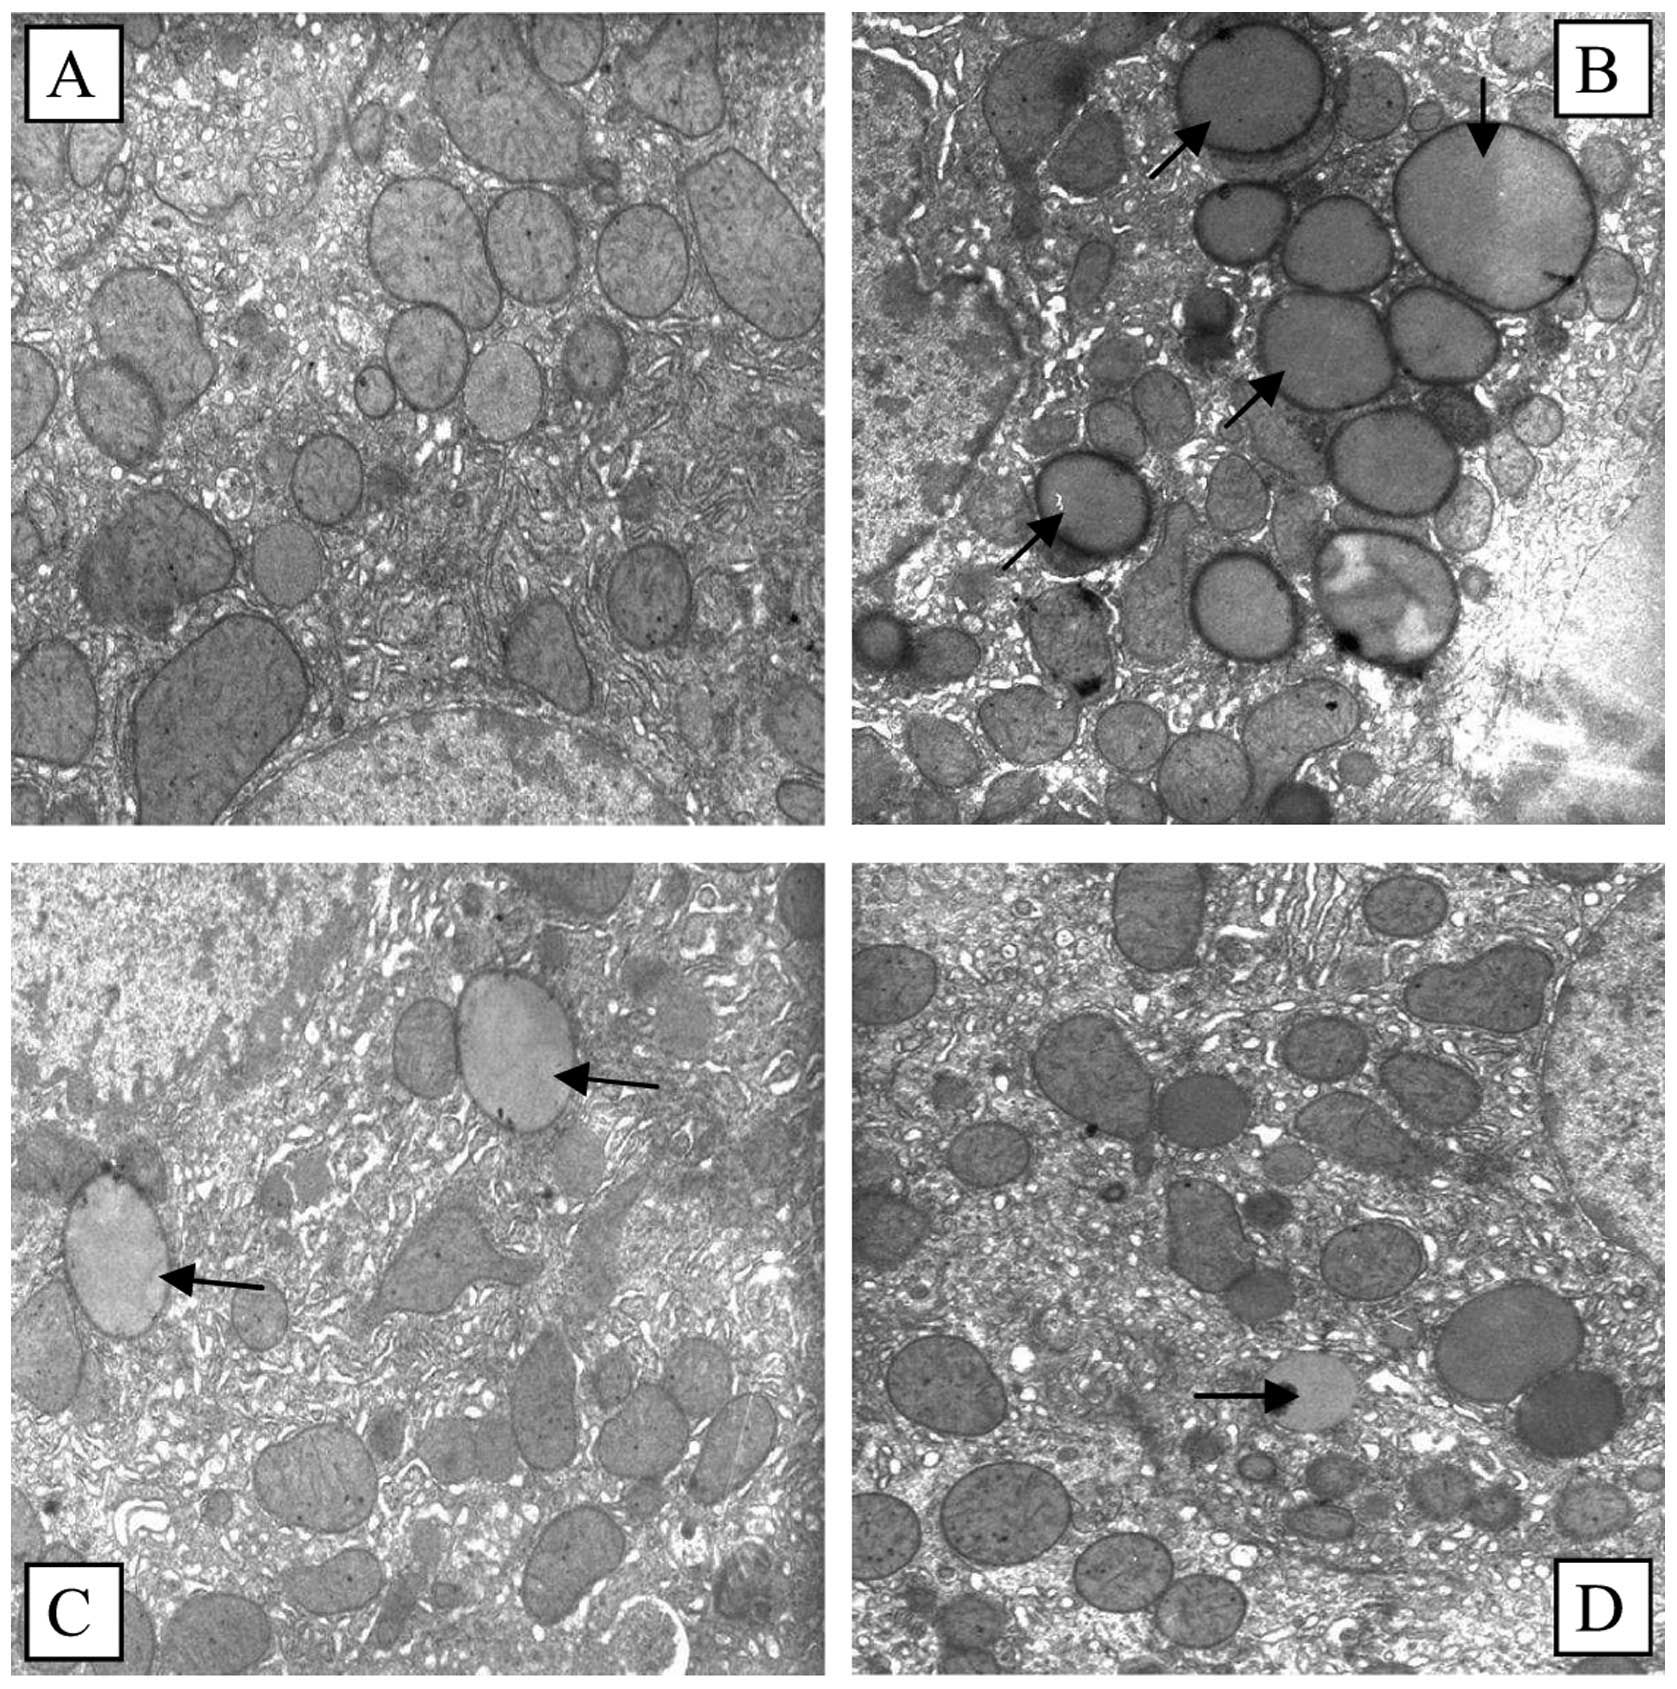
As can be seen in Fig.
2, a substantial amount of lipid droplets were deposited in the
HF group liver cells, the number of mitochondria and other
organelles was markedly reduced, and the ultrastructure of the
cells was extensively damaged. Although the amount of lipid
droplets was reduced in the SP and ST groups, the number of
mitochondria and other organelles markedly increased and
ultrastructural damage to the cells was markedly decreased in
comparison with the HF group.
Swimming regulates fat metabolism-related
gene expression in liver and skeletal muscle
In order to elucidate the effects of a high-fat diet
and swimming on fat metabolism-related gene expression, the
expression of 4 factors, FAT, CPT1, FABP and PPAR, was detected by
quantitative RT-PCR and western blot analysis in the liver and
skeletal muscle of the rats. The results revealed that the mRNA and
protein expression of FAT and FABP1 was upregulated, while PPARγ
and CPT1α expression was downregulated in the liver of HF rats
compared with the Con group. Following swimming, the expressoin of
these 4 factors was upregulated in the ST and SP groups compared
with the HF group (Fig. 3).
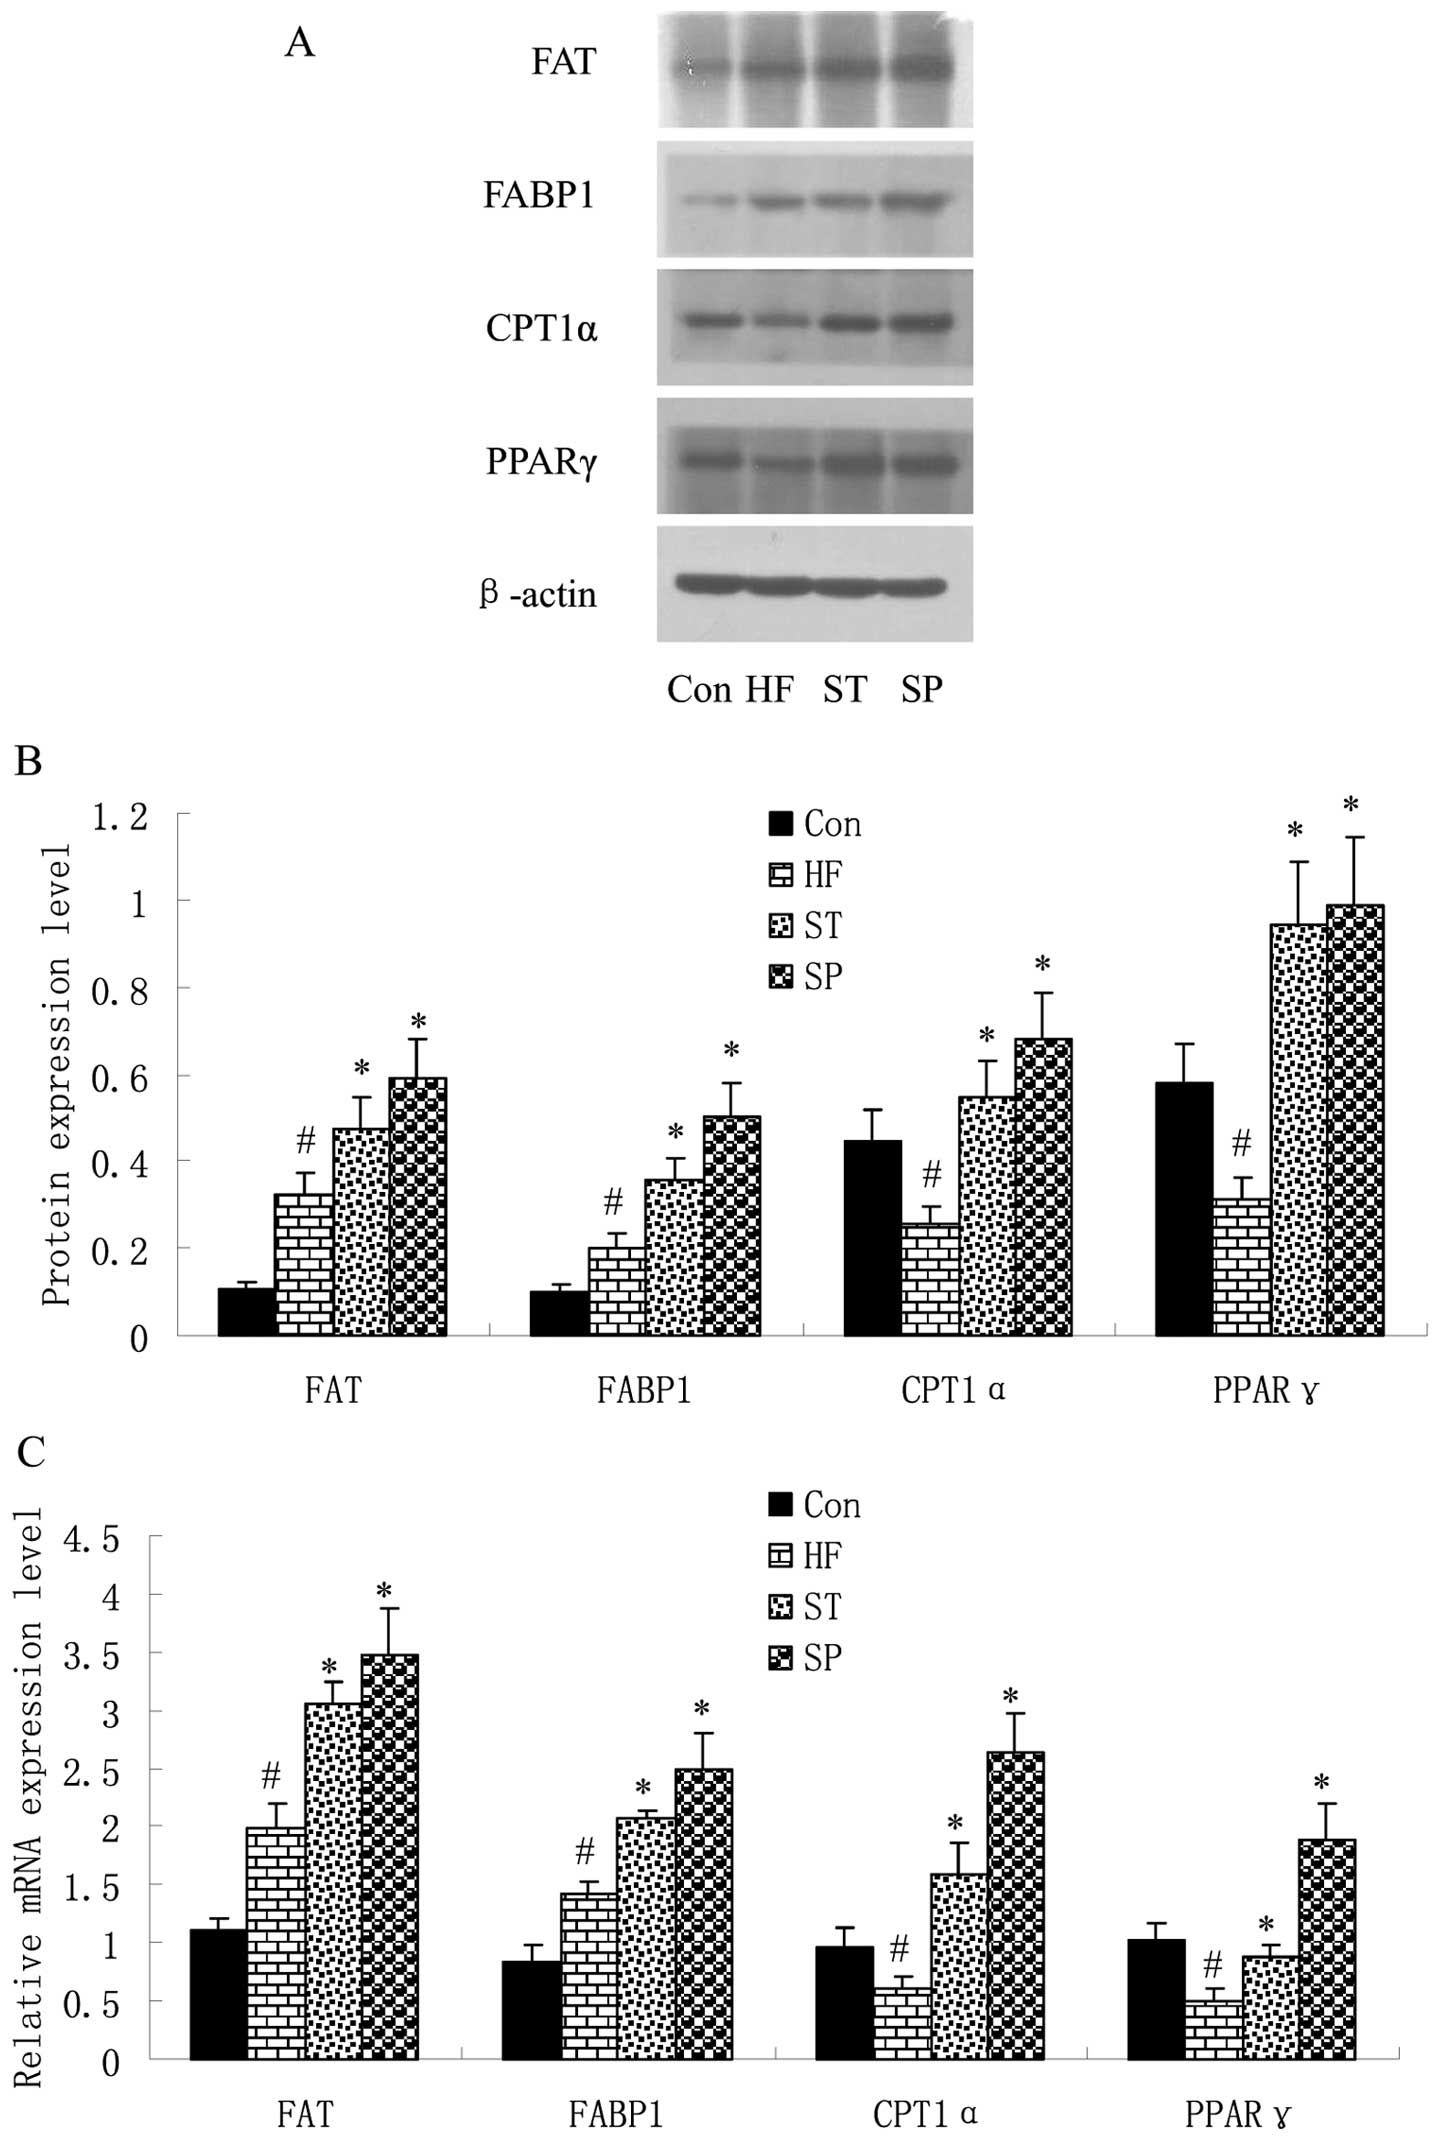 | Figure 3Swimming regulates fat
metabolism-related gene expression in liver. Rats were fed a
control or high-fat diet for 8 weeks, and trained with swimming
exercise for 4 or 8 weeks, and were then sacrificed. Liver tissues
of rats were removed immediately to determine the mRNA and protein
expression levels of fat metabolism-related genes by (A) western
blot analysis and (C) quantitative RT-PCR. The band density of
western blots representing the target gene protein expression level
is shown in (B). Experiments were repeated 3 times (n=3).
#P<0.05 vs. Con group; *P<0.05 vs. HF
group. Con, control group; HF, group fed high-fat diet; ST,
treatment group fed high-fat diet and trained with swimming from
week 4; SP, prevention group fed high-fat diet and trained with
swimming from the start of the experiment. FAT, fatty acid
translocase; FABP, fatty acid-binding protein; CPT1, carnitine
palmitoyltransferase 1; PPAR, peroxisome proliferator-activated
receptor. |
Similar results were observed in the skeletal muscle
of rats. As shown in Fig. 4, FAT
and FABP3 expression was upregulated, while PPARα and CPT1β
expression was downregulated in the skeletal muscle of rats in the
HF group in comparison with the Con group. Following swinmming, the
expression of these 4 factors was upregulated in the ST and SP
groups compared with the HF group.
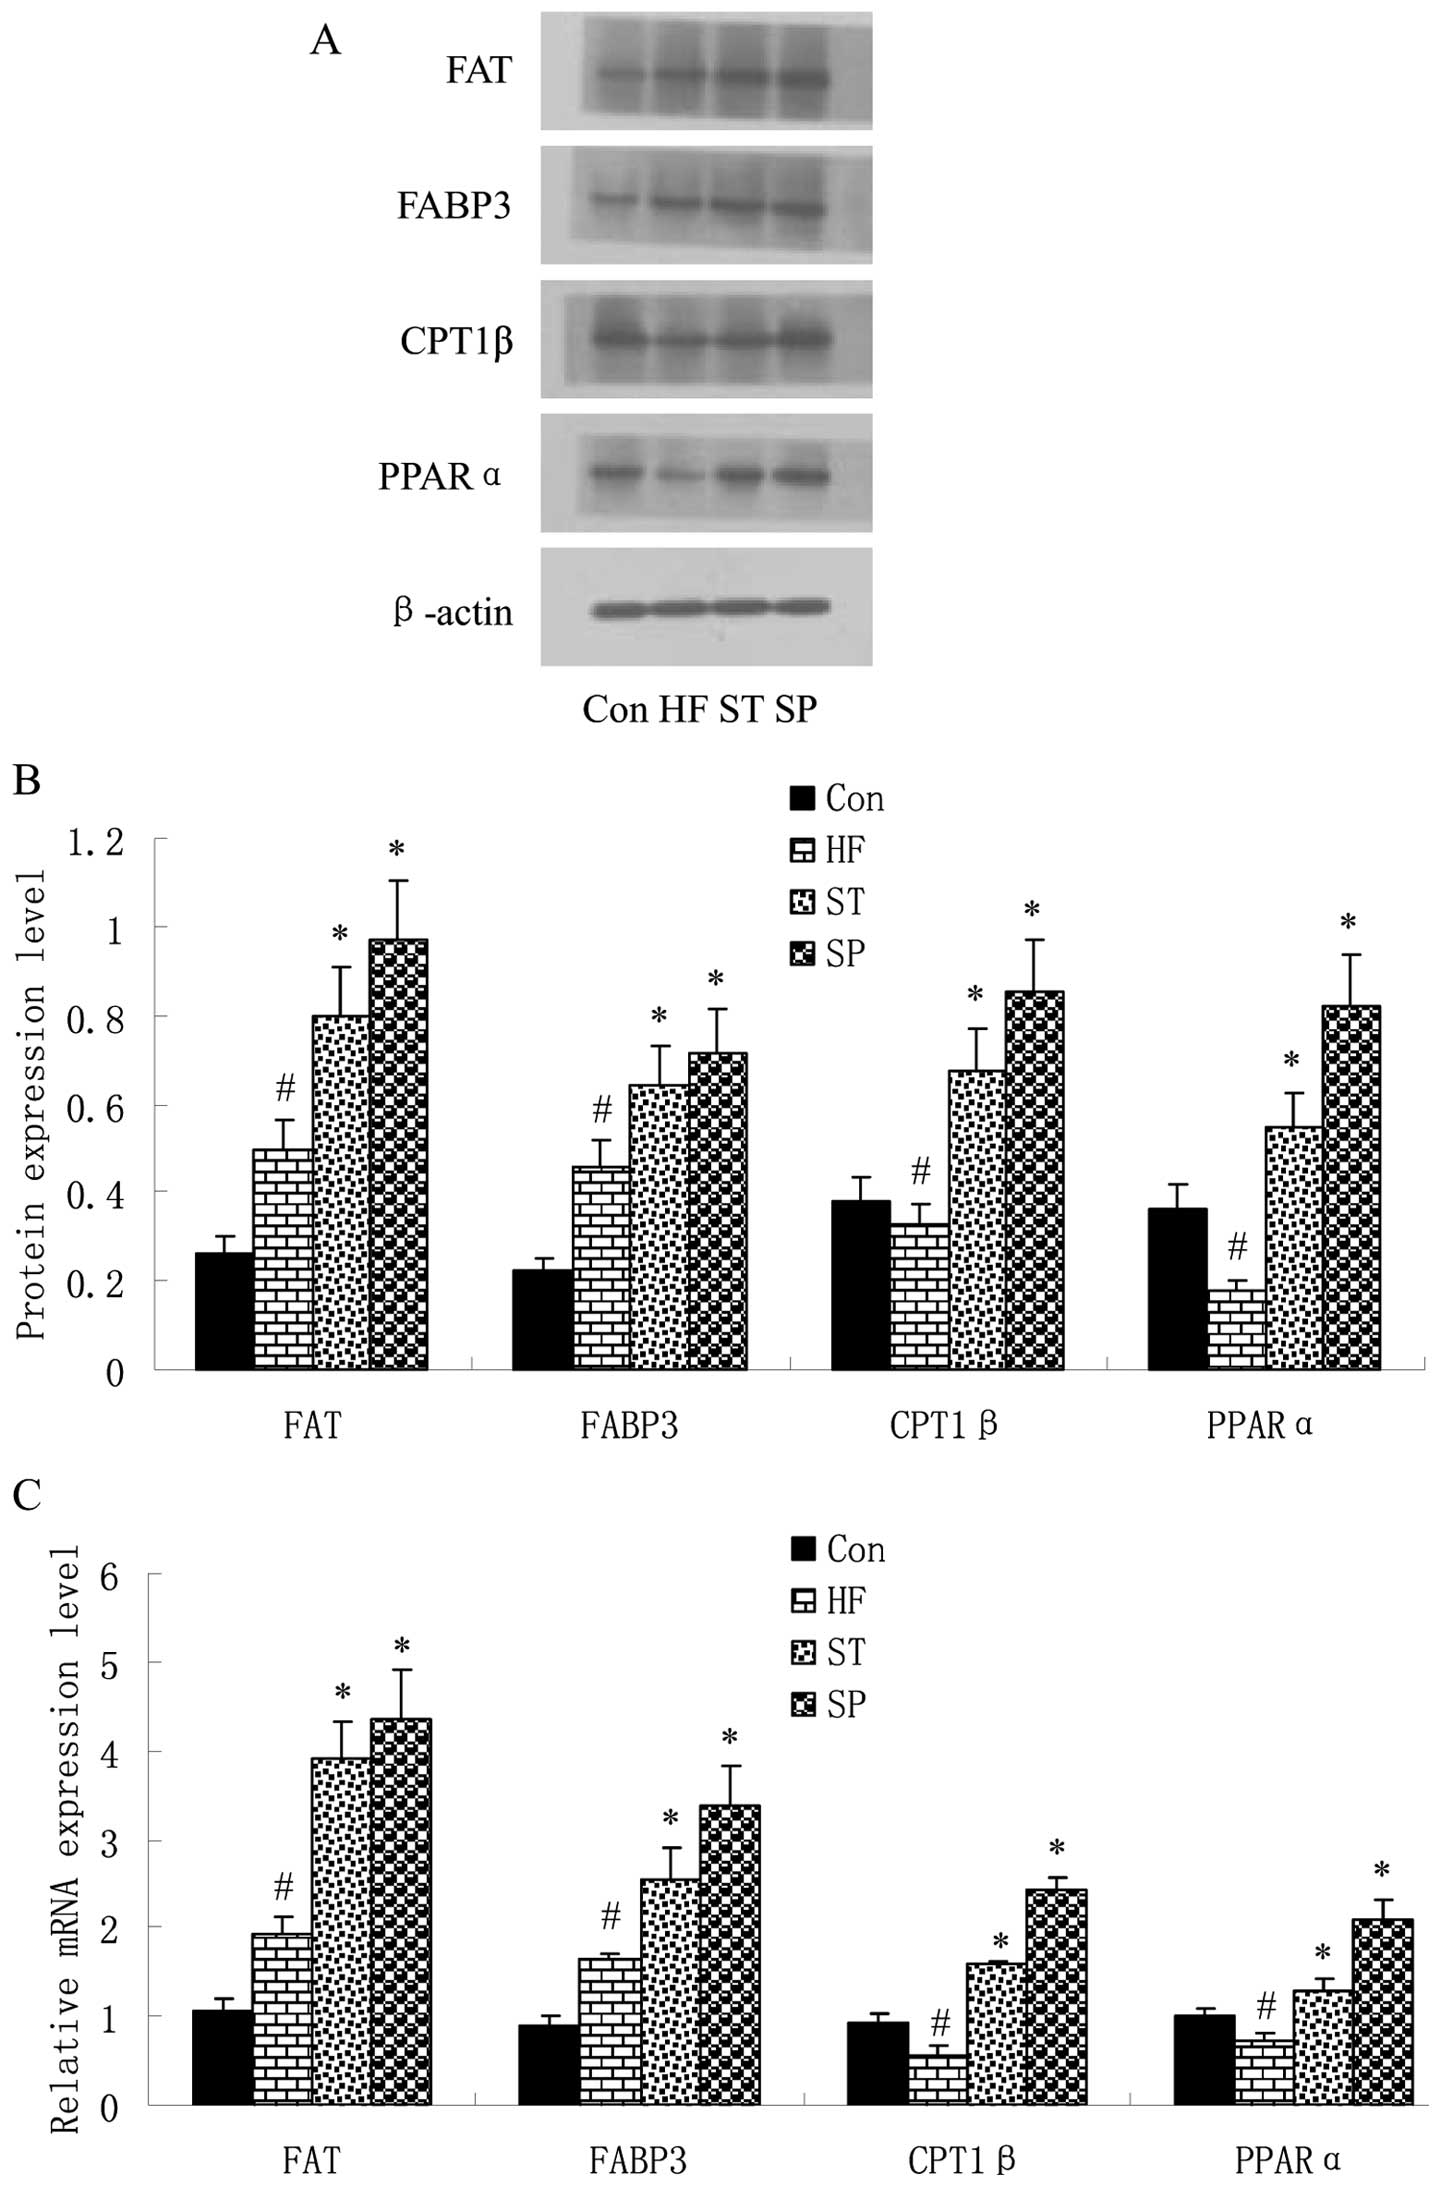 | Figure 4Swimming regulates fat
metabolism-related gene expression in skeletal muscle. Rats were
fed a control or high-fat diet for 8 weeks, and some were trained
with swimming for 4 or 8 weeks, and were then sacrificed. Skeletal
muscle of rats was taken immediately and subjected to (A) western
blot analysis and (C) quantitative RT-PCR to determine the mRNA and
protein expression levels of fat metabolism-related genes. The band
density of western blots representing the target gene protein
expression level is shown in (B). Experiments were repeated 3 times
(n=3). #P<0.05 vs. Con group; *P<0.05
vs. HF group. Con, control group; HF, group fed high-fat diet; ST,
treatment group fed high-fat diet and trained with swimming from
week 4; SP, prevention group fed high-fat diet and trained with
swimming from the start of the experiment. FAT, fatty acid
translocase; FABP, fatty acid-binding protein; CPT1, carnitine
palmitoyltransferase 1; PPAR, peroxisome proliferator-activated
receptor. |
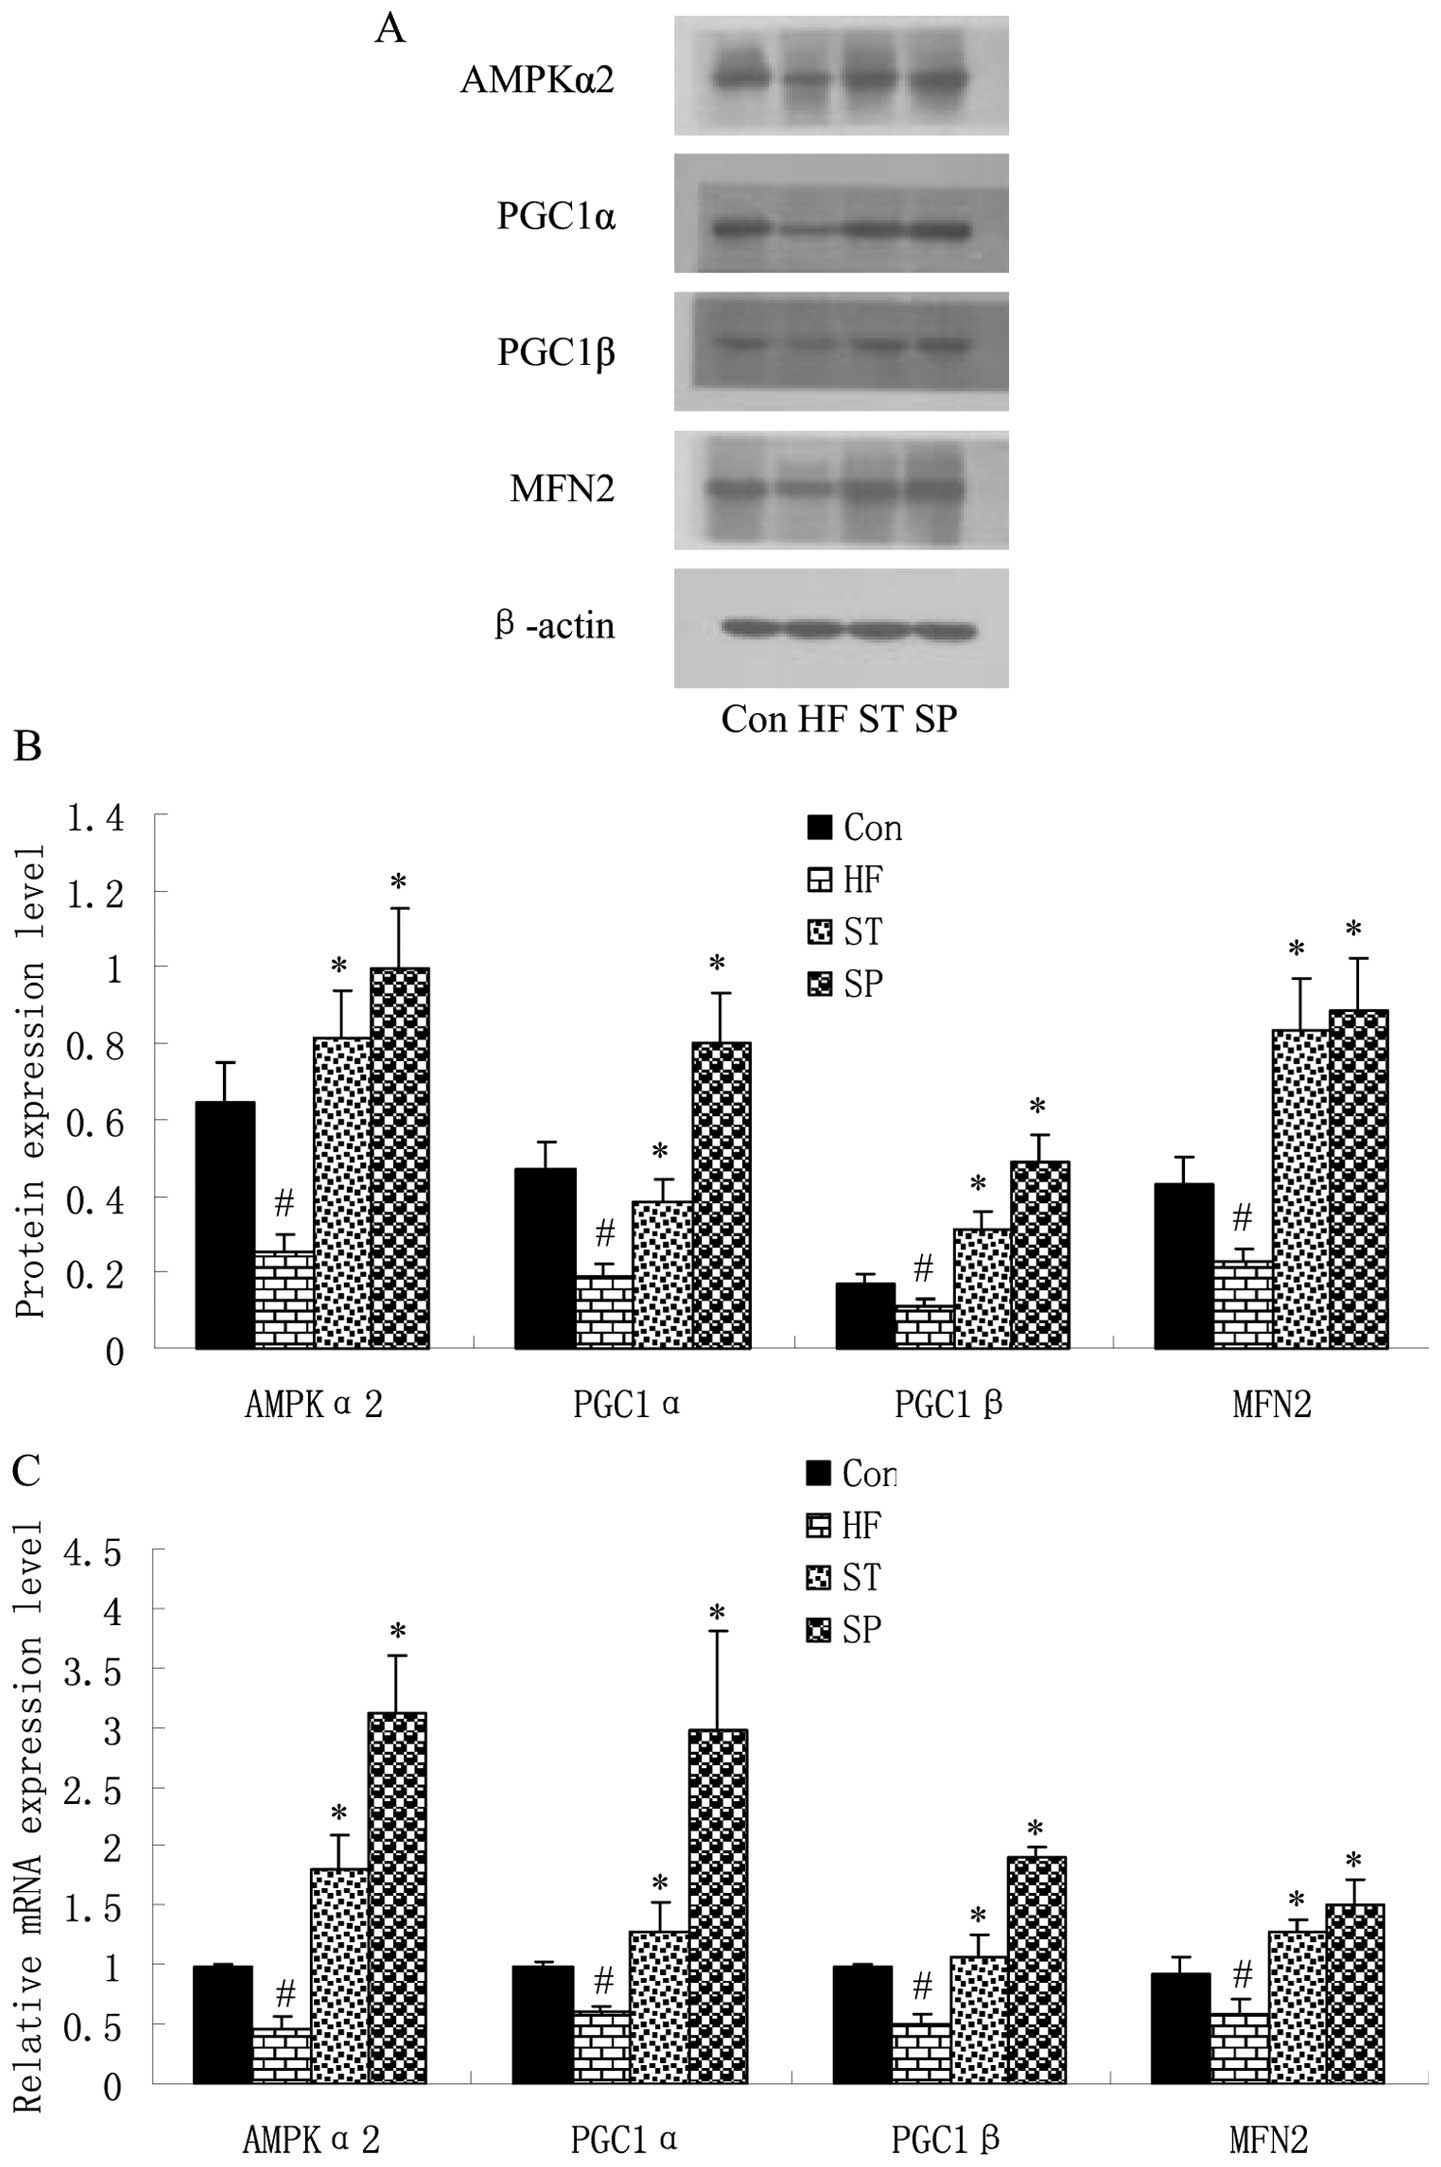
Swimming upregulates energy
metabolism-related gene expression in skeletal muscle
In order to elucidate the effects of a high-fat
diet, as well as swimming on the expression of energy
metabolism-related genes, the AMPKα2, PGC1α, PGC1β and MFN2 levels
were detected by quantitative RT-PCR and western blot analysis in
the skeletal muscle of the rats. The results revealed that the
expression of these 4 factors was downregulated in the skeletal
muscle of the HF group rats compared with the Con group rats;
following swimming, in the ST and SP groups, the expression of
these 4 factors was markedly upregulated compared with the HF group
(Fig. 5).
Swimming improves insulin signaling in
skeletal muscle
The role of insulin-stimulated glucose utilization
relies on the insulin signaling pathway, as this determines the
level of insulin resistance in skeletal muscle. Therefore, the
expression levels of insulin pathway-related factors, INSR, IRS1,
PI3K/p85, AKT2 and GLUT4 in the skeletal muscle of the rats were
determined by quantitative RT-PCR and western blot analysis.
As shown in Fig.
6, the mRNA and protein expression levels of INSR, IRS1,
PI3K/p85, AKT2 and GLUT4 were lower in the skeletal muscle of the
HF rats compared with those in the Con group rats. The
phosphorylation levels of INSR and IRS1 were also decreased in the
skeletal muscle of HF rats compared with those in the Con group
rats. Although there were no marked changes in the protein levels
of PI3K/p85 and AKT2, their phosphorylation levels were
significantly lower in HF rats compared with the Con group rats.
Most importantly, the expression and phosphorylation levels of
these genes in the skeletal muscle of the ST and SP group rats were
much higher compared with those in the HF group rats.
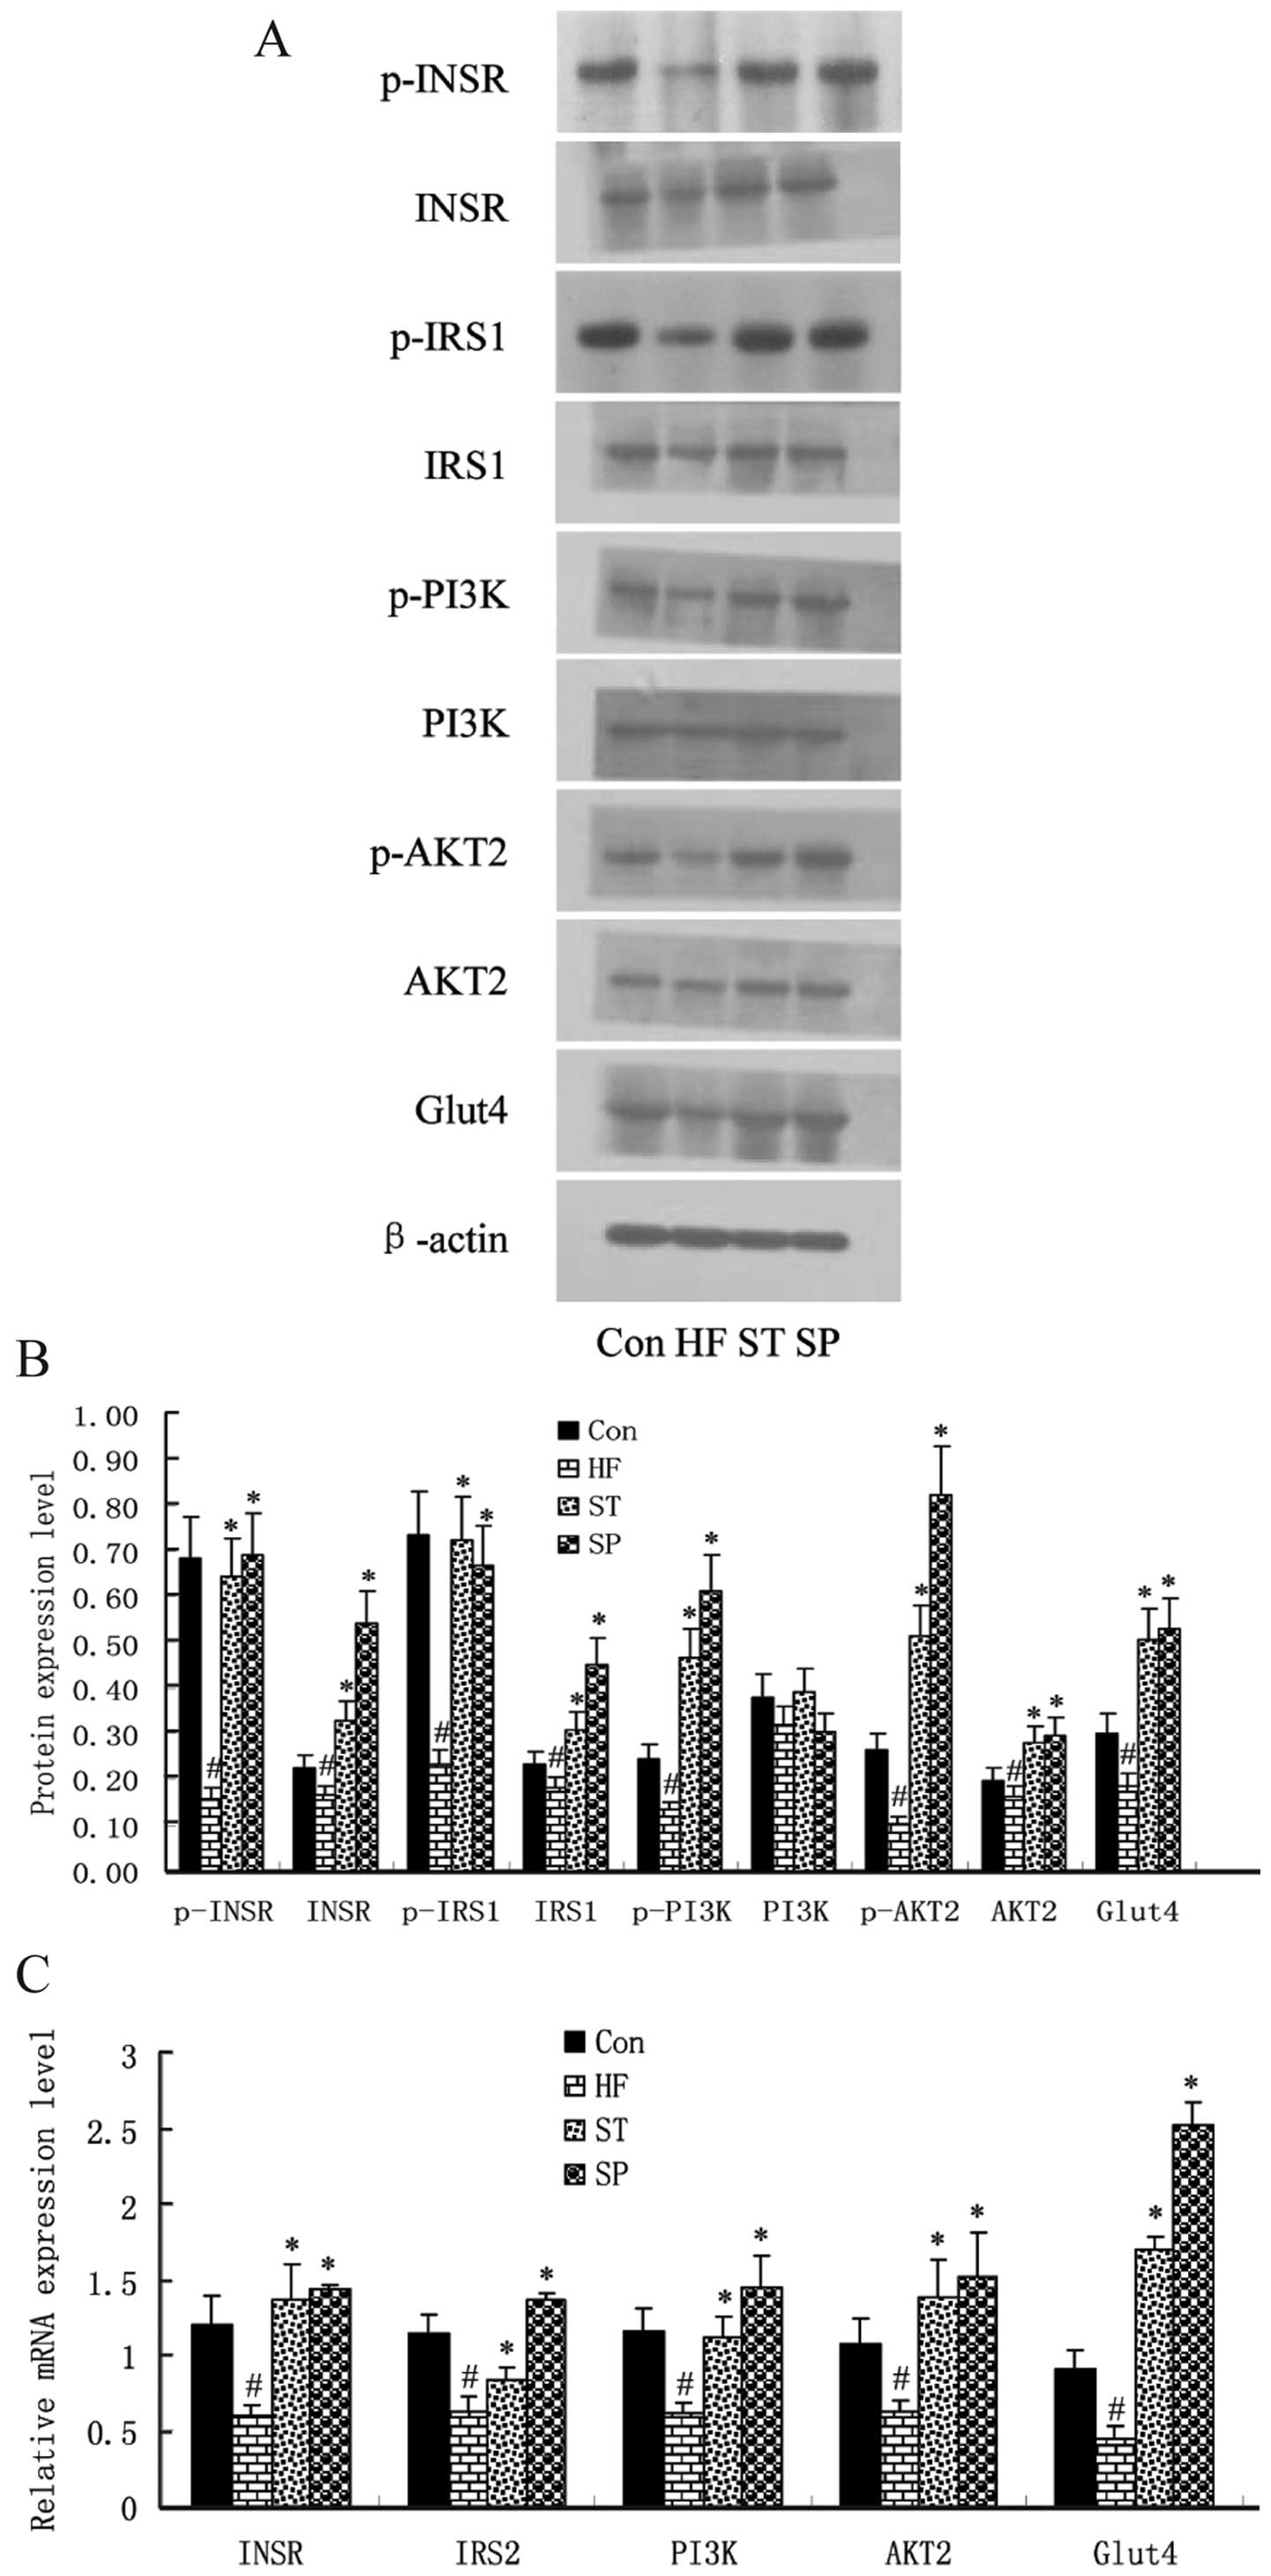 | Figure 6Swimming improves insulin signaling
in skeletal muscle. Rats were fed a control or high-fat diet for 8
weeks, and some were trained with swimming for 4 or 8 weeks, and
were then were. Skeletal muscle of rats was taken immediately and
subjected to (A) western blot analysis and (C) quantitative RT-PCR
to determine the mRNA and protein expression levels of insulin
pathway-related genes. The band density of western blots
representing the target gene protein expression level is shown in
(B). Experiments were repeated 3 times (n=3). #P<0.05
vs. Con group; *P<0.05 vs. HF group. Con group;
*P<0.05 vs. HF group. Con, control group; HF, group
fed high-fat diet; ST, treatment group fed high-fat diet and
trained with swimming from week 4; SP, prevention group fed
high-fat diet and trained with swimming from the start of the
experiment. INSR, insulin receptor; IRS1, insulin receptor
substrate 1; PI3K, phosphatidylinositol-3-kinas; GLUT4, glucose
transporter 4. |
Discussion
Studies have shown that a high-fat diet,
particularly one rich in saturated fatty acids, causes fat to be
easily deposited due to its interference with the oxidation and
lipolysis process (9,10). Studies employing magnetic
resonance spectroscopy found that skeletal muscle lipid is
associated with insulin resistance (18,19). In healthy individuals without a
family history of diabetes, insulin sensitivity experiments have
shown that insulin-stimulated glucose uptake is decreased in
individuals with a higher skeletal muscle lipid content (20). Fat deposition may damage the cell
membrane function, resulting in a lipid metabolism disorder,
leading to insulin resistance through the inhibition of glucose
transport and oxidation (3,4).
Insulin resistance, defined as the diminished ability of
insulin-sensitive tissues, including liver, muscle and fat to
respond to insulin, plays a central role in the development of type
2 diabetes mellitus (T2DM) and other metabolic diseases, such as
obesity and metabolic syndrome (2). Insulin resistance is the primary
predisposing factor for metabolic syndrome; it therefore becomes
imperative to take effective measures in order to regulate lipid
metabolism and prevent insulin resistance.
Our study, using rats, found that a high-fat diet
leads to weight gain, liver fat deposition, ultrastructural damage
to cells and a significant increase in the FBG, FINS, TG and TC
levels in blood, thus causing severe insulin resistance.
Importantly, our results revealed that swimming significantly
improved the effects induced by a high-fat diet, and that swimming,
as a preventive measure, produced a more effective result. Another
study found that a long-term negative energy balance generated by
exercise training significantly reduced plasma insulin levels,
whereas insulin sensitivity was improved (21). There are also reports that
endurance training can improve high-fat diet-induced insulin
resistance by increasing the insulin receptor binding activities of
the liver and muscle cells (22).
The lipid content in skeletal muscle and liver is
determined by the dynamic equilibrium between the uptake and
disposal of fatty acids (23).
FAT binds long-chain fatty acids and may function in the transport
and/or as a regulator of fatty acid transport (24). After entering into cells, fatty
acids are converted into TGs or are channeled towards the
β-oxidaton pathway. The entry of fatty acyl-CoA into the
mitochondria is the rate-limiting step for mitochondrial fatty acid
oxidation, but long-chain fatty acyl-CoA (LCACoA) cannot permeate
the mitochondrial membrane directly. Acyl-CoA first reacts with
carnitine by the catalysis of CPT-1, and then enters the
mitochondrial matrix (25). FABP
is essential for fatty acid transport and PPAR plays a key role in
fatty acid metabolism in the liver and skeletal muscle (26–29). Thus, some abnormal steps involved
in fatty acid metabolism may contribute to fat accumulation in
skeletal muscle and the liver. Our study suggests that a high-fat
diet leads to increased levels of FAT and FABP, and decreased
levels of PPAR and CPT1; furthermore, swimming upregulates the
expressoin of these factors, as it is helpful for lipid cleaning
from tissues.
Skeletal muscle, the largest movement system, is an
important organ for energy metabolism. Studies have shown that AMPK
is a phylogenetically-conserved intracellular energy sensor
(30,31). AMPK can also regulate malonyl CoA
levels by inhibitting acetyl-coenzyme A carboxylase (ACC) and
activating malonyl CoA decarboxylase (MCD) in muscle, and has been
implicated in the regulation of energy metabolism (32). MFN2, a mitochondrial fusion
protein, is involved in mitochondrial morphology and metabolism
regulation (33–35). The transcription factors, PGC-1α
and β, are considered master metabolic regulators and promoters of
mitochondrial biogenesis (36,37). Specifically, the activation of
AMPK signaling cascades are well-characterized upstream modulators
of PGC-1α gene expression in skeletal muscle (38–40). Therefore, the abnormal expression
or activity of these signaling molecules may contribute to fat
accumulation and insulin resistance in skeletal muscle. The
regulation of the AMPK pathway may reduce ectopic lipid
accumulation, improving insulin resistance, and thereby mediating
beneficial effects in various diseases associated with insulin
resistance. The present study demonstrates that a high-fat diet
leads to a decrease in AMPK, PGC1α, PGC1β and MFN2 expression,
while swimming upregulates the expression of these genes in
skeletal muscle. The results suggest that swimming improves lipid
deposition and insulin resistance by regulating energy
metabolism.
Skeletal muscle tissue is the most important organ
where insulin-mediated glucose uptake occurs, as >90% of
insulin-mediated glucose uptake in the body is by skeletal muscles.
Therefore, the ability of skeletal muscle glucose utilization
determines the level of insulin resistance. The utilization of
glucose by skeletal muscle stimulated with insulin occurs through a
series of signaling processes of the INSR/IRS/PI3K/AKT/GLUT4
pathway (41,42). Finally, GLUT4 translocates to the
cell membrane and accelerates glucose uptake into the cell
(43). Abnormality in any steps
of the insulin signal transduction pathway may eventually impede
glucose transportation in skeletal muscle, thereby causing insulin
resistance. This study demonstrates that a high-fat diet inhibits
the expression of INSR, IRS1, PI3K/p85, AKT2 and GLUT4,
particularly the phosphorylation of PI3K/p85 and AKT2. Moreover,
swimming restores the levels of these factors in skeletal muscle,
as it improves insulin resistance by strengthening the insulin
signaling pathway.
In conclusion, swimming improve high-fat-induced
insulin resistance by reducing liver and muscle lipid accumulation
and by regulating energy metabolism and the insulin signaling
pathway in skeletal muscle.
Acknowledgements
The authors would like to thank Professor Guangyao
Song (Department of Endocrinology, General Hospital of Hebei,
Shijiazhuang, Hebei, P.R. China) for providing his advice. The
present study was supported by grants from the National Natural
Science Foundation of China (30971391, 81170742) and the Hebei
Natural Science Foundation of China (C2010001638, C2011307008).
References
|
1
|
Karpe F, Dickmann JR and Frayn KN: Fatty
acids, obesity, and insulin resistance: time for a reevaluation.
Diabetes. 60:2441–2449. 2011. View Article : Google Scholar
|
|
2
|
Wang ZL, Xia B, Shrestha U, et al:
Correlation between adiponectin polymorphisms and non-alcoholic
fatty liver disease with or without metabolic syndrome in Chinese
population. J Endocrinol Invest. 31:1086–1091. 2008. View Article : Google Scholar : PubMed/NCBI
|
|
3
|
Chow L, From A and Seaquist E: Skeletal
muscle insulin resistance: the interplay of local lipid excess and
mitochondrial dysfunction. Metabolism. 59:70–85. 2010. View Article : Google Scholar : PubMed/NCBI
|
|
4
|
Martins AR, Nachbar RT, Gorjao R, et al:
Mechanisms underlying skeletal muscle insulin resistance induced by
fatty acids: importance of the mitochondrial function. Lipids
Health Dis. 11:302012. View Article : Google Scholar : PubMed/NCBI
|
|
5
|
Song GY, Ren LP, Chen SC, et al: Similar
changes in muscle lipid metabolism are induced by chronic
high-fructose feeding and high-fat feeding in C57BL/J6 mice. Clin
Exp Pharmacol Physiol. 39:1011–1018. 2012. View Article : Google Scholar : PubMed/NCBI
|
|
6
|
Iellamo F, Caminiti G, Sposato B, et al:
Effect of high-intensity interval training versus moderate
continuous training on 24-h blood pressure profile and insulin
resistance in patients with chronic heart failure. Intern Emerg
Med. Jul 16–2013.(Epub ahead of print).
|
|
7
|
Chowdhury KK, Legare DJ and Lautt WW:
Interaction of antioxidants and exercise on insulin sensitivity in
healthy and prediabetic rats. Can J Physiol Pharmacol. 91:570–577.
2013. View Article : Google Scholar : PubMed/NCBI
|
|
8
|
Buettner R, Parhofer KG, Woenckhaus M, et
al: Defining high-fat-diet rat models: metabolic and molecular
effects of different fat types. J Mol Endocrinol. 36:485–501. 2006.
View Article : Google Scholar : PubMed/NCBI
|
|
9
|
Bray GA, Lovejoy JC, Smith SR, et al: The
influence of different fats and fatty acids on obesity, insulin
resistance and inflammation. J Nutr. 132:2488–2491. 2002.PubMed/NCBI
|
|
10
|
McGarry JD: Banting lecture 2001:
dysregulation of fatty acid metabolism in the etiology of type 2
diabetes. Diabetes. 51:7–18. 2002. View Article : Google Scholar : PubMed/NCBI
|
|
11
|
Gan KX, Wang C, Chen JH, Zhu CJ and Song
GY: Mitofusin-2 ameliorates high-fat diet-induced insulin
resistance in liver of rats. World J Gastroenterol. 19:1572–1581.
2013. View Article : Google Scholar : PubMed/NCBI
|
|
12
|
Song GY, Gao Y, Wang C, et al:
Rosiglitazone reduces fatty acid translocase and increases AMPK in
skeletal muscle in aged rats: a possible mechanism to prevent
high-fat-induced insulin resistance. Chin Med J (Engl).
123:2384–2391. 2010.PubMed/NCBI
|
|
13
|
Kong D, Song G, Wang C, et al:
Overexpression of mitofusin 2 improves translocation of glucose
transporter 4 in skeletal muscle of highfat dietfed rats through
AMP activated protein kinase signaling. Mol Med Rep. 8:205–210.
2013.PubMed/NCBI
|
|
14
|
Shulman GI: Cellular mechanisms of insulin
resistance. J Clin Invest. 106:171–176. 2000. View Article : Google Scholar : PubMed/NCBI
|
|
15
|
Liu L, Zhang Y, Chen N, Shi X, Tsang B and
Yu YH: Upregulation of myocellular DGAT1 augments triglyceride
synthesis in skeletal muscle and protects against fat-induced
insulin resistance. J Clin Invest. 117:1679–1689. 2007. View Article : Google Scholar : PubMed/NCBI
|
|
16
|
Schenk S and Horowitz JF: Acute exercise
increases triglyceride synthesis in skeletal muscle and prevents
fatty acid-induced insulin resistance. J Clin Invest.
117:1690–1698. 2007. View
Article : Google Scholar : PubMed/NCBI
|
|
17
|
Wang C, Han M, Zhao XM and Wen JK:
Kruppel-like factor 4 is required for the expression of vascular
smooth muscle cell differentiation marker genes induced by
all-trans retinoic acid. J Biochem. 144:313–321. 2008. View Article : Google Scholar : PubMed/NCBI
|
|
18
|
Goodpaster BH, Krishnaswami S, Resnick H,
et al: Association between regional adipose tissue distribution and
both type 2 diabetes and impaired glucose tolerance in elderly men
and women. Diabetes Care. 26:372–379. 2003. View Article : Google Scholar : PubMed/NCBI
|
|
19
|
Perseghin G, Scifo P, De Cobelli F, et al:
Intramyocellular triglyceride content is a determinant of in vivo
insulin resistance in humans: a 1H-13C nuclear magnetic resonance
spectroscopy assessment in offspring of type 2 diabetic parents.
Diabetes. 48:1600–1606. 1999. View Article : Google Scholar
|
|
20
|
Virkamaki A, Korsheninnikova E,
Seppala-Lindroos A, et al: Intramyocellular lipid is associated
with resistance to in vivo insulin actions on glucose uptake,
antilipolysis, and early insulin signaling pathways in human
skeletal muscle. Diabetes. 50:2337–2343. 2001. View Article : Google Scholar
|
|
21
|
Oppert JM, Nadeau A, Tremblay A, Despres
JP, Theriault G and Bouchard C: Negative energy balance with
exercise in identical twins: plasma glucose and insulin responses.
Am J Physiol. 272:E248–E254. 1997.PubMed/NCBI
|
|
22
|
Corcoran MP, Lamon-Fava S and Fielding RA:
Skeletal muscle lipid deposition and insulin resistance: effect of
dietary fatty acids and exercise. Am J Clin Nutr. 85:662–677.
2007.PubMed/NCBI
|
|
23
|
Samuel VT, Petersen KF and Shulman GI:
Lipid-induced insulin resistance: unravelling the mechanism.
Lancet. 375:2267–2277. 2010. View Article : Google Scholar : PubMed/NCBI
|
|
24
|
Campbell SE, Tandon NN, Woldegiorgis G,
Luiken JJ, Glatz JF and Bonen A: A novel function for fatty acid
translocase (FAT)/CD36: involvement in long chain fatty acid
transfer into the mitochondria. J Biol Chem. 279:36235–36241. 2004.
View Article : Google Scholar : PubMed/NCBI
|
|
25
|
Sebastian D, Herrero L, Serra D, Asins G
and Hegardt FG: CPT I overexpression protects L6E9 muscle cells
from fatty acid-induced insulin resistance. Am J Physiol Endocrinol
Metab. 292:E677–E686. 2007. View Article : Google Scholar : PubMed/NCBI
|
|
26
|
Smathers RL and Petersen DR: The human
fatty acid-binding protein family: evolutionary divergences and
functions. Hum Genomics. 5:170–191. 2011. View Article : Google Scholar : PubMed/NCBI
|
|
27
|
Storch J and Thumser AE: Tissue-specific
functions in the fatty acid-binding protein family. J Biol Chem.
285:32679–32683. 2010. View Article : Google Scholar : PubMed/NCBI
|
|
28
|
Kusudo T, Kontani Y, Kataoka N, Ando F,
Shimokata H and Yamashita H: Fatty acid-binding protein 3
stimulates glucose uptake by facilitating AS160 phosphorylation in
mouse muscle cells. Genes Cells. 16:681–691. 2011. View Article : Google Scholar : PubMed/NCBI
|
|
29
|
Ruderman NB, Carling D, Prentki M and
Cacicedo JM: AMPK, insulin resistance, and the metabolic syndrome.
J Clin Invest. 123:2764–2772. 2013. View
Article : Google Scholar : PubMed/NCBI
|
|
30
|
Cao S, Li B, Yi X, et al: Effects of
exercise on AMPK signaling and downstream components to PI3K in rat
with type 2 diabetes. PLoS One. 7:e517092012. View Article : Google Scholar : PubMed/NCBI
|
|
31
|
Velkov T: Interactions between human liver
fatty acid binding protein and peroxisome proliferator activated
receptor selective drugs. PPAR Res. 2013:9384012013. View Article : Google Scholar
|
|
32
|
Kramer DK, Al-Khalili L, Guigas B, Leng Y,
Garcia-Roves PM and Krook A: Role of AMP kinase and PPARdelta in
the regulation of lipid and glucose metabolism in human skeletal
muscle. J Biol Chem. 282:19313–19320. 2007. View Article : Google Scholar : PubMed/NCBI
|
|
33
|
Liesa M, Palacin M and Zorzano A:
Mitochondrial dynamics in mammalian health and disease. Physiol
Rev. 89:799–845. 2009. View Article : Google Scholar : PubMed/NCBI
|
|
34
|
Sebastian D, Hernandez-Alvarez MI, Segales
J, et al: Mitofusin 2 (Mfn2) links mitochondrial and endoplasmic
reticulum function with insulin signaling and is essential for
normal glucose homeostasis. Proc Natl Acad Sci USA. 109:5523–5528.
2012. View Article : Google Scholar : PubMed/NCBI
|
|
35
|
Zorzano A, Liesa M and Palacin M:
Mitochondrial dynamics as a bridge between mitochondrial
dysfunction and insulin resistance. Arch Physiol Biochem. 115:1–12.
2009. View Article : Google Scholar : PubMed/NCBI
|
|
36
|
Hernandez-Alvarez MI, Thabit H, Burns N,
et al: Subjects with early-onset type 2 diabetes show defective
activation of the skeletal muscle PGC-1{alpha}/Mitofusin-2
regulatory pathway in response to physical activity. Diabetes Care.
33:645–651. 2010.PubMed/NCBI
|
|
37
|
Zorzano A, Hernandez-Alvarez MI, Palacin M
and Mingrone G: Alterations in the mitochondrial regulatory
pathways constituted by the nuclear co-factors PGC-1alpha or
PGC-1beta and mitofusin 2 in skeletal muscle in type 2 diabetes.
Biochim Biophys Acta. 1797:1028–1033. 2010. View Article : Google Scholar : PubMed/NCBI
|
|
38
|
Akimoto T, Pohnert SC, Li P, et al:
Exercise stimulates Pgc-1alpha transcription in skeletal muscle
through activation of the p38 MAPK pathway. J Biol Chem.
280:19587–19593. 2005. View Article : Google Scholar : PubMed/NCBI
|
|
39
|
Wright DC, Geiger PC, Han DH, Jones TE and
Holloszy JO: Calcium induces increases in peroxisome
proliferator-activated receptor gamma coactivator-1alpha and
mitochondrial biogenesis by a pathway leading to p38
mitogen-activated protein kinase activation. J Biol Chem.
282:18793–18799. 2007. View Article : Google Scholar
|
|
40
|
Egan B, Carson BP, Garcia-Roves PM, et al:
Exercise intensity-dependent regulation of peroxisome
proliferator-activated receptor coactivator-1 mRNA abundance is
associated with differential activation of upstream signalling
kinases in human skeletal muscle. J Physiol. 588:1779–1790. 2010.
View Article : Google Scholar
|
|
41
|
Saltiel AR and Kahn CR: Insulin signalling
and the regulation of glucose and lipid metabolism. Nature.
414:799–806. 2001. View
Article : Google Scholar : PubMed/NCBI
|
|
42
|
Previs SF, Withers DJ, Ren JM, White MF
and Shulman GI: Contrasting effects of IRS-1 versus IRS-2 gene
disruption on carbohydrate and lipid metabolism in vivo. J Biol
Chem. 275:38990–38994. 2000. View Article : Google Scholar : PubMed/NCBI
|
|
43
|
Osorio-Fuentealba C, Contreras-Ferrat AE,
Altamirano F, et al: Electrical stimuli release ATP to increase
GLUT4 translocation and glucose uptake via PI3Kgamma-Akt-AS160 in
skeletal muscle cells. Diabetes. 62:1519–1526. 2013. View Article : Google Scholar : PubMed/NCBI
|