Introduction
It has been widely accepted that the key to
repairing neurodegenerative disorders, such as spinal cord injury
(SCI), is to inhibit inflammation and promote neuronal survival,
axonal regeneration and remyelination. In recent years, cell
transplantation and neuroprotective pharmaceuticals are the two
main strategies for the treatment of SCI. Various studies have
demonstrated that the transplantation of neuronal stem
cells/neuronal precursor cells (NSCs/NPCs) (1,2),
Schwann cells (SCs) (3,4), olfactory ensheathing cells (OECs)
(4,5) and bone marrow stromal cells (BMSCs)
(6) significantly improves the
outcome of SCI.
It has been demonstrated that SC transplantation
offers a certain degree of remyelination and functional
restoration, reduces tissue damage (5) and neuronal cell loss, promotes axon
regeneration (7) and
remyelination (8), and thus
enhances the functional outcome (5) of SCI. Although SC transplantation is
beneficial in models of experimental SCI, the low survival rate of
these cells post-transplantation limits their effectiveness. It has
been reported that only 20% of the grafted SCs survive (3,7,9).
The death of grafted SCs may be attributed to low oxygen levels,
oxidative metabolites, inflammatory cytokines and a cell-mediated
immune response (3,9), as well as to the withdrawal of
trophic/mitogenic factors when the cells are removed from their
pre-transplantation culture conditions (9).
Previous studies have confirmed that histone
deacetylase (HDAC) inhibitors, such as trichostatin A (TSA) and
valproic acid (VPA), have neuroprotective, neurotrophic and
anti-inflammatory properties. These inhibitors have been shwon to
not only improve neurological performance in animal models of
neurodegenerative disorders, such as traumatic brain injury
(10), stroke (11), amyotrophic lateral sclerosis
(12), spinal muscular atrophy
(13), and Huntington’s disease
(14), but also to play a
neuroprotective role in cellular models, including models of
oxidative stress-induced cortical neuronal death (15), glutamate-induced neuronal
excitotoxicity (16) and
lipopolysaccharide (LPS)-induced microglial and neuronal death
(17). In a recent study or ours,
we found that TSA increased neuronal differentiation and decreased
the astrocyte differentiation of NPCs. Morevover, we demonstrated
that TSA had no effect on the survival of NPCs (18). However, to the best of our
knowledge, there is no report available to date on the effects of
TSA on SCs. Thus, in the present study, we investigated the effects
of TSA on the survival, proliferation and migration of SCs, as well
as on the expression of neurotrophic factors genes and genes
associated with myelination in rat SCs in primary culture.
Materials and methods
Isolation and culture of SCs
The methods for SC isolation, purification and
amplification were developed by Morrissey et al (19) and described in previous studies
(22,23). Briefly, sciatic nerves were
obtained from adult Sprague-Dawley rats (200 g body weight; Central
Animal Laboratory, Nantong University, Nantong, China)
anaesthetized with ketamine (87.7 mg/kg; Ben Venue Laboratories,
Bedford, OH, USA) and xylazine (12.3 mg/kg; Butler, Columbus, OH,
USA) under aseptic conditions. After the epineurium (outermost
layer of connective tissue) was removed, the nerves were cut into 1
mm-long explants. The explants were placed in 35-mm tissue culture
dishes (Baxter Healthcare Corp., Stone Mountain, GA, USA) with low
levels (0.8 ml) of DMEM supplemented with 10% fetal bovine serum
(FBS; Invitrogen, Carlsbad, CA, USA), termed as D10. When the
outgrowth of migratory cells (predominantly fibroblasts) reached a
near-confluent monolayer around the explants (7 days), the explants
were transferred to new culture dishes containing fresh medium.
After 5–6 such passages (5–6 weeks), the cells that emerged from
the explants were primarily SCs. The explants were then transferred
to a 35-mm dish containing 1.25 U/ml dispase (Boehringer Roche
Mannheim Biochemicals, Indianapolis, IN, USA), 0.05% collagenase
(Worthington Biochemicals Corp., Lakewood, NJ, USA) and 15% FBS in
DMEM for incubation overnight at 37°C in 5% CO2. On the
following day, the explants were dissociated and the cells were
plated onto poly-L-lysine (PLL)-coated 100 mm dishes in DMEM/10%
FBS (D10). Subsequently, the cultures were re-fed with D10
supplemented with 20 μg/ml pituitary extract [Biomedical
Technologies, Inc. (BTI), Stoughton, MA, USA) and 2 μM forskolin
(Sigma, St. Louis, MO, USA), termed as D10/PF, for proliferation.
When the SCs reached confluence, they were rinsed in
Ca2+- and Mg2+-free Hank’s balanced salt
solution (CMF-HBSS) and briefly treated with 0.05% trypsin and
0.02% EDTA (all from Gibco, Langley, OK, USA) in CMF-HBSS. The
cells were washed twice in D10 and passed into new dishes at a
density of 2×10⁶ cells/100 mm dish. The purity of the
SCs (percentage of p75+ cells in all cells) was
quantified according to a previously described method (21). All the Cs used in this study were
passage 2 (P2) cells with a purity of >98%.
Cytotoxicity assay
The effect of TSA on SC survival was evaluated by
measuring lactate dehydrogenase (LDH) activity released in the
medium 24 h following exposure to TSA (0.1, 1, 10 and 100 ng/ml)
using the CytoTox96® non-radioactive assay (Promega
Corp., Southampton, UK) and quantified by measuring wavelength
absorbance at 490 nm. SCs were collected from culture and single
cells were seeded in PLL-coated 96-well plates (4.0×10⁴
cells/100 μl/well) and allowed to grow in D10/PF for 4 days.
Subsequently, D10/PF (100 μl) containing various concentrations of
TSA was added to the wells for a further 24 h. Finally, 50 μl of
supernatants were transferred to an enzymatic assay plate and
analyzed according to the manufacturer’s instructions. The results
are expressed as the means ± standard deviation (SD) of the
percentage of the absorbance in medium from cells grown in various
concentrations of TSA compared to the controls (untreated cells) in
6 independent experiments.
Analysis of cell proliferation
The analysis of SC proliferation was carried out by
counting the viable cell number using a Cell Counting kit-8 (CCK-8)
(Dojindo Laboratories, Kumamoto, Japan). This assay is based on the
conversion of watersoluble tetrazolium salt,
2-(2-methoxy-4-nitrophenyl)-3-(4-nitrophenyl)-5-(2,4-disulfophenyl)-2H-tetrazolium,
monosodium salt (WST-8) to a water-soluble formazan dye upon
reduction in the presence of an electron carrier by dehydrogenases.
Briefly, the SCs were dissociated in D10 and single cells were
transferred to 96-well plates (2.0×10⁴ cells/100
μl/well) allowing them to grow in D10/PF for 3 days. Subsequently,
100 μl of D10/PF containing various concentrations of TSA were
added to the wells for a further 24, 48 and 72 h. The CCK-8
solution (10 μl) was added to each well, and the plates were then
incubated at 37°C for 5 h. The absorbance at 450 nm was determined
using a multiplate reader (Bio-Rad Laboratories, Hercules, CA,
USA). Cell viability was expressed as a percentage of the
absorbance values in various concentrations of TSA at 3 time points
compared to that in various concentrations of TSA immediately
following exposure (control) in 3 independent experiments.
Cell migration assay
To evaluate the effects of TSA on SC migration, a
Transwell chamber analysis was performed as described in our
previous studies (18,22). SCs (4×10⁵/ml) in 250 μl
of D10/PF per well were seeded into the upper chamber and were
inserted into the tissue-culture wells containing different
concentrations of TSA (0.1 and 1 ng/ml) at a final volume of 750 μl
of medium per well. Following incubation for 8 h at 37°C, the
filters were stained with Coomassie Blue and DAPI; the number of
stained, migrated cells at the bottom surface of the filters was
counted at 5 fields per filter in 3 independent experiments.
Immunofluorescence
Coverslips with the SCs were rinsed with 0.01 M PBS
twice, fixed with 4% paraformaldehyde for 30 min, and then rinsed
with PBS for 10 min, 3 times at room temperature. The coverslips
were permeabilized and blocked with 0.3% Triton X-100/3% normal
goat serum in 0.01 M PBS for 30 min at 4°C. Mouse anti-rat S100
primary antibody was applied to the coverslips at 4°C overnight. On
the following day, the coverslips were incubated with
fluorescein-conjugated goat anti-mouse (FITC; 1:400; Chemicon
International, Inc., Temecula, CA, USA) antibody for 2 h at 37°C.
After several PBS rinses, the coverslips were mounted and examined
under a Zeiss fluorescence microscope (Carl Zeiss, Jena, Germany).
Primary anti-serum omission controls and goat serum controls were
used to further confirm the specificity of immunofluorescence
labeling.
Reverse transcription (RT)-PCR
The SCs were treated with TSA (0.1, 1, 10 ng/ml) or
without TSA for 48 h. The cells were washed 3 times with PBS and
used for isolating total cellular RNA using TRIzol reagent
(Invitrogen) according to the manufacturer’s instructions. The
quality and quantity of RNA were determined by 1.5% agarose gel
electrophoresis and spectrophotometric analysis, respectively.
Reverse transcription for complementary DNA (cDNA) synthesis was
performed with 2 μg total RNA using RevertAid™ First Strand cDNA
Synthesis kits (Fermentas, Inc., Hanover, MD, USA) with random
primers. RT-PCR was performed in total reaction volumes of 20 μl
using DreamTaq Green PCR Master Mix (2X) (Fermentas) in a MyCycler™
Thermal Cycler 1709703 instrument (Bio-Rad Laboratories) according
to the manufacturer’s instructions. The forward and reverse primers
of the neurotrophic factors are listed in Table I. The reaction cycle consisted of
95°C for 2 min, followed by 30 cycles of 95°C for 30 sec, 55°C for
30 sec, 72°C for 30 sec and 72°C for 10 min. Samples were analyzed
by 2% agarose gel electrophoresis and the relative expression
values of all mRNAs were normalized to the
glyceraldehyde-3-phosphate dehydrogenase (GAPDH) mRNA level. The
scanned images of the PCR products following agarose gel
electrophoresis were quantified using ImageJ software. For each
mRNA, the dose dependence of the PCR product was analyzed using a
different amount of the input cDNA and 30 cycles of amplification.
For all the mRNAs examined in our study, 30 cycles of amplification
under our experimental conditions were within the linear range. As
the negative controls, RNA samples were subjected to PCR without
the reverse transcription reaction.
 | Table IPrimers used in RT-PCR and
quantitative PCR analysis. |
Table I
Primers used in RT-PCR and
quantitative PCR analysis.
| Gene | Forward primers
(5′→3′) | Backward primers
(5′→3′) | Size (bp) |
|---|
| GAPDH |
AAGTTCAACGGCACAGTCAAG |
CCAGTAGACTCCACGACATACTA | 137 |
| MBP |
GCCAGTAAGGATGGTGAGATTC |
TTCTTTGGGTCTGCTGTGTG | 182 |
| MPZ |
GCTCCATTGTCATACACAACCTA |
ATCAGGTAGAAGAGCAACAGCAG | 208 |
| NGF |
CCAAGGACGCAGCTTTCTA |
CCTCTGGGACATTGCTATCTG | 132 |
| BDNF |
CCGTTTGACAACATTAATCTCTG |
GTCTCCTATGAAGCCACCTAATC | 183 |
| GDNF |
TTATGGGATGTCGTGGCTGT |
TCAGGATAATCTTCGGGCATA | 170 |
| CNTF |
GATTCGTTCAGACCTGACTGCT |
TACGGTAAGCCTGGAGGTTCT | 167 |
| FGF |
TACCTGGCTATGAAGGAAGATG |
AGTTCGTTTCAGTGCCACATAC | 147 |
| GGF |
GCTGACAATTACTGGCATCTGT |
AGGTTGCTCCGTTCTGACC | 138 |
Quantitative PCR (qPCR)
qPCR was carried out in a 20-μl final volume and
performed in triplicate using Power SYBR-Green PCR Master Mix
reagents (Fermentas) in an ABI Prism 7500 sequence detector
(Applied Biosystems, Framingham, MA, USA) according to the
manufacturer’s instructions. The forward and reverse primers of the
genes associated with myelination [such as myelin basic protein
(MBP) and myelin protein zero (MPZ)] are listed in Table I. The conditions for qPCR were as
follows: 95°C for 10 min followed by 40 cycles at 95°C for 10 sec
and 60°C for 1 min. GAPDH was used as a housekeeping gene for
normalization. The effects of TSA on the mRNA levels of the genes
associated with myelination were expressed as fold changes
normalized to GAPDH using a published comparative method (18) with the formula:
2−ΔΔCt.
Statistical analysis
One- or two-way ANOVA followed by Fisher’s post-hoc
tests were used to evaluate the effects of TSA and/or time on the
survival, proliferation and migration of SCs, as well as the mRNA
expression of neurotrophic factors and genes associated with
myelination. The significance level for all comparisons was set at
p<0.05. All data are presented as the means ± SD.
Results
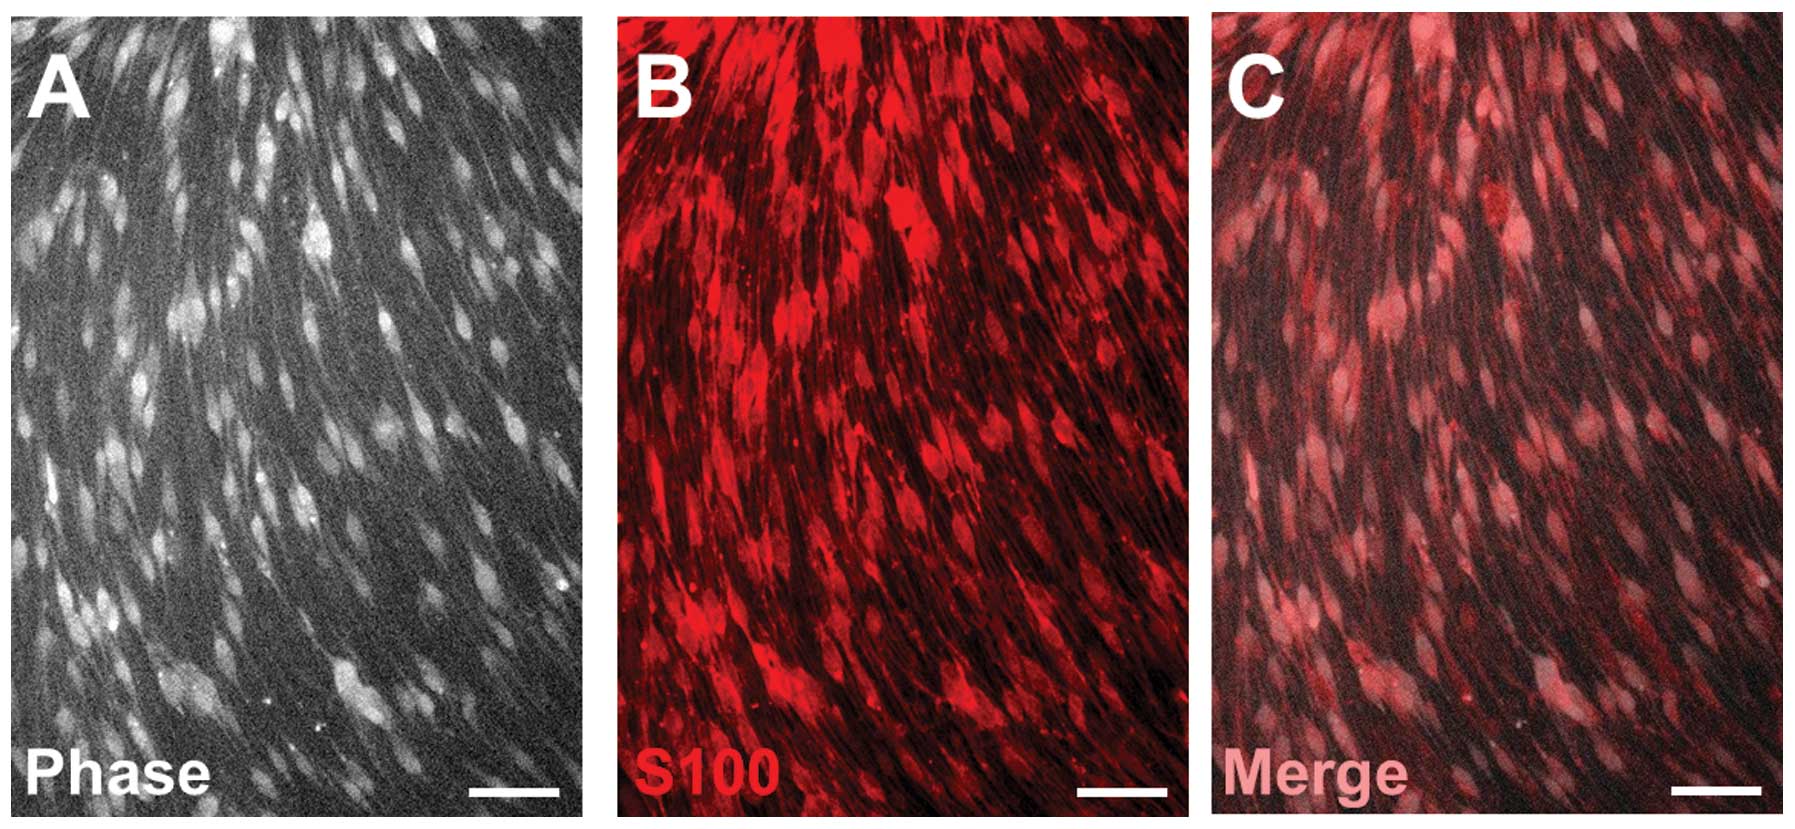
Identification of SCs
SCs isolated from adult rats exhibited a
spindle-like morphology and a swirling cell pattern with parallel
cell alignment when cultured in PLL. Over 98% of these SCs
expressed S100, a marker for SCs (Fig. 1).
Effect of HDAC inhibition on SC
survival
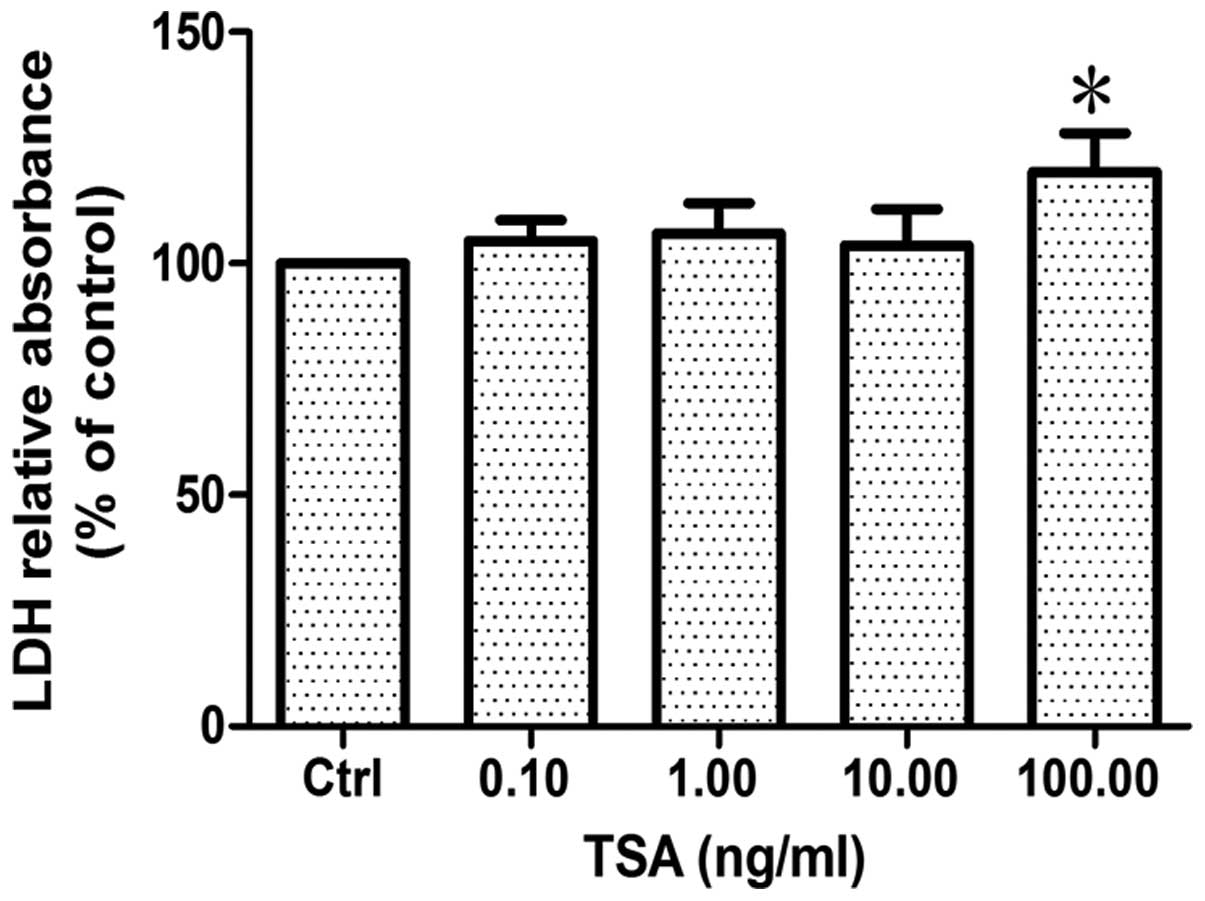
Cell survival was evaluated by measuring lactic
dehydrogenase (LDH) release into the medium from dead or dying
cells treated with various concentrations of TSA for 24 h. The
results revealed that there was no significant difference between
the groups treated with TSA at a concentration of 0.1, 1 and 10
ng/ml and the control group (p>0.86, n=6). However, when the
concentration of TSA reached 100 ng/ml, LDH relative absorbance
increased by approximately 20% compared to the control group
(p<0.05, n=6; Fig. 2),
indicating that a low concentration of TSA (<10 ng/ml) has no
direct effect on the survival of SCs, whereas a high concentration
of TSA does.
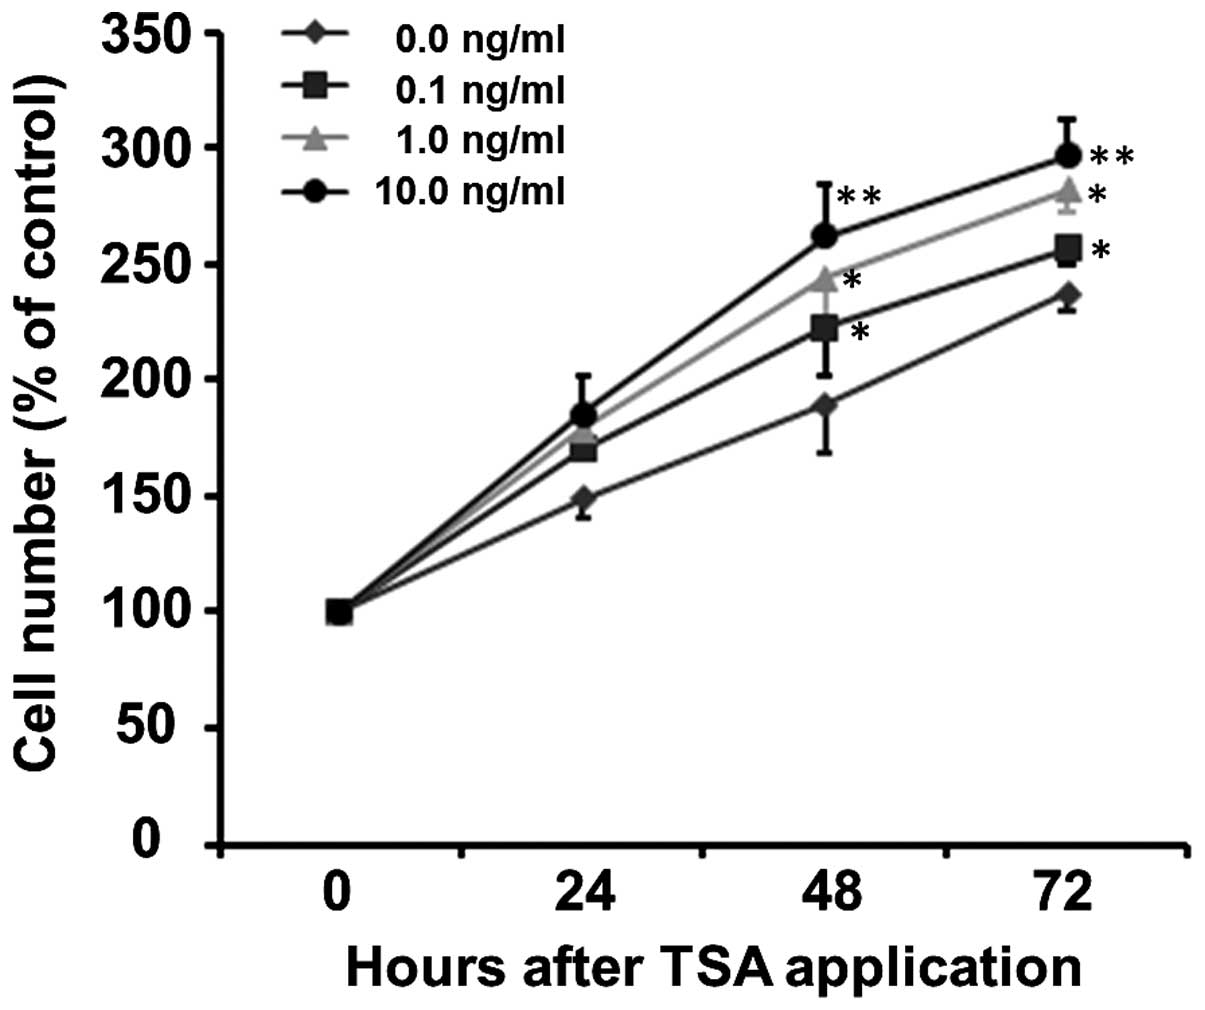
HDAC inhibition promotes the
proliferation of SCs
To evaluate the effects of HDAC inhibition on SC
proliferation, the SCs were treated with 0.1, 1 and 10 ng/ml of
TSA. Cell proliferation was assessed by counting the total cell
number by CCK-8 assay following the exposure of SCs to TSA for 0,
24, 48 and 72 h. As shown in Fig.
3, TSA increased the proliferation of SCs in a time- and
concentration-dependent manner (p<0.001). The proliferation
curve can be clearly observed in the normal culture medium (0 ng/ml
TSA) with increased cell number being 149.20±8.81, 189.36±20.25 and
237.21±7.13% at 24, 48 and 72 h, respectively (Fig. 3). The number of SCs treated with
0.1, 1 and 10 ng/ml TSA increased to 169.99±0.68, 178.64±12.00 and
185.68±15.57% of the control at 24 h, to 222.55±20.33, 243.95±25.35
and 262.24±22.28% of the control at 48 h and to 256.88±6.58,
282.10±10.19 and 297.03±14.72% of the control at 72 h,
respectively. Although at the early stage (24 h), there was no
significant difference in the number of SCs between the various
concentration groups (F=2.14, p=0.172), TSA increased the number of
SCs thereafter, i.e., at 48 h (F=5.27, p=0.027) and 72 h (F=4.86,
p=0.033), compared to the control group at the same time
points.
TSA inhibits the migration of SCs
To evaluate the effects of TSA on SC migration,
Transwell chamber analysis was performed. As shown in Fig. 4, a smaller number of SCs was
observed to migrate across the membranes in the groups treated with
0.1 ng/ml (p<0.001, n=6) and 1 ng/ml (p<0.005, n=4) TSA than
in the control group (n=6). This result indicated that TSA
significantly inhibited the transmigration of SCs.
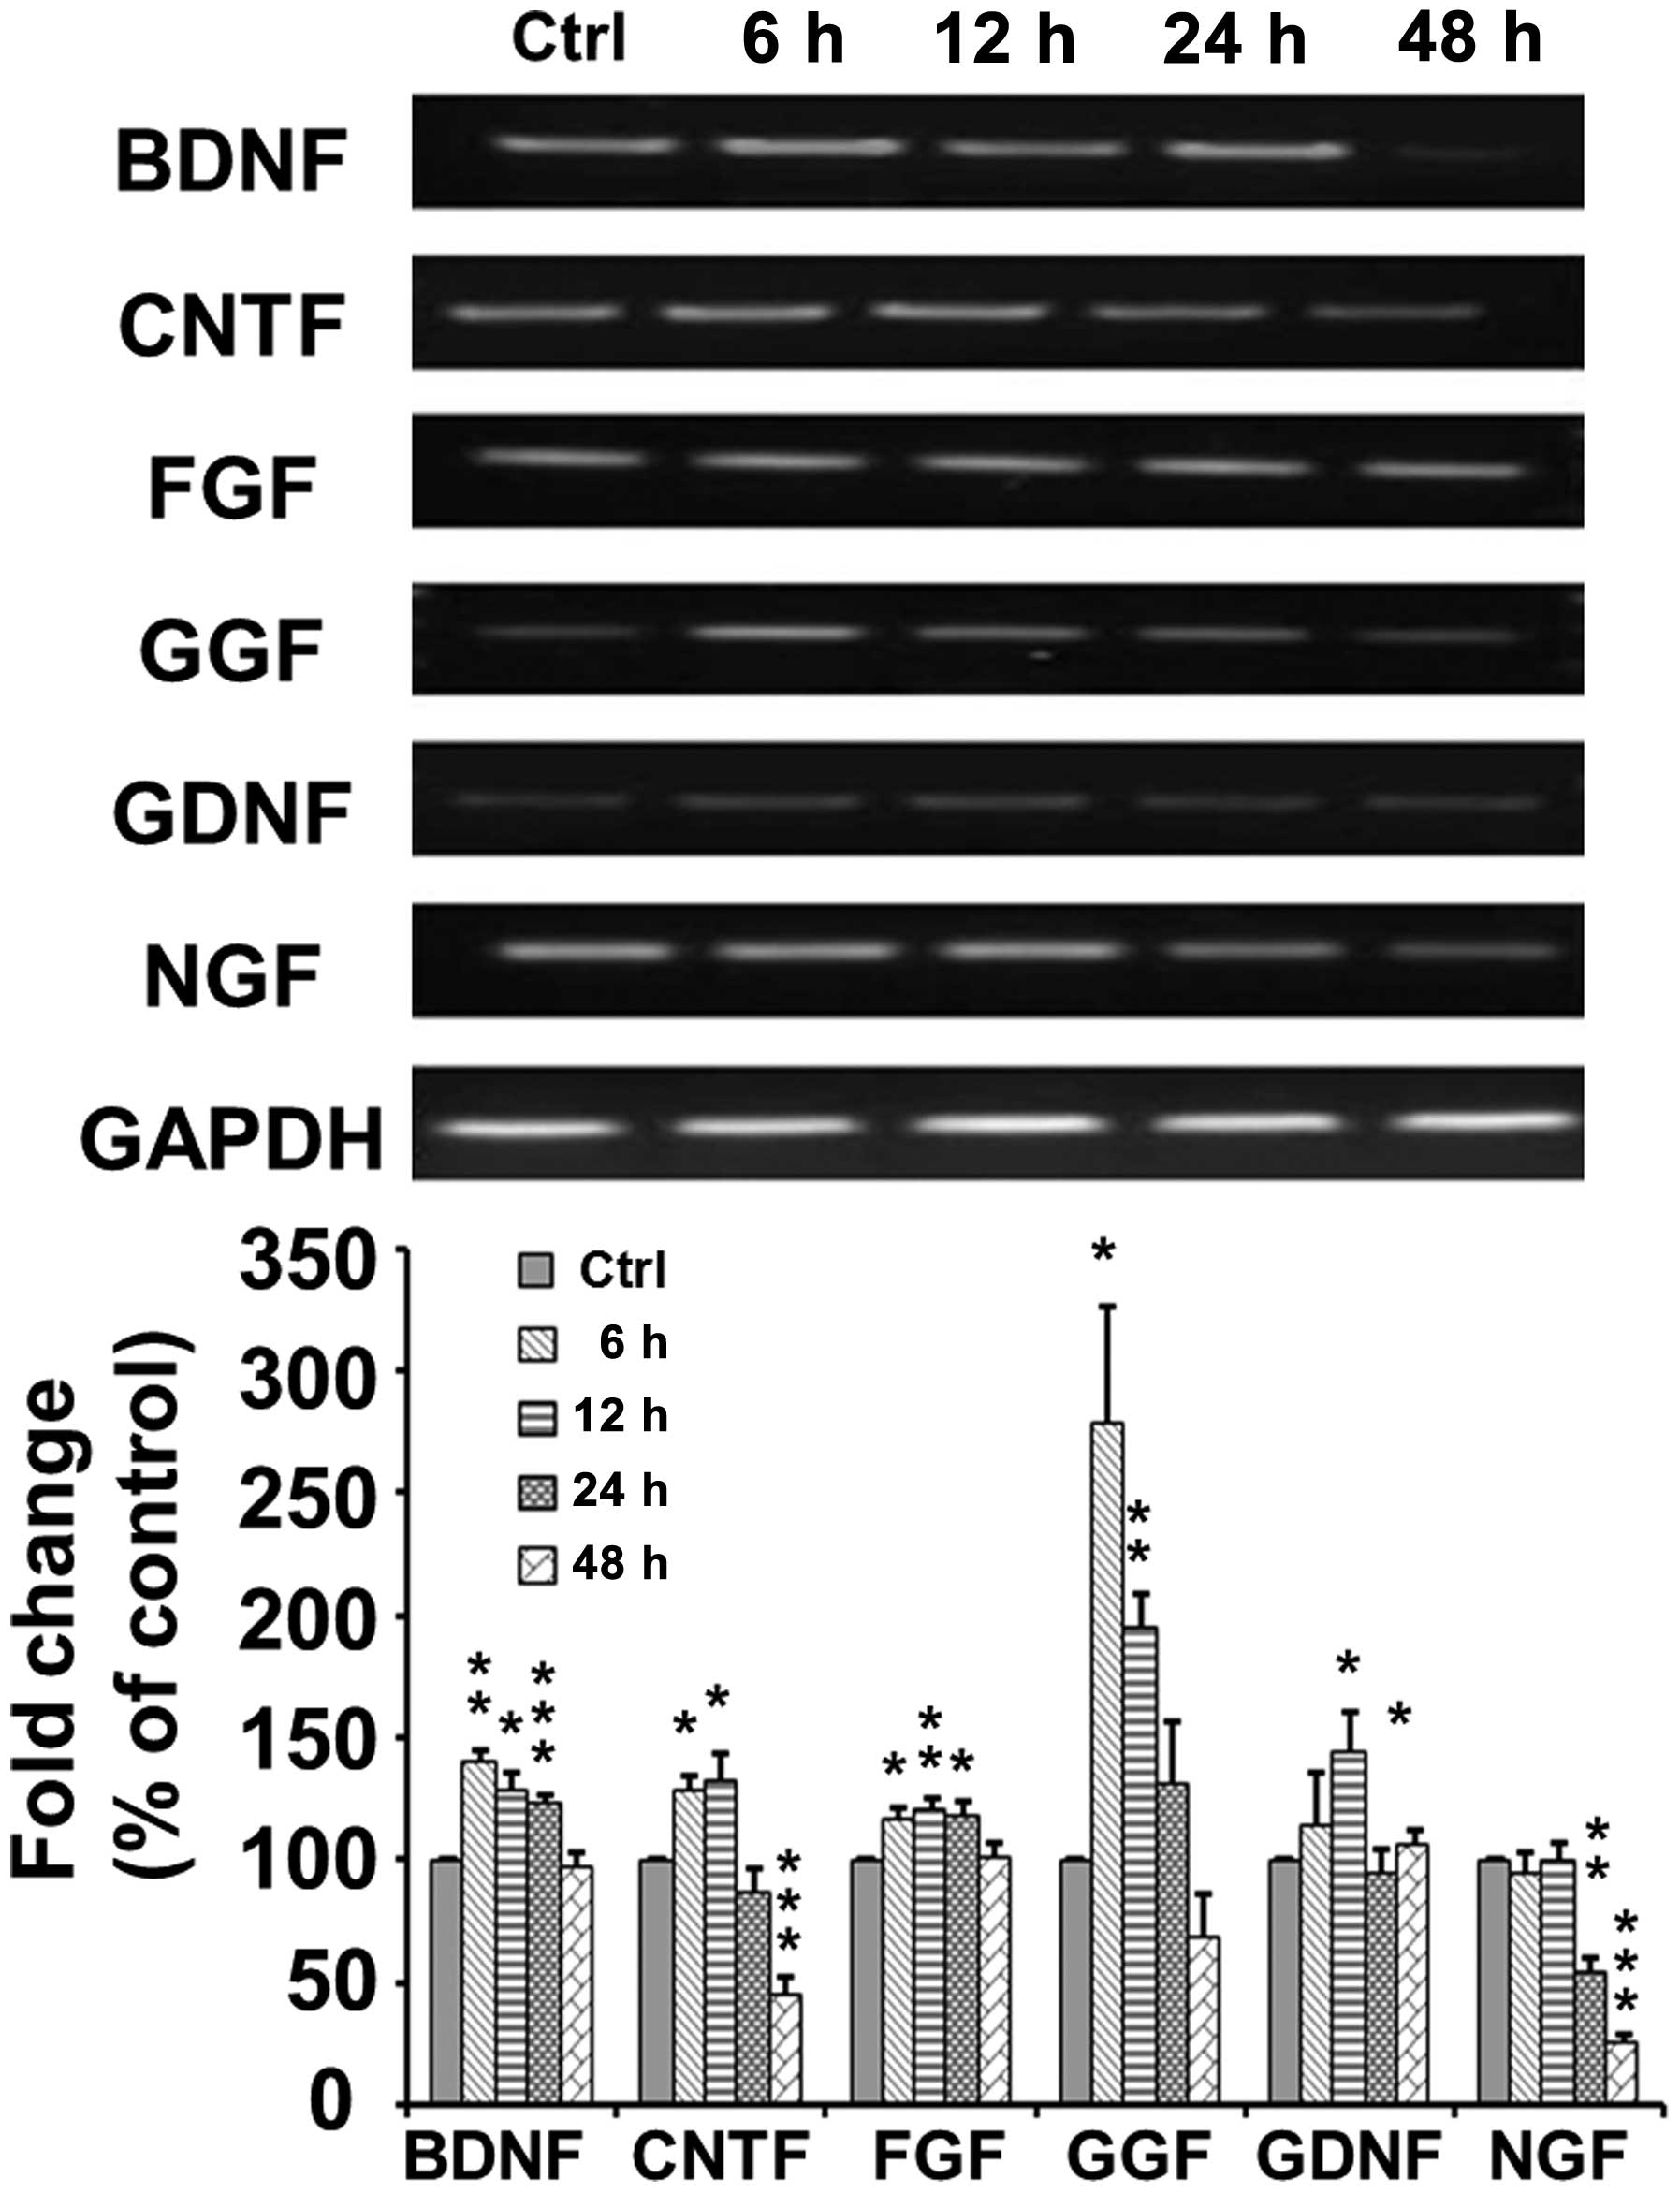
TSA increases the mRNA expression of
neurotrophic factors in SCs
As shown in Fig.
5, RT-PCR indicated that the mRNA expression of brain-derived
neurotrophic factor (BDNF) increased to 140±4.69% at 6 h
(p<0.005) and then decreased to 129.0±6.71 (p<0.05),
124.0±2.25 (p<0.001) and 98.0±5.24% (p>0.05) of the control
at 12, 24 and 48 h, respectively, following TSA application. The
mRNA expression of ciliary neurotrophic factor (CNTF) increased to
128.59±6.28 (p<0.05) and 133.36±9.82% (p<0.05) at 6 and 12 h,
respectively, and then decreased to 87.44±2.25 p>0.05) and
45.9±6.16% (p<0.001) of the control at 24 and 48 h,
respectively, following TSA application. The mRNA expression of
fibroblast growth factor (FGF) increased to 117.49±3.92 (p<0.05)
and 120.59±4.14% (p<0.01) at 6 and 12 h, respectively, and then
decreased to 118.97±4.67 (p<0.05) and 101.53±5.75% (p>0.05)
of the control at 24 and 48 h, respectively following TSA
application. The mRNA expression of glial growth factor (GGF)
markedly increased to 278.32±47.59% (p<0.05) at 6 h, and then
decreased to 195.34±13.31 (p<0.005), 130.93±26.33 (p>0.05)
and 68.85±17.65% (p>0.05) of the control at 12, 24 and 48 h,
respectively, following TSA application. The mRNA expression of
glial cell-derived neurotrophic factor (GDNF) increased to
145.14±15.23 (p<0.05) at 12 h, and then decreased to a normal
level of 94.91±8.94% (p>0.05) at 24 h following TSA application.
However, the mRNA expression of nerve growth factor (NGF) remained
at a normal level at 6 and 12 h, but then decreased to 53.88±6.67%
(p=0.0023) at 24 h following TSA application.
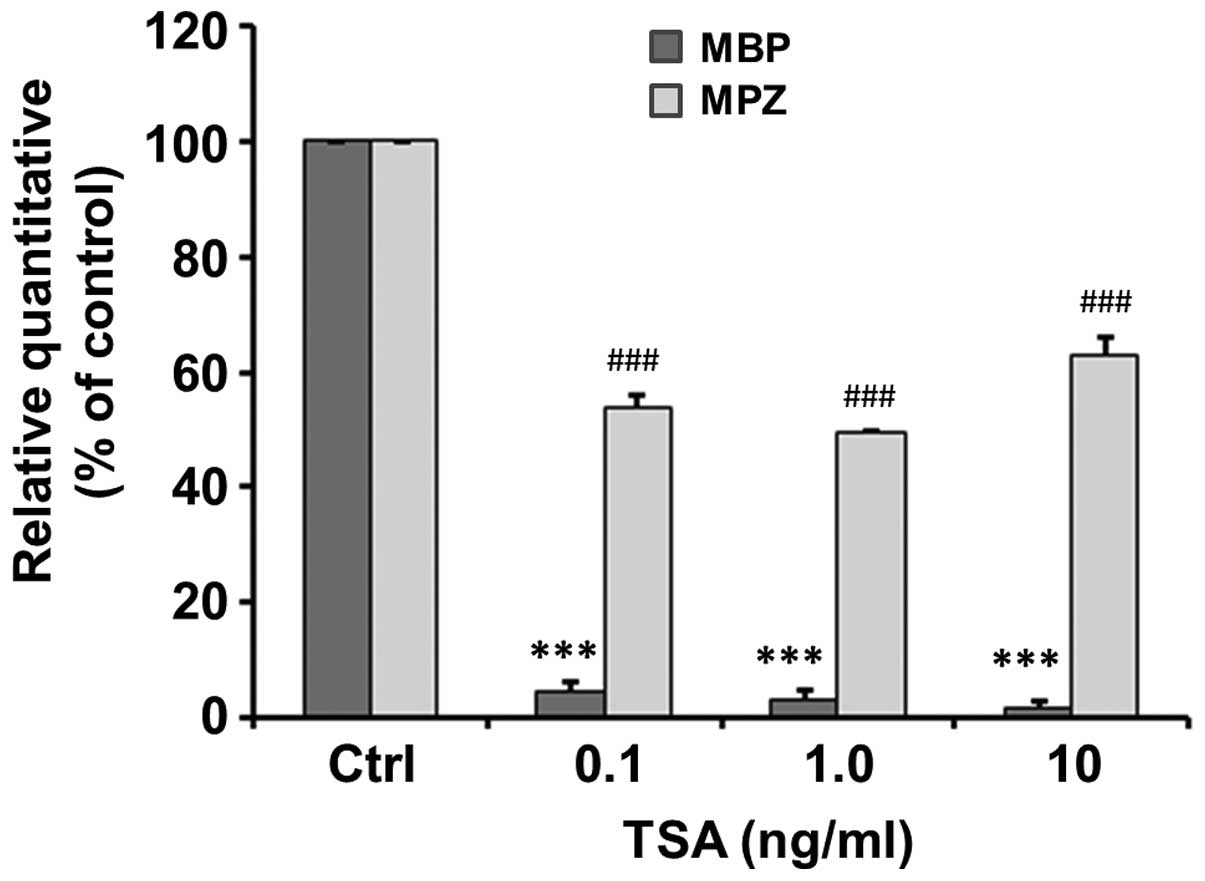
TSA inhibits the mRNA expression of genes
associated with myelination
The mRNA expression of genes associated with
myelination, including MPZ and MBP, following 48 h of treatment
with various concentrations of TSA was detected by qPCR. Our
results revealed that TSA significantly inhibited the mRNA
expression of MPZ to 4.83±1.59, 3.00±2.00 and 1.67±1.20% of the
control at a concentration of 0.1 (t=59.86, p<0.001), 1.0
(t=48.5, p<0.001) and 10 ng/ml (t=81.82, p<0.001) (Fig. 6). Similarly, TSA significantly
inhibited the mRNA expression of MBP to 54±2.08, 49.6±0.31 and
63.03±2.98% of the control at a concentration of 0.1 (t=22.1,
p<0.001), 1.0 (t=164.97, p<0.001) and 10 ng/ml (t=12.39,
p<0.001) (Fig. 6).
Discussion
In the present study, we investigated the role of
TSA, an HDAC inhibitor, on the survival, proliferation and
migration of SCs, as well as on the the expression of neurotrophic
factors and genes associated with myelination in SCs.
It has been reported that some HDAC inhibitors, such
as TSA and VPA, have basal toxicity, and that prolonged treatment
with TSA or VPA at high doses often induces neuronal death
(23). Treatment with TSA has
been shown to result in aggravated neurotoxic damage in
dopaminergic neurons induced by 1-methyl-4-phenylpyridinium and
rotenone (17), and to induce
apoptotic and autophagic cell and ventral midbrain neuronal death
induced by HDAC inhibitors through caspase-dependent or
-independent cell death pathways (24,25). However, in our previous study, we
demonstrated that the inhibition of HDAC activity had no direct
effect on the survival of NPCs (18). Moreover, in the present study, our
results demonstrated that 0.1–10 ng/ml of TSA had no significant
effect on the survival of SCs, whereas a higher concentration (100
ng/ml) of TSA induced SC death, suggesting that HDAC inhibition may
induce cell death in a cell type-specific and dose-dependent
manner.
Previous studies have demonstrated that HDAC
inhibitors promote the growth of cortical neuronal (26,27) and endothelial cells (28). In the present study, we
demonstrated that TSA increased SC proliferation, indicating that
TSA is a mitogen for SCs in vitro. It has been reported that
some HDAC inhibitors, e.g., VPA or TSA, increase the mRNA and
protein levels of neurotrophins, such as BDNF, GDNF, neurotrophin-3
(NT-3) and vascular endothelial growth factor (VEGF) in cultured
cells and brain regions (18,29,30), and thus induce cell proliferation
(31). In the present study, we
demonstrated that TSA increased the expression of several
neurotrophic factors, including BDNF, FGF, GGF, CTNF and GDNF; this
increase in the expression of neurotrophic factors may be one of
the mechanisms through which TSA induces the proliferation of
SCs.
Cell movement or motility is a highly dynamic
phenomenon that is essential to a variety of biological processes,
such as the development of an organism (morphogenesis), wound
healing, cancer metastasis and immune response (32). The migration of SCs is also an
important aspect of remyelination following nerve injury. In the
present study, we showed that TSA inhibited the migration of SCs.
It has been previously demonstrated that neurotrophins, integrins,
erythropoietin, GDNF and neuregulin β-1 (NRG1) regulate the
motility and migration of SCs (33). Endogenous NT3 and BDNF are key
regulators of SC migration, and promote or inhibit the migration of
SCs, respectively (34).
Similarly, endogenous and exogenous GDNF have different effects on
the migration of SCs. It has been reported that GDNF promotes the
motility of SCs in vitro (35), whereas SC migration along the
sciatic nerve is not dependent on GDNF in vivo (36). Our results revealed that TSA
exerts different effects on the expression levels of neurotrophins,
indicating that TSA affects the migration of SCs through the
regulation of neurotrophin expression levels.
An important function of SCs is to wrap around axons
of motor and sensory neurons to form the myelin sheath. MPZ and MBP
are two key indicators for the maturation and myelination of SCs
(37). Our data demonstrated that
TSA decreased the expression of MBP and MPZ in SCs, suggesting that
TSA regulates the differentiation and myelination of SCs.
In conclusion, our data demonstrate that TSA, at
certain concentrations, has no toxic effect on cells, induces
proliferation, inhibits SC migration, increases the expression of
neurotrophic factors and decreases the expression of MBP and MPZ.
These findings provide new evidence of the direct effects of TSA on
SCs. By identifying the changes occurring in SCs following
treatment with TSA, we may broaden our understand of TSA-based
treatment of SCI.
Acknowledgements
This study was supported by a grant from the
National Natural Science Foundation of China (no. 30872667).
References
|
1
|
Sobani ZA, Quadr SA and Enam SA: Stem
cells for spinal cord regeneration: current status. Surg Neurol
Int. 1:932010. View Article : Google Scholar : PubMed/NCBI
|
|
2
|
Garbossa D, Boido M, Fontanella M, et al:
Recent therapeutic strategies for spinal cord injury treatment:
possible role of stem cells. Neurosurg Rev. 35:293–311. 2012.
View Article : Google Scholar : PubMed/NCBI
|
|
3
|
Hill CE, Hurtado A, Blits B, et al: Early
necrosis and apoptosis of Schwann cells transplanted into the
injured rat spinal cord. Eur J Neurosci. 26:1433–1445. 2007.
View Article : Google Scholar : PubMed/NCBI
|
|
4
|
Lavdas AA, Papastefanaki F, Thomaidou D
and Matsas R: Schwann cell transplantation for CNS repair. Curr Med
Chem. 15:151–160. 2008. View Article : Google Scholar
|
|
5
|
Takami T, Oudega M, Bates ML, et al:
Schwann cell but not olfactory ensheathing glia transplants improve
hindlimb locomotor performance in the moderately contused adult rat
thoracic spinal cord. J Neurosci. 22:6670–6681. 2002.PubMed/NCBI
|
|
6
|
Ide C, Nakai Y, Nakano N, et al: Bone
marrow stromal cell transplantation for treatment of sub-acute
spinal cord injury in the rat. Brain Res. 1332:32–47. 2010.
View Article : Google Scholar : PubMed/NCBI
|
|
7
|
Schaal SM, Kitay BM, Cho KS, et al:
Schwann cell transplantation improves reticulospinal axon growth
and forelimb strength after severe cervical spinal cord contusion.
Cell Transplant. 16:207–228. 2007. View Article : Google Scholar : PubMed/NCBI
|
|
8
|
Kocsis JD and Waxman SG: Schwann cells and
their precursors for repair of central nervous system myelin.
Brain. 130:1978–1980. 2007. View Article : Google Scholar
|
|
9
|
Patel V, Joseph G, Patel A, et al:
Suspension matrices for improved Schwann-cell survival after
implantation into the injured rat spinal cord. J Neurotrauma.
27:789–801. 2010. View Article : Google Scholar : PubMed/NCBI
|
|
10
|
Redell JB, Moore AN, Ward NH III,
Hergenroeder GW and Dash PK: Human traumatic brain injury alters
plasma microRNA levels. J Neurotrauma. 27:2147–2156. 2010.
View Article : Google Scholar : PubMed/NCBI
|
|
11
|
Yu IT, Park JY, Kim SH, et al: Valproic
acid promotes neuronal differentiation by induction of proneural
factors in association with H4 acetylation. Neuropharmacology.
56:473–480. 2009. View Article : Google Scholar : PubMed/NCBI
|
|
12
|
Feng HL, Leng Y, Ma CH, et al: Combined
lithium and valproate treatment delays disease onset, reduces
neurological deficits and prolongs survival in an amyotrophic
lateral sclerosis mouse model. Neuroscience. 155:567–572. 2008.
View Article : Google Scholar
|
|
13
|
Tsai LK, Tsai MS, Ting CH, Wang SH and Li
H: Restoring Bcl-x(L) levels benefits a mouse model of spinal
muscular atrophy. Neurobiol Dis. 31:361–367. 2008. View Article : Google Scholar : PubMed/NCBI
|
|
14
|
Ferrante RJ, Kubilus JK, Lee J, et al:
Histone deacetylase inhibition by sodium butyrate chemotherapy
ameliorates the neurodegenerative phenotype in Huntington,’s
disease mice. J Neurosci. 23:9418–9427. 2003.PubMed/NCBI
|
|
15
|
Langley B, D’Annibale MA, Suh K, et al:
Pulse inhibition of histone deacetylases induces complete
resistance to oxidative death in cortical neurons without toxicity
and reveals a role for cytoplasmic p21 (waf1/cip1) in cell
cycle-independent neuroprotection. J Neurosci. 28:163–176. 2008.
View Article : Google Scholar
|
|
16
|
Chuang DM, Leng Y, Marinova Z, Kim HJ and
Chiu CT: Multiple roles of HDAC inhibition in neurodegenerative
conditions. Trends Neurosci. 32:591–601. 2009. View Article : Google Scholar : PubMed/NCBI
|
|
17
|
Wang Z, Zang C, Cui K, et al: Genome-wide
mapping of HATs and HDACs reveals distinct functions in active and
inactive genes. Cell. 138:1019–1031. 2009. View Article : Google Scholar : PubMed/NCBI
|
|
18
|
Liu H, Wu H, Wang Y, et al: Inhibition of
class II histone deacetylase blocks proliferation and promotes
neuronal differentiation of the embryonic rat neural progenitor
cells. Acta Neurobiol Exp (Wars). 72:365–376. 2012.PubMed/NCBI
|
|
19
|
Morrissey TK, Kleitman N and Bunge RP:
Isolation and functional characterization of Schwann cells derived
from adult peripheral nerve. J Neurosci. 11:2433–2442.
1991.PubMed/NCBI
|
|
20
|
Xu XM, Guénard V, Kleitman N, Aebischer P
and Bunge MB: A combination of BDNF and NT-3 promotes supraspinal
axonal regeneration into Schwann cell grafts in adult rat thoracic
spinal cord. Exp Neurol. 134:261–272. 1995. View Article : Google Scholar
|
|
21
|
Xu XM, Guénard VV, Kleitman N and Bunge
MB: Axonal regeneration into Schwann cell-seeded guidance channels
grafted into transected adult rat spinal cord. J Comp Neurol.
351:145–160. 1995. View Article : Google Scholar : PubMed/NCBI
|
|
22
|
Wang X, Fu S, Wang Y, et al:
Interleukin-1beta mediates proliferation and differentiation of
multipotent neural precursor cells through the activation of
SAPK/JNK pathway. Mol Cell Neurosci. 36:343–354. 2007. View Article : Google Scholar : PubMed/NCBI
|
|
23
|
Jeong MR, Hashimoto R, Senatorov VV, et
al: Valproic acid, a mood stabilizer and anticonvulsant, protects
rat cerebral cortical neurons from spontaneous cell death: a role
of histone deacetylase inhibition. FEBS Lett. 542:74–78. 2003.
View Article : Google Scholar : PubMed/NCBI
|
|
24
|
Forgione N and Tropepe V: Histone
deacetylase inhibition promotes Caspase-independent cell death of
ventral midbrain neurons. Mol Cell Neurosci. 48:117–128. 2011.
View Article : Google Scholar : PubMed/NCBI
|
|
25
|
Mi S, Lee X, Shao Z, et al: LINGO-1 is a
component of the Nogo-66 receptor/p75 signaling complex. Nat
Neurosci. 7:221–228. 2004. View
Article : Google Scholar : PubMed/NCBI
|
|
26
|
Di Daniel E, Mudge AW and Maycox PR:
Comparative analysis of the effects of four mood stabilizers in
SH-SY5Y cells and in primary neurons. Bipolar Disord. 7:33–41.
2005.PubMed/NCBI
|
|
27
|
Hao Y, Creson T, Zhang L, et al: Mood
stabilizer valproate promotes ERK pathway-dependent cortical
neuronal growth and neurogenesis. J Neurosci. 24:6590–6599. 2004.
View Article : Google Scholar : PubMed/NCBI
|
|
28
|
Michaelis M, Suhan T, Michaelis UR, et al:
Valproic acid induces extracellular signal-regulated kinase 1/2
activation and inhibits apoptosis in endothelial cells. Cell Death
Differ. 13:446–453. 2006. View Article : Google Scholar : PubMed/NCBI
|
|
29
|
Chen PS, Peng GS, Li G, et al: Valproate
protects dopaminergic neurons in midbrain neuron/glia cultures by
stimulating the release of neurotrophic factors from astrocytes.
Mol Psychiatry. 11:1116–1125. 2006. View Article : Google Scholar : PubMed/NCBI
|
|
30
|
Castro LM, Gallant M and Niles LP: Novel
targets for valproic acid: up-regulation of melatonin receptors and
neurotrophic factors in C6 glioma cells. J Neurochem. 95:1227–1236.
2005. View Article : Google Scholar : PubMed/NCBI
|
|
31
|
Otsuka S, Adamson C, Sankar V, et al:
Delayed intrathecal delivery of RhoA siRNA to the contused spinal
cord inhibits allodynia, preserves white matter, and increases
serotonergic fiber growth. J Neurotrauma. 28:1063–1076. 2011.
View Article : Google Scholar
|
|
32
|
Ananthakrishnan R and Ehrlicher A: The
forces behind cell movement. Int J Biol Sci. 3:303–317. 2007.
View Article : Google Scholar : PubMed/NCBI
|
|
33
|
Heermann S and Schwab MH: Molecular
control of Schwann cell migration along peripheral axons: keep
moving! Cell Adh Migr. 7:18–22. 2013. View Article : Google Scholar : PubMed/NCBI
|
|
34
|
Ishida-Yamamoto A, Yamauchi T, Tanaka H,
et al: Electron microscopic in situ DNA nick end-labeling in
combination with immunoelectron microscopy. J Histochem Cytochem.
47:711–717. 1999. View Article : Google Scholar : PubMed/NCBI
|
|
35
|
Cornejo M, Nambi D, Walheim C, et al:
Effect of NRG1, GDNF, EGF and NGF in the migration of a Schwann
cell precursor line. Neurochem Res. 35:1643–1651. 2010. View Article : Google Scholar : PubMed/NCBI
|
|
36
|
Heermann S, Spittau B, Zajzon K, Schwab MH
and Krieglstein K: Schwann cells migrate along axons in the absence
of GDNF signaling. BMC Neurosci. 13:922012. View Article : Google Scholar : PubMed/NCBI
|
|
37
|
Jacob C, Christen CN, Pereira JA, et al:
HDAC1 and HDAC2 control the transcriptional program of myelination
and the survival of Schwann cells. Nat Neurosci. 14:429–436. 2011.
View Article : Google Scholar : PubMed/NCBI
|