Introduction
During the immune response, amino acid deprivation
constitutes a significant immunoregulatory mechanism. There are
certain enzymes, such as arginase I in myeloid-derived suppressor
cells and indoleamine 2,3-dioxygenase (IDO) in antigen-presenting
cells that cause the depletion of certain amino acids and suppress
T-cell effector function (1,2).
In eukaryotic cells, there are two conservative
mechanisms that sense amino acid deprivation. The first is able to
sense the lack of any amino acid and is based on the activation of
the general control nonderepressible 2 (GCN2) kinase by uncharged
tRNA (3,4). The second includes the inhibition of
the mammalian target of rapamycin complex 1 (mTORC1), which, in the
presence of amino acids, remains active through a complex mechanism
that recruits mTORC1 to the outer lysosomal membrane where it
interacts with its activator, Rheb (4–6).
There are data supporting that mTORC1 is sensitive to the depletion
of certain amino acids and more precisely to leucine, isoleucine,
valine and possibly arginine (4).
Indeed, as previously demonstrated, in a model of alloreactivity,
IDO-induced tryptophan depletion activated the GCN2 kinase, but did
not affect mTORC1 activity in primary human CD4+ T-cells
(7).
Upon amino acid deprivation, both systems
down-regulate global protein translation, while they enhance the
translation of certain proteins, again through different
mechanisms. GCN2 kinase phosphorylates the eukaryotic initiation
factor 2α (eIF2α), leading to the slower formation of the ternary
complex, which is required for initiation of translation. However,
mRNAs with many upstream open reading frames (uORFs) are
preferentially translated, since slower ternary complex formation
allows the small ribosomal subunit to bypass the intermediate uORFs
and reach the protein coding sequence (8,9).
mTORC1 inhibition downregulates global protein translation by
preventing the phosphorylation and activation of 70 kDa ribosomal
protein S6 kinase (p70S6K), as well as the phosphorylation and
inhibition of and eIF4E binding protein 1 (4E-BP1).
Unphosphorylated 4E-BP1 inhibits eIF4E required for cap-dependent
mRNA translation. By acting in such a way, the inhibition of mTORC1
facilitates the cap-independent translation of mRNAs that contain
internal ribosomal entry sites (IRES) (10,11).
Although GCN2 kinase and mTORC1 sense amino acid
deprivation and affect protein translation through different
mechanisms, both have been shown to suppress T-cell effector
function. mTORC1 inhibitors are already components of
immunosuppressive regiments in solid organ transplantation
(12). Experimental data also
indicate that GCN2 kinase activation may play a role in the
prevention of allograft rejection. IDO exerts its immunosuppressive
properties mainly through tryptophan depletion and GCN2 kinase
activation (7,13,14). The immunosuppressive role of IDO
has been confirmed in animal models of allotransplantation
(15–17). Importantly, the role of IDO in the
downregulation of the adaptive immune response was revealed for the
first time in an animal study which demonstrated that IDO
expression in paternally-derived placental trophoblasts contributes
to a successful semi-allogenic pregnancy (18).
In this study, the effects of GCN2 kinase activation
or mTORC1 inhibition on primary human alloreactive CD4+
T-cells were compared under the same experimental conditions. The
two-way mixed lymphocyte reaction (MLR), as a model of
alloreactivity (19), the GCN2
kinase activator, tryptophanol (TRP) (14,20), and the mTORC1 inhibitor, rapamycin
(RAP), were used (10). The
concentration of TRP was selected to inhibit T-cell proliferation
with negligible toxicity according to previous studies (7,13,14). The concentration of RAP was
selected to be within the recommended range of blood levels of
kidney transplant recipients (12).
The results confirmed that in primary human
alloreactive CD4+ T-cells, the two systems that sense
amino acid deprivation affect cell proliferation, apoptosis and
differentiation in different ways or through different
mechanisms.
Materials and methods
Subjects
Blood samples were collected from 8 unrelated
healthy volunteers (5 females and 3 males, 40.8±7.2 years old). An
informed consent was obtained from each individual prior to
enrollment and the Ethics Committee of the Medical School of the
University of Thessaly, Larissa, Greece gave its approval for the
study protocol.
Peripheral blood mononuclear cell (PBMC)
isolation and culture
PBMCs were isolated from whole blood by
Ficoll-Hypaque density gradient centrifugation (Histopaque 1077;
Sigma-Aldrich, St. Louis, MO, USA) and counted under an optical
microscopy on a Neubauer plaque. Cell viability was assessed by
trypan blue assay (Sigma-Aldrich).
The PBMCs were resuspended in RPMI-1640 medium with
L-glutamine and 10 mM
4-(2-hydroxyethyl)-1-pipera-zineethanesulfonic acid (HEPES)
supplemented with 10% fetal bovine serum and antibiotic-antimycotic
solution (both from Sigma-Aldrich). Isolated PBMCs from the
enrolled subjects were coupled in order to set up 8 different MLRs.
All cultures were performed at 37°C in a humidified atmosphere
containing 5% CO2.
Cytotoxicity of the evaluated compounds
and cell proliferation in MLRs
MLRs were performed in 96-well plates for 7 days in
the presence or not of 0.25 mM TRP (Sigma-Aldrich) or 10 nM RAP
(Tebu-bio, Le Perray-en-Yvelines Cedex, France). The number of
PBMCs from each member of the MLR couple was 5×10⁴,
summing it up to 1×10⁵ PBMCs in total in each well.
At the end of the 7-day period, the cytotoxicity of
TRP or RAP was assessed by lactate dehydrogenase (LDH) release
assay using the Cytotox Non-Radioactive Cytotoxic assay kit
(Promega Corp., Madison, WI, USA) according to the protocol
provided by the manufacturer. Cytotoxicity was calculated using the
following equation: cytotoxicity (%) = (LDH in the
supernatant/total LDH) ×100. A total of 8 MLRs were performed in
triplicate with the results for each MLR referring to the mean of
the 3 measurements.
At the end of the 7-day period, cell proliferation
was assessed by Cell Proliferation enzyme-linked immunosorbent
assay (ELISA) (Roche Diagnostics, Indianapolis, IN, USA) using
bromodeoxyuridine (BrdU) labeling and immunoenzymatic detection
according to the manufacturer's instructions. Cultures of
1×10⁵ resting PMBCs per well were used as the controls.
The proliferation index (PI) was calculated as the ratio of the
optical density (OD) derived from each MLR to the mean of the ODs
derived from the control resting PBMCs of the 2 members of each MLR
pair. A total of 8 MLRs were performed in triplicate with the
results for each MLR referring to the mean of the 3
measurements.
Assessment of GCN2 kinase, mTORC1
activity, signature transcription factors of CD4+ T-cell
subsets and key proteins involved in the proliferation, apoptosis
and differentiation of CD4+ T-cells isolated from the
MLRs
A total of 8 MLRs were performed in 12-well plates
for 7 days in the presence or not of 0.25 mM TRP or 10 nM RAP. The
number of PBMCs for each member of the MLR couple was
5×10⁵, summing up to 1×10⁶ PBMCs in each
well. At the end of the 7-day period, CD4+ T-cells were
isolated from the MLRs by negative selection using the
CD4+ T cell isolation kit, human (Miltenyi Biotec GmbH,
Bergisch Gladbach, Germany).
The isolated CD4+ T-cells were counted
via optical microscopy on a Neubauer plaque and cell viability was
determined by trypan blue assay. PBMCs were isolated from whole
blood by FicollHypaque density gradient centrifugation (Histopaque
1077; Sigma-Aldrich) and counted via optical microscopy using an
optical microscope (Axiovert 40 C; Carl Zeiss AG, Oberkochen,
Germany) and a Neubauer chamber (Paul Marienfeld GmbH,
Lauda-Königshofen, Germany). Cell viability was assessed by trypan
blue staining (Sigma-Aldrich) recommended for use in dye exclusion
procedures for viable cell counting, based on the principle that
live (viable) cells do not take up trypan blue, whereas dead
(non-viable) cells do.
For western blot analysis, equal numbers of T-cells
from each MLR were lysed using the T-PER tissue protein extraction
reagent (Thermo Fisher Scientific, Rockford, IL, USA) supplemented
with protease and phosphatase inhibitors (Sigma-Aldrich and Roche
Diagnostics). Protein was quantified by Bradford assay
(Sigma-Aldrich) and 10 μg from each sample were
electrophorized on a sodium dodecyl sulfate (SDS) polyacrylamide
gel (Invitrogen, Life Technologies, Carlsbad, CA, USA).
Subsequently, the proteins were transferred onto polyvinylidene
difluoride (PVDF) membranes (Invitrogen, Life Technologies). The
blots were incubated with the primary antibody for 16 h, followed
by the secondary antibody (anti-rabbit IgG, HRP-linked antibody;
cat. no. 7074; Cell Signaling Technology, Danvers, MA, USA) for 30
min. A benchmark pre-stained protein ladder (Invitrogen, Life
Technologies) was used as a marker. Bands were visualized by
enhanced chemiluminescent detection using the LumiSensor Plus
Chemiluminescent HRP Substrate kit (GenScript, Piscataway, NJ,
USA). In the case of reprobing the PVDF blots, the previous primary
and secondary antibody were removed using Restore Western Blot
Stripping Buffer (Thermo Fisher Scientific) according to the
manufacturer's instructions. Analysis was performed using the
ImageJ software (National Institute of Health, Bethesda, MD,
USA).
The primary antibodies used for western blot
analysis were specific for the substrate of GCN2 kinase eukaryotic
initiation factor 2α phosphorylated at serine 51 (p-eIF2α; cat. no.
9721) and the substrate of mTORC1 p70S6 kinase phosphorylated at
threonine 389 (p-p70S6K; cat. no. 9234) (both from Cell Signaling
Technology, Danvers, MA, USA). In addition, specific antibodies
against the Th1, Th2, Th17 and Treg signature transcription
factors, T-box transcription factor TBX21 (T-bet; cat. no. 13232),
trans-acting T-cell-specific transcription factor GATA-3 (GATA-3;
cat. no. 5852) (both from Cell Signaling Technology), retinoic acid
receptor related orphan receptor γt (RORγt; cat. no. orb6888)
(Biorbyt, Cambridge, UK) and Forkhead box P3 (FoxP3; cat. no. 5298)
(Cell Signaling Technology), respectively were used. Finally,
specific antibodies were used for the detection of the tumor
suppressor p53 (cat. no. 9282), cyclin dependent kinase inhibitor
p21WAF1 (p21; cat. no. 2947), cleaved caspase-3 at Asp175 (CC3;
cat. no. 9664) (all from Cell Signaling Technology),
hypoxia-inducible factor-1α (HIF-1α) (cat. no. sc-10790; Santa Cruz
Biotechnology, Dallas, TX, USA) and LDH-A (cat. no. 2012; Cell
Signaling Technology). All the results of western blot analysis
were normalized to β-actin (cat. no. 4967; Cell Signaling
Technology).
Assessment of interferon-γ (IFN-γ),
interleukin (IL)-4, IL-17 and IL-10 production in MLRs
A total of 8 MLRs were performed in 12-well plates
in the presence or not of 0.25 mM TRP or 10 nM RAP, with the cell
number of each PBMC population in the MLR context remaining the
same as before. After 7 days, supernatants from each MLR were
collected and IFN-γ, IL-4, IL-17 and IL-10 were measured by means
of ELISA.
All ELISA kits for the measurement of cytokine
production were purchased from R&D Systems (Minneapolis, MN,
USA). The sensitivity of the human IFN-γ quantikine ELISA kit is
<8 pg/ml, that of the human IL-4 quantikine ELISA kit <10
pg/ml, that of the human IL-17 quantikine ELISA kit <15 pg/ml
and that of the human IL-10 quantikine ELISA kit <3.9 pg/ml.
Statistical analysis
The normality of the evaluated variables was
assessed and confirmed by a one-sample Kolmogorov-Smirnov test. For
comparisons of the means, a paired-sample t-test was used. The
results are expressed as the means ± standard deviation and a value
of p<0.05 was considered to indicate a statistically significant
difference.
In case of the western blot analysis, since the
original results were expressed as optical densities (OD), p-values
were calculated by comparing the means of OD. Statistical analysis
after normalization to the control OD values was avoided for
preventing the violation of the prerequisite for normal
distribution of the compared variables when applying parametric
statistical tests. However, for the reader's convenience, in the
text, the results are expressed and depicted following
normalization of values to the control group.
Results
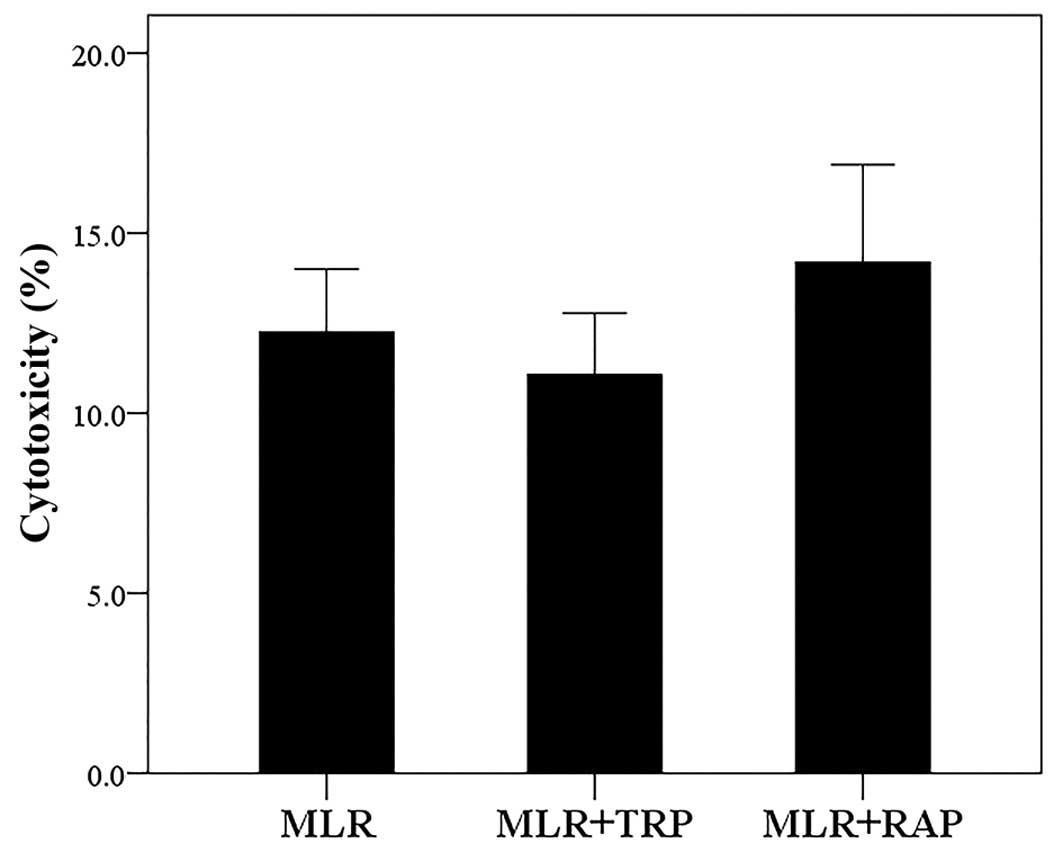
In MLRs, both TRP and RAP exhibit
negligible cytotoxicity
Compared to the untreated MLRs, neither treatment
with TRP at a concentration of 0.25 mM nor treatment with RAP at a
concentration of 10 nM resulted in considerable cytotoxicity. The
cytotoxicity of MLR, MLR +TRP and MLR +RAP was 12.25±1.75,
11.06±1.72 and 14.19±2.71%, respectively (Fig. 1).
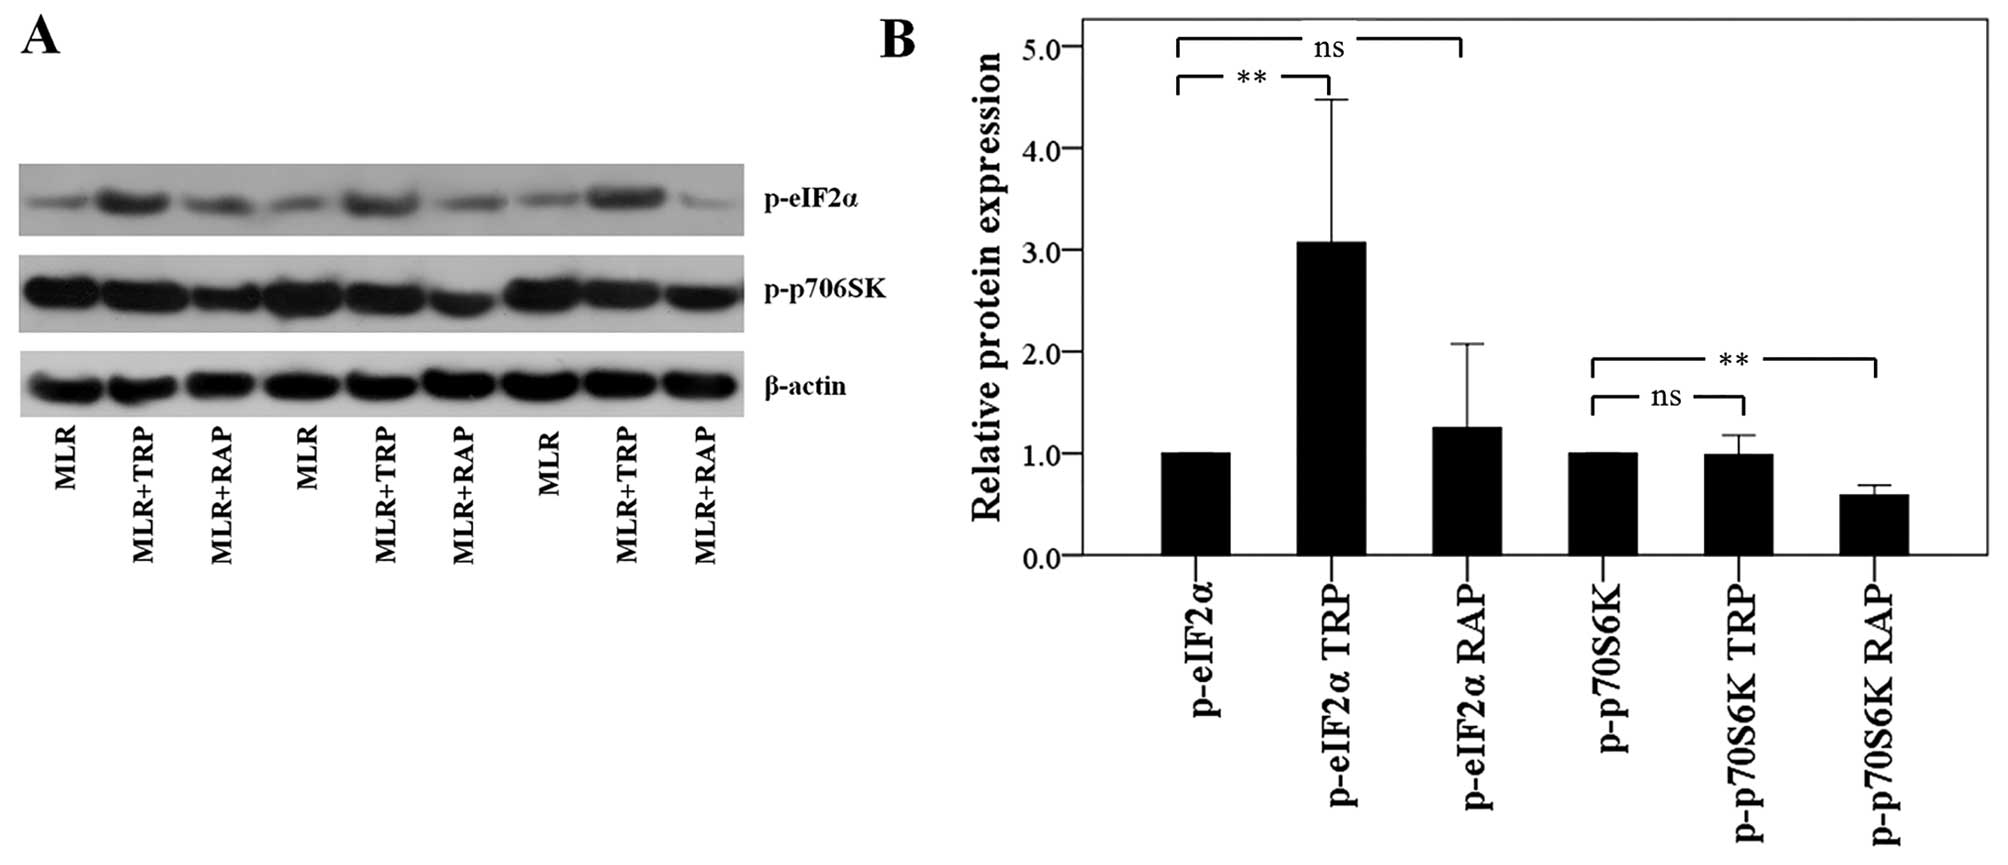
In CD4+ T-cells, TRP activates
GCN2 kinase, whereas RAP inhibits mTORC1
In the CD4+ T-cells isolated from the
MLRs treated with TRP, the level of phosphorylation of the GCN2
kinase substrate, eIF2α, was increased to a factor of 3.07±1.40
(p<0.001). Treatment of the MLRs with RAP did not alter the
p-eIF2α level significantly. More precisely, in this case, the
level of p-eIF2α was altered to a factor of 1.25±0.82 (p=0.732;
Fig. 2).
Treatment of the MLRs with RAP resulted in the
decreased phosphorylation of the mTORC1 substrate, p70S6K, to a
factor of 0.59±0.09 (p<0.001) in the CD4+ T-cells.
Treatment of the MLRs with TRP did not affect the p-p70S6K level,
only altering it to a factor of 0.99±0.10 (p=0.668; Fig. 2).
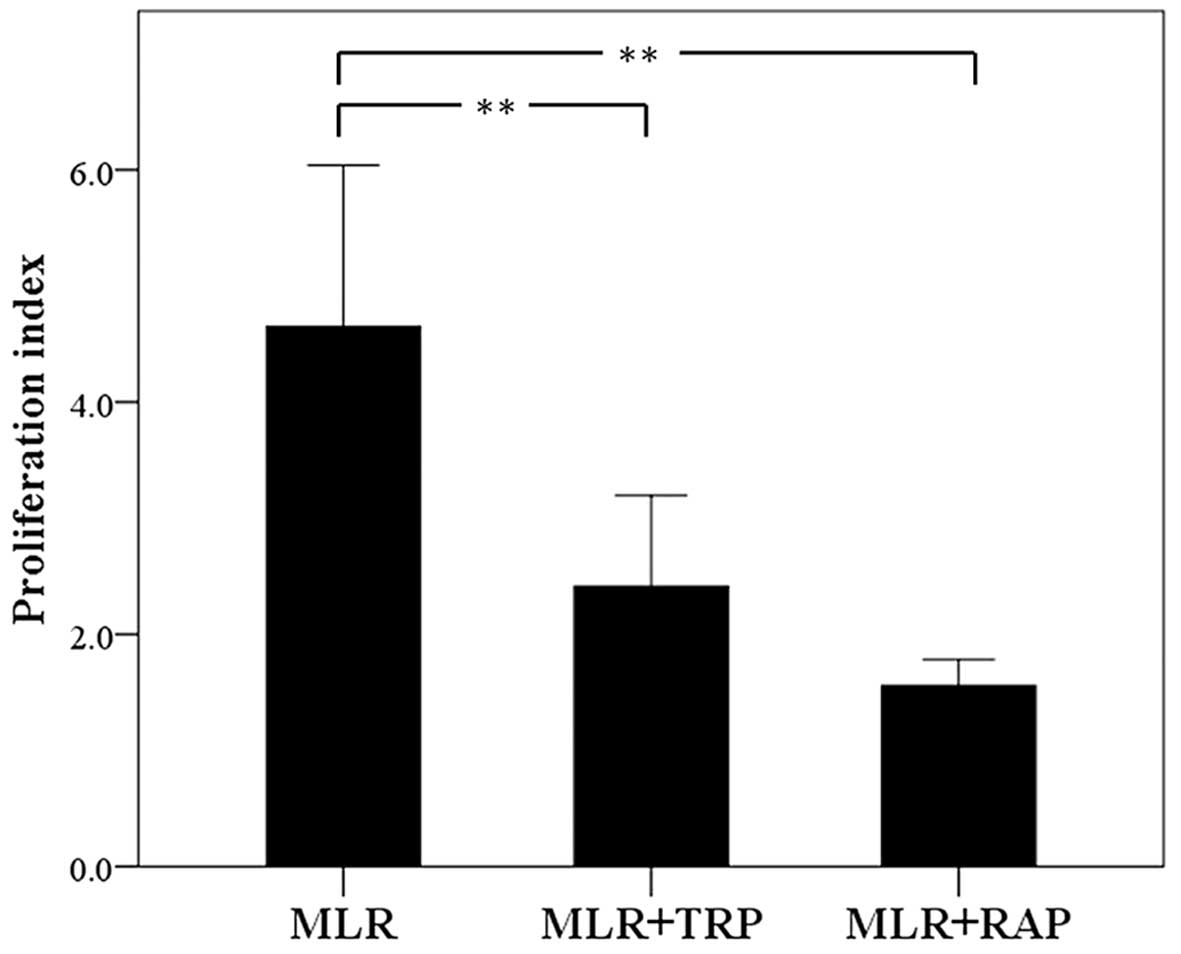
In MLRs, both TRP and RAP decrease cell
proliferation
In the untreated MLRs, the PI was 4.42±0.46.
Treatment with TRP decreased the PI to 2.28±0.30 (p<0.001). RAP
also decreased PI significantly to 1.56±0.39 (p<0.001; Fig. 3).
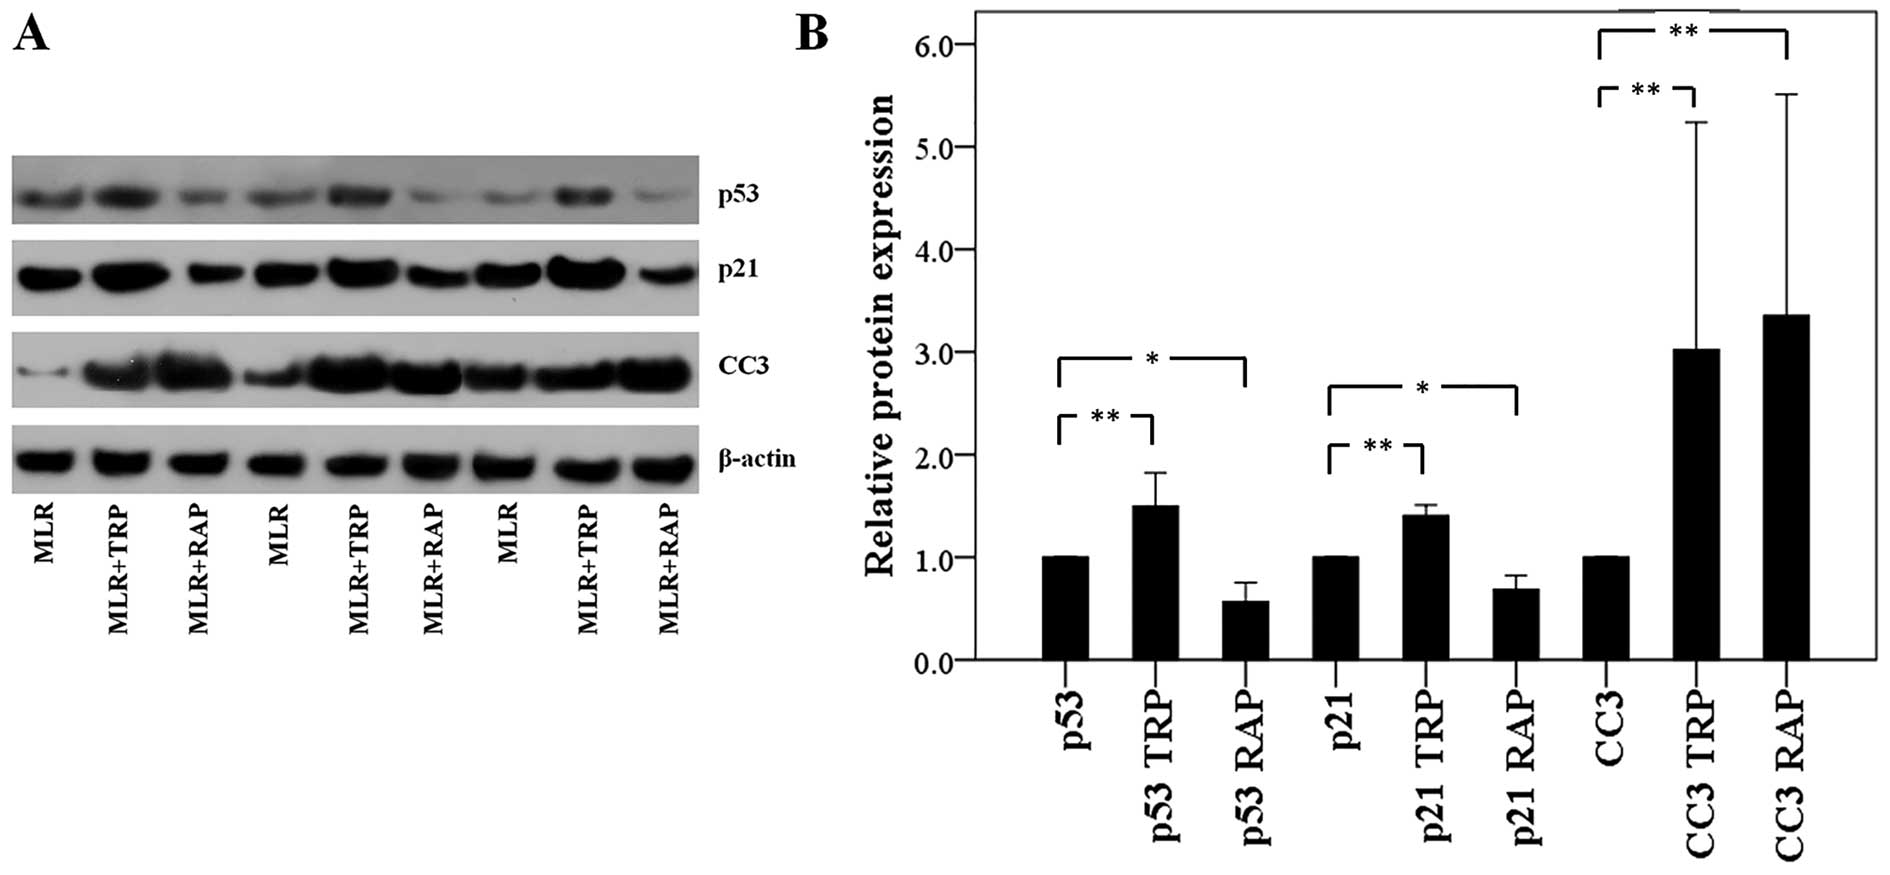
In CD4+ T-cells, TRP increases
p53, p21 and CC3 expression, whereas RAP decreases p53 and p21 and
increases CC3 expression
In the CD4+ T-cells isolated from the
MLRs treated with TRP, p53 expression was increased to a factor of
1.50±0.33 (p<0.001). The expression of the p53 transcriptional
target, p21, was also increased to a factor of 1.40±0.10
(p<0.001). Finally, the level of CC3 was also found to be
increased to a factor of 3.02±2.21 (p<0.001; Fig. 4).
Although treatment of the MLRs with RAP also
resulted in an increase in CC3 expression in the CD4+
T-cells to a factor of 3.35±2.16 (p<0.001), the effects of
treatment with RAP on the p53 and p21 levels were the opposite to
those observed following treatment with TRP. More precisely, RAP
decreased both the p53 and p21 expression levels to a factor of
0.56±0.19 (p=0.004) and 0.69±0.13 (p=0.001), respectively (Fig. 4).
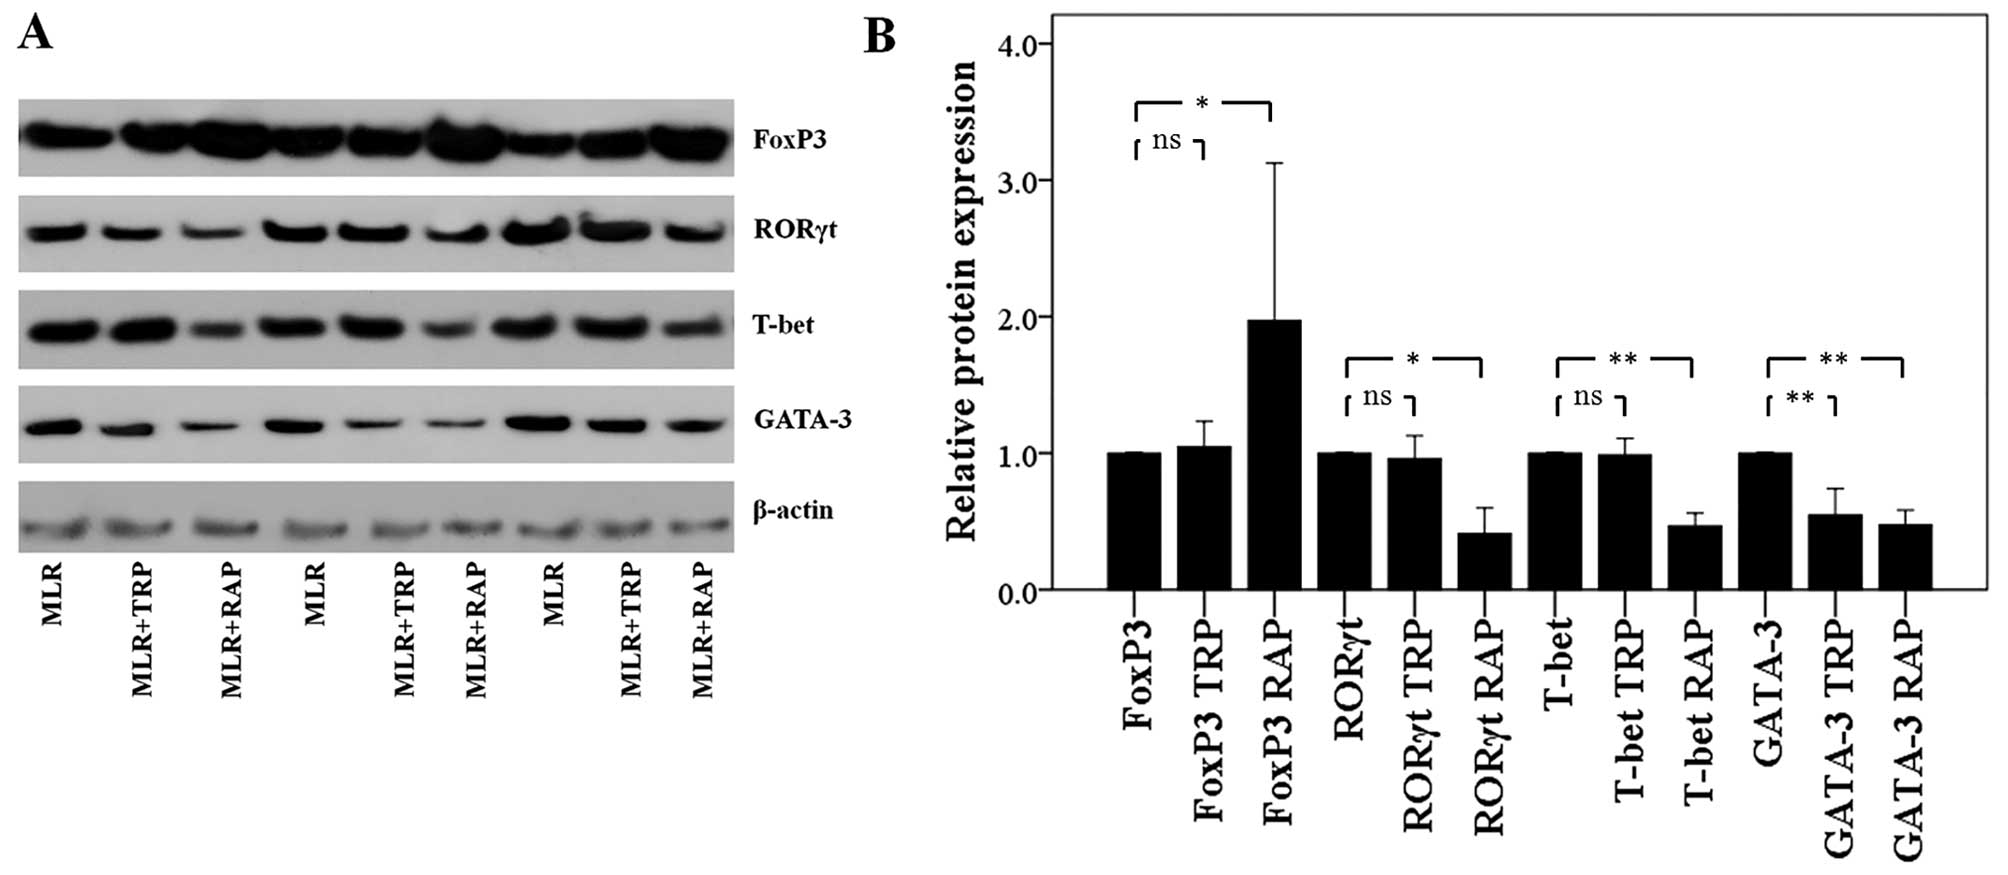
In CD4+ T-cells, TRP and RAP
decrease GATA-3 expression, but RAP also decreases T-bet and RORγt
expression, and increases FoxP3 expression
Treatment of the MLRs with TRP affected only GATA-3
expression in the CD4+ T-cells. The level of this Th2
signature transcription factor decreased to a factor of 0.55±0.19
(p<0.001). On the contrary, TRP did not affect the expression of
the Th1 cell signature transcription factor, T-bet, that of the
Th17 cell signature transcription factor, RORγt, or that of the
Treg cell signature transcription factor, FoxP3. The levels of
these factors were only altered to a factor of 0.99±0.12 (p=0.722),
0.96±0.17 (p=0.589) and 1.05±0.19 (p=0.568), respectively (Fig. 5).
In contrast to TRP, treatment of the MLRs with RAP
altered the expression levels of all the evaluated CD4+
T-cell subset signature transcription factors. Treatment with RAP
resulted in the decreased expression of T-bet, GATA-3 and RORγt to
a factor of 0.47±0.09 (p<0.001), 0.47±0.11 (p<0.001) and
0.41±0.19 (p=0.001), respectively. In the same cellular context,
the presence of RAP significantly upregulated FoxP3 to a factor of
1.97±1.15 (p=0.003; Fig. 5).
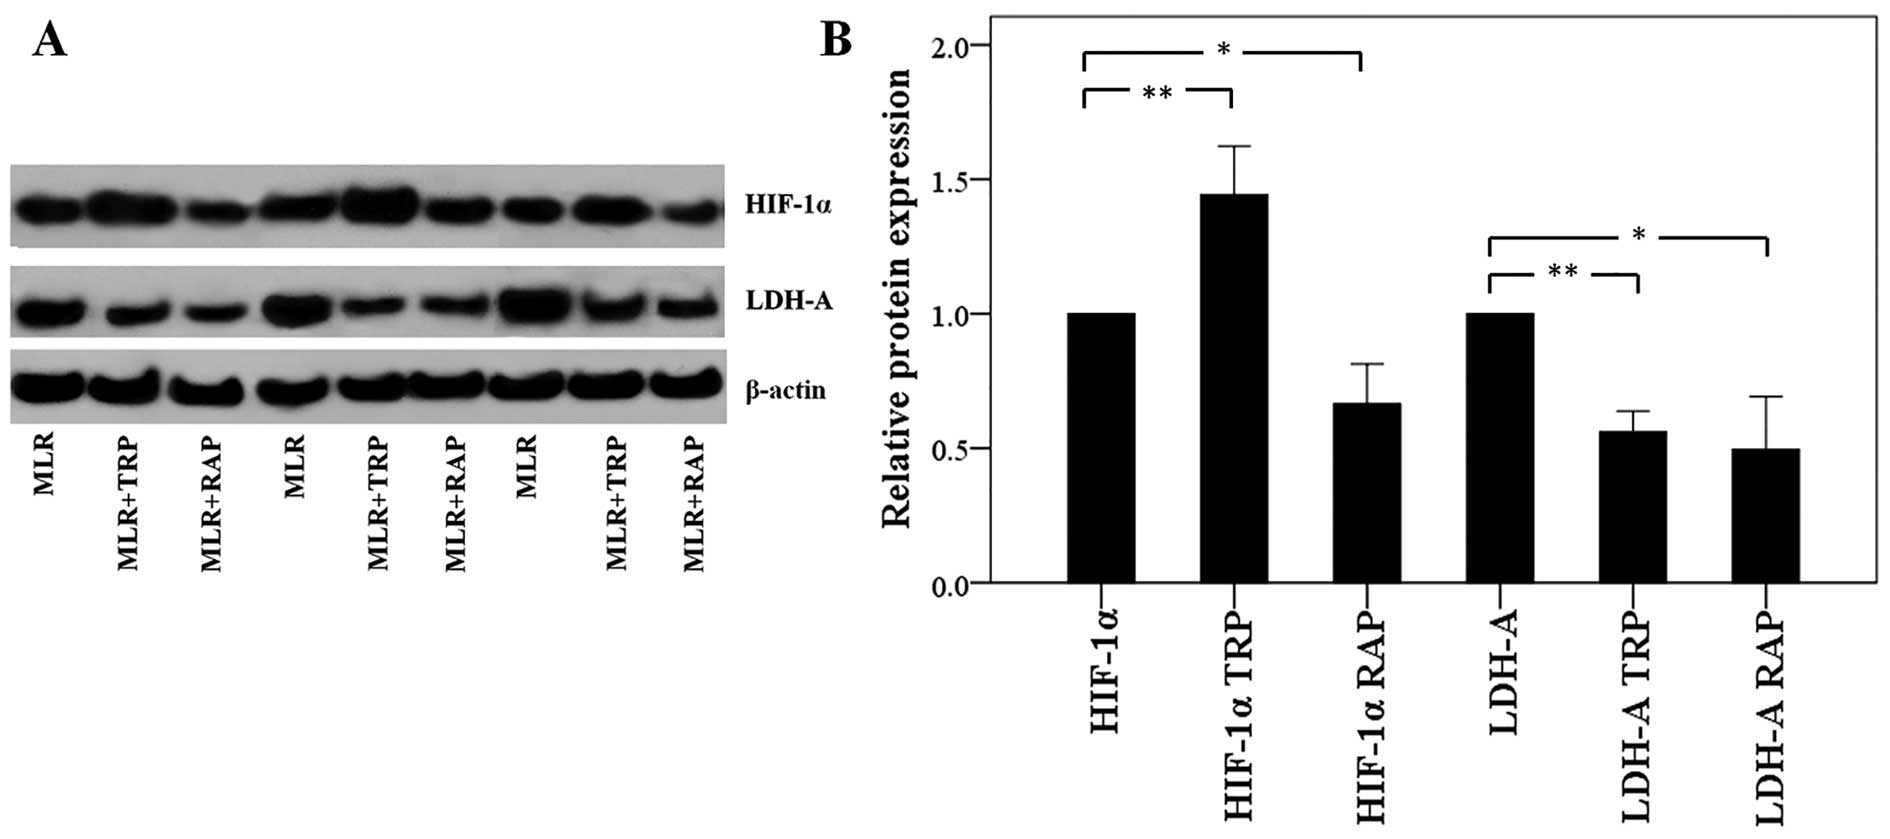
In CD4+ T-cells, TRP increases
HIF-1α expression and RAP decreases HIF-1 α expression, but both
result in the decreased expression of LDH-A
Treatment of the MLRs with TRP increased the
expression of HIF-1α, which enhances the ratio of Th17/Treg
differentiation, in CD4+ T-cells to a factor of
1.44±0.18 (p<0.001). However, the level of its transcriptional
target, LDH-A, was found decreased to a factor of 0.56±0.08
(p<0.001; Fig. 6).
Treatment with RAP decreased both the HIF-1α and
LDH-A levels to a factor of 0.66±0.15 (p=0.001) and 0.49±0.20
(p=0.001), respectively (Fig.
6).
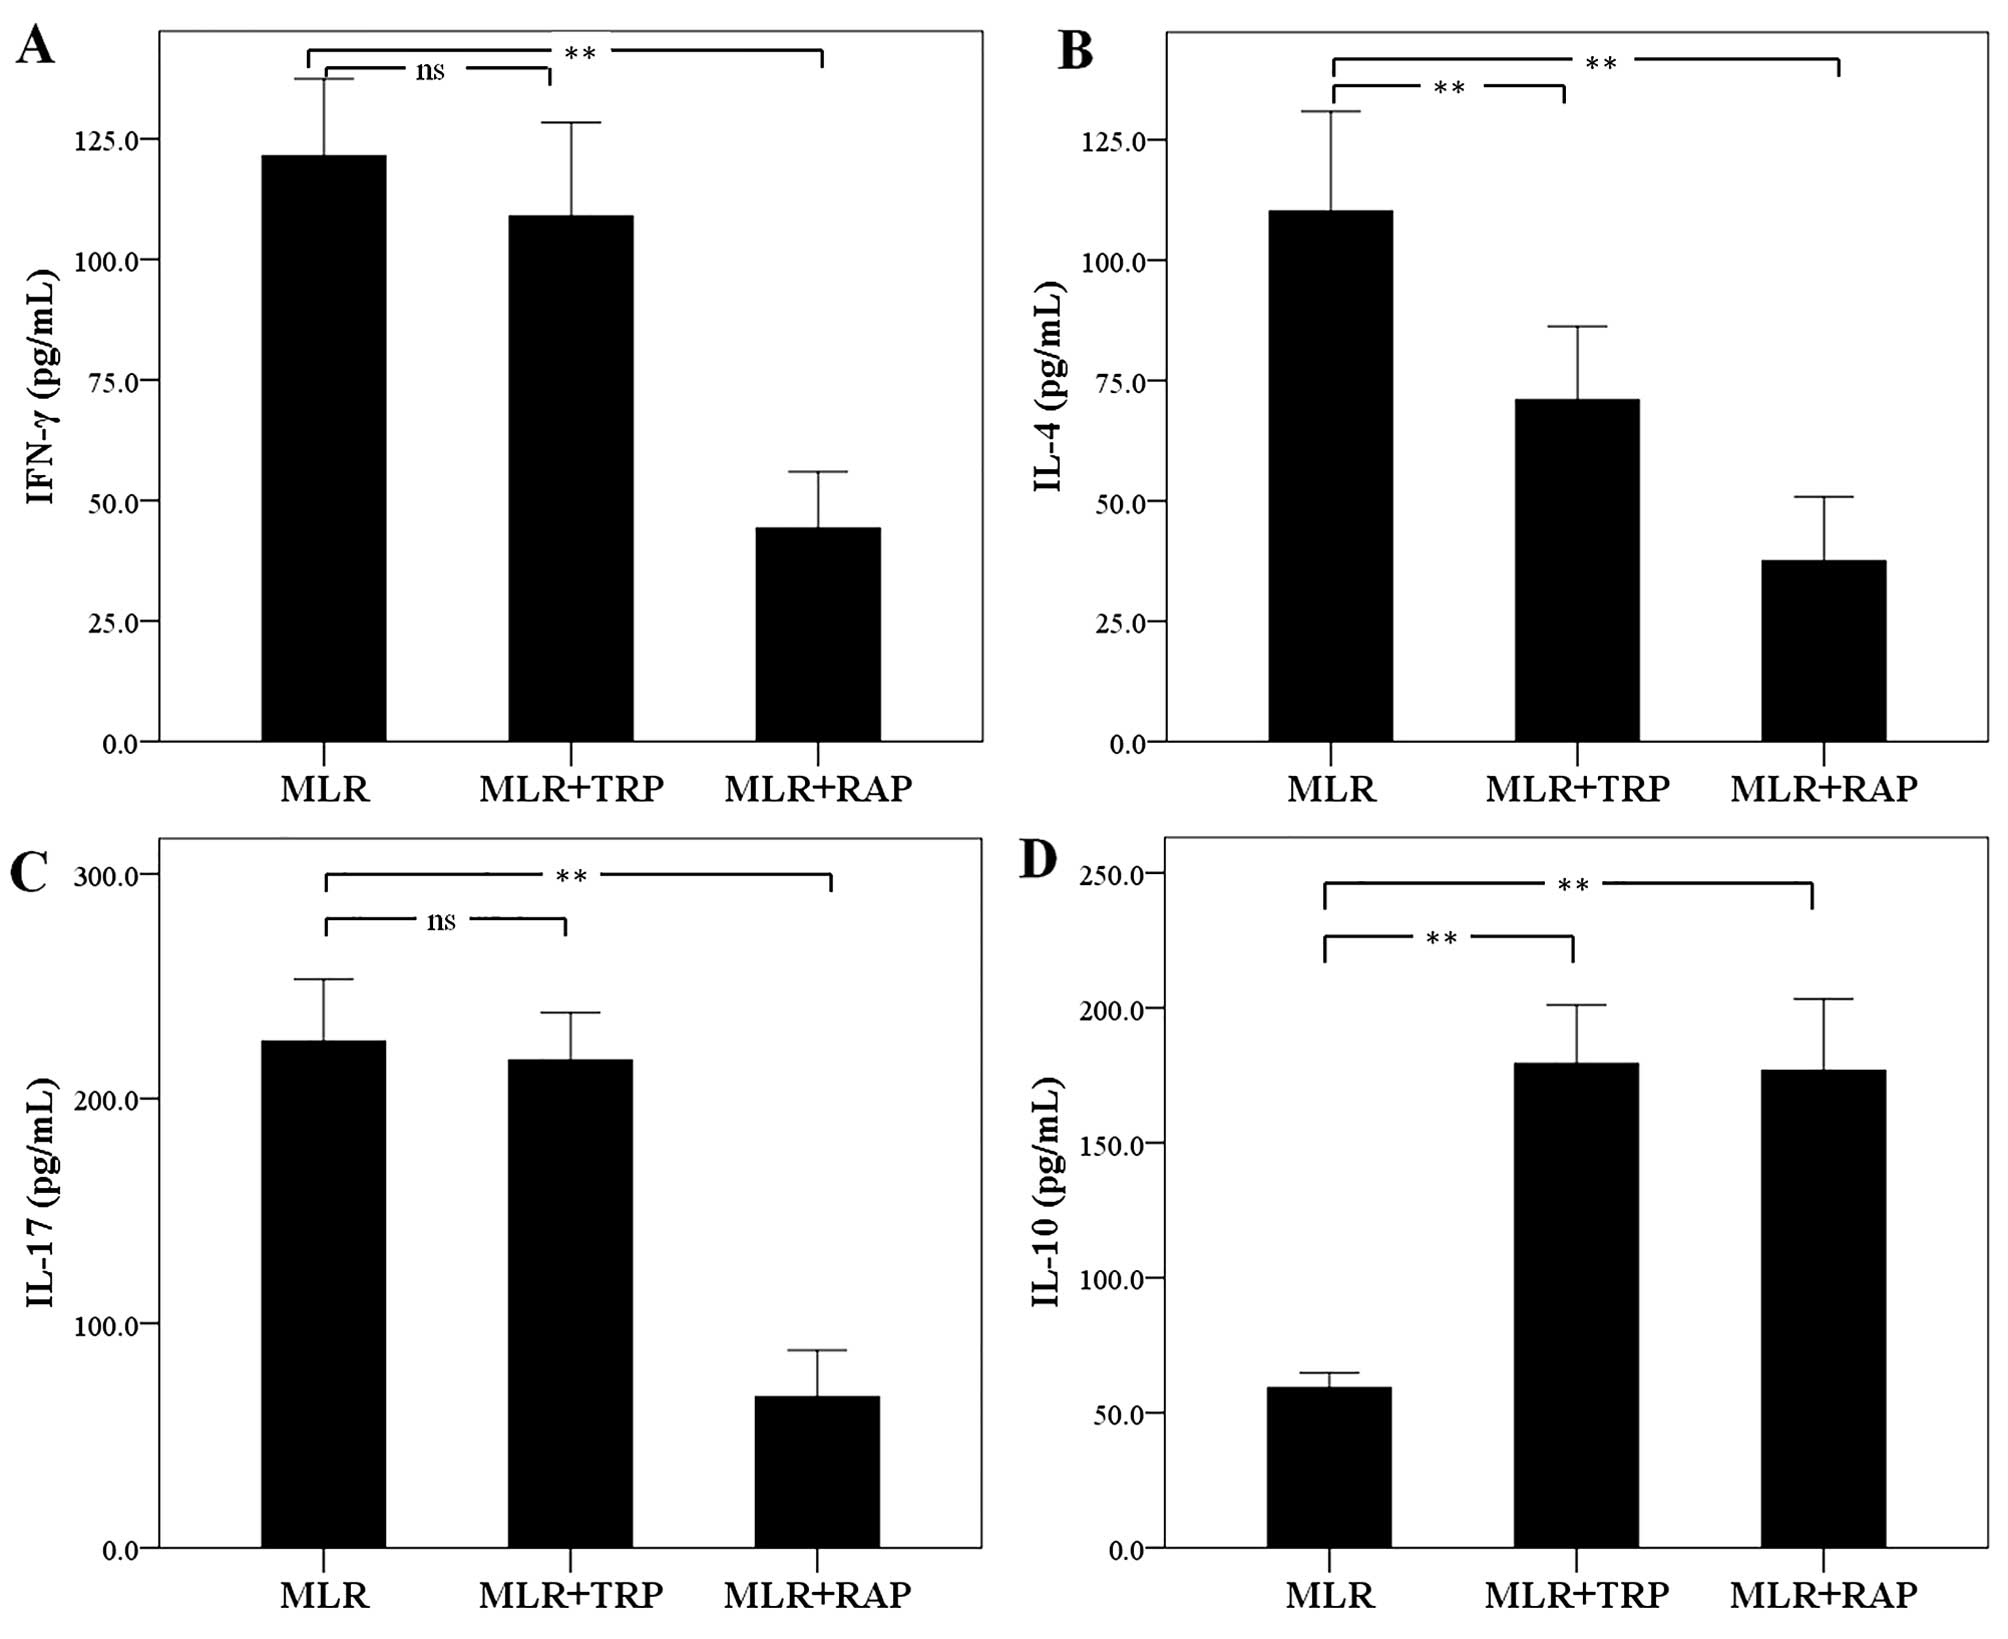
In MLRs, TRP and RAP decrease IL-4
expression and increase IL-10 expression, but RAP also decreases
IFN-γ and IL-17 expression
The concentration of the Th1 cell signature
cytokine, IFN-γ, was not altered significantly in the supernatants
of the TRP-treated MLRs. The level of IFN-γ was 121.50±15.98 pg/ml
in the untreated MLRs and 109.00±19.40 pg/ml in the TRP-treated
MLRs (p=0.205). On the contrary, treatment with RAP decreased IFN-γ
expression to 44.25±11.68 pg/ml (p<0.001; Fig. 7A).
Treatment of MLRs with TRP decreased the production
of the Th2 cell signature cytokine, IL-4, from 110.12±20.79 to
71.00±15.22 pg/ml (p<0.001). Treatment with RAP also decreased
the IL-4 concentration to 37.50±13.38 pg/ml (p<0.001; Fig. 7B).
The expression of the signature cytokine of the Th17
cells, IL-17, remained unaffected by TRP, with a concentration of
225.37±27.71 pg/ml in the untreated MLRs and 217.12±21.14 pg/ml in
the TRP-treated MLRs (p=0.382). However, treatment with RAP
significantly decreased the IL-17 concentration to 67.25±20.71
pg/ml (p<0.001; Fig. 7C).
As regards the cytokine, IL-10, which is produced by
Treg and by certain macrophages, treatment of the MLRs with both
TRP and RAP increased its concentration. More precisely, TRP
increased the IL-10 concentration from 59.26±5.55 in the untreated
cells to 179.37±21.72 pg/ml (p<0.001) in the TRP-treated cells.
Treatment with RAP increased the IL-10 concentration to
176.75±26.48 pg/ml (p<0.001; Fig.
7D).
Discussion
In this study, the effects of GCN2 kinase activation
or mTORC1 inhibition, the two systems able to sense amino acid
deprivation, on primary human alloreactive CD4+ T-cells
were evaluated. For this purpose, the GCN2 kinase activator, TRP,
and the mTORC1 inhibitor, RAP, were used at concentrations selected
according to previous experimental data or clinical recommendations
(7,12–14). Cytotoxicity assay revealed that
neither 0.25 mM TRP nor 10 nM RAP exhibited considerable toxicity
in the context of MLRs.
In order to determine whether the working
concentrations of TRP and RAP used were adequate, their effects on
GCN2 kinase and mTORC1 activities were evaluated in CD4+
T-cells isolated from the MLRs. TRP enhanced the activity of GCN2
kinase, assessed by the level of phosphorylation of its substrate,
eIF2α (9), whereas mTORC1
activity remained unaffected. Accordingly, RAP reduced mTORC1
activity, assessed by the level of phosphorylation of its
substrate, p70S6K (10,11), without altering GCN2 kinase
activity.
In MLRs, both TRP and RAP decreased cell
proliferation. They also induced the apoptosis of CD4+
T-cells isolated from the MLRs, assessed by the level of activated
CC3, a point at which all the apoptotic pathways converge (21). It is known that in eukaryotic
cells, both GCN2 kinase activation and mTORC1 inhibition decrease
cell proliferation and induce apoptosis. Halofuginone, which
activates GCN2 kinase and also inhibits transforming growth
factor-β (TGF-β) signal transduction (22), suppresses T-cell proliferation and
induces apoptosis (23). In
addition, IDO through tryptophan depletion and GCN2 kinase
activation, suppresses proliferation (7,13),
and induces the apoptosis of T-cells (24,25). The inhibition of mTORC1 also
decreases the proliferation and induces the apoptosis of T-cells
(10,26,27).
The tumor suppressor p53 plays a central role in
controlling cell proliferation by inducing G1-phase cell cycle
arrest through the activation of the transcription of p21. It also
induces apoptosis (28). In the
case of TRP treatment, decreased cell proliferation and increased
CC3 expression were accompanied by an increased p53 expression in
CD4+ T-cells isolated from the MLRs. TRP also increased
p21 expression. Thus, upon GCN2 kinase activation, p53 increases
and may contribute to both decreased proliferation and increased
apoptosis. Interestingly, a previous study demonstrated that IDO,
through TRP depletion and GCN2 kinase activation, increases p53
expression in human T-cells, resulting in a p53-dependent
suppression of cell proliferation (13). Contrary to TRP, RAP decreased p53
expression and the expression of its transcriptional target, p21,
in CD4+ T-cells isolated from the MLRs, indicating that
this compound decreases cell proliferation and induces apoptosis in
a p53-independent manner, a result that also has been detected in
various cancer cell lines (29,30), the human Molt-4 T-cell line
included (27).
Next, the effects of GCN2 kinase activation or mTOR
inhibition on CD4+ T-cell differentiation were evaluated
by assessing the expression of the signature transcription factors
of CD4+ T-cell subsets, FoxP3 for Treg, RORγt for Th17,
T-bet for Th1 and GATA-3 for Th2 (31). TRP affected, and more precisely
decreased, only the signature transcription factor of Th2, GATA-3.
Generally, the effect of GCN2 kinase activation on CD4+
T-cell differentiation is an area which has not been extensively
studied. There are studies available on the effect of IDO on the
differentiation of these cells, which however, concluded in
contradictory results. For instance, it has been demonstrated that
IDO promotes Treg differentiation (32), while others have failed to detect
such an effect (33). The
differential experimental systems and species used may be
responsible for these discrepancies. In the present study, primary
human cells and a validated model of alloreactivity were used. It
is also notable that apart from GCN2 kinase activation, the
IDO-produced kynurenine pathway products may play a role in
CD4+ T-cell differentiation (34). In this study, treatment of MLRs
with RAP exerted a more profound effect on CD4+ T-cell
differentiation. RAP decreased the expression of the signature
transcription factors of all the evaluated effector CD4+
T-cell subsets, i.e., T-bet of Th1, GATA-3 of Th2 and RORγt of
Th17. On the contrary, RAP increased the expression of FoxP3, the
signature transcription factor of Treg. This is in accordance with
the fact that mouse mTOR-deficient CD4+ T-cells fail to
differentiate into Th1, Th2 and Th17 subsets under proper
conditions, while they preferably differentiate into the Treg
subset (35). However, between
the two mTOR complexes, RAP inhibits only mTORC1 (10), and there are elegant studies
showing that it is the mTORC2 that governs Th2 differentiation
(36–38). Nevertheless, in the present study,
cells were treated with RAP for 1 week, and such prolonged
treatment with this compound has been shown to inhibit mTORC2
assembly and function (39).
The differentiation towards Th17 or Treg is of
particular interest, since the Th17/Treg balance plays a
significant role in various autoimmune diseases (31), as well as in organ transplantation
(40). The Th17/Treg ratio is
governed, and upregulated, by the transcription factor, HIF-1α
(41,42). In this study, treatment of MLRs
with RAP resulted in a decreased HIF-1α level in the
CD4+ T-cells, which was expected (43), and is in agreement with the
RAP-induced increase in FoxP3 expression and a decrease in RORγt
expression. On the contrary, CD4+ T-cells from MLRs
treated with TRP exhibited higher HIF-1α levels; however, the
levels of FoxP3 or RORγt were not altered in these cells. The
reason for GCN2 kinase-induced HIF-1α upregulation remains to be
evaluated, although it may be p53-mediated (44,45). However, accumulated HIF-1α is not
always active (46). The
discrepancy between the TRP-induced increase in HIF-1α levels
accompanied however by stable FoxP3 and RORγt levels was evaluated
by examining HIF-1α activity on specific target proteins. Indeed,
the expression of LDH-A, a well-known transcriptional target of
HIF-1α, was assessed and found to be decreased. Consequently,
accumulated HIF-1α in CD4+ T-cells from TRP-treated MLRs
remained non-functional. This may be the result of the competition
between p53 and HIF-1α for limited amounts of the transcriptional
co-activator, p300 (47).
Finally, we evaluated the levels of signature
cytokines for the evaluated Th subsets, i.e., of IFN-γ for Th1,
IL-4 for Th2, IL-17 for Th17 and IL-10 for Treg (31). RAP decreased the production of
IFN-γ, IL-4 and IL-17, whereas it increased the level of IL-10.
These changes were parallel to the observed alterations of the Th
subset signature transcription factors. TRP reduced the IL-4
concentration, which is in the same consensus with the decreased
GATA-3 expression. However, TRP increased IL-10 production, whereas
it did not affect the FoxP3 level. This discrepancy deserves
evaluation, but may be the result of IL-10 production by other cell
types. For instance, apart from Treg, M2 type macrophages produce
IL-10, and IDO promotes this type of macrophages (48). RAP exerts the opposite effect
(49), excluding M2 macrophages
as an alternative source of IL-10 in RAP-treated MLRs.
In conclusion, in primary human alloreactive
CD4+ T-cells, the two systems that sense amino acid
deprivation affect cell proliferation, apoptosis and
differentiation in different ways or through different mechanisms.
Both mTOR inhibition and GCN2 kinase activation exert
immunosuppressive effects, since they inhibit cell proliferation
and induce apoptosis. As regards CD4+ T-cell
differentiation, mTOR inhibition exerts a more profound effect,
since it suppresses differentiation into Th1, Th2 and Th17, while
it induces Treg differentiation. On the contrary, activation of
GCN2 kinase suppresses only Th2 differentiation. Thus, GCN2 kinase
is a potential target for novel immunosuppressive medications with
possibly a more profound effect on the treatment of Th2-mediated
disorders.
References
|
1
|
Bronte V and Zanovello P: Regulation of
immune responses by L-arginine metabolism. Nat Rev Immunol.
5:641–654. 2005. View
Article : Google Scholar : PubMed/NCBI
|
|
2
|
Mellor AL and Munn DH: IDO expression by
dendritic cells: Tolerance and tryptophan catabolism. Nat Rev
Immunol. 4:762–774. 2004. View
Article : Google Scholar : PubMed/NCBI
|
|
3
|
Dong J, Qiu H, Garcia-Barrio M, Anderson J
and Hinnebusch AG: Uncharged tRNA activates GCN2 by displacing the
protein kinase moiety from a bipartite tRNA-binding domain. Mol
Cell. 6:269–279. 2000. View Article : Google Scholar : PubMed/NCBI
|
|
4
|
Gallinetti J, Harputlugil E and Mitchell
JR: Amino acid sensing in dietary-restriction-mediated longevity:
Roles of signal-transducing kinases GCN2 and TOR. Biochem J.
449:1–10. 2013. View Article : Google Scholar :
|
|
5
|
Sancak Y, Peterson TR, Shaul YD, Lindquist
RA, Thoreen CC, Bar-Peled L and Sabatini DM: The Rag GTPases bind
raptor and mediate amino acid signaling to mTORC1. Science.
320:1496–1501. 2008. View Article : Google Scholar : PubMed/NCBI
|
|
6
|
Kim E, Goraksha-Hicks P, Li L, Neufeld TP
and Guan KL: Regulation of TORC1 by Rag GTPases in nutrient
response. Nat Cell Biol. 10:935–945. 2008. View Article : Google Scholar : PubMed/NCBI
|
|
7
|
Eleftheriadis T, Pissas G, Antoniadi G,
Liakopoulos V and Stefanidis I: Indoleamine 2,3-dioxygenase
depletes tryptophan, activates general control non-derepressible 2
kinase and down-regulates key enzymes involved in fatty acid
synthesis in primary human CD4+ T cells. Immunology.
146:292–300. 2015. View Article : Google Scholar : PubMed/NCBI
|
|
8
|
Kilberg MS, Shan J and Su N:
ATF4-dependent transcription mediates signaling of amino acid
limitation. Trends Endocrinol Metab. 20:436–443. 2009. View Article : Google Scholar : PubMed/NCBI
|
|
9
|
Castilho BA, Shanmugam R, Silva RC, Ramesh
R, Himme BM and Sattlegger E: Keeping the eIF2 alpha kinase Gcn2 in
check. Biochim Biophys Acta. 1843:1948–1968. 2014. View Article : Google Scholar : PubMed/NCBI
|
|
10
|
Laplante M and Sabatini DM: mTOR signaling
at a glance. J Cell Sci. 122:3589–3594. 2009. View Article : Google Scholar : PubMed/NCBI
|
|
11
|
Ma XM and Blenis J: Molecular mechanisms
of mTOR-mediated translational control. Nat Rev Mol Cell Biol.
10:307–318. 2009. View
Article : Google Scholar : PubMed/NCBI
|
|
12
|
Shihab F, Christians U, Smith L, Wellen JR
and Kaplan B: Focus on mTOR inhibitors and tacrolimus in renal
transplantation: Pharmacokinetics, exposure-response relationships,
and clinical outcomes. Transpl Immunol. 31:22–32. 2014. View Article : Google Scholar : PubMed/NCBI
|
|
13
|
Eleftheriadis T, Pissas G, Antoniadi G,
Spanoulis A, Liakopoulos V and Stefanidis I: Indoleamine
2,3-dioxygenase increases p53 levels in alloreactive human T cells,
and both indoleamine 2,3-dioxygenase and p53 suppress glucose
uptake, glycolysis and proliferation. Int Immunol. 26:673–684.
2014. View Article : Google Scholar : PubMed/NCBI
|
|
14
|
Munn DH, Sharma MD, Baban B, Harding HP,
Zhang Y, Ron D and Mellor AL: GCN2 kinase in T cells mediates
proliferative arrest and anergy induction in response to
indoleamine 2,3-dioxygenase. Immunity. 22:633–642. 2005. View Article : Google Scholar : PubMed/NCBI
|
|
15
|
Alexander AM, Crawford M, Bertera S,
Rudert WA, Takikawa O, Robbins PD and Trucco M: Indoleamine
2,3-dioxygenase expression in transplanted NOD Islets prolongs
graft survival after adoptive transfer of diabetogenic splenocytes.
Diabetes. 51:356–365. 2002. View Article : Google Scholar : PubMed/NCBI
|
|
16
|
Beutelspacher SC, Pillai R, Watson MP, Tan
PH, Tsang J, McClure MO, George AJ and Larkin DF: Function of
indoleamine 2,3-dioxygenase in corneal allograft rejection and
prolongation of allograft survival by over-expression. Eur J
Immunol. 36:690–700. 2006. View Article : Google Scholar : PubMed/NCBI
|
|
17
|
Li Y, Tredget EE, Ghaffari A, Lin X,
Kilani RT and Ghahary A: Local expression of indoleamine
2,3-dioxygenase protects engraftment of xenogeneic skin substitute.
J Invest Dermatol. 126:128–136. 2006. View Article : Google Scholar : PubMed/NCBI
|
|
18
|
Munn DH, Zhou M, Attwood JT, Bondarev I,
Conway SJ, Marshall B, Brown C and Mellor AL: Prevention of
allogeneic fetal rejection by tryptophan catabolism. Science.
281:1191–1193. 1998. View Article : Google Scholar : PubMed/NCBI
|
|
19
|
Sato T, Deiwick A, Raddatz G, Koyama K and
Schlitt HJ: Interactions of allogeneic human mononuclear cells in
the two-way mixed leucocyte culture (MLC): Influence of cell
numbers, subpopulations and cyclosporin. Clin Exp Immunol.
115:301–308. 1999. View Article : Google Scholar : PubMed/NCBI
|
|
20
|
Lowe G and Tansley G: An investigation of
the mechanism of activation of tryptophan by tryptophanyl-tRNA
synthetase from beef pancreas. Eur J Biochem. 138:597–602. 1984.
View Article : Google Scholar : PubMed/NCBI
|
|
21
|
Fadeel B and Orrenius S: Apoptosis: A
basic biological phenomenon with wide-ranging implications in human
disease. J Intern Med. 258:479–517. 2005. View Article : Google Scholar : PubMed/NCBI
|
|
22
|
Pines M and Spector I: Halofuginone - the
multifaceted molecule. Molecules. 20:573–594. 2015. View Article : Google Scholar : PubMed/NCBI
|
|
23
|
Chu TL, Guan Q, Nguan CY and Du C:
Halofuginone suppresses T cell proliferation by blocking proline
uptake and inducing cell apoptosis. Int Immunopharmacol.
16:414–423. 2013. View Article : Google Scholar : PubMed/NCBI
|
|
24
|
Forouzandeh F, Jalili RB, Germain M,
Duronio V and Ghahary A: Skin cells, but not T cells, are resistant
to indoleamine 2, 3-dioxygenase IDO) expressed by allogeneic
fibroblasts. Wound Repair Regen. 16:379–387. 2008. View Article : Google Scholar : PubMed/NCBI
|
|
25
|
Habibi D, Jalili RB, Forouzandeh F, Ong CJ
and Ghahary A: High expression of IMPACT protein promotes
resistance to indoleamine 2,3-dioxygenase-induced cell death. J
Cell Physiol. 225:196–205. 2010. View Article : Google Scholar : PubMed/NCBI
|
|
26
|
Weichhart T, Costantino G, Poglitsch M,
Rosner M, Zeyda M, Stuhlmeier KM, Kolbe T, Stulnig TM, Hörl WH,
Hengstschläger M, et al: The TSC-mTOR signaling pathway regulates
the innate inflammatory response. Immunity. 29:565–577. 2008.
View Article : Google Scholar : PubMed/NCBI
|
|
27
|
Choi SJ, You HS and Chung SY:
Rapamycin-induced cytotoxic signal transduction pathway. Transplant
Proc. 40:2737–2739. 2008. View Article : Google Scholar : PubMed/NCBI
|
|
28
|
Brady CA and Attardi LD: p53 at a glance.
J Cell Sci. 123:2527–2532. 2010. View Article : Google Scholar : PubMed/NCBI
|
|
29
|
Metcalfe SM, Canman CE, Milner J, Morris
RE, Goldman S and Kastan MB: Rapamycin and p53 act on different
pathways to induce G1 arrest in mammalian cells. Oncogene.
15:1635–1642. 1997. View Article : Google Scholar
|
|
30
|
Miyake N, Chikumi H, Takata M, Nakamoto M,
Igishi T and Shimizu E: Rapamycin induces p53-independent apoptosis
through the mitochondrial pathway in non-small cell lung cancer
cells. Oncol Rep. 28:848–854. 2012.PubMed/NCBI
|
|
31
|
Raphael I, Nalawade S, Eagar TN and
Forsthuber TG: T cell subsets and their signature cytokines in
autoimmune and inflammatory diseases. Cytokine. 74:5–17. 2015.
View Article : Google Scholar
|
|
32
|
Fallarino F, Grohmann U, You S, McGrath
BC, Cavener DR, Vacca C, Orabona C, Bianchi R, Belladonna ML, Volpi
C, et al: The combined effects of tryptophan starvation and
tryptophan catabolites down-regulate T cell receptor zeta-chain and
induce a regulatory phenotype in naive T cells. J Immunol.
176:6752–6761. 2006. View Article : Google Scholar : PubMed/NCBI
|
|
33
|
Ito H, Ando T, Ando K, Ishikawa T, Saito
K, Moriwaki H and Seishima M: Induction of hepatitis B virus
surface antigen-specific cytotoxic T lymphocytes can be
up-regulated by the inhibition of indoleamine 2, 3-dioxygenase
activity. Immunology. 142:614–623. 2014. View Article : Google Scholar : PubMed/NCBI
|
|
34
|
Mezrich JD, Fechner JH, Zhang X, Johnson
BP, Burlingham WJ and Bradfield CA: An interaction between
kynurenine and the aryl hydrocarbon receptor can generate
regulatory T cells. J Immunol. 185:3190–3198. 2010. View Article : Google Scholar : PubMed/NCBI
|
|
35
|
Delgoffe GM, Kole TP, Zheng Y, Zarek PE,
Matthews KL, Xiao B, Worley PF, Kozma SC and Powell JD: The mTOR
kinase differentially regulates effector and regulatory T cell
lineage commitment. Immunity. 30:832–844. 2009. View Article : Google Scholar : PubMed/NCBI
|
|
36
|
Pollizzi KN and Powell JD: Regulation of T
cells by mTOR: The known knowns and the known unknowns. Trends
Immunol. 36:13–20. 2015. View Article : Google Scholar :
|
|
37
|
Lee K, Gudapati P, Dragovic S, Spencer C,
Joyce S, Killeen N, Magnuson MA and Boothby M: Mammalian target of
rapamycin protein complex 2 regulates differentiation of Th1 and
Th2 cell subsets via distinct signaling pathways. Immunity.
32:743–753. 2010. View Article : Google Scholar : PubMed/NCBI
|
|
38
|
Delgoffe GM, Pollizzi KN, Waickman AT,
Heikamp E, Meyers DJ, Horton MR, Xiao B, Worley PF and Powell JD:
The kinase mTOR regulates the differentiation of helper T cells
through the selective activation of signaling by mTORC1 and mTORC2.
Nat Immunol. 12:295–303. 2011. View Article : Google Scholar : PubMed/NCBI
|
|
39
|
Sarbassov DD, Ali SM, Sengupta S, Sheen
JH, Hsu PP, Bagley AF, Markhard AL and Sabatini DM: Prolonged
rapamycin treatment inhibits mTORC2 assembly and Akt/PKB. Mol Cell.
22:159–168. 2006. View Article : Google Scholar : PubMed/NCBI
|
|
40
|
Askar M: T helper subsets and regulatory T
cells: Rethinking the paradigm in the clinical context of solid
organ transplantation. Int J Immunogenet. 41:185–194. 2014.
View Article : Google Scholar : PubMed/NCBI
|
|
41
|
Pan F, Barbi J and Pardoll DM:
Hypoxia-inducible factor 1: A link between metabolism and T cell
differentiation and a potential therapeutic target. Oncoimmunology.
1:510–515. 2012. View Article : Google Scholar : PubMed/NCBI
|
|
42
|
Dang EV, Barbi J, Yang HY, Jinasena D, Yu
H, Zheng Y, Bordman Z, Fu J, Kim Y, Yen HR, et al: Control of
T(H)17/T(reg) balance by hypoxia-inducible factor 1. Cell.
146:772–784. 2011. View Article : Google Scholar : PubMed/NCBI
|
|
43
|
Hudson CC, Liu M, Chiang GG, Otterness DM,
Loomis DC, Kaper F, Giaccia AJ and Abraham RT: Regulation of
hypoxia-inducible factor 1alpha expression and function by the
mammalian target of rapamycin. Mol Cell Biol. 22:7004–7014. 2002.
View Article : Google Scholar : PubMed/NCBI
|
|
44
|
Sutton TA, Wilkinson J, Mang HE, Knipe NL,
Plotkin Z, Hosein M, Zak K, Wittenborn J and Dagher PC: p53
regulates renal expression of HIF-1{alpha} and pVHL under
physiological conditions and after ischemia-reperfusion injury. Am
J Physiol Renal Physiol. 295:F1666–F1677. 2008. View Article : Google Scholar : PubMed/NCBI
|
|
45
|
Nieminen AL, Qanungo S, Schneider EA,
Jiang BH and Agani FH: Mdm2 and HIF-1alpha interaction in tumor
cells during hypoxia. J Cell Physiol. 204:364–369. 2005. View Article : Google Scholar : PubMed/NCBI
|
|
46
|
Kaluz S, Kaluzová M and Stanbridge EJ:
Does inhibition of degradation of hypoxia-inducible factor (HIF)
alpha always lead to activation of HIF? Lessons learnt from the
effect of proteasomal inhibition on HIF activity. J Cell Biochem.
104:536–544. 2008. View Article : Google Scholar
|
|
47
|
Schmid T, Zhou J, Köhl R and Brüne B: p300
relieves p53-evoked transcriptional repression of hypoxia-inducible
factor-1 (HIF-1). Biochem J. 380:289–295. 2004. View Article : Google Scholar : PubMed/NCBI
|
|
48
|
François M, Romieu-Mourez R, Li M and
Galipeau J: Human MSC suppression correlates with cytokine
induction of indoleamine 2,3-dioxygenase and bystander M2
macrophage differentiation. Mol Ther. 20:187–195. 2012. View Article : Google Scholar
|
|
49
|
Mercalli A, Calavita I, Dugnani E, Citro
A, Cantarelli E, Nano R, Melzi R, Maffi P, Secchi A, Sordi V, et
al: Rapamycin unbalances the polarization of human macrophages to
M1. Immunology. 140:179–190. 2013. View Article : Google Scholar : PubMed/NCBI
|