Introduction
In recent decades, prostate cancer (PCa) has become
one of the most common types of cancers in Europe and in the United
States (1). The American Cancer
Society predicted that there would be 220,800 new cases of PCa with
27,540 deaths in 2015 (2). The
pathogeny and risk factors of PCa are complex and not yet fully
understood. Thus, it appears to be urgent and meaningful to further
investigate the tumor-associated proteins and PCa pathogenesis. The
rise of omics technologies in recent years and their use in PCa
research have delivered a number of novel potential biomarkers for
PCa (3). Among the available
technologies, the ongoing improvements in proteomics technologies
have resulted in increased information on protein behavior during
cellular processes. The exponential accumulation of proteomics data
has the potential to improve the treatment and prognosis of PCa by
shedding light on the most important events that regulate prostate
cells under normal and pathophysiological conditions (4). The standard proteomics experimental
strategies are designed to compare proteomics signatures of cells
in normal and anomalous states. As a result, a set of proteins with
differential expression levels as a consequence of the different
states of the cells is delivered. To fully understand the cellular
machinery that leads to the different states, simply listing these
identified proteins is not sufficient. As protein-protein
interactions (PPI) are the key mechanisms of almost all biological
processes, the characterization of all possible interactions
connecting the identified proteins is required (5). At the same time, using PPI to form a
molecular regulatory network, which includes key nodes and signal
transduction pathways, not only helps to further understand the
biological processes from a systems perspective, but can also be
used to predict and evaluate the corresponding treatments,
providing a theoretical basis for the search for novel drug targets
(6). Nevertheless, limited
research associated with protein interactions specific to PCa
proteomics-related proteins has been conducted. Therefore, to put
our proteomics data in a biological context, we used a systems
biology approach (the platform of PCa-related protein networks
based on the available proteomics literature data) as a rational
strategy for the identification of novel specific markers and novel
therapeutic targets.
Network science is gradually altering our view of
cell biology by offering unforeseen possibilities to understand the
internal organization of a cell (7). Rather than the traditional approach
of studying individual proteins or genes, a systematic
investigation of PCa proteins in the human PPI network may provide
important biological information for uncovering the molecular
mechanisms of PCa (8). In recent
years, there have been a number of successful studies that have
found important target genes and markers by constructing and
analyzing the protein interaction networks associated with
diseases. In 2011, Lee et al constructed PPI networks of
abnormally expressed genes for schizophrenia, bipolar disease and
major depression, and identified several disease markers, such as
strawberry notch homolog 2 (Drosophila) (SBNO2) for
schizophrenia, SEC24 homolog C, COPII coat complex component
(SEC24C) for bipolar disorder and serrate, RNA effector molecule
(SRRT) for major depression (9).
In April 2013, Ran et al constructed and analyzed PPI
networks for essential hypertension (EH), and suggested that blood
pressure variations related to EH are orchestrated by an integrated
PPI network with the protein encoded by the nitric oxide synthase 3
(endothelial cell) (NOS3) gene (10). Recently, in August 2014, Rakshit
et al constructed PPI networks based on gene expression
profiles of Parkinson's disease (PD) and identified 37 network
biomarkers that can be used as potential therapeutic targets for PD
applications developments (7).
In this study, we mined the differentially expressed
proteins (DEPs) verified or reported more than 2 times in the
proteomics literature of PCa. The DEPs were regarded as seed
proteins to construct an extended PPI network, which not only
consisted of the seed proteins, but also their direct PPI neighbors
and the interactions between these proteins. Topological analyses
were performed to determine the significant network biomarkers. The
association of these biomarkers with the genesis of PCa was
investigated. The backbone network constructed of key nodes and the
subnetwork of the shortest paths, as well as the densely connected
region, were also investigated. Thus, the findings of this study
may provide insight into the potential targets for developing novel
treatment strategies for PCa.
Data collection and methods
Mining proteomics literature of PCa and
screening criteria
We used the PubMed Database as the main source for
literature retrieval and adopted an advanced search option by
inputting '(prostate cancer[Title]) AND Proteomics' for literature
before July 26th, 2015. The search was limited to publications in
English. The inclusion criteria were the following: i) studies on
the human species. ii) Studies using PCa tissue samples, including
samples obtained by prostate needle biopsies and radical
prostatectomy. The key to a more effective diagnosis, prognosis and
therapeutic management of PCa could lie in the direct analysis of
cancer tissue. Prostate tissue has the advantage over other
biomaterials, that in addition to being a rich source of potential
PCa biomarkers, it offers the possibility to clarify the mechanisms
at the basis of the transformation of a normal prostate cell to a
tumor cell and subsequent progression to a metastatic state
(11). iii) Studies involved in
the comparison between the tumor and normal or benign tissues,
including PCa and benign prostatic hyperplasia (BPH), PCa and
adjacent benign tissues or PCa and normal tissues. Exclusion
criteria were the following: i) Studies on non-human tissue. ii)
Studies on the PCa cell lines. Human tumor tissues and cell lines
cultured in vitro are each valuable resources. However, the
in vitro environment may cause changes in protein expression
level of PCa cells. Therefore, in this study, we were limited to
human tumor tissues. iii) Studies on samples of biological fluids,
including serum, plasma, urine, seminal plasma and expressed
prostatic secretions. iv) Studies only involved in tumor
aggressiveness or metastasis. v) Studies on the effects of certain
interventions on the protein expression profiles. vi) Studies which
did not supply names or accession numbers of DEPs. vii) Literature
reviews.
Extraction of DEPs associated with PCa
proteomics
To prevent the omission of DEPs, we manually carried
out the evaluation of publications in line with the above
conditions; a total of 175 DEPs was extracted. The DEPs were turned
into corresponding official gene symbols with the Protein
Information Resource (PIR, Georgetown University Medical Center,
Washington, DC, USA). The PIR is an integrated public
bioinformatics resource to support genomic, proteomic and systems
biology research and scientific studies (12).
Since proteomics technologies use complex
instrumentation and costly consumables, the majority of
investigations have a small sample size, and this, coupled with the
relatively low reliability of the proteomics technology itself,
leads to the reliability of the final results being questionable.
We believed that if different proteomics studies have obtained the
same DEPs, the reliability of the proteins associated with PCa
would be greatly enhanced. Therefore, to improve the accuracy and
reliability of the DEPs to the maximum extent, we extracted the
DEPs verified or reported more than 2 times from different
proteomics studies as seed proteins. The count criteria were as
follows: i) If in one article several DEPs have the same official
gene symbol, that was counted as once. ii) If in one article some
DEPs were selected by the proteomics methods as the protein of
interest to be further experimentally verified (by western blot
analysis or immunohistochemistry), that was counted as twice. A
total of 41 DEPs were obtained (Table
I) as the seed proteins of the construction of the PCa
proteomics PPI network.
 | Table IList of the 41 differentially
expressed proteins between prostate cancer and normal or benign
tissues by literature mining and screening the reported
frequencies. |
Table I
List of the 41 differentially
expressed proteins between prostate cancer and normal or benign
tissues by literature mining and screening the reported
frequencies.
| Gene ID | Symbol (Refs.) | Description | Reported
frequency |
|---|
| 1674 | DES (11,48–52) | Desmin | 6 |
| 3329 | HSPD1 (11,48,50,51,53) | Heat shock 60 kDa
protein 1 (chaperonin) | 5 |
| 3309 | HSPA5 (48,50,51) | Heat shock 70 kDa
protein 5 (glucose-regulated protein, 78 kDa) | 3 |
| 3875 | KRT18 (11,50,51) | Keratin 18, type
I | 3 |
| 3856 | KRT8 (11,50,51) | Keratin 8, type
II | 3 |
| 7414 | VCL (48,50,54) | Vinculin | 3 |
| 55 | ACPP (50,53) | Acid phosphatase,
prostate | 2 |
| 213 | ALB (11,51) | Albumin | 2 |
| 308 | ANXA5 (50,52) | Annexin A5 | 2 |
| 392 | ARHGAP1 (11,50) | Rho GTPase
activating protein 1 | 2 |
| 396 | ARHGDIA (50,51) | Rho GDP
dissociation inhibitor (GDI)α | 2 |
| 563 | AZGP1 (11,50) |
alpha-2-glycoprotein 1, zinc-binding | 2 |
| 822 | CAPG (50,54) | Capping protein
(actin filament), gelsolin-like | 2 |
| 1152 | CKB (51,52) | Creatine kinase,
brain | 2 |
| 30846 | EHD2 (11,48) | EH-domain
containing 2 | 2 |
| 2023 | ENO1 (50,53) | Enolase 1, (α) | 2 |
| 2266 | FGG (50,51) | Fibrinogen gamma
chain | 2 |
| 2288 | FKBP4 (11,50) | FK506 binding
protein 4, 59 kDa | 2 |
| 2638 | GC (11,50) | Group-specific
component (vitamin D binding protein) | 2 |
| 2934 | GSN (48,50) | Gelsolin | 2 |
| 2947 | GSTM3 (50,54) | Glutathione
S-transferase mu 3 (brain) | 2 |
| 2950 | GSTP1 (50,54) | Glutathione
S-transferase pi 1 | 2 |
| 3187 | HNRPH1 (48,50) | Heterogeneous
nuclear ribonucleoprotein H1 (H) | 2 |
| 3313 | HSPA9 (48,51) | Heat shock 70 kDa
protein 9 (mortalin) | 2 |
| 3315 | HSPB1 (48,50) | Heat shock 27 kDa
protein 1 | 2 |
| 3848 | KRT1 (11,50) | Keratin 1, type
II | 2 |
| 3880 | KRT19 (50,51) | Keratin 19, type
I | 2 |
| 5034 | P4HB (50,51) | Prolyl
4-hydroxylase, beta polypeptide | 2 |
| 5245 | PHB (50,51) | Prohibitin | 2 |
| 7052 | TGM2 (49,50) | Transglutaminase
2 | 2 |
| 7163 | TPD52 (48,50) | Tumor protein
D52 | 2 |
| 7168 | TPM1 (49,52) | Tropomyosin 1
(α) | 2 |
| 10383 | TUBB2C (50,51) | Tubulin, beta
2C | 2 |
| 7431 | VIM (48,52) | Vimentin | 2 |
| 3615 | IMPDH2a (54) | IMP (inosine
5′-monophosphate) dehydrogenase 2 | 2 |
| 64087 | MCCC2a (54) | Methylcrotonoyl-CoA
carboxylase 2 (β) | 2 |
| 10631 | POSTNa (48) | Periostin,
osteoblast specific factor | 2 |
| 5500 | PPP1CBa (11) | Protein phosphatase
1, catalytic subunit, beta isozyme | 2 |
| 5694 | PSMB6a (11) | Proteasome
(prosome, macropain) subunit, beta type, 6 | 2 |
| 10131 | TRAP1a (54) | TNF
receptor-associated protein 1 | 2 |
| 7334 | UBE2Na (11) |
Ubiquitin-conjugating enzyme E2N | 2 |
Construction of the PPI network and
extracting the giant component from the extended network
To avoid the loss of protein interactions using a
single database, we used a combination of multiple databases to
construct the network. Although the protein interactions in the
different databases largely overlap, the databases are
complementary (13). We made use
of the POINeT bioinformatics tool to form the human PPI network.
POINeT is currently a relatively popular construction tool that
integrates PPI information collected by various protein databases,
including the Database of Interacting Proteins (DIP), Molecular
INTeraction database (MINT), Biomolecular Interaction Network
Database (BIND), Human Protein Reference Database (HPRD), Mammalian
Protein-Protein Interaction Database (MIPS), MIPS Comprehensive
Yeast Genome Database (CYGD), Biological General Repository for
Interaction Datasets (BioGRID) and NCBI database (14). The PPI networks constructed by
POINeT were then visualized using Cytoscape 3.2.1, which is a
software package available on the internet for biological network
visualization, data integration and interactive network generation
(15). In this study, the
extended network included a giant component and 3 small separate
components derived from 3 seed proteins. This study aimed to
explore the mechanisms responsible for PCa at the system level; the
major central nodes must be in the giant network as the 3 small
separate components consisted of a very small number of nodes, so
only the giant network and its parameters related to the network
theory had been analyzed or processed. To analyze and process the
giant network conveniently, we extracted it from the extended
network.
Topological analysis of the protein
interaction network
The molecular organization can be visualized as a
network of differentially connected nodes. Each node stands for a
protein and the edges represent dynamic interactions. Nodes thereby
receive input and output values as mathematical functions (16). In the theory of the network, the
connectivity degree (k), betweenness centrality (BC) and closeness
centrality (CC) value of nodes are three fundamental parameters
that are usually adopted to evaluate the nodes in a network
(17). The degree, defined as the
number of interacting partner proteins, is the most basic
characteristic of a node. The BC value is the fraction of the
number of shortest paths that pass through each node in a network,
which measures how often the node is located on the shortest paths
between other nodes (18). The
shortest path is the path containing the least number of vertices
between two vertices in a network. A node with a higher BC value
indicates that it has more influence over the information flow in
the network. Therefore, BC values are generally useful indicators
to detect bottlenecks in a network. The CC value is the inverse of
the average length of the shortest paths to/from all other nodes in
the graph and measures how close a node is to other nodes. The node
with the highest CC value is usually the topological center of the
network (18). In this study,
Cytoscape 3.2.1 (15) was used to
calculate the properties of the nodes and perform measurements
under default parameters.
Creation of the backbone network of the
PPI network for PCa
In the theory of the graph, proteins with high BC
values are usually thought to be bottlenecks controlling the
information flow in the transportation network (10). We set the critical node with a
high BC value at 5% of the total nodes in the network. The proteins
with a higher BC value and the links between them will make up a
backbone network. Thus, we extracted the proteins with the top 5%
of BC values and the links between them from the PPI network for
PCa to create a backbone network.
Construction of a subnetwork consisting
of all of the shortest paths between the seed proteins
Even in the giant network, there are a few pairs of
seed proteins that are not connected directly. To construct a
subnetwork in which all proteins associated with PCa are connected
directly or indirectly with the minimum number of nodes, we found
all the shortest paths between every pair of seed proteins.
Pesca3.0 (19), a plug-in for
Cytoscape, was used to calculate the shortest paths between the 41
seed proteins. The subnetwork consists of all nodes in these
shortest paths. The subnetwork indicates the possible minimal
number of connections among the 41 seed proteins responsible for
the genesis of PCa.
Identification of densely connected
regions in the PPI network
Biological networks are likely comprised of several
subnet-works or functional modules contributing to various diverse
biological processes. A node may have negligible impact on the
global network or global properties, yet is influential on a
subnetwork with specific functionality (14). Therefore, we used Mcode1.4.1
(20) (a plug-in for Cytoscape)
to cluster the whole network to identify densely connected regions.
The module division parameters were as follows: degree cut-off, 2;
node score cut-off, 0.2; k-core, 2; and max depth, 100. After
clustering the PPI network, function annotation of the nodes
located in the cluster was performed by DAVID Bioinformatics
Resources 6.7 (the Database for Annotation, Visualization and
Integrated Discovery, from National Institute of Allergy and
Infectious Diseases, NIH, USA) (21).
The function annotation includes GO (Gene Ontology)
analysis and KEGG (Kyoto Encyclopedia of Genes and Genomes)
pathways analysis. GO categories analysis provides a common
descriptive framework to functionally annotate and classify gene
sets. GO categories are organized into 3 groups: biological
process, cellular component and molecular function. KEGG pathways
bring together the molecular interactions and the reaction networks
through an artificial pathway diagram.
The Benjamini method was used to control the false
discovery rate (FDR) to correct the P-value. The Benjamini method
is useful in large-scale multiple testing problems based on
discrete test statistics and derive its basic asymptotic (as the
number of hypotheses tends to infinity) properties, subsuming
earlier results.
Results
PPI network
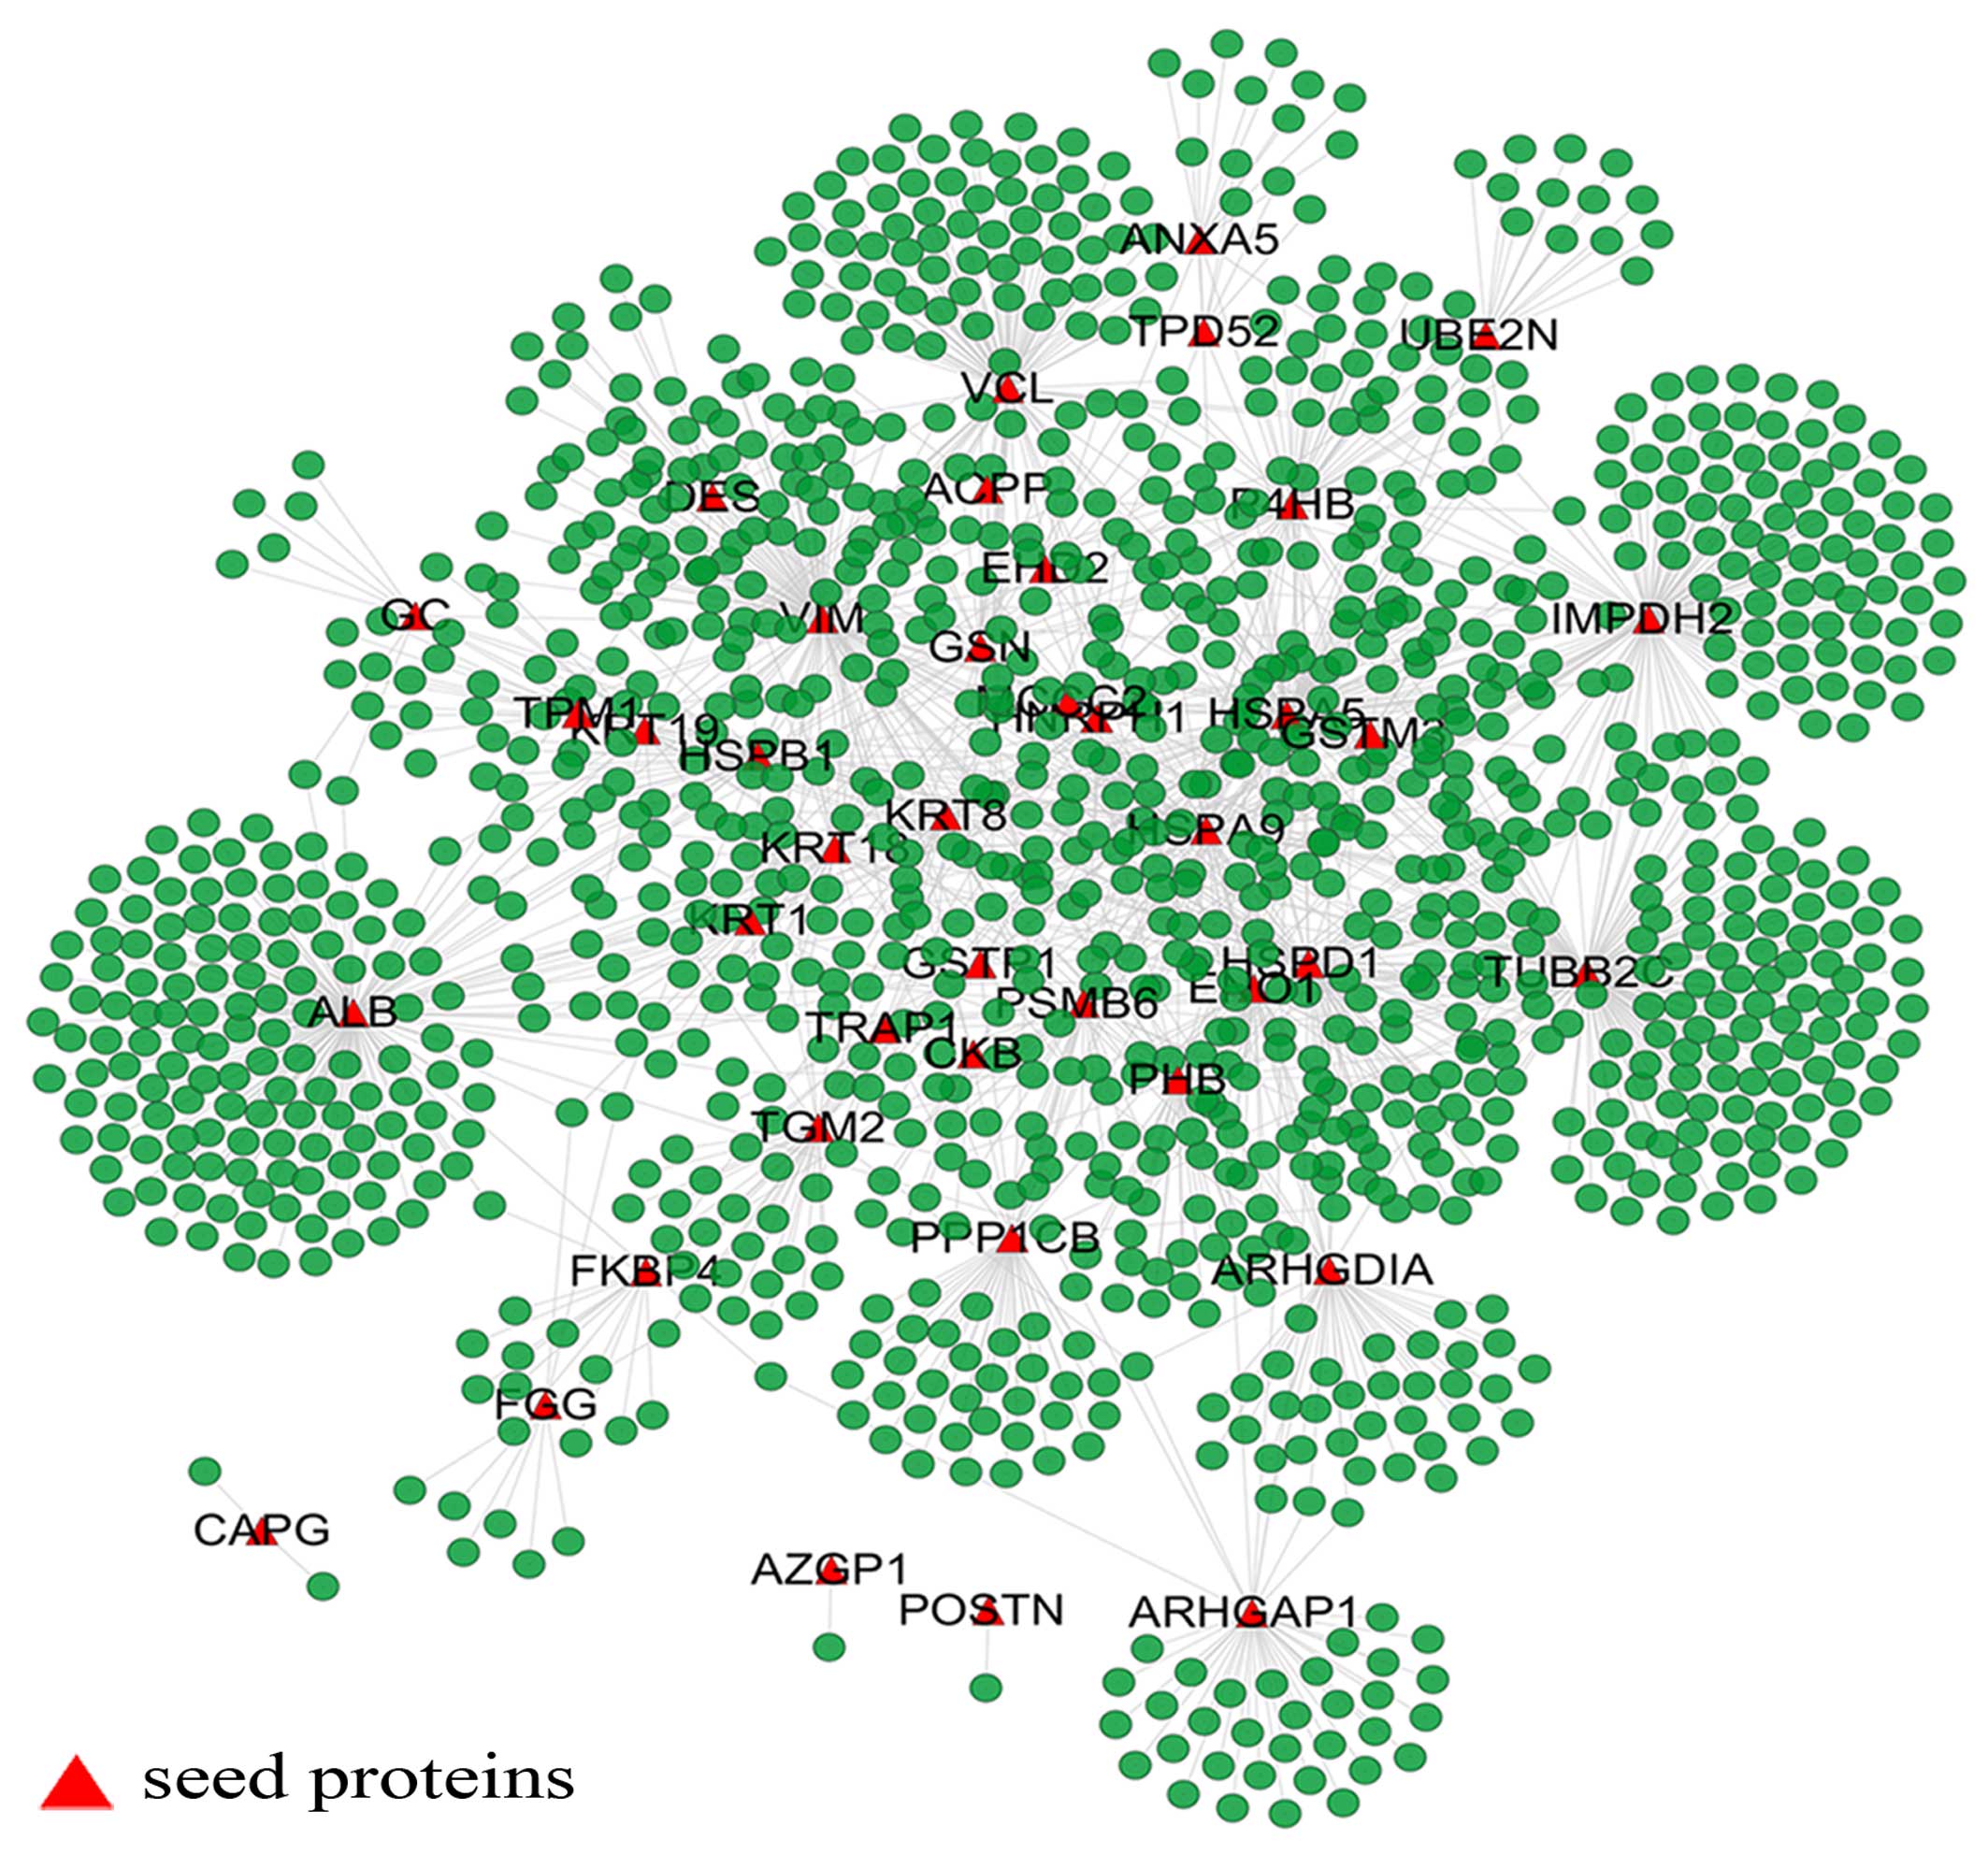
The extended network includes one giant network and
3 separated small components that are derived from the seed
proteins, alpha-2-glycoprotein 1, zinc-binding (AZGP1), capping
protein (actin filament), gelsolin-like (CAPG) and periostin,
osteoblast specific factor (POSTN) (Fig. 1). The giant network consisted of
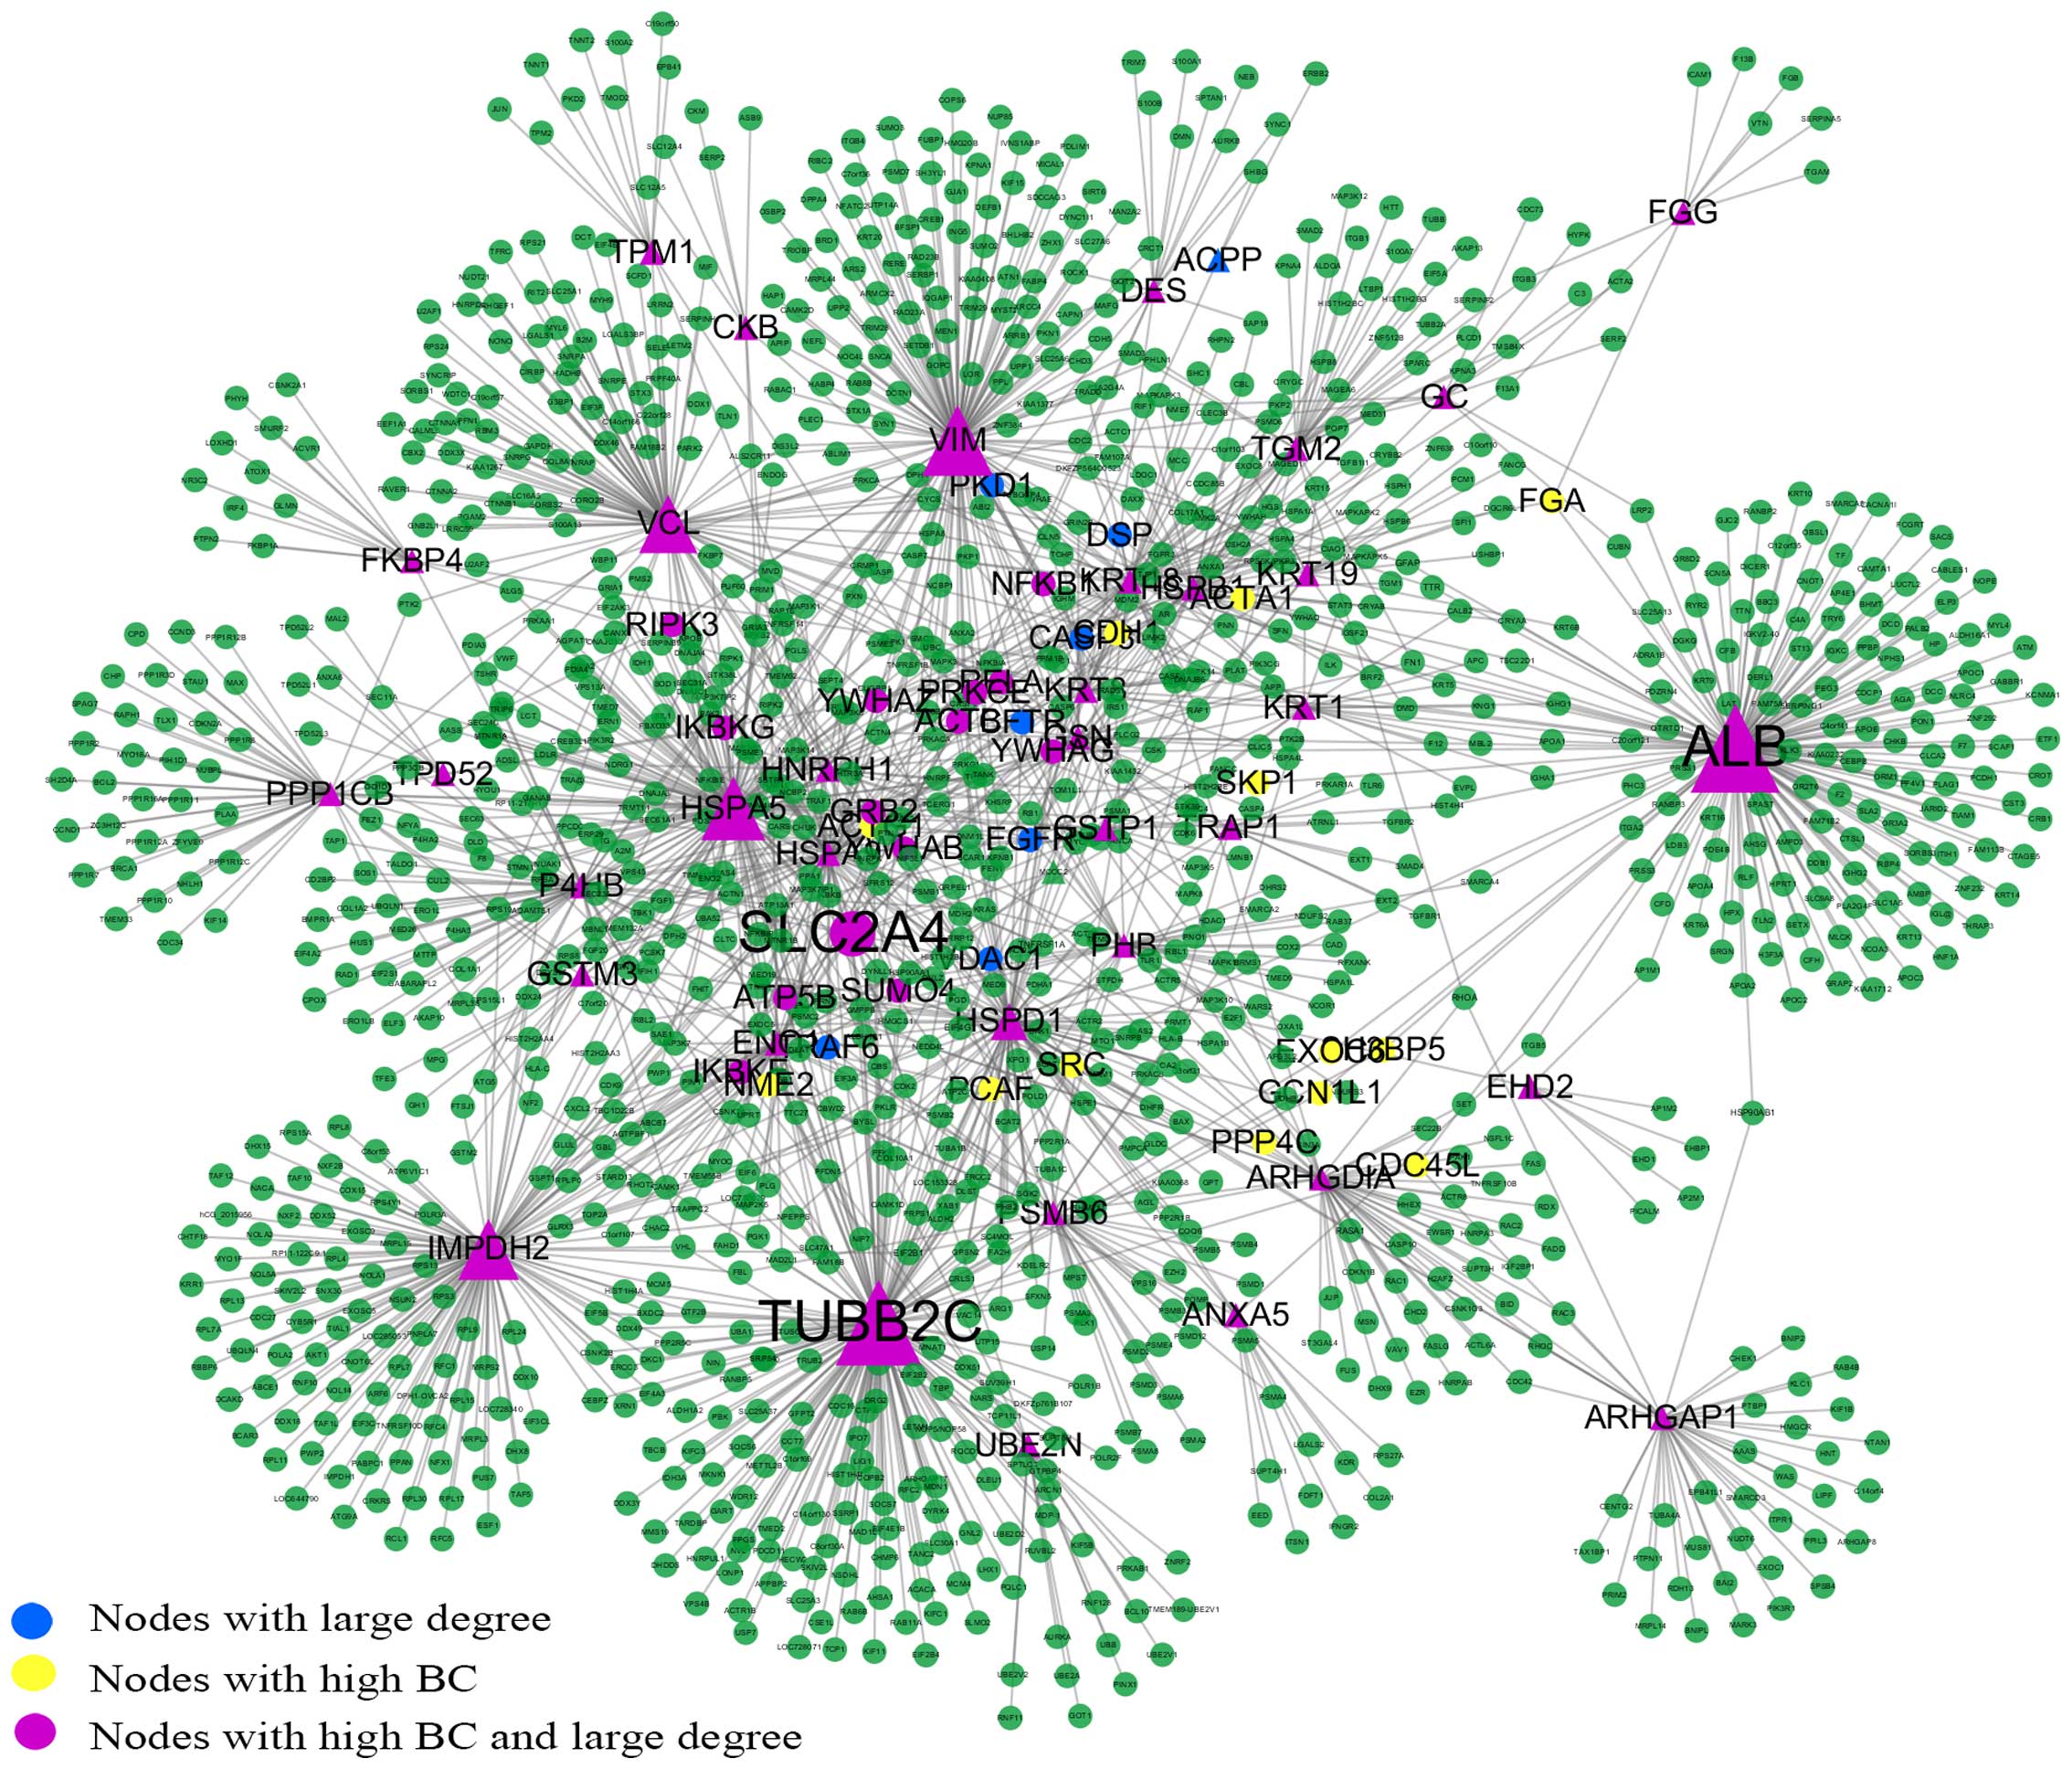
1,264 nodes connected via 1,744 edges (Fig. 2). The backbone network consisted
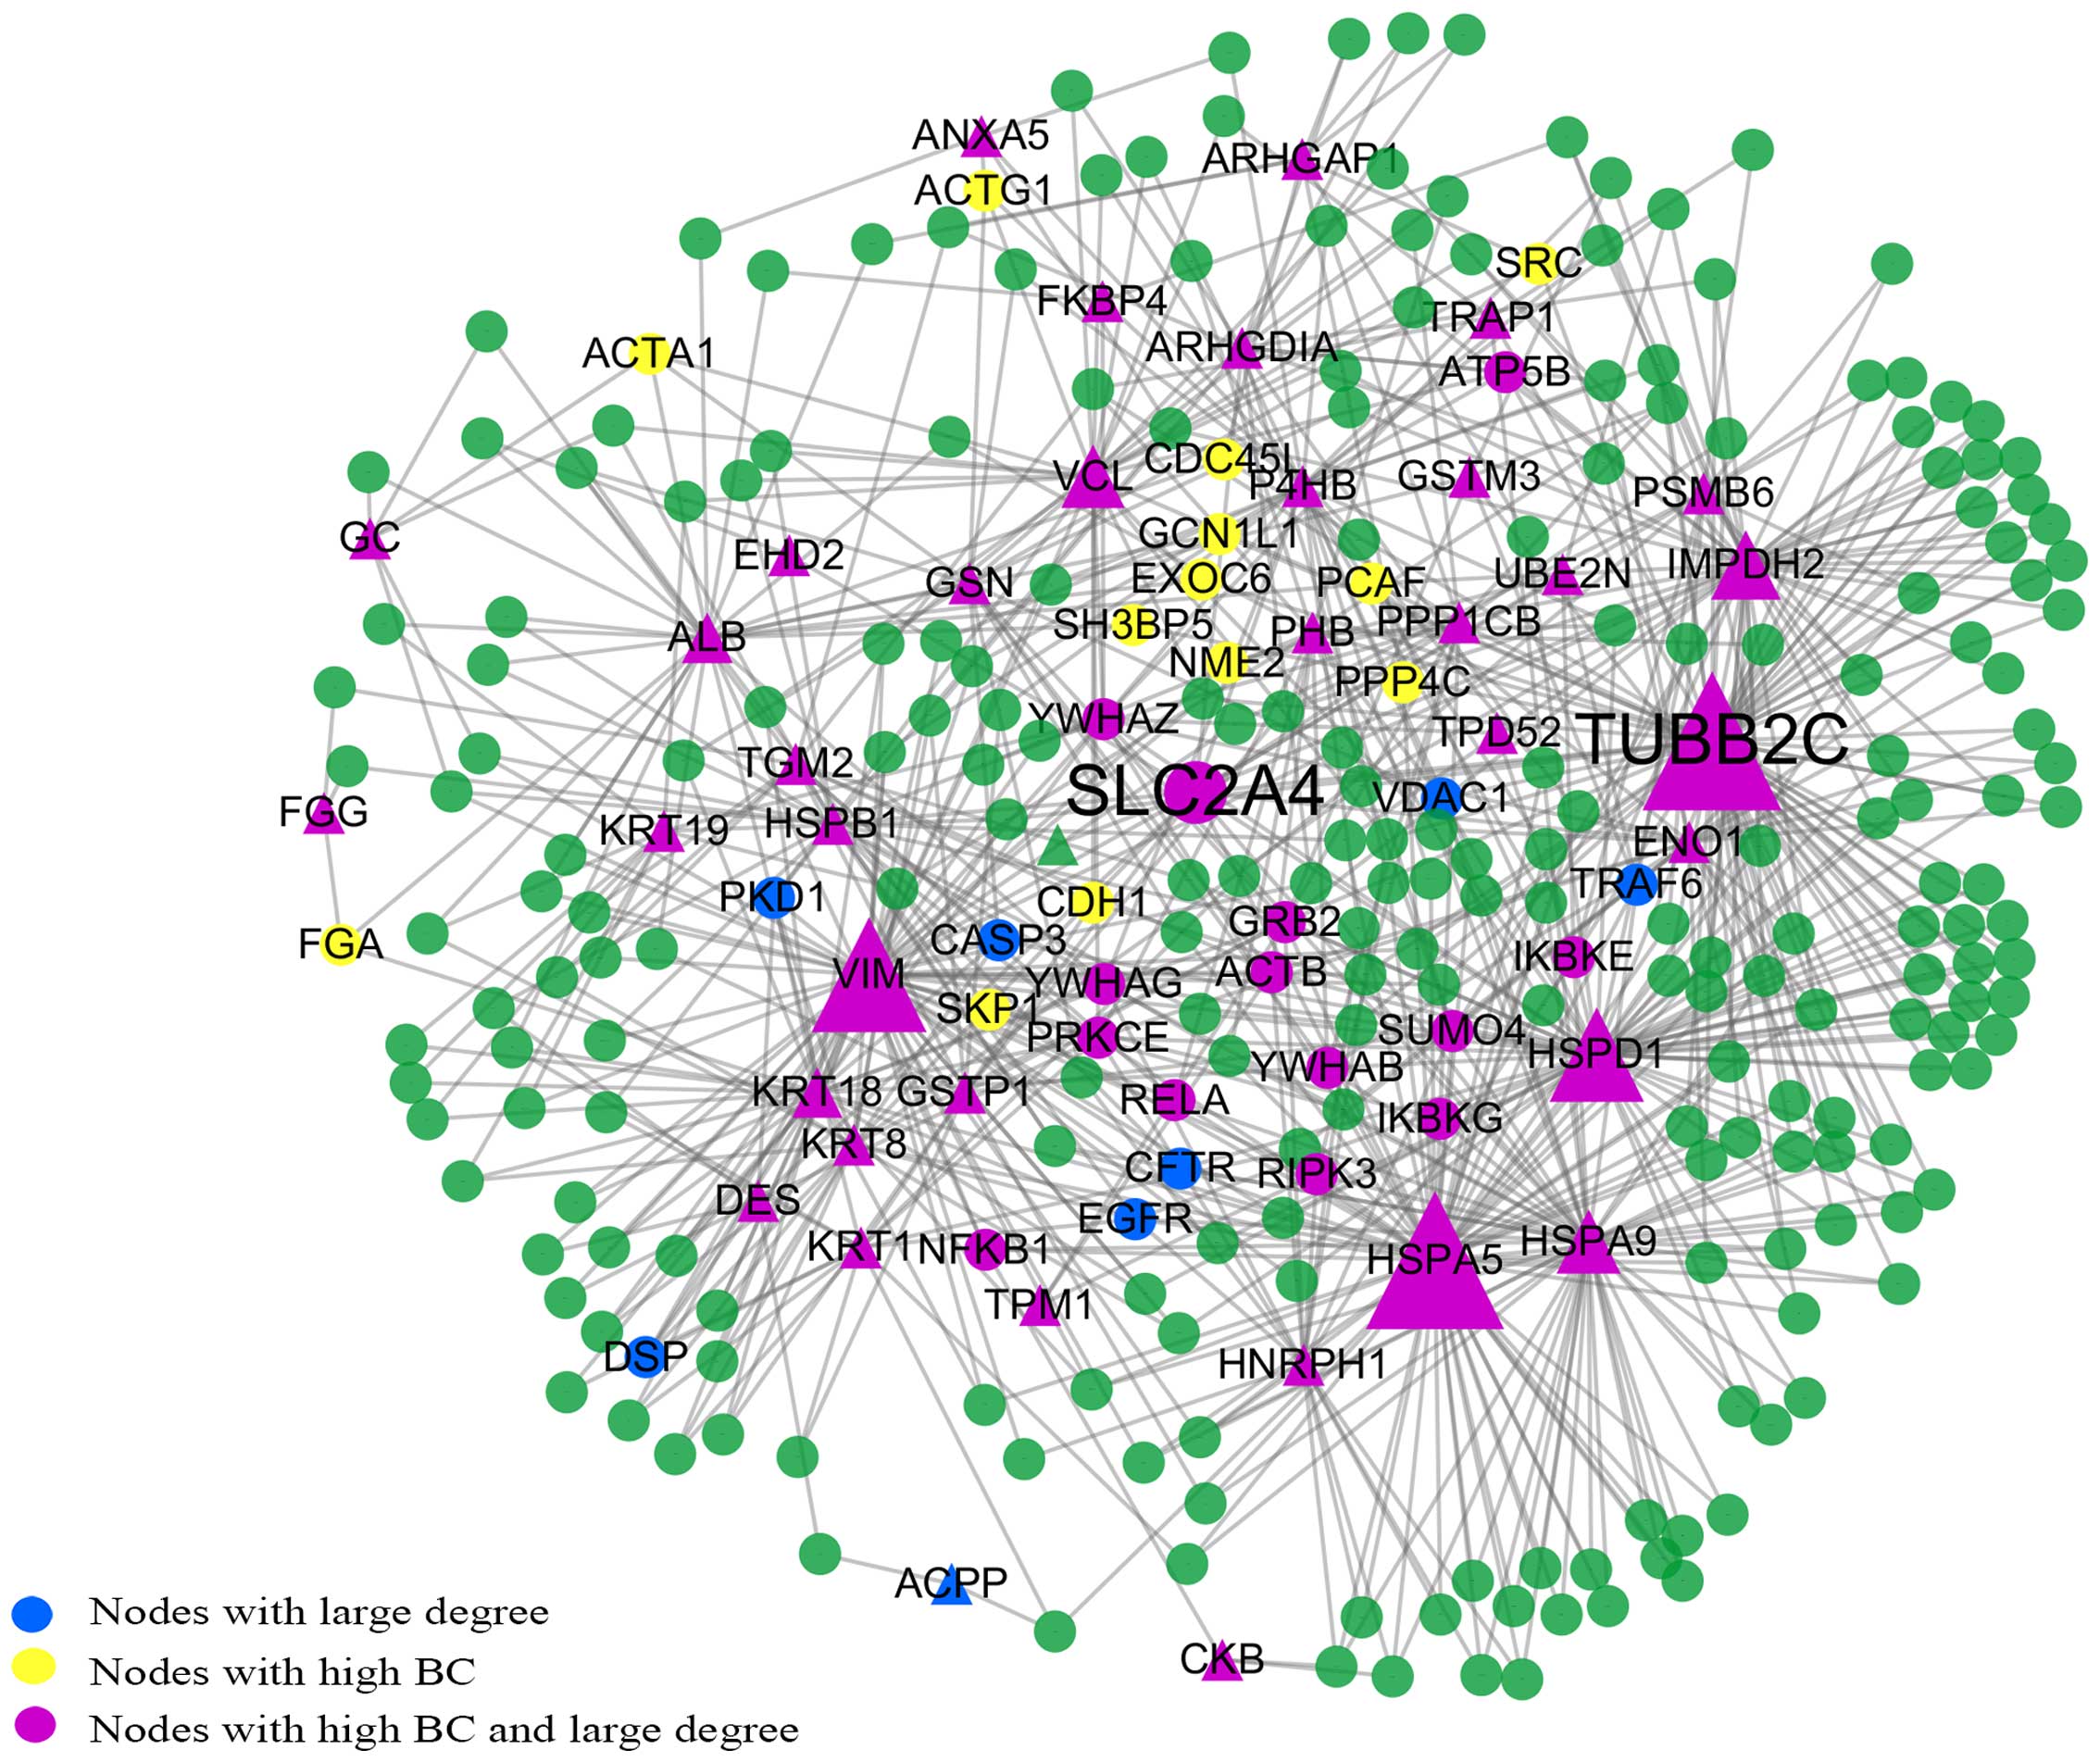
of 63 nodes connected via 186 edges (Fig. 3). We compared the measurement
parameters of the network between the giant network and the
backbone network (Table II). The
largest degree in the giant network was 174, while the average
degree was 2.759. This network is characterized by a small number
of highly connected nodes, while most of the other nodes have few
connections, which is the classical character of a PPI network
(22).
| Table IIThe general measurements for each
network. |
Table II
The general measurements for each
network.
| Parameter | Giant network | Backbone
network | Subnetwork |
|---|
| Nο. of nodes | 1,264 | 63 | 302 |
| Average degree | 2.759 | 5.905 | 5.093 |
| Largest degree | 174 | 17 | 72 |
| Diameter | 7 | 5 | 5 |
| Mean shortest path
length | 3.859 | 2.675 | 3.145 |
Key nodes in the PPI network
In this study, the nodes with a large degree or high
BC were viewed as key nodes, and 5% of the total nodes set of the
network was used as the critical point of large degree and high BC
nodes. Of the 1,264 total nodes, 63 nodes had a high BC value, 58
nodes had a large degree and 50 nodes were selected with a high BC
value and large degree. To distinguish the different roles of these
key nodes in the network, they were highlighted with different
colors and sizes. The size of the nodes corresponded to their BC
values (Fig. 2). Tubulin, beta 2C
(TUBB2C) is a hub protein with the largest degree and second
highest BC value, while albumin (ALB) is a bottleneck protein with
the highest BC value and the second largest degree. Solute carrier
family 2 (facilitated glucose transporter), member 4 (SLC2A4) has
the highest CC value, which indicates that SLC2A4 is located at the
center of the network.
Backbone network of the PPI network
The backbone network consisted from 63 nodes with a
high BC value, the size of which corresponds to their BC value and
the 186 links between them (Fig.
3). SLC2A4 was located at the center of the backbone network
with the highest CC value. SLC2A4 also had the largest degree and
the highest BC value; thus, it controls the information flow in the
backbone network. SLC2A4 has 17 neighbors: heat shock 70 kDa
protein (HSPA)5, TUBB2C, vimentin (VIM), HSPA9, heat shock 60 kDa
protein 1 (HSPD1), IMP (inosine 5′-monophosphate) dehydrogenase 2
(IMPDH2), prolyl 4-hydroxylase, beta polypeptide (P4HB), enolase 1
(ENO1), glutathione S-transferase Pi 1 (GSTP1), heat shock 27 kDa
protein 1 (HSPB1), protein phosphatase 1, catalytic subunit, beta
isozyme (PPP1CB), keratin 8, type II (KRT8), ubiquitin-conjugating
enzyme E2N (UBE2N), Rho GDP dissociation inhibitor (GDI) Alpha
(ARHGDIA), proteasome subunit beta 6 (PSMB6), desmin (DES) and
EH-domain containing 2 (EHD2). The details of the other proteins in
the backbone network are not presented here.
Subnetwork consisting of the shortest
paths between the seed proteins
The subnetwork consisted of 302 nodes and 769 edges
(Fig. 4). We found that TUBB2C
had the highest BC value and the largest degree. SLC2A4 was also
located at the center of the subnetwork and had the highest CC
value. This is consistent with the results of the giant network and
backbone network. In these 302 points, apart from AZGP1, CAPG and
POSTN which are related to 3 separate small components, the rest of
the seed proteins are all among these points. We determined that
the top 63 BC nodes in this subnetwork coincided well with the 63
nodes in the backbone network. There are only 16 proteins which are
not in the list of the 63 nodes with large BC values in the giant
network. These are epidermal growth factor receptor (EGFR), cystic
fibrosis transmembrane conductance regulator (ATP-binding cassette
subfamily C, member 7) (CFTR), immunoglobulin heavy constant mu
(IGHM), caspase-3 (CASP3), GINS complex subunit 2 (Psf2 homolog)
(GINS2), exocyst complex component 5 (EXOC5), voltage-dependent
anion channel 1 (VDAC1), nuclear factor of kappa light polypeptide
gene enhancer in B-cells inhibitor, alpha (NFKBIA), tubulin, gamma
1 (TUBG1), tumor necrosis factor receptor superfamily, member 1A
(TNFRSF1A), GDP-mannose pyrophosphorylase B (GMPPB), TNF
receptor-associated factor 6, E3 ubiquitin protein ligase (TRAF6),
cyclin-dependent kinase 2 (CDK2), heterogeneous nuclear
ribonucleoprotein K (HNRPK), eukaryotic translation initiation
factor 4 gamma, 1 (EIF4G1) and 3-hydroxy-3-meth-ylglutaryl-CoA
synthase 1 (soluble) (HMGCS1).
Densely connected region in the
constructed PPI network for PCa
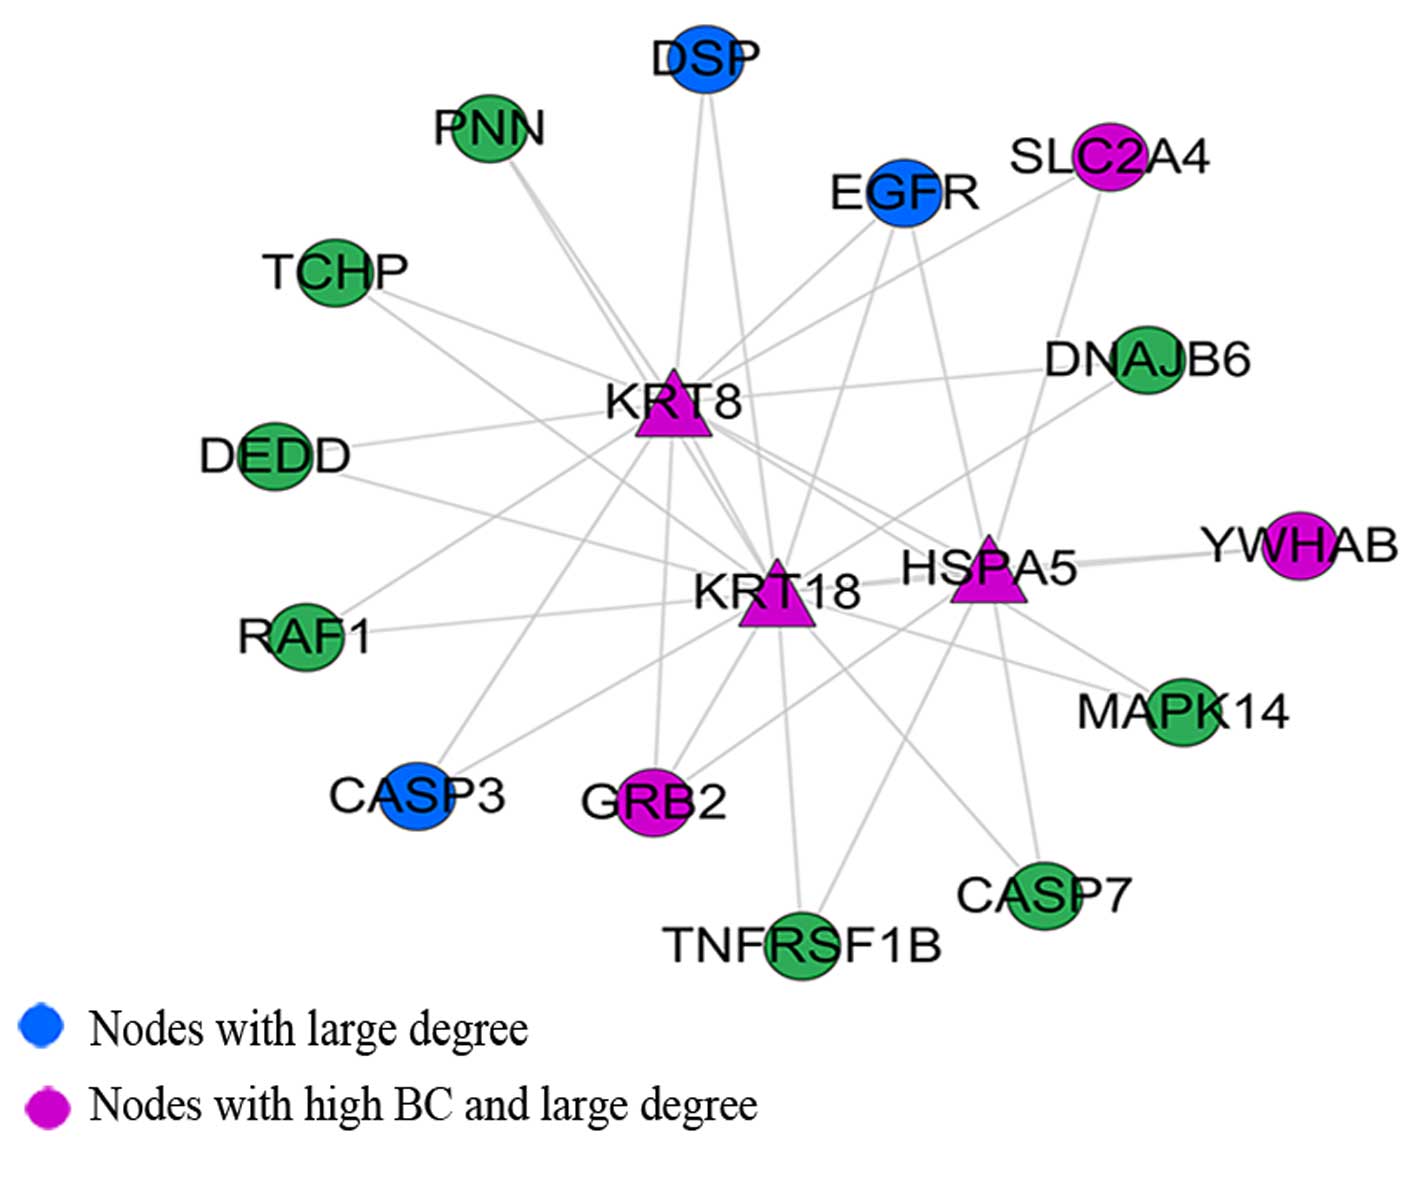
Through M-code module analysis, we found a densely
connected region with keratin 18, type I (KRT18), growth factor
receptor-bound protein 2 (GRB2), EGFR, HSPA5 and KRT8 as the main
nodes (Fig. 5). Among these,
KRT18, HSPA5 and KRT8 were seed proteins. Module function
annotational by DAVID revealed that the module was mainly enriched
in the apoptosis and Ras protein signal transduction biological
processes (Table III). The KEGG
pathway analysis revealed the involvment of the MAPK signaling
pathway, neurotrophin signaling pathway, GnRH signaling pathway,
colorectal cancer and non-small cell lung cancer (Table IV).
| Table IIIGene Ontology (GO) functional
enrichment analysis of the densely connected region with the
threshold of P<0.05. |
Table III
Gene Ontology (GO) functional
enrichment analysis of the densely connected region with the
threshold of P<0.05.
| Category | GO ID | Term | Count | P-valuea | Size |
|---|
| BP | GO:0006915 | Apoptosis | 8 | 6.4E-4 | 602 |
| BP | GO:0007265 | Ras protein signal
transduction | 4 | 9.8E-3 | 105 |
| BP | GO:0042981 | Regulation of
apoptosis | 7 | 1.1E-2 | 804 |
| Table IVKEGG pathway enrichment analysis of
the densely connected region with the threshold of P<0.05. |
Table IV
KEGG pathway enrichment analysis of
the densely connected region with the threshold of P<0.05.
| KEGG pathway | KEGG entry | Count | P-valuea | Size |
|---|
| MAPK signaling
pathway | hsa04010 | 5 | 3.5E-2 | 267 |
| Neurotrophin
signaling pathway | hsa04722 | 4 | 2.9E-2 | 124 |
| GnRH signaling
pathway | hsa04912 | 4 | 2.9E-2 | 98 |
| Colorectal
cancer | hsa05210 | 4 | 3.7E-2 | 84 |
| Non-small cell lung
cancer | hsa05223 | 3 | 4.6E-2 | 54 |
Discussion
Currently, PCa proteomics has generated a large
amount of data; however, only a very small amount has been
thoroughly investigated. Mining these DEPs and building a PPI
network could be regarded as an effective way to explore the
biological significance behind it. Mining of the proteomics data
may further reveal novel pathogenic mechanisms by contributing to
the characterization and understanding of biological processes and
their aberrant functions in PCa; it may also provide a framework
for the design of specific drugs by identifying potential
therapeutic targets (13,23). The purpose of this study was to
analyze the contribution of these proteins to the pathogenesis of
PCa and discover other key proteins cooperating with them by
topological analyses. To minimize the heterogeneity of the research
subjects to the maximum extent, we selected proteomics studies in
the literature focusing on human prostate tissue instead of
biological fluids. On this basis, to further ensure the reliability
of the DEPs in proteomics studies, we screened 41 PCa-associated
DEPs that were reported more than 2 times from different
researchers or further experimentally confirmed as seed proteins.
The constructed network consisted of a giant network and 3 small
separate components (Fig. 1).
Only 3 seed proteins (AZGP1, CAPG and POSTN) were separate from the
giant network, suggesting that the PPI between these proteins
orchestrates the genesis of PCa. It is possible that some proteins
were missed in the literature search and new reliable proteins
remain to be discovered for PCa, in addition to false nodes
resulting from false interactions in the network. However,
biological networks are tolerant to the deletion of nodes, and new
nodes prefer to link to nodes with a large degree. In other words,
biological networks are robust to the random alteration of nodes,
but are sensitive to hub removal (10,22).
Ideally, a topological network analysis identifies
proteins susceptible to be biomarkers or therapeutic targets
(24). Because cancer-related
proteins have a higher ratio of promiscuous structural domains,
they are more prone to interact with other proteins. In fact, they
have a large number of interacting proteins and occupy a central
position in the networks (25).
Proteins interacting with cancer-related proteins have a higher
probability of being related to the cancer process than
non-interacting proteins. Hence, the study of these proteins may be
an efficient way to discover novel cancer genes and cancer
biomarkers (26–28). In the giant network, TUBB2C is a
hub protein with the largest degree and second highest BC value.
Through topological analysis of the subnetwork, we found that
TUBB2C also had the largest degree and the highest BC value. TUBB2C
is a member of the tubulin family. Tubulin, the major protein in
microtubules, consists of a heterodimer of subunits designated as α
and β. Both α- and β-tubulins are encoded by 6 to 7 genes each and
exist as multiple isotypes in cells (29). TUBB2C is one of the β-tubulin
isotypes; it is also known as β2, TUBB2 and TUBB4B. Currently,
there are very few detailed studies on the association between
TUBB4B and PCa. Only Ranganathan et al have proposed that
the expression of the β2 tubulin isotype in PCa and BPH tissues
differs (30). However, the
specific mechanisms of its involvement in PCa and subsequent
research all lack specific elaboration. It has been found that
TUBB2C is involved in the genesis and development of many types of
tumors. The increased expression of TUBB2C is associated with the
early lymph node micrometastasis of colorectal cancer (31); high levels of expression of TUBB2C
in neuroepithelial tumors may reflect architectural changes in the
developing brain (29). The
downregulation of TUBB2C is also important in the development of
nasopharyngeal carcinoma (32).
ALB is a bottleneck protein with the highest BC value and second
largest degree. Research has confirmed that a low preoperative
serum albumin level may indicate extensive disease of clinically
localized PCa and may ultimately be correlated with biochemical
recurrence (33). In this study,
TUBB2C and ALB were located in the top two of the BC and degree
values in the giant network, suggesting that TUBB2C and ALB may be
involved in the development and progression of PCa. However,
further studies are required to verify our hypothesis.
In the backbone network, SLC2A4 has the largest
degree and the highest BC value. In the giant network, backbone
network and subnetwork, SLC2A4 was also located in the center with
the highest CC value, suggesting that SLC2A4 may play an important
role in the genesis of PCa. SLC2A4, also known as GLUT4, is a
member of the glucose transporter (GLUT) family (34). It has been found that SLC2A4 can
be used as a potential biomarker for many types of malignant
tumors, including lung carcinoma, endometrial carcinoma, gastric
cancer and breast cancer (35–38). Cancer cells need a steady source
of metabolic energy to achieve uncontrolled growth and
proliferation. Accelerated glycolysis is one of the biochemical
characteristics of tumor cells, and the glycolytic breakdown of
glucose is initiated by the transport of glucose, a rate-limiting
process mediated by GLUT. Increased GLUT expression in malignant
cells has been associated with the deregulated expression of GLUT
proteins (39). Gonzalez-Menendez
et al demonstrated that SLC2A4 is present in PCa cells and
participates actively in glucose uptake. SLC2A4 is more important
in glucose uptake in androgen-insensitive than in
androgen-sensitive PCa cells (40). However, studies on SLC2A4
participating in PCa are relatively rare. This study found that
SLC2A4 has an important node in the proteomics PPI network, and may
act as a candidate for molecular markers and drug targeting
associated with PCa.
To further confirm the role of TUBB2C and SLC2A4 in
the giant network and backbone network, we constructed a
subnet-work consisting of all of the shortest paths between the
seed proteins (Fig. 4). The
results revealed that TUBB2C had the highest BC value and largest
degree. SLC2A4 was also located at the center of the subnetwork.
Moreover, in this subnetwork, out of the 63 nodes with a high BC
value in the giant network, only 3 seed proteins were excluded,
indicating that the nodes with large BC values can efficiently
connect and integrate these seed proteins. We also determined that
the top 63 BC nodes in this subnetwork coincided well with the 63
nodes with large BC value in the giant network.
Through module analysis, we found a densely
connected region which contained the seed proteins, KRT8, KRT18 and
HSPA5. KRT8 and 18 (K8/18) are simple epithelial cell-specific
intermediate filament proteins. The loss of K8/18 expression during
epithelial-mesenchymal transition (EMT) is associated with
metastasis and chemoresistance (41). Fortier et al noted that
K8/18 knockdown increases epithelial cancer cell motility and
invasion without modulating EMT markers, and improves PI3K/Akt
activation in epithelial cancer cells (41). HSPA5 plays a critical role in
tumorigenesis, progression and resistance to chemotherapeutic
agents. Approximately 70% of human PCa tumors express high levels
of HSPA5, which is associated with recurrence, development of
castration resistance and poor survival (42). Following Gene Ontology (GO) and
KEGG pathway analysis, we found that the Ras protein signal
transduction biological process and the MAPK signaling pathway were
overrepresented. It has been suggested that Ras may be involved in
the genesis and development of PCa. It has been shown that enhanced
Ras signaling can reduce dependency for androgens in the LNCaP PCa
cell line (43), whereas the
inhibition of Ras can restore hormone dependency in C42 cells, a
line that is otherwise hormone-independent (43,44). Furthermore, as a downstream target
of Ras signaling, MAPK levels are augmented in patients who have
failed hormone ablation therapy (45). Finally, Ras activation in the
DU145 human PCa cell line has been shown to promote metastasis to
the brain and bones (46).
Recently, Mulholland et al suggested that RAS/MAPK pathway
activation may serve as a potentiating second hit to PTEN/PI3K/AKT
pathway alterations to androgen-dependent PCa and
castrate-resistant PCa (47).
These aforementioned data support the hypothesis that Ras protein
signal transduction and the MAPK signaling pathway may act as
molecular target candidates associated with PCa.
In conclusion, in the present study, we conducted
meticulous collation and mining of proteomics studies in the
literature on PCa and identified 41 DEPs between cancer and normal
or benign tissues. We then adopted a systems biology method in
order to construct an extended PPI network related to PCa. Through
topological analysis of the giant network, backbone network and
subnetwork, we identified SLC2A4 and TUBB2C as network biomarkers;
however, further research is required to determine their function
and mechanisms of action in PCa. In addition, by module analysis,
we determined that Ras protein signal transduction and the MAPK
signaling pathway may play an important role in the genesis and
development of PCa. This study conducted a comprehensive analysis
of the protein interaction network for proteomics DEPs in the
overall perspective. Further investigations of these network
biomarkers, biological process and pathways are warranted and this
may reveal the specific pathogenesis of PCa and develop new targets
for clinical treatments.
Acknowledgments
This study was supported by the National Natural
Science Foundation of China (grant no. 81100518), the Science and
Technology Foundation of Hebei Provincial Higher Education for
Youth (grant no. QN2014013) and the Social Science Fund Project of
Hebei Province (grant no. HB12SH030).
References
|
1
|
Siegel R, Ma J, Zou Z and Jemal A: Cancer
statistics, 2014. CA Cancer J Clin. 64:9–29. 2014. View Article : Google Scholar : PubMed/NCBI
|
|
2
|
Smith RA, Manassaram-Baptiste D, Brooks D,
Doroshenk M, Fedewa S, Saslow D, Brawley OW and Wender R: Cancer
screening in the United States, 2015: A review of current American
cancer society guidelines and current issues in cancer screening.
CA Cancer J Clin. 65:30–54. 2015. View Article : Google Scholar : PubMed/NCBI
|
|
3
|
Davalieva K, Kiprijanovska S, Komina S,
Petrusevska G, Zografska NC and Polenakovic M: Proteomics analysis
of urine reveals acute phase response proteins as candidate
diagnostic biomarkers for prostate cancer. Proteome Sci. 13(2)2015.
View Article : Google Scholar : PubMed/NCBI
|
|
4
|
Dihazi GH and Dihazi H: Protein-protein
interaction networks improve the proteomics data interpretation in
induced apoptosis. Expert Rev Proteomics. 7:177–180. 2010.
View Article : Google Scholar : PubMed/NCBI
|
|
5
|
von Mering C, Krause R, Snel B, Cornell M,
Oliver SG, Fields S and Bork P: Comparative assessment of
large-scale data sets of protein-protein interactions. Nature.
417:399–403. 2002. View Article : Google Scholar : PubMed/NCBI
|
|
6
|
Xin-Yu Y and Zheng-Ping X: An introduction
to protein-protein interaction database and its application. Chin J
Biochem Mol Biol. 24:189–196. 2008.
|
|
7
|
Rakshit H, Rathi N and Roy D: Construction
and analysis of the protein-protein interaction networks based on
gene expression profiles of Parkinson's disease. PLoS One.
9:e1030472014. View Article : Google Scholar : PubMed/NCBI
|
|
8
|
Sun J and Zhao Z: A comparative study of
cancer proteins in the human protein-protein interaction network.
BMC Genomics. 11(Suppl 3): S52010. View Article : Google Scholar
|
|
9
|
Lee SA, Tsao TT, Yang KC, Lin H, Kuo YL,
Hsu CH, Lee WK, Huang KC and Kao CY: Construction and analysis of
the protein-protein interaction networks for schizophrenia, bipolar
disorder, and major depression. BMC Bioinformatics. 12(Suppl 13):
S202011. View Article : Google Scholar
|
|
10
|
Ran J, Li H, Fu J, Liu L, Xing Y, Li X,
Shen H, Chen Y, Jiang X, Li Y, et al: Construction and analysis of
the protein-protein interaction network related to essential
hypertension. BMC Syst Biol. 7(32)2013. View Article : Google Scholar : PubMed/NCBI
|
|
11
|
Davalieva K, Kostovska IM, Kiprijanovska
S, Markoska K, Kubelka-Sabit K, Filipovski V, Stavridis S, Stankov
O, Komina S, Petrusevska G and Polenakovic M: Proteomics analysis
of malignant and benign prostate tissue by 2D DIGE/MS reveals new
insights into proteins involved in prostate cancer. Prostate.
75:1586–1600. 2015. View Article : Google Scholar : PubMed/NCBI
|
|
12
|
Wu CH, Yeh LS, Huang H, Arminski L,
Castro-Alvear J, Chen Y, Hu Z, Kourtesis P, Ledley RS, Suzek BE, et
al: The Protein Information Resource. Nucleic Acids Res.
31:345–347. 2003. View Article : Google Scholar : PubMed/NCBI
|
|
13
|
Sardiu ME and Washburn MP: Building
protein-protein interaction networks with proteomics and
informatics tools. J Biol Chem. 286:23645–23651. 2011. View Article : Google Scholar : PubMed/NCBI
|
|
14
|
Lee S-A, Chan C-H, Chen T-C, Yang CY,
Huang KC, Tsai CH, Lai JM, Wang FS, Kao CY and Huang CY: POINeT:
Protein interactome with sub-network analysis and hub
prioritization. BMC Bioinformatics. 10(114)2009. View Article : Google Scholar
|
|
15
|
Saito R, Smoot ME, Ono K, Ruscheinski J,
Wang PL, Lotia S, Pico AR, Bader GD and Ideker T: A travel guide to
Cytoscape plugins. Nat Methods. 9:1069–1076. 2012. View Article : Google Scholar : PubMed/NCBI
|
|
16
|
Jeanquartier F, Jean-Quartier C and
Holzinger A: Integrated web visualizations for protein-protein
interaction databases. BMC Bioinformatics. 16(195)2015. View Article : Google Scholar : PubMed/NCBI
|
|
17
|
Raman K: Construction and analysis of
protein-protein interaction networks. Autom Exp. 2(2)2010.
View Article : Google Scholar : PubMed/NCBI
|
|
18
|
Xie W, Sun J and Wu J: Construction and
analysis of a protein-protein interaction network related to
self-renewal of mouse spermatogonial stem cells. Mol Biosyst.
11:835–843. 2015. View Article : Google Scholar : PubMed/NCBI
|
|
19
|
Scardoni G, Petterlini M and Laudanna C:
Analyzing biological network parameters with CentiScaPe.
Bioinformatics. 25:2857–2859. 2009. View Article : Google Scholar : PubMed/NCBI
|
|
20
|
Rhrissorrakrai K and Gunsalus KC: MINE:
Module identification in networks. BMC Bioinformatics. 12(192)2011.
View Article : Google Scholar : PubMed/NCBI
|
|
21
|
Dennis G Jr, Sherman BT, Hosack DA, Yang
J, Gao W, Lane HC and Lempicki RA: DAVID: Database for annotation,
visualization, and integrated discovery. Genome Biol. 4:P32003.
View Article : Google Scholar : PubMed/NCBI
|
|
22
|
Lima-Mendez G and van Helden J: The
powerful law of the power law and other myths in network biology.
Mol Biosyst. 5:1482–1493. 2009. View
Article : Google Scholar : PubMed/NCBI
|
|
23
|
Xia J, Benner MJ and Hancock RE:
NetworkAnalyst - integrative approaches for protein-protein
interaction network analysis and visual exploration. Nucleic Acids
Res. 42:W167–W174. 2014. View Article : Google Scholar : PubMed/NCBI
|
|
24
|
Sanz-Pamplona R, Berenguer A, Sole X,
Cordero D, Crous-Bou M, Serra-Musach J, Guinó E, Pujana MÁ and
Moreno V: Tools for protein-protein interaction network analysis in
cancer research. Clin Transl Oncol. 14:3–14. 2012. View Article : Google Scholar : PubMed/NCBI
|
|
25
|
Jonsson PF and Bates PA: Global
topological features of cancer proteins in the human interactome.
Bioinformatics. 22:2291–2297. 2006. View Article : Google Scholar : PubMed/NCBI
|
|
26
|
Xu J and Li Y: Discovering disease-genes
by topological features in human protein-protein interaction
network. Bioinformatics. 22:2800–2805. 2006. View Article : Google Scholar : PubMed/NCBI
|
|
27
|
Sanz-Pamplona R, Aragüés R, Driouch K,
Martín B, Oliva B, Gil M, Boluda S, Fernández PL, Martínez A,
Moreno V, et al: Expression of endoplasmic reticulum stress
proteins is a candidate marker of brain metastasis in both
ErbB-2+ and ErbB-2− primary breast tumors. Am
J Pathol. 179:564–579. 2011. View Article : Google Scholar : PubMed/NCBI
|
|
28
|
Pujana MA, Han JD, Starita LM, Stevens KN,
Tewari M, Ahn JS, Rennert G, Moreno V, Kirchhoff T, Gold B, et al:
Network modeling links breast cancer susceptibility and centrosome
dysfunction. Nat Genet. 39:1338–1349. 2007. View Article : Google Scholar : PubMed/NCBI
|
|
29
|
Sugita Y, Nakamura Y, Yamamoto M, Oda E,
Tokunaga O and Shigemori M: Expression of tubulin beta II in
neuroepithelial tumors: Reflection of architectural changes in the
developing human brain. Acta Neuropathol. 110:127–134. 2005.
View Article : Google Scholar : PubMed/NCBI
|
|
30
|
Ranganathan S, Salazar H, Benetatos CA and
Hudes GR: Immunohistochemical analysis of beta-tubulin isotypes in
human prostate carcinoma and benign prostatic hypertrophy.
Prostate. 30:263–268. 1997. View Article : Google Scholar : PubMed/NCBI
|
|
31
|
He ZY, Wen H, Shi CB and Wang J:
Up-regulation of hnRNP A1, Ezrin, tubulin β-2C and Annexin A1 in
sentinel lymph nodes of colorectal cancer. World J Gastroenterol.
16:4670–4676. 2010. View Article : Google Scholar : PubMed/NCBI
|
|
32
|
Chan CML, Wong SCC, Lam MYY, Hui EP, Chan
JK, Lo ES, Cheuk W, Wong MC, Tsao SW and Chan AT: Proteomic
comparison of nasopharyngeal cancer cell lines C666-1 and NP69
identifies down-regulation of annexin II and β2-tubulin for
nasopharyngeal carcinoma. Arch Pathol Lab Med. 132:675–683.
2008.PubMed/NCBI
|
|
33
|
Sejima T, Iwamoto H, Masago T, Morizane S,
Yao A, Isoyama T, Kadowaki H and Takenaka A: Low pre-operative
levels of serum albumin predict lymph node metastases and
ultimately correlate with a biochemical recurrence of prostate
cancer in radical pros-tatectomy patients. Cent European J Urol.
66:126–132. 2013.
|
|
34
|
Aparicio LM, Villaamil VM, Calvo MB,
Rubira LV, Rois JM, Valladares-Ayerbes M, Campelo RG, Bolós MV and
Pulido EG: Glucose transporter expression and the potential role of
fructose in renal cell carcinoma: A correlation with pathological
parameters. Mol Med Rep. 3:575–580. 2010. View Article : Google Scholar
|
|
35
|
Ito T, Noguchi Y, Satoh S, Hayashi H,
Inayama Y and Kitamura H: Expression of facilitative glucose
transporter isoforms in lung carcinomas: Its relation to histologic
type, differentiation grade, and tumor stage. Mod Pathol.
11:437–443. 1998.PubMed/NCBI
|
|
36
|
Shibata K, Kajiyama H, Ino K, Nawa A,
Nomura S, Mizutani S and Kikkawa F: P-LAP/IRAP-induced cell
proliferation and glucose uptake in endometrial carcinoma cells via
insulin receptor signaling. BMC Cancer. 7(15)2007. View Article : Google Scholar
|
|
37
|
Liu J, Wen D, Fang X, Wang X, Liu T and
Zhu J: p38MAPK signaling enhances glycolysis through the
up-regulation of the glucose transporter GLUT-4 in gastric cancer
cells. Cell Physiol Biochem. 36:155–165. 2015. View Article : Google Scholar : PubMed/NCBI
|
|
38
|
Garrido P, Osorio FG, Morán J, Cabello E,
Alonso A, Freije JM and González C: Loss of GLUT4 induces metabolic
reprogramming and impairs viability of breast cancer cells. J Cell
Physiol. 230:191–198. 2015. View Article : Google Scholar
|
|
39
|
Won HJ, Ha TK, Kwon SJ, Cho HY, Hur SJ,
Baik HH, Suh SI, Ha E and Kim YH: Differential effects of
5-fluorouracil on glucose transport and expressions of glucose
transporter proteins in gastric cancer cells. Anticancer Drugs.
21:270–276. 2010. View Article : Google Scholar
|
|
40
|
Gonzalez-Menendez P, Hevia D,
Rodriguez-Garcia A, Mayo JC and Sainz RM: Regulation of GLUT
transporters by flavonoids in androgen-sensitive and -insensitive
prostate cancer cells. Endocrinology. 155:3238–3250. 2014.
View Article : Google Scholar : PubMed/NCBI
|
|
41
|
Fortier AM, Asselin E and Cadrin M:
Keratin 8 and 18 loss in epithelial cancer cells increases
collective cell migration and cisplatin sensitivity through
claudin1 up-regulation. J Biol Chem. 288:11555–11571. 2013.
View Article : Google Scholar : PubMed/NCBI
|
|
42
|
Misra UK and Pizzo SV: Ligation of cell
surface GRP78 with antibody directed against the COOH-terminal
domain of GRP78 suppresses Ras/MAPK and PI 3-kinase/AKT signaling
while promoting caspase activation in human prostate cancer cells.
Cancer Biol Ther. 9:142–152. 2010. View Article : Google Scholar : PubMed/NCBI
|
|
43
|
Bakin RE, Gioeli D, Bissonette EA and
Weber MJ: Attenuation of Ras signaling restores androgen
sensitivity to hormone-refractory C4-2 prostate cancer cells.
Cancer Res. 63:1975–1980. 2003.PubMed/NCBI
|
|
44
|
Erlich S, Tal-Or P, Liebling R, Blum R,
Karunagaran D, Kloog Y and Pinkas-Kramarski R: Ras inhibition
results in growth arrest and death of androgen-dependent and
androgen-independent prostate cancer cells. Biochem Pharmacol.
72:427–436. 2006. View Article : Google Scholar : PubMed/NCBI
|
|
45
|
Jia S, Gao X, Lee SH, Maira SM, Wu X,
Stack EC, Signoretti S, Loda M, Zhao JJ and Roberts TM: Opposing
effects of androgen deprivation and targeted therapy on prostate
cancer prevention. Cancer Discov. 3:44–51. 2013. View Article : Google Scholar :
|
|
46
|
Yin J, Pollock C, Tracy K, Chock M, Martin
P, Oberst M and Kelly K: Activation of the RalGEF/Ral pathway
promotes prostate cancer metastasis to bone. Mol Cell Biol.
27:7538–7550. 2007. View Article : Google Scholar : PubMed/NCBI
|
|
47
|
Mulholland DJ, Kobayashi N, Ruscetti M,
Zhi A, Tran LM, Huang J, Gleave M and Wu H: Pten loss and RAS/MAPK
activation cooperate to promote EMT and metastasis initiated from
prostate cancer stem/progenitor cells. Cancer Res. 72:1878–1889.
2012. View Article : Google Scholar : PubMed/NCBI
|
|
48
|
Sun C, Song C, Ma Z, Xu K, Zhang Y, Jin H,
Tong S, Ding W, Xia G and Ding Q: Periostin identified as a
potential biomarker of prostate cancer by iTRAQ-proteomics analysis
of prostate biopsy. Proteome Sci. 9(22)2011. View Article : Google Scholar
|
|
49
|
Pang J, Liu W-P, Liu X-P, Li LY, Fang YQ,
Sun QP, Liu SJ, Li MT, Su ZL and Gao X: Profiling protein markers
associated with lymph node metastasis in prostate cancer by
DIGE-based proteomics analysis. J Proteome Res. 9:216–226. 2010.
View Article : Google Scholar
|
|
50
|
Ummanni R, Junker H, Zimmermann U, Venz S,
Teller S, Giebel J, Scharf C, Woenckhaus C, Dombrowski F and
Walther R: Prohibitin identified by proteomic analysis of prostate
biopsies distinguishes hyperplasia and cancer. Cancer Lett.
266:171–185. 2008. View Article : Google Scholar : PubMed/NCBI
|
|
51
|
Alaiya AA, Al-Mohanna M, Aslam M, Shinwari
Z, Al-Mansouri L, Al-Rodayan M, Al-Eid M, Ahmad I, Hanash K, Tulbah
A, et al: Proteomics-based signature for human benign prostate
hyperplasia and prostate adenocarcinoma. Int J Oncol. 38:1047–1057.
2011. View Article : Google Scholar : PubMed/NCBI
|
|
52
|
Geisler C, Gaisa NT, Pfister D, Fuessel S,
Kristiansen G, Braunschweig T, Gostek S, Beine B, Diehl HC, Jackson
AM, et al: Identification and validation of potential new
biomarkers for prostate cancer diagnosis and prognosis using
2D-DIGE and MS. BioMed Res Int. 2015(454256)2015. View Article : Google Scholar : PubMed/NCBI
|
|
53
|
Skvortsov S, Schäfer G, Stasyk T,
Fuchsberger C, Bonn GK, Bartsch G, Klocker H and Huber LA:
Proteomics profiling of microdissected low- and high-grade prostate
tumors identifies Lamin A as a discriminatory biomarker. J Proteome
Res. 10:259–268. 2011. View Article : Google Scholar
|
|
54
|
Han ZD, Zhang YQ, He HC, Dai QS, Qin GQ,
Chen JH, Cai C, Fu X, Bi XC, Zhu JG, et al: Identification of novel
serological tumor markers for human prostate cancer using
integrative transcriptome and proteome analysis. Med Oncol.
29:2877–2888. 2012. View Article : Google Scholar : PubMed/NCBI
|