Introduction
The study of the dynamic composition of the proteome
and its adaptive modifications are of central importance for modern
biomedicine. Mass spectrometry-based proteomics is the method of
choice for the systematic identification of complex changes in
protein constituents involved in human disease (1). Comparative cellular proteomic
studies usually encompass: i) the efficient extraction of all
assessable protein species from a select tissue specimen; ii)
pre-fractionation steps to reduce sample complexity and enrich in
low-abundance proteins; iii) large-scale protein separation using
liquid chromatography and/or gel electrophoretic techniques; iv)
the determination of proteins with an altered concentration or
post-translational modifications due to pathological changes or
adaptations; v) the unequivocal identification of protein species
of interest by sensitive mass spectrometry; vi) the systems
bioinformatics analysis of proteome-wide changes in relation to
protein families and biological functions; and vii) independent
verification analyses using immunoblotting, biochemical activity
assays and/or microscopical techniques (2–4).
However, routine proteomic surveys are often
complicated by a variety of biological and technical issues. This
includes the considerable concentration range of protein species
within complex tissue proteomes, as well as the significant
differences in the physicochemical properties of individual
proteins in relation to charge, size and modifications. This may
lead to the underestimation of certain subtypes of proteins, such
as low-abundance proteins, proteins with extensive
post-translational modifications, hydrophobic proteins or
high-molecular-mass proteins. In the case of one of the most
frequently inherited diseases of early childhood, the neuromuscular
disorder Duchenne muscular dystrophy (5–7),
the comparative pathoproteomic analysis is complicated due to the
dynamic nature of the skeletal muscle proteome (8,9).
Despite the fact that primary abnormalities in the Dmd gene,
which encodes various isoforms of the protein dystrophin, cause
Duchenne muscular dystrophy (10), the majority of comparative
proteomic investigations have failed to detect dystrophin (11–16) due to technical issues associated
with high-throughput proteomic analyses of supramolecular complexes
from skeletal muscle tissues (17). Therefore, considerable enrichment
methods have to be used to routinely identify the low-abundance and
high-molecular-mass Dp427-M isoform of dystrophin by mass
spectrometry (18–22).
Although it is well established that the dystrophin
isoform Dp427-M is almost completely absent in dystrophic skeletal
muscles (23), a variety of
biochemical studies on dystrophin and its associated glycoprotein
complex have resulted in contradictory findings in relation to the
precise subcellular localization of this membrane cytoskeletal
protein (24–28) and the status of the various
dystrophin-associated glycoproteins in dystrophin-deficient fibres
(29–33). Thus, to address these opposing
results and establish the distribution of dystrophin in distinct
muscle surface membranes by a more sensitive technique, the present
study employed an advanced subproteomic profiling approach. The
presence of dystrophin and its associated proteins, i.e.
dystroglycans, sarcoglycans, syntrophins and dystrobrevins, was
studied in the sarcolemma and transverse tubules as compared to
triad junctions. Optimized pre-fractionation and affinity
enrichment steps in combination with efficient on-membrane
digestion (34) and mass
spectrometric analysis was utilized to unequivocally identify
dystrophin in isolated membrane preparations. For the assessment of
subcellular cross-contaminations, the proteomic identification of
established sarcolemmal proteins was compared to markers of the
sarcoplasmic reticulum, transverse tubules and other organelles
(35). The most important finding
of this study is that the dystrophin-glycoprotein complex was shown
to be enriched in the sarcolemma and this proteomic result agrees
with cell biological and ultrastructural studies of dystrophin
localization (36–39).
Materials and methods
Materials
Analytical grade chemicals and materials for gel
electrophoresis were obtained from Amersham Biosciences/GE
Healthcare (Little Chalfont, Buckinghamshire, UK), National
Diagnostics (Atlanta, GA, USA) and BioRad Laboratories
(Hemel-Hempstead, Hertfordshire, UK). Protease inhibitor cocktails
were purchased from Roche Diagnostics (Mannheim, Germany).
Nitrocellulose membranes were from Millipore (Bedford, MA, USA).
The reversible membrane stain Memcode was purchased from Thermo
Fisher Scientific (Waltham, MA, USA) and sequencing grade modified
trypsin was obtained from Promega (Madison, WI, USA). Liquid
chromatography-mass spectrometry Chromasolv water was purchased
from Fluka (Milwaukee, WI, USA). Biobasic C18 Picofrit columns were
from Dionex (Sunnyvale, CA, USA) and C18 spin columns were obtained
from Thermo Fisher Scientific (Dublin, Ireland).
N-acetylglucosamine agarose, Ponceau S-Red staining
solution, polyvinylpyrrolidone-40 and formic acid, as well as all
other analytical grade chemicals used in this study, were purchased
from Sigma Chemical Company (Dorset, UK).
Skeletal muscle preparations
Adult New Zealand white rabbit hind limb and back
muscle tissue was obtained as freshly dissected post-mortem
specimens from the Bioresource Facility of the National University
of Ireland. Rabbits were kept under standard conditions according
to Irish legislation on the use of animals in experimental
research. Muscle samples were immediately quick-frozen in liquid
nitrogen and stored at −80°C prior to usage. Frozen tissue
specimens were transported to Maynooth University on dry ice in
accordance with the Department of Agriculture (animal by-product
register number 2016/16 to the Department of Biology, National
University of Ireland, Maynooth). For the isolation of distinct
surface membrane fractions, combined muscle samples were trimmed of
excess fat and then minced with fine scissors on ice prior to
tissue homogenization and subcellular fractionation (40). All procedures were carried out in
a cold room at 4°C and buffers were supplemented with a protease
inhibitor cocktail containing 1 µM leupeptin, 0.5 µM
soybean trypsin inhibitor, 0.2 mM pefabloc, 1.4 µM
pepstatin-A, 0.15 µM aprotinin, 0.3 µM E-64 and 1 mM
EDTA (41).
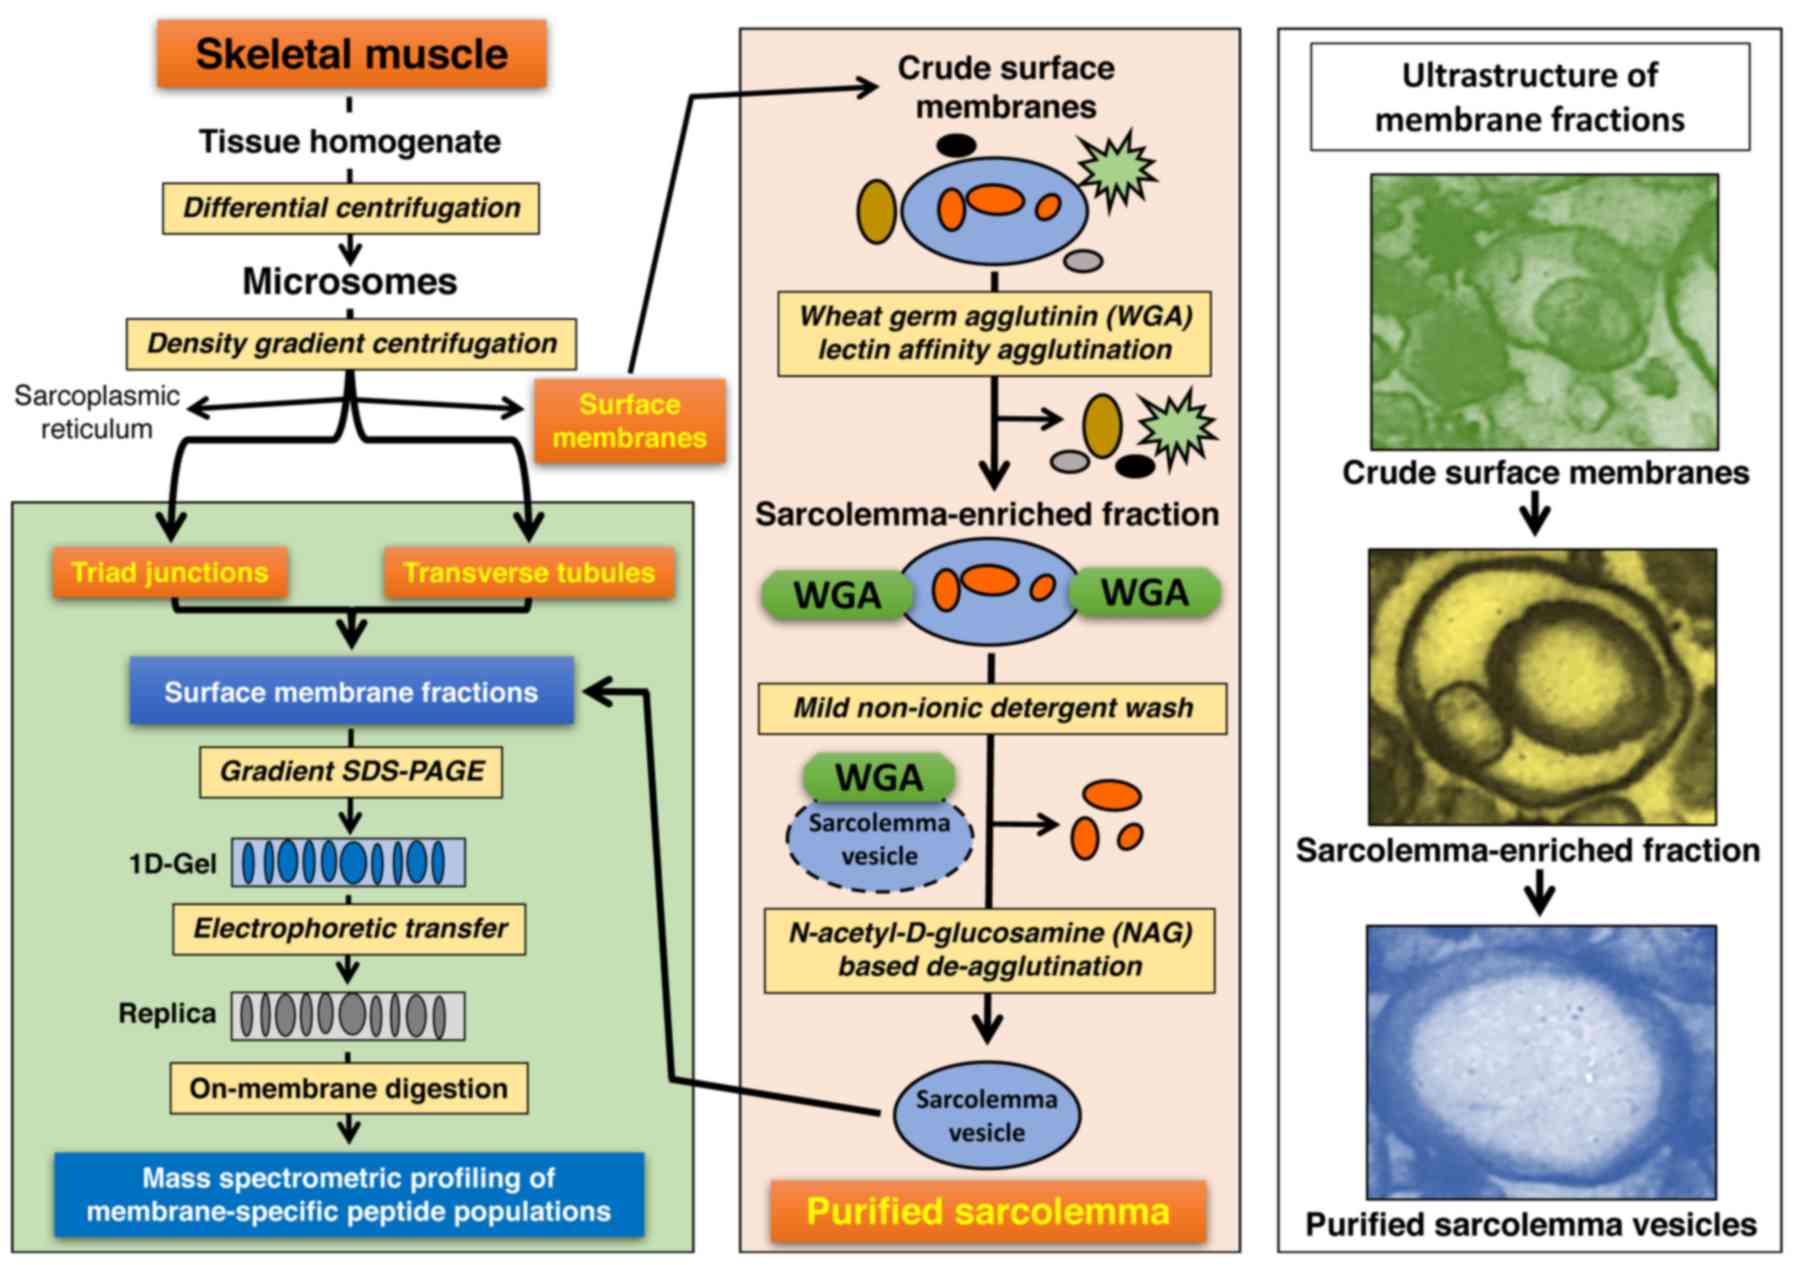
Subcellular fractionation of muscle
membranes
Skeletal muscle homogenisation was carried out by
the disruption of tissue pieces in 7 volumes of 10% (w/v) sucrose,
20 mM Tris-maleate, pH 7.0 and 3 mM EGTA (27) for 3 times 30 secs with the help of
an Ultra-Turrax T25 homogenizer from IKA Labortechnik (Staufen,
Germany). Initial differential centrifugation for the isolation of
a crude micrososmal fraction was carried out by a 15-min
centrifugation step at 13,000 × g, followed by filtration of the
supernatant through 3 layers of cheesecloth and then a second
90-min centrifugation step at 23,400 × g. Protein concentration was
determined by the Bradford dye binding method using bovine serum
albumin as a standard (42). To
further fractionate the suspended total microsomal pellet (10 mg
protein/ml), an optimized sucrose density gradient technique was
employed (27). The main
rationale of this approach was to efficiently separate a crude
sarcolemma-enriched fraction from isolated transverse tubules and
triad junctions, with a minimum cross-contamination by the highly
abundant non-junctional terminal cisternae and longitudinal tubules
of the sarcoplasmic reticulum and mitochondria (41,43–45). Microsomal vesicles were
centrifuged at 150,000 × g for 6 h through a continuous 10–60%
(w/v) sucrose gradient buffered with 25 mM Tris-maleate, pH 7.0 and
3 mM EGTA using a SW-28 rotor from Beckman Coulter (Palo Alto, CA,
USA). Distinct vesicle bands containing enriched fractions of the
crude surface membranes, transverse tubules and triad junctions
were carefully harvested and diluted 4-fold with above buffer
(41). Membrane fractions were
then centrifuged at 100,000 × g for 35 min and their protein
constituents separated by gradient gel electrophoresis. The broad
band containing the non-junctional sarcoplasmic reticulum (46) and pellets with mitochondria and
cellular debris were discarded.
Lectin affinity agglutination of
sarcolemma vesicles
Distinct sarcolemma vesicles were further isolated
from the crude surface membrane fraction by an optimized lectin
affinity agglutination technique (47). Importantly, during the vesicle
agglutination-deagglutionation-centrifugation procedure (27), the above-listed protease inhibitor
cocktail was added to all buffer systems in order to prevent excess
proteolysis of the many high-molecular-mass proteins that are
present in the sarcolemma (18).
Wheat germ agglutinin was extracted from crude wheat germ by the
method of Vretblad (48) and
purified to homogeneity by affinity chromatography using
N-acetylglucosamine agarose. Purified wheat germ lectin was
resuspended at a protein concentration of 1 mg/ml in 50 mM sodium
phosphate, pH 7.4, 0.16 M NaCl. A 30 ml aliquote of the lectin
solution was gently mixed with an equal volume of crude surface
membrane vesicles (1 mg protein/ml) and incubated for 30 min on ice
(27). The lectin agglutinated
membrane suspension was centrifuged for 90 sec at 14,000 × g and
the pelleted vesicles resuspended in 20 mM Tris-HC1, pH 7.4 and
0.303 M sucrose. The resuspension of agglutinated vesicles and
re-centrifugation was repeated twice to remove the non-agglutinated
membrane fraction, which contained mostly cellular debris and
non-sarcolemmal membrane systems. Importantly, to eliminate any
trapped material in the interior space of enriched sarcolemma
vesicles, the fraction was mildly washed with non-ionic detergent
by incubation for 10 min with 0.1% (v/v) Triton X.100, 0.3 M
sucrose, 20 mM Tris-CI, pH 7.4 on ice (28). Detergent-treated vesicles were
centrifuged for 90 sec at 14,000 × g and resuspended in above
buffer lacking the detergent Triton X-100. Subsequently
deagglutination was carried out by incubation for 20 min in 18 ml
of 0.2 M of the competitive sugar N-acetyl-D-glucosamine in
20 mM Tris-HCl, pH 7.4 and 0.303 M sucrose. The deagglutinated
suspension was centrifuged at 14,000 × g for 90 sec. The pellet
consisted mostly of sarcoplasmic reticulum and transverse tubule
vesicles and was discarded. The supernatant fraction containing
enriched sarcolemma vesicles was then centrifuged at 150,000 × g
for 20 min to yield a pellet with non-agglutinated and highly
purified sarcolemma vesicles (27). Sarcolemma protein constituents
were further separated by gradient gel electrophoresis. An overview
of this comprehensive subcellular fractionation strategy is
provided in the flow chart of Fig.
1.
Gradient gel electrophoresis
A 3–12% gradient gel system with 1.5-mm-thick and
16-cm-long slab gels using a Protean IIxi Cell (BioRad
Laboratories) was used to carry out sodium dodecyl sulfate
polyacrylamide gel electrophoresis at a constant setting of 200 V.
Protein separation was carried out until the blue dye front had
disappeared from the bottom of the gel (41). An ice bath-cooled large Transblot
Cell (BioRad Laboratories) was employed to perform the
electrophoretic transfer of gel-bound protein bands to
nitrocellulose sheets for 90 min at 100 V. The reversible protein
dyes Ponceau S Red or MemCode were used to visualize the
transferred proteins (14),
whereby destaining was carried out with 0.9% (w/v) NaCl and 50 mM
sodium phosphate, pH 7.4 (42).
On-membrane digestion of muscle
proteins
In contrast to previously published procedures that
have focused on the on-membrane digestion of individual protein
bands (18,46), in the present study,
nitrocellulose membrane strips corresponding to the entire lane of
proteins from individual subcellular fractions, i.e. crude surface
membranes, transverse tubules, triads and highly purified
sarcolemma vesicles, were used for peptide generation (34). Membrane strips were placed in 15
ml Falcon tubes, de-stained with 0.9% (w/v) NaCl and 50 mM sodium
phosphate, pH 7.4 and then washed 5 times with distilled water. The
strips were subsequently blocked with 0.5% polyvinylpyrrolidone
(PV-40) for 40 min at 37°C with gentle agitation (49–51). To remove excess PVP-40, membrane
strips were washed extensively with distilled water and placed in
new 15 ml Falcon tubes. Reconstituted sequencing grade trypsin was
added to the digestion buffer consisting of 100 mM ammonium
bicarbonate/10% acetonitrile (1:1, v/v). Each nitrocellulose strip
was incubated with 4 ml of this mixture, corresponding to a 1:20
ratio of trypsin to muscle protein. The strips were digested
overnight at 37°C with agitation. Following the generation of
distinct peptide populations, 4 ml of extraction buffer (5% formic
acid/acetonitrile [1:2, v/v]) was added and strips incubated at
37°C for 15 min with agitation (52). The supernatant was subsequently
transferred to 1.5 ml micro-centrifuge tubes and dried by vacuum
centrifugation (18). Dried
peptides were re-suspended in 0.5% trifluoroacetic acid/5%
acetonitrile and centrifuged in 22-µm acetate cellulose spin
filter tubes for 20 min to remove any membrane particles (46). Peptides were then desalted using
C18 spin columns (Thermo Fisher Scientific) and dried by vacuum
centrifugation. Dried peptides were stored at −80°C until further
usage in mass spectrometric analysis.
Liquid-chromatography mass spectrometric
analysis
Prior to label-free liquid chromatography mass
spectrometric (LC-MS/MS) analysis, dried peptides were re-suspended
in loading buffer consisting of 2% acetonitrile and 0.05%
trifluoroacetic acid in LC-MS grade water. The LC-MS/MS analysis of
peptides obtained from on-membrane digestion was carried out using
an Ultimate 3000 NanoLC system (Dionex Corporation, Sunnyvale, CA,
USA) coupled to a Q-Exactive mass spectrometer (Thermo Fisher
Scientific). Peptide mixtures were loaded by an auto-sampler onto a
C18 trap column (C18 PepMap, 300 µm id × 5 mm, 5 µm
particle size, 100 A pore size; Thermo Fisher Scientific). The trap
column was switched on-line with an analytical Biobasic C18
Picofrit column (C18 PepMap, 75 µm id × 50 cm, 2 µm
particle size, 100 A pore size; Dionex). Peptides were eluted using
a 65-min method over the following gradient (Solvent A: 80% (v/v)
acetonitrile and 0.1% (v/v) formic acid in LC-MS grade water): 3%
Solvent A for 5 min, 10% Solvent A for 30 min, 40% Solvent A for 5
min, 90% Solvent A for 5 min and 3% Solvent A for 10 min. The
column flow rate was set to 0.3 µl/min. Data were acquired
with Xcalibur software (Thermo Fisher Scientific). The Q-Exactive
mass spectrometer was operated in positive, data-dependent mode and
was externally calibrated. Survey MS scans were conducted in the
300–1,700 m/z range with a resolution of 140,000 (m/z 200) and a
lock mass of 445.12003. Collision-induced dissociation (CID)
fragmentation was carried out with the fifteen most intense ions
per scan and at 17,500 resolution. A dynamic exclusion window was
applied within 30 sec (53). An
isolation window of 2 m/z and one microscan were used to collect
suitable tandem mass spectra.
Data analysis
Mass spectrometry raw files were processed using the
Proteome Discoverer 1.4 (Thermo Fisher Scientific) software with
Sequest HT as the search engine and the UniProt sequence database.
The following search parameters were used for protein
identification: i) peptide mass tolerance set to 10 ppm; ii) MS/MS
mass tolerance set to 0.5 Da; iii) up to two missed cleavages; iv)
carbamidomethylation set as a fixed modification; and v) methionine
oxidation set as a variable modification (14). Since the rabbit genome is
incomplete, mass spectrometry raw files were searched against both
the Oryctolagus cuniculus database and the Mammalia
database (54). Peptides were
filtered using a minimum XCorr score of 1.5 for 1, 2.0 for 2, 2.25
for 3 and 2.5 for 4 charge states, with peptide probability set to
high confidence. For inclusion into Tables ITable IITable III–IV, identified proteins had to meet a
minimum inclusion criteria of ≥2 peptides and a coverage ≥5%.
 | Table IMass spectrometry-based subproteomic
profiling of sarcolemma marker proteins in surface membrane
fractions from rabbit skeletal muscle. |
Table I
Mass spectrometry-based subproteomic
profiling of sarcolemma marker proteins in surface membrane
fractions from rabbit skeletal muscle.
| Organellar marker
protein | Gene no. | Surface membrane
peptides (coverage) | Sarcolemma peptides
(coverage) | Transverse tubules
peptides (coverage) | Triads peptides
(coverage) |
|---|
|
α-Na+/K+-ATPase | ATP1A2 | 15 (19.0%) | 30 (32.2%) | 21 (26.7%) | – |
|
β-Na+/K+-ATPase | ATP1B1 | – | 3 (11.9%) | 5 (23.8%) | – |
| PMCA
Ca2+-ATPase | ATP2B1 | 6 (8.3%) | 14 (14.6%) | 15 (16.7%) | – |
| β-Integrin | ITGB1 | 7 (11.9%) | 7 (11.0%) | 8 (13.8%) | – |
| Table IIMass spectrometry-based subproteomic
profiling of transverse tubules marker proteins in surface membrane
fractions from rabbit skeletal muscle. |
Table II
Mass spectrometry-based subproteomic
profiling of transverse tubules marker proteins in surface membrane
fractions from rabbit skeletal muscle.
| Organellar marker
protein | Gene no. | Surface membrane
peptides (coverage) | Sarcolemma peptides
(coverage) | Transverse tubules
peptides (coverage) | Triads peptides
(coverage) |
|---|
|
α2/δ1-voltage-dependent
Ca2+-channel | CACNA2D1 | 18 (23.9%) | 19 (21.2%) | 33 (36.2%) | 10 (14.6%) |
|
α1S-voltage-dependent
Ca2+-channel | CACNA1S | – | – | 27 (14.8%) | – |
|
β1-voltage-dependent
Ca2+-channel | CACNB1 | 3 (7.3%) | 12 (31.3%) | 20 (55.0%) | 8 (16.2%) |
| Table IIIMass spectrometry-based subproteomic
profiling of sarcoplasmic reticulum marker proteins in surface
membrane fractions from rabbit skeletal muscle. |
Table III
Mass spectrometry-based subproteomic
profiling of sarcoplasmic reticulum marker proteins in surface
membrane fractions from rabbit skeletal muscle.
| Organellar marker
protein | Gene no. | Surface membrane
peptides (coverage) | Sarcolemma peptides
(coverage) | Transverse tubules
peptides (coverage) | Triads peptides
(coverage) |
|---|
| Ryanodine receptor
Ca2+-release channel | RyR1 | 31 (8.9%) | 29 (6.9%) | 65 (18.3%) | 40 (10.9%) |
| Fast SERCA1
Ca2+-ATPase | ATP2A1 | 39 (35.8%) | 53 (38.4%) | 55 (48.3%) | 38 (36.7%) |
|
Calsequestrin-1 | CASQ1 | 6 (26.3%) | 7 (18.5%) | 5 (17.7%) | 5 (21.5%) |
| Sarcalumenin-2 | SRL-2 | 5 (16.7%) | 9 (15.3%) | 22 (37.2%) | 4 (12.5%) |
| Table IVSubcellular localization of
dystrophin isoform Dp427-M and its tightly associated
glycoprotein-complex in rabbit skeletal muscle using liquid
chromatography/mass spectrometry-based proteomics. |
Table IV
Subcellular localization of
dystrophin isoform Dp427-M and its tightly associated
glycoprotein-complex in rabbit skeletal muscle using liquid
chromatography/mass spectrometry-based proteomics.
| Member of the
dystrophin-glycoprotein complex | Gene no. | Surface membrane
peptides (coverage) | Enriched sarcolemma
peptides (coverage) | Transverse tubules
peptides (coverage) | Triad junction
peptides (coverage) |
|---|
| Dystrophin,
Dp427-M | DMD | 9 (10.6%) | 17 (16.4%) | 8 (9.0%) | – |
|
α/β-Dystroglycan | DAG1 | – | 7 (6.4%) | 3 (5.3%) | – |
| α-Sarcoglycan | SGCA | 6 (24.0%) | 9 (23.0%) | 4 (13.4%) | – |
| β-Sarcoglycan | SGCB | 3 (18.9%) | 8 (35.9%) | 2 (14.9%) | – |
| γ-Sarcoglycan | SGCG | 3 (16.5%) | 6 (27.5%) | 4 (17.2%) | – |
| δ-Sarcoglycan | SGCD | 3 (16.5%) | 10 (35.3%) | 4 (22.8%) | – |
| α1-Syntrophin | SNTA1 | 4 (13.5%) | 8 (24.2%) | 4 (13.5%) | – |
| β1-Syntrophin | SNTB1 | 9 (26.1%) | 20 (42.8%) | 7 (16.9%) | – |
| β2-Syntrophin | SNTB2 | – | 8 (17.7%) | – | – |
| α-Dystrobrevin | DTNA | 4 (9.8%) | 10 (20.8%) | 3 (12.2%) | – |
| β-Dystrobrevin | DTNB | – | 5 (6.2%) | – | – |
Results
Skeletal muscle membrane proteomics
The systematic enrichment of distinct muscle
membrane fractions across an optimized separation scheme was used
to perform a detailed subproteomic analysis of core members of the
dystrophin-glycoprotein complex. The proteomic profile of the
full-length dystrophin isoform, Dp427-M, was compared to the
subcellular localization of established protein markers of the
sarcolemma, transverse tubules and triad junctions. In addition,
the presence of marker proteins representative of the highly
abundant sarcoplasmic reticulum, as well as the contractile
apparatus, mitochondria and other major types of muscle organelles
was evaluated by mass spectrometric analysis. The present study was
carried out on rabbit skeletal muscle, since relatively large
amounts of tissue were needed as starting material for the
extensive subcellular fractionation and biochemical enrichment
procedures prior to on-membrane digestion of proteins and mass
spectrometry, particularly in relation to the sarcolemma-enriched
fraction.
The affinity lectin agglutination technique requires
a considerable amount of membrane material for a successful
enrichment of sarcolemma vesicles (28,47). Since this procedure was originally
optimized using rabbit muscle tissue (27), we selected the same animal species
for this comprehensive proteomic profiling of the dystrophin
complex. Muscle biopsy samples from human patients would have been
too small to produce a suitable tissue homogenate for extensive
subcellular fractionation studies, as judged by our earlier
experience with analysing patient specimens (30,55–58). A major finding of our study is
that dystrophin and its associated glycoprotein complex are highly
enriched in the surface membrane and are apparently absent from the
triad junctions. Thus, future proteomic studies comparing normal
vs. dystrophic human muscles, where only restricted amounts of
tissue are available, should ideally focus on the
sarcolemma-enriched fraction.
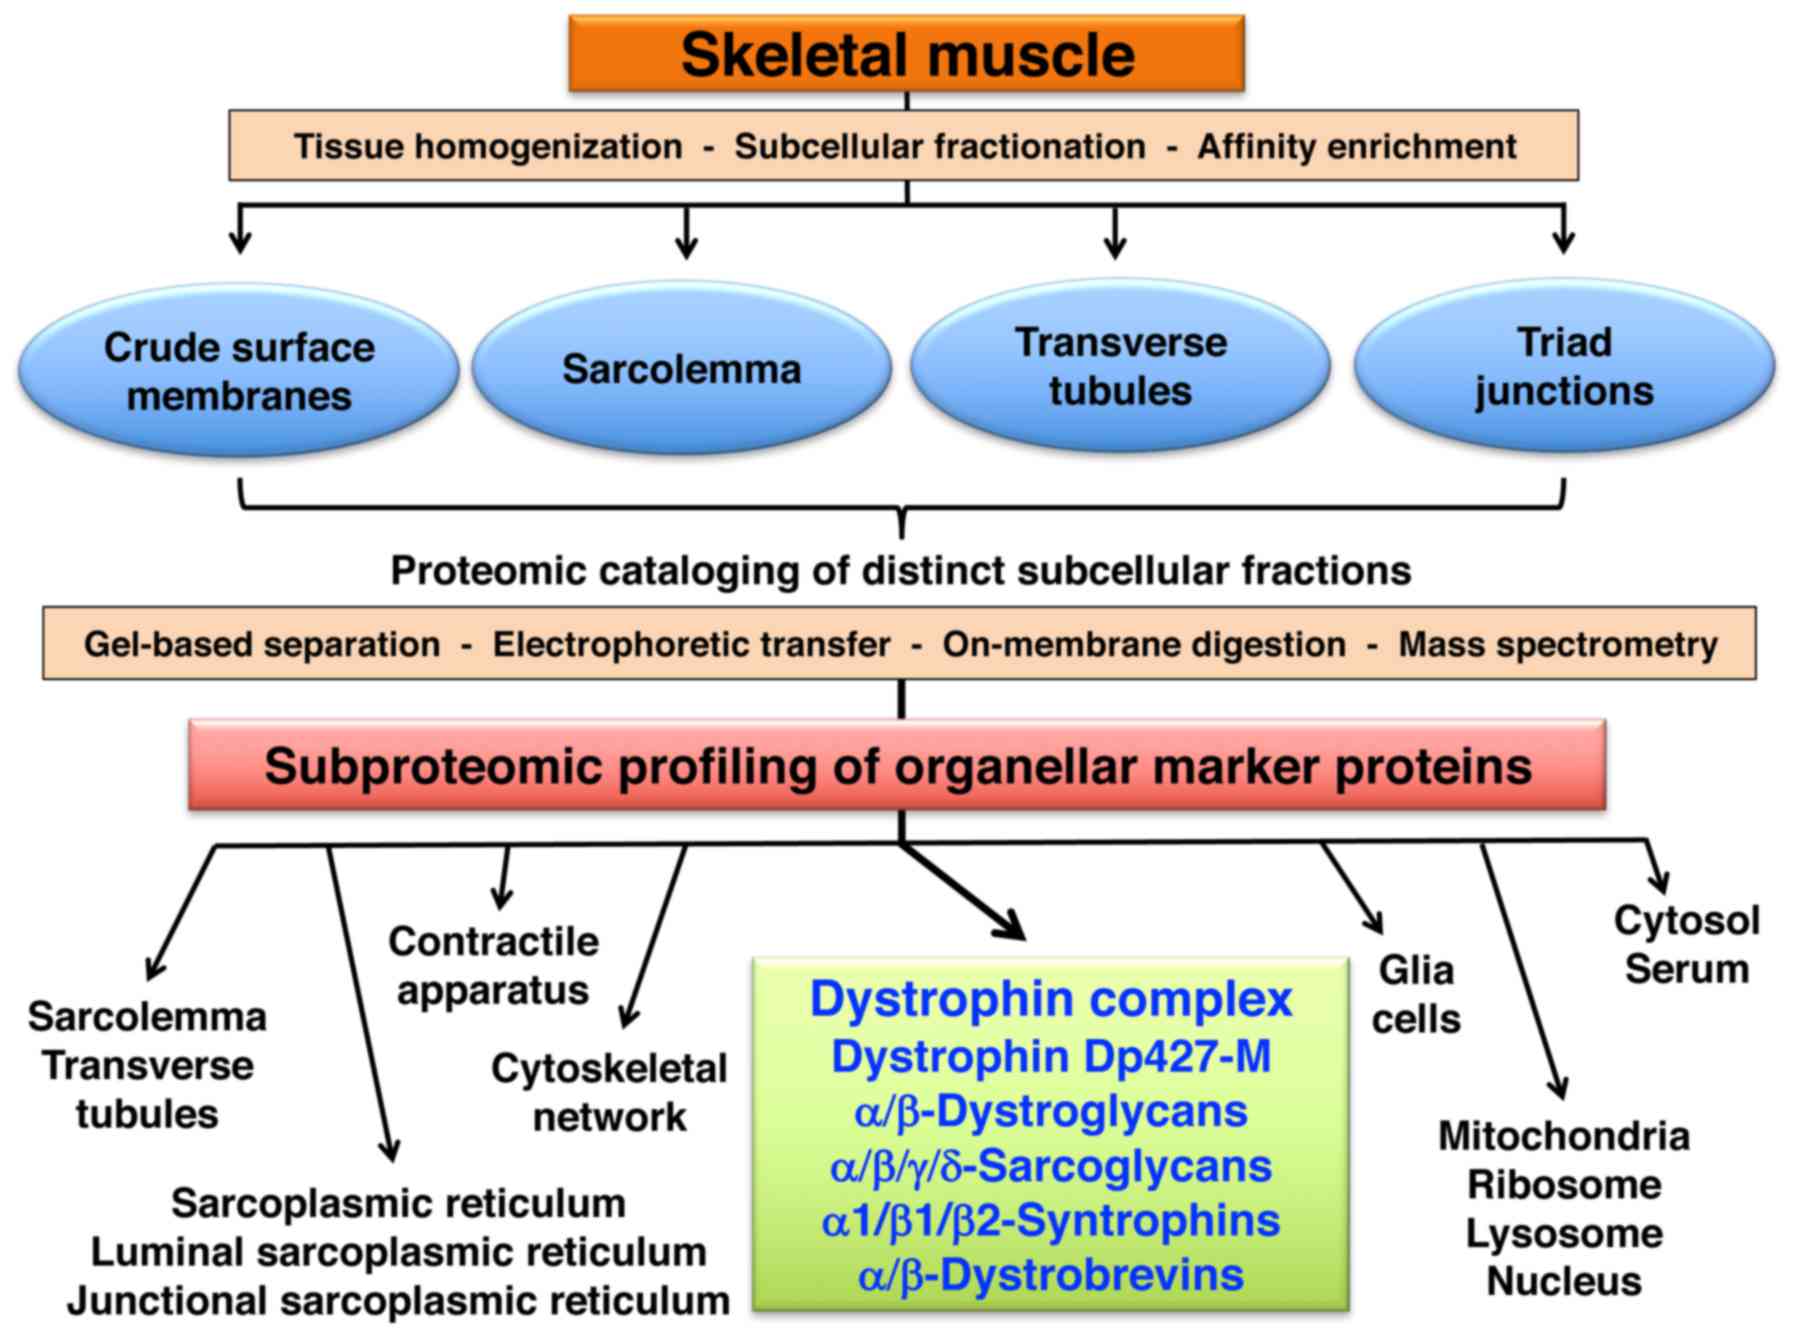
Subproteomic profiling of skeletal muscle
membranes
The diagram in Fig.
2 outlines the subproteomic profiling approach used in this
study to assign the dystrophin-glycoprotein complex to specific
subcellular localisations in skeletal muscle. Skeletal muscle
microsomes were isolated by differential centrifugation and further
separated into distinct fractions enriched in crude surface
membranes, transverse tubules and triads by density gradient
centrifugation (27). For the
detailed evaluation of the muscle plasma membrane, an elaborate
lectin affinity agglutination method was employed to isolate highly
purified sarcolemma vesicles that exhibit a minimum contamination
with components derived from the sarcoplasmic reticulum and other
abundant organelles (28,47). An on-membrane digestion method was
used for the optimum generation of representative peptide
populations from the different membrane fractions (18,34,46). The raw data files from the mass
spectrometric analysis were searched against the Oryctolagus
cuniculus database. However, the rabbit genome is incomplete
and we therefore had to supplement the data analysis by also
screening the Mammalia database, as previously described by
Liu et al (54).
Following initial database searches, the identified
proteins were filtered extensively. For inclusion in tables with
significant proteomic hits, the identification of individual muscle
protein species had to strictly meet the following inclusion
criteria: i) number of peptides ≥2; ii) sequence coverage ≥5%; iii)
identification by peptides that were filtered using a minimum XCorr
score of 1.5 for 1, 2.0 for 2, 2.25 for 3 and 2.5 for 4 charge
states; and iv) peptide probability with high confidence. Detailed
information on peptide lists for the crude surface membrane,
transverse tubules, triads and sarcolemma can be viewed as
supplementary material on the publicly available online digital
repository named Figshare (https://figshare.com) with the file name 'Peptide
Lists for crude surface membrane, transverse tubules, triads and
sarcolemma' (doi: 10.6084/m9.figshare.4906436).
Mass spectrometric identification of
subcellular markers in surface membrane preparations
Prior to the identification of the
dystrophin-glycoprotein complex in distinct subcellular fractions
from skeletal muscle, the subproteomic assessment of established
ion-regulatory proteins and excitation-contraction coupling
components of the crude surface membrane, sarcolemma and transverse
tubules was carried out. Following mass spectrometry, the data
analysis of sarcolemma identified 566 proteins when searched
against the rabbit database of which 330 protein species had ≥2
unique peptides. A total of 784 proteins were established when
searched against the amniota database with 316 proteins that
exhibited ≥2 unique peptides. The analysis of transverse tubules
revealed 675 proteins when searched against the rabbit database of
which 374 proteins had ≥2 unique peptides. The searched of the
amniota database revealed 907 proteins of which 377 proteins had ≥2
unique peptides.
Marker proteins of the muscle surface, such as the
major α-subunit of the Na+/K+-ATPase, the
sarcolemmal PMCA isoform of the Ca2+-pumping ATPase and
β-integrin were all identified in crude membrane preparations and
shown to be enriched in the sarcolemma, as well as the transverse
tubules (Table I). Mass
spectrometric analysis also established the minor β-subunit of the
Na+/K+-ATPase being present in the sarcolemma
membrane and its invaginations. In stark contrast, these surface
membrane markers were shown to be absent from enriched triad
preparations (Table I). Distinct
subunits of the voltage-sensing protein complex of the transverse
tubules, often referred to as the dihydropyridine receptor, were
used as marker proteins of surface membrane invaginations. The
α2/δ1- and β1-subunits of the voltage-dependent
Ca2+-channel were shown to be present in crude surface
preparations, sarcolemma vesicles and triad junctions, but mass
spectrometry showed their highest coverage in purified transverse
tubules (Table II). Of note, the
major α1S-subunit of the dihydropyridine receptor was only
identified in the transverse tubular fraction (by 27 peptides and a
14.8% sequence). The stringent criteria of a minimum of 5% sequence
coverage used in the present study excluded the listing of the
principal ion channel subunit in relation to other membrane types.
The α1S-subunit was only covered by 3.8% (5 peptides), 4.7% (7
peptides) and 3.2% (5 peptides) sequence in crude surface
membranes, purified sarcolemma vesicles and triad junctions,
respectively.
These subproteomic findings indicate a reasonable
separation of different surface membrane fractions by the
subcellular fractionation protocol employed in this investigation.
Importantly, various cytoskeletal markers were shown to be present
in the sarcolemmal fraction, including ankyrin-1 (ANK1, 3 peptides,
3.6% coverage), β-tubulin (TUBB, 14 peptides, 28.4% coverage),
desmin (DES, 26 peptides, 52.0% coverage) and vimentin (VIME, 11
peptides, 29.0% coverage). Therefore, the linkage of the
subsarcolemmal membrane cytoskeleton to the general cytoskeletal
network appears to have been preserved during membrane fractio
nation. This is a crucial finding in relation to the subsequent
mass spectrometric analysis of the membrane cytoskeletal protein
dystrophin.
Mass spectrometric identification of
abundant organelles in purified sarcolemma
Since the sarcoplasmic reticulum is by far the most
abundant membrane system in skeletal muscle, the presence of key
marker proteins of junctional triad sites, longitudinal tubules and
the lumen of the sarcoplasmic reticulum was evaluated. As listed in
Table III, a considerable
amount of sarcoplasmic reticulum proteins is associated with
purified sarcolemma vesicles. This included the RyR1 isoform of the
junctional ryanodine receptor Ca2+-release channel, the
CSQ1 isoform of the luminal Ca2+-binding protein
calsequestrin, the SRL-2 isoform of the Ca2+-shuttle
protein sarcalumenin and the fast SERCA1 type of the
Ca2+-pumping ATPase of the longitudinal tubules and
terminal cisternae region. Hence, despite extensive subcellular
fractionation by differential centrifugation and density gradient
ultracentrifugation, as well as lectin affinity agglutination and
mild detergent washing, a certain degree of cross-contamination of
sarcolemma preparations by the abundant sarcoplasmic reticulum
could not be avoided. Besides sarcoplasmic reticulum proteins,
markers of other organelles or subcellular structures could also be
identified as being present in purified sarcolemma vesicles.
This included cross-contamination with the
contractile apparatus markers myosin heavy chain MyHC-IIb (MYH2B,
23 peptides, 13.4% coverage), myosin light chain MLC2 (MYLPF, 8
peptides, 55.3% coverage), tropomyosin α1-TM (TPM1, 14 peptides,
33.2% coverage) and α-actin (ACTA1, 20 peptides, 55.2% coverage),
the mitochondrial markers succinate dehydrogenase (SDHA, 6
peptides, 14.2% coverage), aconitate hydratase (ACO2, 8 peptides,
13.0% coverage) and cytochrome c oxidase subunit 2 (COX2, 4
peptides, 14.5% coverage), the ribosomal marker elongation factor
1-α2 (EEF1A2, 4 peptides, 11.2% coverage), the lysosomal marker
lysosome-associated membrane glycoprotein 1 (LAMP1, 2 peptides,
5.9% coverage), the cytosolic marker enzymes aldolase (ALDOA, 16
peptides, 42.9% coverage) and glyce raldehyde-3-phosphate
dehydrogenase (GAPDH, 6 peptides, 21.0% coverage), the nucleus
marker lamin-A (LMNA, 3 peptides, 6.2% coverage), the glia cell
marker myelin basic protein (MBP, 7 peptides, 24.2% coverage) and
the serum markers β-haemoglobin (HBB2, 2 peptides, 15.7% coverage)
and albumin (ALB, 9 peptides, 12.2% coverage). Thus, lectin
affinity agglutinated surface membranes are highly enriched in
sarcolemma vesicles, but also contain a considerable amount of
cross-contaminating protein populations derived from the
contractile apparatus, mitochondria, ribosomes, lysosomes, cytosol,
nucleus, glia cells and serum.
Subproteomic localization of dystrophin
and its associated glycoprotein complex
Following the mass spectrometric characterization of
marker proteins in the subcellular fractions enriched in the
sarcolemma, transverse tubules and triad junctions, the proteomic
identification of dystrophin isoform Dp427-M and the core members
of the dystrophin-associated glycoprotein complex was carried out.
Table IV lists the findings from
the comprehensive LC-MS/MS analysis of the purified sarcolemma
fraction vs. other membrane preparations. Major components of the
dystrophin-glycoprotein complex, with the exception of
dystroglycans and sarcospan, were identified in crude surface
membranes. The lack of dystroglycan and sarcospan recognition is
probably due to high glycosylation levels and extreme
hydrophobicity of these dystrophin-associated proteins,
respectively, which often complicates their routine proteomic
identification. However, the characterization of sarcolemma
preparations clearly showed a high level of coverage of the core
dystrophin complex, including dystrophin, dystroglycans,
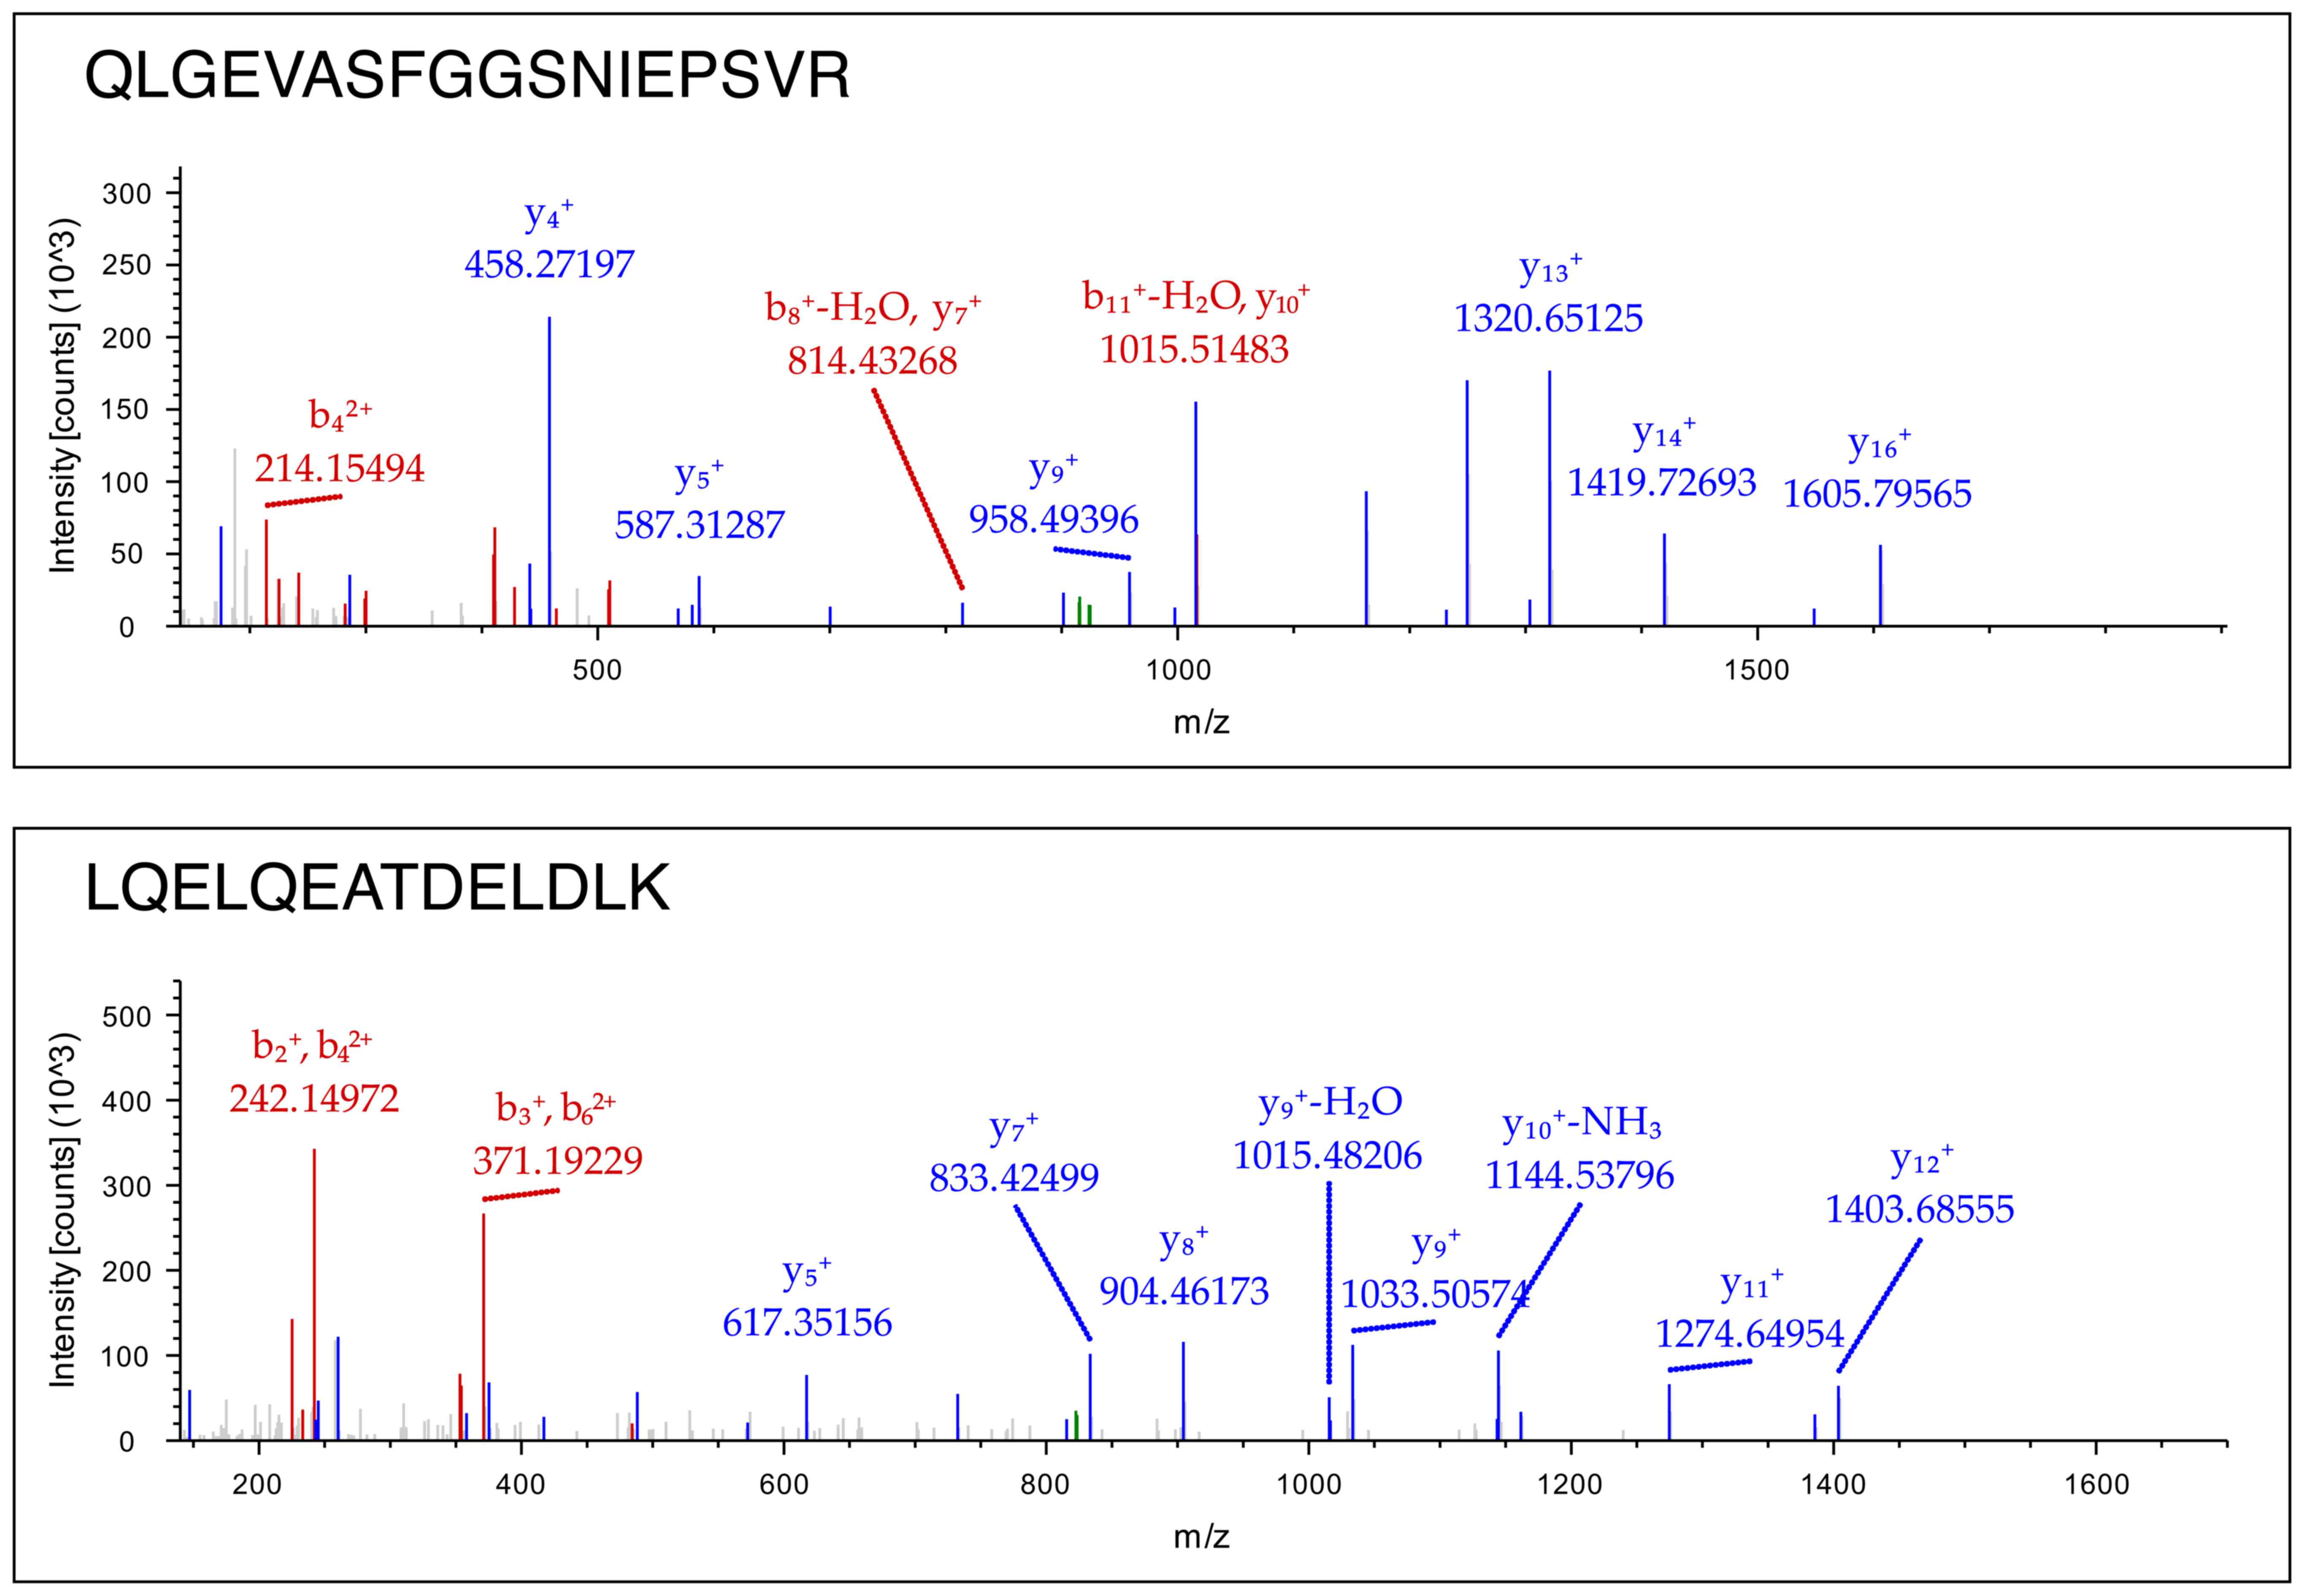
sarcoglycans, syntrophins and dystrobrevins (Table IV). Representative mass spectra
of 2 peptides derived from the digested dystrophin molecule in the
sarcolemma-enriched fraction are shown in Fig. 3. Detailed information on MS/MS
data of dystrophin, sarcoglycan, dystrobrevin and syntrophin can be
viewed as supplementary material on the publicly available online
digital repository named Figshare (https://figshare.com) with file name 'Mass spectra of
alpha dystrobrevin, beta syntrophin, alpha sarcoglycan and
dystrophin' (doi: 10.6084/m9.figshare.4906448).
In contrast to the high levels of the membrane
cytoskeletal protein Dp427-M and the α/β-dystroglycan subcomplex in
sarcolemma, a lower coverage was found in transverse tubules and no
presence in triads. In addition, α-, β-, γ- and δ-sarcoglycans were
shown to be enriched in sarcolemma vesicles and absent from triad
junctions. A minor component of the sarcoglycan complex,
ε-sarcoglycan (SGCE), is not listed, since it was identified by
only 1 peptide (5.8% coverage) in the sarcolemma. Cytosolic binding
partners of dystrophin, α1/β1/β2-syntrophins and α/β-dystrobrevins,
were also shown to be present at high coverage in sarcolemma
vesicles (Table IV). In
contrast, lower levels were detected in transverse tubules and none
were identified in the enriched triad fraction.
Discussion
Subcellular fractionation in combination with mass
spectro metry is a powerful biochemical tool to catalogue
organellar proteomes and compare the composition of distinct
subproteomes (59–61). The partial separation of
organelles and affinity purification of distinct membrane vesicles
across an optimized fractionation scheme, coupled with sensitive
protein identification techniques, can also be extremely helpful
for the prediction of protein subcellular localisation (62). Here, we used such an approach with
a combination of subcellular fractionation, gradient gel
electrophoresis, on-membrane digestion and mass spectrometry to
assign the dystrophin isoform, Dp427-M, and its tightly associated
glycoprotein complex to specific subcellular localisations in
skeletal muscles.
The protein constituents of distinct subcellular
fractions from skeletal muscle have previously been identified by a
variety of comprehensive subproteomic studies (35). This has included systematic
proteomic cataloguing approaches or the more focused mass
spectrometric characterization of subsets of proteins in
mitochondria (63–65), contact zones between mitochondria
and the sarcoplasmic reticulum (66), the unconjugated sarcoplasmic
reticulum (46,67), nuclei (68), plasmalemma (18), cytosol (69–71) and the contractile apparatus
(72,73). Building on these protein
databases, it is possible to evaluate the findings from new
proteomic screening surveys of subcellular fractions.
The purified sarcolemma vesicles studied in this
report by mass spectrometry showed a high content of surface
membrane markers such as the α-subunit of the
Na+/K+-ATPase and the sarcolemmal PMCA
isoform of the Ca2+-ATPase, which suggests a
considerable enrichment of plasma membrane structures by lectin
affinity agglutination (27).
This in turn demonstrates that dystrophin and its associated
glycoproteins are highly enriched in the sarcolemma of skeletal
muscle fibres (36–39,74) and not as initially assumed in the
triad junctions (24,25). However, almost all subcellular
fractionation studies are complicated by a certain degree of
cross-contamination by abundant membrane systems. This is probably
due to complex alterations that occur during tissue homogenization
and subcellular fractionation steps, including i) protein
desorption/adsorption processes; ii) the entrapment of proteins and
smaller vesicles in larger membrane vesicles; and iii) the
formation of mixtures of membrane sheets, inside-out vesicles and
right-side-out vesicles. In skeletal muscles, especially the
sarcoplasmic reticulum with its high density of
Ca2+-regulatory proteins (75), as recently confirmed by
subproteomic profiling studies (46,67), is often present in purified
vesicle preparations of other organelles. This was also shown to be
the case in this study. However, despite the fact that the purified
sarcolemma fraction contains a certain degree of other abundant
membrane systems, the dystrophin-glycoprotein was clearly shown to
be enriched in the sarcolemma membrane.
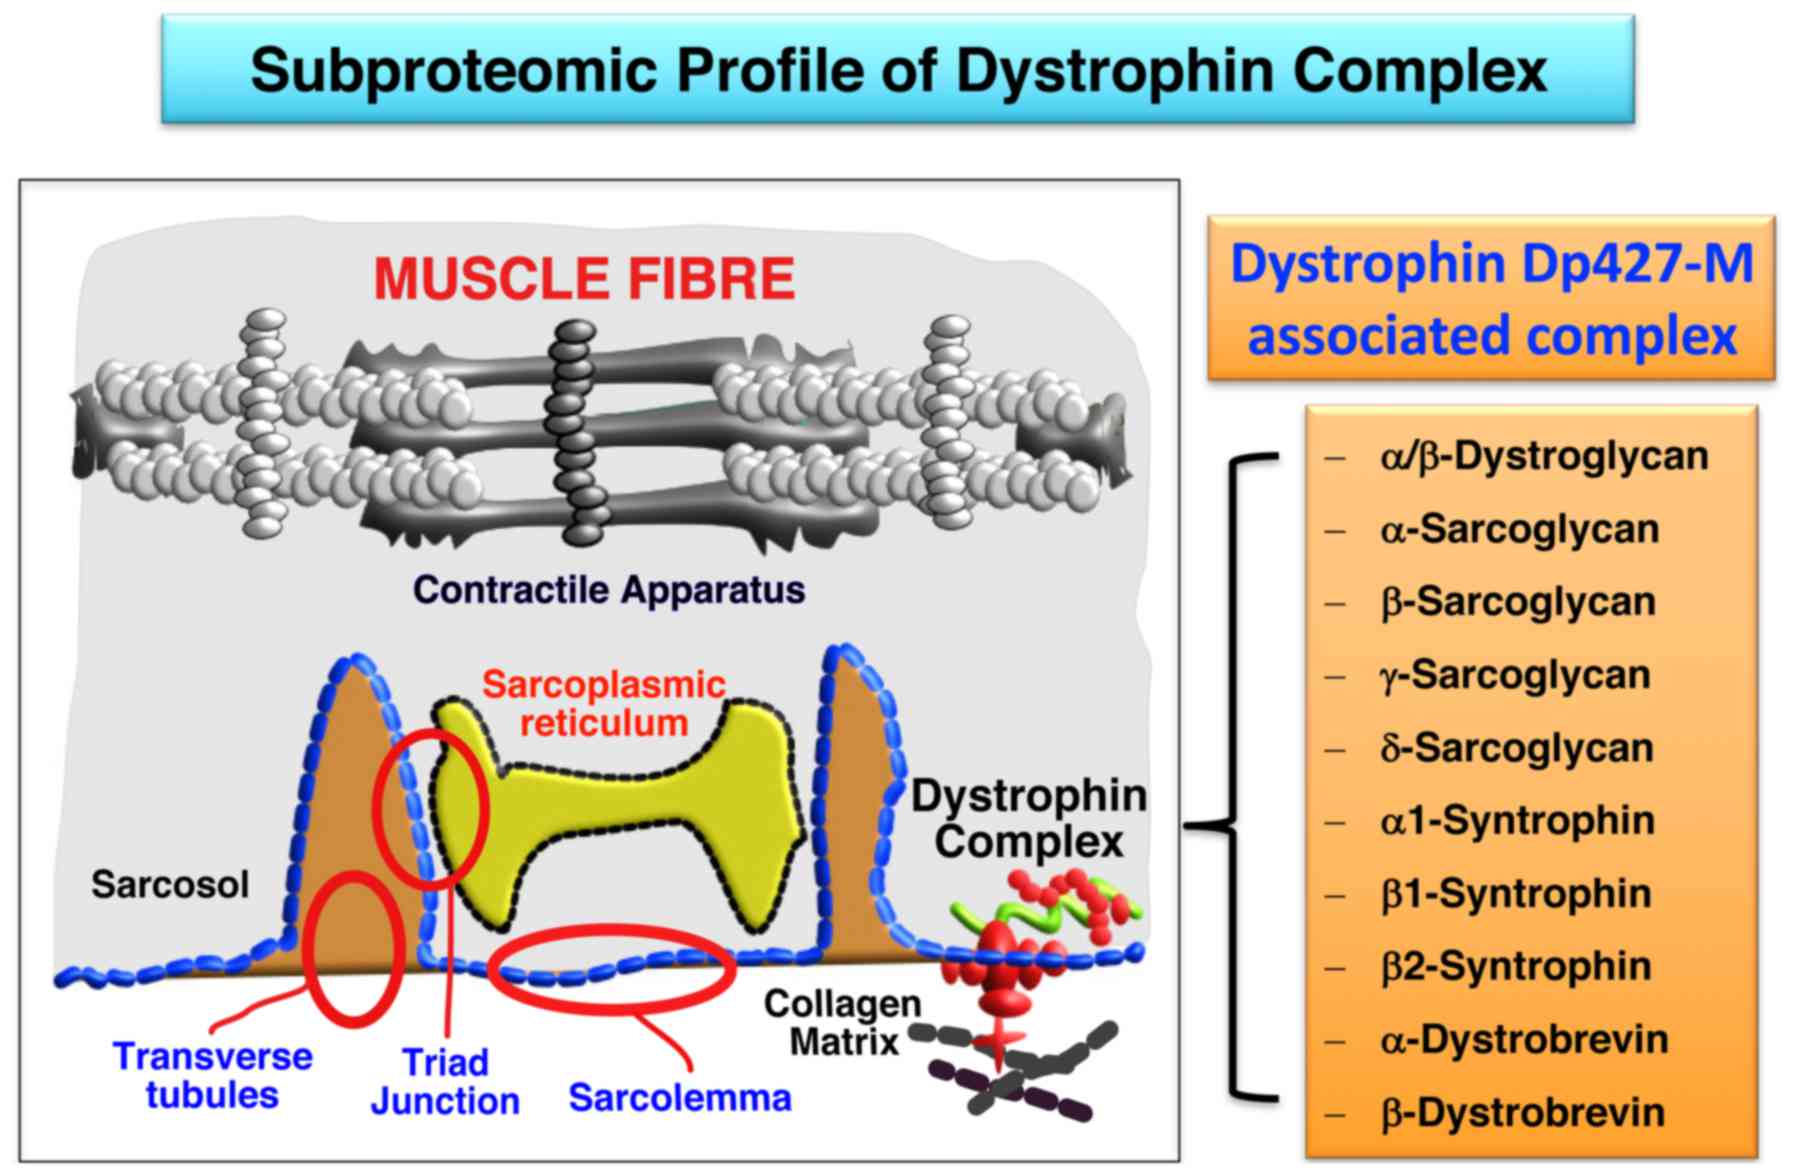
The key findings from the mass spectrometry-based
subproteomic survey presented in this report are summarized in
Fig. 4, showing diagrammatically
the subcellular localization of most of the components of the
dystrophin-glycoprotein complex in the sarcolemma. This is based on
the high sequence coverage of dystrophin isoform Dp427-M,
α/β-dystroglycan, α-sarcoglycan, β-sarcoglycan, γ-sarcoglycan,
δ-sarcoglycan, α1-syntrophin, β1-syntrophin, β2-syntrophin,
α-dystrobrevin and β-dystrobrevin, as determined by mass
spectrometric analysis. Thus, with the exception of the minor and
highly hydrophobic dystrophin-associated protein named sarcospan,
all other core elements of the dystrophin complex were
unequivocally identified by subproteomic means. This included the
integral glycoprotein β-dystroglycan as the direct cytoskeletal
linker of dystrophin to the plasmalemma, in conjunction with the
extracellular laminin-binding protein α-dystroglycan. The main
subunits of the integral sarcoglycan subcomplex, consisting of α-,
β-, γ- and δ-subunits, were also shown to be enriched in the
sarcolemma. Furthermore the cytosolic binding partners of
full-length muscle dystrophin, i.e. α1/β1/β2-syntrophins and
α/β-dystrobrevins, were clearly identified in the subfractionated
plasmalemma.
In conclusion, the dystrophin-glycoprotein complex
was unequivocally shown to be highly enriched in the sarcolemma
fraction and appears to exist at a lower density in the transverse
tubular part of the surface membrane. In agreement with extensive
cell biological and ultrastructural studies (36–39), dystrophin and its associated
glycoprotein complex seem to be absent from triads. Thus, the
sensitive subproteomic analysis presented in this study could
clearly establish a restricted subcellular localization of
dystrophin, which may be of considerable biomedical importance for
future comparative investigations into the molecular pathogenesis
of X-linked muscular dystrophy. Forthcoming studies with human
biopsy samples can now build on these subproteomic findings and
attempt to isolate sarcolemma-enriched fractions from dystrophic
vs. normal human muscles. Using highly sensitive mass spectrometry,
the comparative proteomic profiling of skeletal muscle specimens
from Duchenne patients may identify new dystrophin-associated
protein species and protein-protein interaction patterns within the
surface membrane and its associated sub-sarcolemmal cytoskeleton.
The biochemical and cell biological characterization of the
dystrophin complex and its wider network of binding proteins in
human muscles should establish new biomarker candidates for
improving diagnostic, prognostic and therapy-monitoring approaches
in X-linked muscular dystrophy.
Acknowledgments
The present study was supported by a Hume
scholarship from Maynooth University and project grants from
Muscular Dystrophy Ireland and the Irish Health Research Board
(HRB/MRCG-2016-20). The Q-Exactive quantitative mass spectrometer
was funded under the Research Infrastructure Call 2012 by Science
Foundation Ireland (SFI-12/RI/2346/3). The authors would like to
thank Dr Paul Dowling and Ms. Caroline Batchelor for expert
technical support and for help with data analysis.
References
|
1
|
Cifani P and Kentsis A: Towards
comprehensive and quantitative proteomics for diagnosis and therapy
of human disease. Proteomics. 17:Jan;2017.Epub ahead of print.
View Article : Google Scholar
|
|
2
|
Angel TE, Aryal UK, Hengel SM, Baker ES,
Kelly RT, Robinson EW and Smith RD: Mass spectrometry-based
proteomics: Existing capabilities and future directions. Chem Soc
Rev. 41:3912–3928. 2012. View Article : Google Scholar : PubMed/NCBI
|
|
3
|
Van Riper SK, de Jong EP, Carlis JV and
Griffin TJ: Mass spectrometry-based proteomics: Basic principles
and emerging technologies and directions. Adv Exp Med Biol.
990:1–35. 2013. View Article : Google Scholar : PubMed/NCBI
|
|
4
|
Zhang Z, Wu S, Stenoien DL and Paša-Tolić
L: High-throughput proteomics. Annu Rev Anal Chem (Palo Alto,
Calif). 7:427–454. 2014. View Article : Google Scholar
|
|
5
|
Allen DG, Whitehead NP and Froehner SC:
Absence of dystrophin disrupts skeletal muscle signaling: Roles of
Ca2+, reactive oxygen species, and nitric oxide in the
development of muscular dystrophy. Physiol Rev. 96:253–305. 2016.
View Article : Google Scholar
|
|
6
|
Holland A, Murphy S, Dowling P and
Ohlendieck K: Pathoproteomic profiling of the skeletal muscle
matrisome in dystrophinopathy associated myofibrosis. Proteomics.
16:345–366. 2016. View Article : Google Scholar
|
|
7
|
Ohlendieck K and Swandulla D: Molecular
pathogenesis of Duchenne muscular dystrophy-related fibrosis.
Pathologe. 38:21–29. 2017.In German. View Article : Google Scholar : PubMed/NCBI
|
|
8
|
Murphy S and Ohlendieck K: The biochemical
and mass spectrometric profiling of the dystrophin complexome from
skeletal muscle. Comput Struct Biotechnol J. 14:20–27. 2015.
View Article : Google Scholar
|
|
9
|
Fuller HR, Graham LC, Llavero Hurtado M
and Wishart TM: Understanding the molecular consequences of
inherited muscular dystrophies: Advancements through proteomic
experimentation. Expert Rev Proteomics. 13:659–671. 2016.
View Article : Google Scholar : PubMed/NCBI
|
|
10
|
Guiraud S, Aartsma-Rus A, Vieira NM,
Davies KE, van Ommen GJ and Kunkel LM: The pathogenesis and therapy
of muscular dystrophies. Annu Rev Genomics Hum Genet. 16:281–308.
2015. View Article : Google Scholar : PubMed/NCBI
|
|
11
|
Doran P, Martin G, Dowling P, Jockusch H
and Ohlendieck K: Proteome analysis of the dystrophin-deficient MDX
diaphragm reveals a drastic increase in the heat shock protein
cvHSP. Proteomics. 6:4610–4621. 2006. View Article : Google Scholar : PubMed/NCBI
|
|
12
|
Rayavarapu S, Coley W, Cakir E, Jahnke V,
Takeda S, Aoki Y, Grodish-Dressman H, Jaiswal JK, Hoffman EP, Brown
KJ, et al: Identification of disease specific pathways using in
vivo SILAC proteomics in dystrophin deficient mdx mouse. Mol Cell
Proteomics. 12:1061–1073. 2013. View Article : Google Scholar : PubMed/NCBI
|
|
13
|
Holland A, Henry M, Meleady P, Winkler CK,
Krautwald M, Brinkmeier H and Ohlendieck K: Comparative label-free
mass spectrometric analysis of mildly versus severely affected mdx
mouse skeletal muscles identifies Annexin, lamin, and Vimentin as
universal dystrophic markers. Molecules. 20:11317–11344. 2015.
View Article : Google Scholar : PubMed/NCBI
|
|
14
|
Holland A, Dowling P, Meleady P, Henry M,
Zweyer M, Mundegar RR, Swandulla D and Ohlendieck K: Label-free
mass spectrometric analysis of the mdx-4cv diaphragm identifies the
matricellular protein periostin as a potential factor involved in
dystrophinopathy-related fibrosis. Proteomics. 15:2318–2331. 2015.
View Article : Google Scholar : PubMed/NCBI
|
|
15
|
Holland A, Carberry S and Ohlendieck K:
Proteomics of the dystrophin-glycoprotein complex and
dystrophinopathy. Curr Protein Pept Sci. 14:680–697. 2013.
View Article : Google Scholar : PubMed/NCBI
|
|
16
|
Dowling P, Holland A and Ohlendieck K:
Mass spectrometry-based identification of muscle-associated and
muscle-derived proteomic biomarkers of dystrophinopathies. J
Neuromuscul Dis. 1:15–40. 2014.PubMed/NCBI
|
|
17
|
Murphy S, Dowling P and Ohlendieck K:
Comparative skeletal muscle proteomics using two-dimensional gel
electrophoresis. Proteomes. 4:272016. View Article : Google Scholar
|
|
18
|
Lewis C and Ohlendieck K: Mass
spectrometric identification of dystrophin isoform Dp427 by
on-membrane digestion of sarcolemma from skeletal muscle. Anal
Biochem. 404:197–203. 2010. View Article : Google Scholar : PubMed/NCBI
|
|
19
|
Yoon JH, Johnson E, Xu R, Martin LT,
Martin PT and Montanaro F: Comparative proteomic profiling of
dystroglycan-associated proteins in wild type, mdx, and Galgt2
transgenic mouse skeletal muscle. J Proteome Res. 11:4413–4424.
2012. View Article : Google Scholar : PubMed/NCBI
|
|
20
|
Murphy S, Henry M, Meleady P, Zweyer M,
Mundegar RR, Swandulla D and Ohlendieck K: Simultaneous
pathoproteomic evaluation of the dystrophin-glycoprotein complex
and secondary changes in the mdx-4cv mouse model of Duchenne
muscular dystrophy. Biology (Basel). 4:397–423. 2015.
|
|
21
|
Murphy S, Zweyer M, Mundegar RR, Henry M,
Meleady P, Swandulla D and Ohlendieck K: Concurrent label-free mass
spectrometric analysis of dystrophin isoform Dp427 and the
myofibrosis marker collagen in crude extracts from mdx-4cv skeletal
muscles. Proteomes. 3:298–327. 2015. View Article : Google Scholar : PubMed/NCBI
|
|
22
|
Turk R, Hsiao JJ, Smits MM, Ng BH,
Pospisil TC, Jones KS, Campbell KP and Wright ME: Molecular
signatures of membrane protein complexes underlying muscular
dystrophy. Mol Cell Proteomics. 15:2169–2185. 2016. View Article : Google Scholar : PubMed/NCBI
|
|
23
|
Bonilla E, Samitt CE, Miranda AF, Hays AP,
Salviati G, DiMauro S, Kunkel LM, Hoffman EP and Rowland LP:
Duchenne muscular dystrophy: Deficiency of dystrophin at the muscle
cell surface. Cell. 54:447–452. 1988. View Article : Google Scholar : PubMed/NCBI
|
|
24
|
Hoffman EP, Knudson CM, Campbell KP and
Kunkel LM: Subcellular fractionation of dystrophin to the triads of
skeletal muscle. Nature. 330:754–758. 1987. View Article : Google Scholar : PubMed/NCBI
|
|
25
|
Knudson CM, Hoffman EP, Kahl SD, Kunkel LM
and Campbell KP: Evidence for the association of dystrophin with
the transverse tubular system in skeletal muscle. J Biol Chem.
263:8480–8484. 1988.PubMed/NCBI
|
|
26
|
Salviati G, Betto R, Ceoldo S, Biasia E,
Bonilla E, Miranda AF and Dimauro S: Cell fractionation studies
indicate that dystrophin is a protein of surface membranes of
skeletal muscle. Biochem J. 258:837–841. 1989. View Article : Google Scholar : PubMed/NCBI
|
|
27
|
Ohlendieck K, Ervasti JM, Snook JB and
Campbell KP: Dystrophin-glycoprotein complex is highly enriched in
isolated skeletal muscle sarcolemma. J Cell Biol. 112:135–148.
1991. View Article : Google Scholar : PubMed/NCBI
|
|
28
|
Ohlendieck K and Campbell KP: Dystrophin
constitutes 5% of membrane cytoskeleton in skeletal muscle. FEBS
Lett. 283:230–234. 1991. View Article : Google Scholar : PubMed/NCBI
|
|
29
|
Ohlendieck K and Campbell KP:
Dystrophin-associated proteins are greatly reduced in skeletal
muscle from mdx mice. J Cell Biol. 115:1685–1694. 1991. View Article : Google Scholar : PubMed/NCBI
|
|
30
|
Ohlendieck K, Matsumura K, Ionasescu VV,
Towbin JA, Bosch EP, Weinstein SL, Sernett SW and Campbell KP:
Duchenne muscular dystrophy: Deficiency of dystrophin-associated
proteins in the sarcolemma. Neurology. 43:795–800. 1993. View Article : Google Scholar : PubMed/NCBI
|
|
31
|
Dowling P, Lohan J and Ohlendieck K:
Comparative analysis of Dp427-deficient mdx tissues shows that the
milder dystrophic phenotype of extraocular and toe muscle fibres is
associated with a persistent expression of beta-dystroglycan. Eur J
Cell Biol. 82:222–230. 2003. View Article : Google Scholar : PubMed/NCBI
|
|
32
|
Cluchague N, Moreau C, Rocher C, Pottier
S, Leray G, Cherel Y and Le Rumeur E: beta-Dystroglycan can be
revealed in microsomes from mdx mouse muscle by detergent
treatment. FEBS Lett. 572:216–220. 2004. View Article : Google Scholar : PubMed/NCBI
|
|
33
|
Daval S, Rocher C, Cherel Y and Le Rumeur
E: Several dystrophin-glycoprotein complex members are present in
crude surface membranes but they are sodium dodecyl sulphate
invisible in KCl-washed microsomes from mdx mouse muscle. Cell Mol
Biol Lett. 15:134–152. 2010. View Article : Google Scholar
|
|
34
|
Ohlendieck K: On-membrane digestion
technology for muscle proteomics. J Membr Sep Technol. 2:1–12.
2013.
|
|
35
|
Ohlendieck K: Organelle proteomics in
skeletal muscle biology. J Integr OMICS. 2:27–38. 2012. View Article : Google Scholar
|
|
36
|
Zubrzycka-Gaarn EE, Bulman DE, Karpati G,
Burghes AH, Belfall B, Klamut HJ, Talbot J, Hodges RS, Ray PN and
Worton RG: The Duchenne muscular dystrophy gene product is
localized in sarcolemma of human skeletal muscle. Nature.
333:466–469. 1988. View Article : Google Scholar : PubMed/NCBI
|
|
37
|
Watkins SC, Hoffman EP, Slayter HS and
Kunkel LM: Immunoelectron microscopic localization of dystrophin in
myofibres. Nature. 333:863–866. 1988. View Article : Google Scholar : PubMed/NCBI
|
|
38
|
Cullen MJ, Walsh J, Nicholson LV and
Harris JB: Ultrastructural localization of dystrophin in human
muscle by using gold immunolabelling. Proc R Soc Lond B Biol Sci.
240:197–210. 1990. View Article : Google Scholar : PubMed/NCBI
|
|
39
|
Carpenter S, Karpati G, Zubrzycka-Gaarn E,
Bulman DE, Ray PN and Worton RG: Dystrophin is localized to the
plasma membrane of human skeletal muscle fibers by
electron-microscopic cytochemical study. Muscle Nerve. 13:376–380.
1990. View Article : Google Scholar : PubMed/NCBI
|
|
40
|
Staunton L, Jockusch H, Wiegand C,
Albrecht T and Ohlendieck K: Identification of secondary effects of
hyperexcit-ability by proteomic profiling of myotonic mouse muscle.
Mol Biosyst. 7:2480–2489. 2011. View Article : Google Scholar : PubMed/NCBI
|
|
41
|
Murray BE and Ohlendieck K: Cross-linking
analysis of the ryanodine receptor and alpha1-dihydropyridine
receptor in rabbit skeletal muscle triads. Biochem J. 324:689–696.
1997. View Article : Google Scholar : PubMed/NCBI
|
|
42
|
Bradford MM: A rapid and sensitive method
for the quantitation of microgram quantities of protein utilizing
the principle of protein-dye binding. Anal Biochem. 72:248–254.
1976. View Article : Google Scholar : PubMed/NCBI
|
|
43
|
Rosemblatt M, Hidalgo C, Vergara C and
Ikemoto N: Immunological and biochemical properties of transverse
tubule membranes isolated from rabbit skeletal muscle. J Biol Chem.
56:8140–8148. 1981.
|
|
44
|
Sharp AH, Imagawa T, Leung AT and Campbell
KP: Identification and characterization of the
dihydropyridine-binding subunit of the skeletal muscle
dihydropyridine receptor. J Biol Chem. 262:12309–12315.
1987.PubMed/NCBI
|
|
45
|
Muñoz P, Rosemblatt M, Testar X, Palacín M
and Zorzano A: Isola tion and characterization of distinct domains
of sarcolemma and T-tubules from rat skeletal muscle. Biochem J.
307:273–280. 1995. View Article : Google Scholar
|
|
46
|
Staunton L and Ohlendieck K: Mass
spectrometric characterization of the sarcoplasmic reticulum from
rabbit skeletal muscle by on-membrane digestion. Protein Pept Lett.
19:252–263. 2012. View Article : Google Scholar
|
|
47
|
Ohlendieck K: Characterisation of the
dystrophin-related protein utrophin in highly purified skeletal
muscle sarcolemma vesicles. Biochim Biophys Acta. 1283:215–222.
1996. View Article : Google Scholar : PubMed/NCBI
|
|
48
|
Vretblad P: Purification of lectins by
biospecific affinity chromatography. Biochim Biophys Acta.
434:169–176. 1976. View Article : Google Scholar : PubMed/NCBI
|
|
49
|
Luque-Garcia JL, Zhou G, Sun TT and
Neubert TA: Use of nitrocellulose membranes for protein
characterization by matrix-assisted laser desorption/ionization
mass spectrometry. Anal Chem. 78:5102–5108. 2006. View Article : Google Scholar : PubMed/NCBI
|
|
50
|
Luque-Garcia JL, Zhou G, Spellman DS, Sun
TT and Neubert TA: Analysis of electroblotted proteins by mass
spectrometry: Protein identification after western blotting. Mol
Cell Proteomics. 7:308–314. 2008. View Article : Google Scholar
|
|
51
|
Luque-Garcia JL and Neubert TA:
On-membrane tryptic digestion of proteins for mass spectrometry
analysis. Methods Mol Biol. 536:331–341. 2009. View Article : Google Scholar : PubMed/NCBI
|
|
52
|
Shevchenko A, Tomas H, Havlis J, Olsen JV
and Mann M: In-gel digestion for mass spectrometric
characterization of proteins and proteomes. Nat Protoc.
1:2856–2860. 2006. View Article : Google Scholar
|
|
53
|
Murphy S, Dowling P, Zweyer M, Mundegar
RR, Henry M, Meleady P, Swandulla D and Ohlendieck K: Proteomic
analysis of dystrophin deficiency and associated changes in the
aged mdx-4cv heart model of dystrophinopathy-related
cardiomyopathy. J Proteomics. 145:24–36. 2016. View Article : Google Scholar : PubMed/NCBI
|
|
54
|
Liu Y, Bouhenni RA, Dufresne CP, Semba RD
and Edward DP: Differential expression of vitreous proteins in
young and mature New Zealand white rabbits. PLoS One.
11:e01535602016. View Article : Google Scholar : PubMed/NCBI
|
|
55
|
Ryan M, Butler-Browne G, Erzen I, Mouly V,
Thornell LE, Wernig A and Ohlendieck K: Persistent expression of
the alpha1S-dihydropyridine receptor in aged human skeletal muscle:
Implications for the excitation-contraction uncoupling hypothesis
of sarcopenia. Int J Mol Med. 11:425–434. 2003.PubMed/NCBI
|
|
56
|
Glover L, Heffron JJ and Ohlendieck K:
Increased sensitivity of the ryanodine receptor to
halothane-induced oligomerization in malignant
hyperthermia-susceptible human skeletal muscle. J Appl Physiol
1985. 96:11–18. 2004. View Article : Google Scholar
|
|
57
|
Staunton L, Zweyer M, Swandulla D and
Ohlendieck K: Mass spectrometry-based proteomic analysis of
middle-aged vs. aged vastus lateralis reveals increased levels of
carbonic anhydrase isoform 3 in senescent human skeletal muscle.
Int J Mol Med. 30:723–733. 2012. View Article : Google Scholar : PubMed/NCBI
|
|
58
|
Chartier A, Klein P, Pierson S, Barbezier
N, Gidaro T, Casas F, Carberry S, Dowling P, Maynadier L, Bellec M,
et al: Mitochondrial dysfunction reveals the role of mRNA poly(A)
tail regulation in oculopharyngeal muscular dystrophy pathogenesis.
PLoS Genet. 11:e10050922015. View Article : Google Scholar : PubMed/NCBI
|
|
59
|
Drissi R, Dubois ML and Boisvert FM:
Proteomics methods for subcellular proteome analysis. FEBS J.
280:5626–5634. 2013. View Article : Google Scholar : PubMed/NCBI
|
|
60
|
Breckels LM, Gatto L, Christoforou A,
Groen AJ, Lilley KS and Trotter MW: The effect of organelle
discovery upon sub-cellular protein localisation. J Proteomics.
88:129–140. 2013. View Article : Google Scholar : PubMed/NCBI
|
|
61
|
Mueller SJ, Hoernstein SN and Reski R:
Approaches to characterize organelle, compartment, or structure
purity. Methods Mol Biol. 1511:13–28. 2017. View Article : Google Scholar
|
|
62
|
Larance M and Lamond AI: Multidimensional
proteomics for cell biology. Nat Rev Mol Cell Biol. 16:269–280.
2015. View Article : Google Scholar : PubMed/NCBI
|
|
63
|
Lefort N, Yi Z, Bowen B, Glancy B, De
Filippis EA, Mapes R, Hwang H, Flynn CR, Willis WT, Civitarese A,
et al: Proteome profile of functional mitochondria from human
skeletal muscle using one-dimensional gel electrophoresis and
HPLC-ESI-MS/MS. J Proteomics. 72:1046–1060. 2009. View Article : Google Scholar : PubMed/NCBI
|
|
64
|
Lombardi A, Silvestri E, Cioffi F, Senese
R, Lanni A, Goglia F, de Lange P and Moreno M: Defining the
transcriptomic and proteomic profiles of rat ageing skeletal muscle
by the use of a cDNA array, 2D- and Blue native-PAGE approach. J
Proteomics. 72:708–721. 2009. View Article : Google Scholar : PubMed/NCBI
|
|
65
|
Ferreira R, Vitorino R, Alves RM, Appell
HJ, Powers SK, Duarte JA and Amado F: Subsarcolemmal and
intermyofibrillar mitochondria proteome differences disclose
functional specializations in skeletal muscle. Proteomics.
10:3142–3154. 2010. View Article : Google Scholar : PubMed/NCBI
|
|
66
|
Liu Z, Du X, Deng J, Gu M, Hu H, Gui M,
Yin CC and Chang Z: The interactions between mitochondria and
sarcoplasmic reticulum and the proteome characterization of
mitochondrion-associated membrane from rabbit skeletal muscle.
Proteomics. 15:2701–2704. 2015. View Article : Google Scholar : PubMed/NCBI
|
|
67
|
Liu Z, Du X, Yin C and Chang Z: Shotgun
proteomic analysis of sarcoplasmic reticulum preparations from
rabbit skeletal muscle. Proteomics. 13:2335–2338. 2013. View Article : Google Scholar : PubMed/NCBI
|
|
68
|
Vitorino R, Ferreira R, Neuparth M, Guedes
S, Williams J, Tomer KB, Domingues PM, Appell HJ, Duarte JA and
Amado M: Subcellular proteomics of mice gastrocnemius and soleus
muscles. Anal Biochem. 366:156–169. 2007. View Article : Google Scholar : PubMed/NCBI
|
|
69
|
Toigo M, Donohoe S, Sperrazzo G, Jarrold
B, Wang F, Hinkle R, Dolan E, Isfort RJ and Aebersold R: ICAT-MS-MS
time course analysis of atrophying mouse skeletal muscle cytosolic
subproteome. Mol Biosyst. 1:229–241. 2005. View Article : Google Scholar
|
|
70
|
Maughan DW, Henkin JA and Vigoreaux JO:
Concentrations of glycolytic enzymes and other cytosolic proteins
in the diffusible fraction of a vertebrate muscle proteome. Mol
Cell Proteomics. 4:1541–1549. 2005. View Article : Google Scholar : PubMed/NCBI
|
|
71
|
Ohlendieck K: Proteomics of skeletal
muscle glycolysis. Biochim Biophys Acta. 1804:2089–2101. 2010.
View Article : Google Scholar : PubMed/NCBI
|
|
72
|
Gannon J, Doran P, Kirwan A and Ohlendieck
K: Drastic increase of myosin light chain MLC-2 in senescent
skeletal muscle indicates fast-to-slow fibre transition in
sarcopenia of old age. Eur J Cell Biol. 88:685–700. 2009.
View Article : Google Scholar : PubMed/NCBI
|
|
73
|
Holland A and Ohlendieck K: Proteomic
profiling of the contractile apparatus from skeletal muscle. Expert
Rev Proteomics. 10:239–257. 2013. View Article : Google Scholar : PubMed/NCBI
|
|
74
|
Ohlendieck K: Towards an understanding of
the dystrophin-glycoprotein complex: Linkage between the
extracellular matrix and the membrane cytoskeleton in muscle
fibers. Eur J Cell Biol. 69:1–10. 1996.PubMed/NCBI
|
|
75
|
Murray BE, Froemming GR, Maguire PB and
Ohlendieck K: Excitation-contraction-relaxation cycle: Role of
Ca2+-regulatory membrane proteins in normal, stimulated
and pathological skeletal muscle (Review). Int J Mol Med.
1:677–687. 1998.PubMed/NCBI
|