Introduction
Nasopharyngeal carcinoma (NPC) is one of the most
common types of cancer affecting populations in Southern China and
Southeast Asia. It has led to a very serious health concern in
these areas (1,2). As far as we know, due to its
location-specific characteristics and sensitivity to radiation,
radiotherapy (RT) is the main treatment for NPC (3). With the appearance of
intensity-modulated radiation therapy (IMRT), dose escalation, and
the use of concurrent chemotherapy, the 5-year survival rate for
patients with early-stage NPC can reach approximately 90%, although
for patients with advanced NPC, the rats is 70% (4). However, approximately 20% of
patients with NPC suffer from local recurrence even after the
above-mentioned effective therapies (1). Currently, the detection of recurrent
NPC (rNPC) mainly depends on the imaging or biopsy examination of
diseased tissue; both of these methods work mostly if the target
tumor is at an advanced stage (5). Furthermore, it is difficult to
obtain tissue from recurrent disease for biopsy, and the difference
between the side of recurrence and the tissue which changed by RT
in imaging is difficult to distinguish. Therefore, the
identification of serum biomarkers is warranted. In the first
place, compared to tissue biopsy, the collection of serum is a less
harmful method and serum is more easily obtained. Moreover, tumor
biomarkers are molecules produced specifically or in excess of
normal tissue by the pre-malignant cell, tumor cell or recurrent
cancer cell, which may accumulate and are released into the
circulation. These can help in the diagnosis, monitoring and
prognosis of the treatment response (6). It is known that alpha-fetoprotein
(AFP), cancer antigen (CA)-125, prostate-specific antigen (PSA) are
used as serum biomarkers for the diagnosis, monitoring and the
prognosis of liver, ovarian and prostate cancer, respectively.
Serum biomarkers may also be used to identify recurrent cancers. At
present, carcinoembryonic antigen (CEA) is a recurrent-related
biomarker for colorectal tumors (7).
In addition, previous studies have reported some
early predictive biomarkers for NPC, such as heat shock protein 27
(HSP27) (8), cathepsin D and
keratin 8 (9), alpha-2
macroglobulin (A2M or AMG) and complement factor B (CFB) (10), as well as Galectin-1 (11). To date, some biomarkers for
recurrent disease have also been reported, such as serum amyloid A
(SAA) (12) and Epstein-Barr
virus (EBV) DNA (13); however,
these markers for rNPC still lack high predictive value in clinical
practice. Therefore, there is an urgent need for the identification
of novel putative biomarkers.
Furthermore, a preliminary pathway analysis is
necessary, which can provide an approach with which to reveal the
potential molecular mechanisms of recurrence, and which has been
widely used in other diseases (14,15).
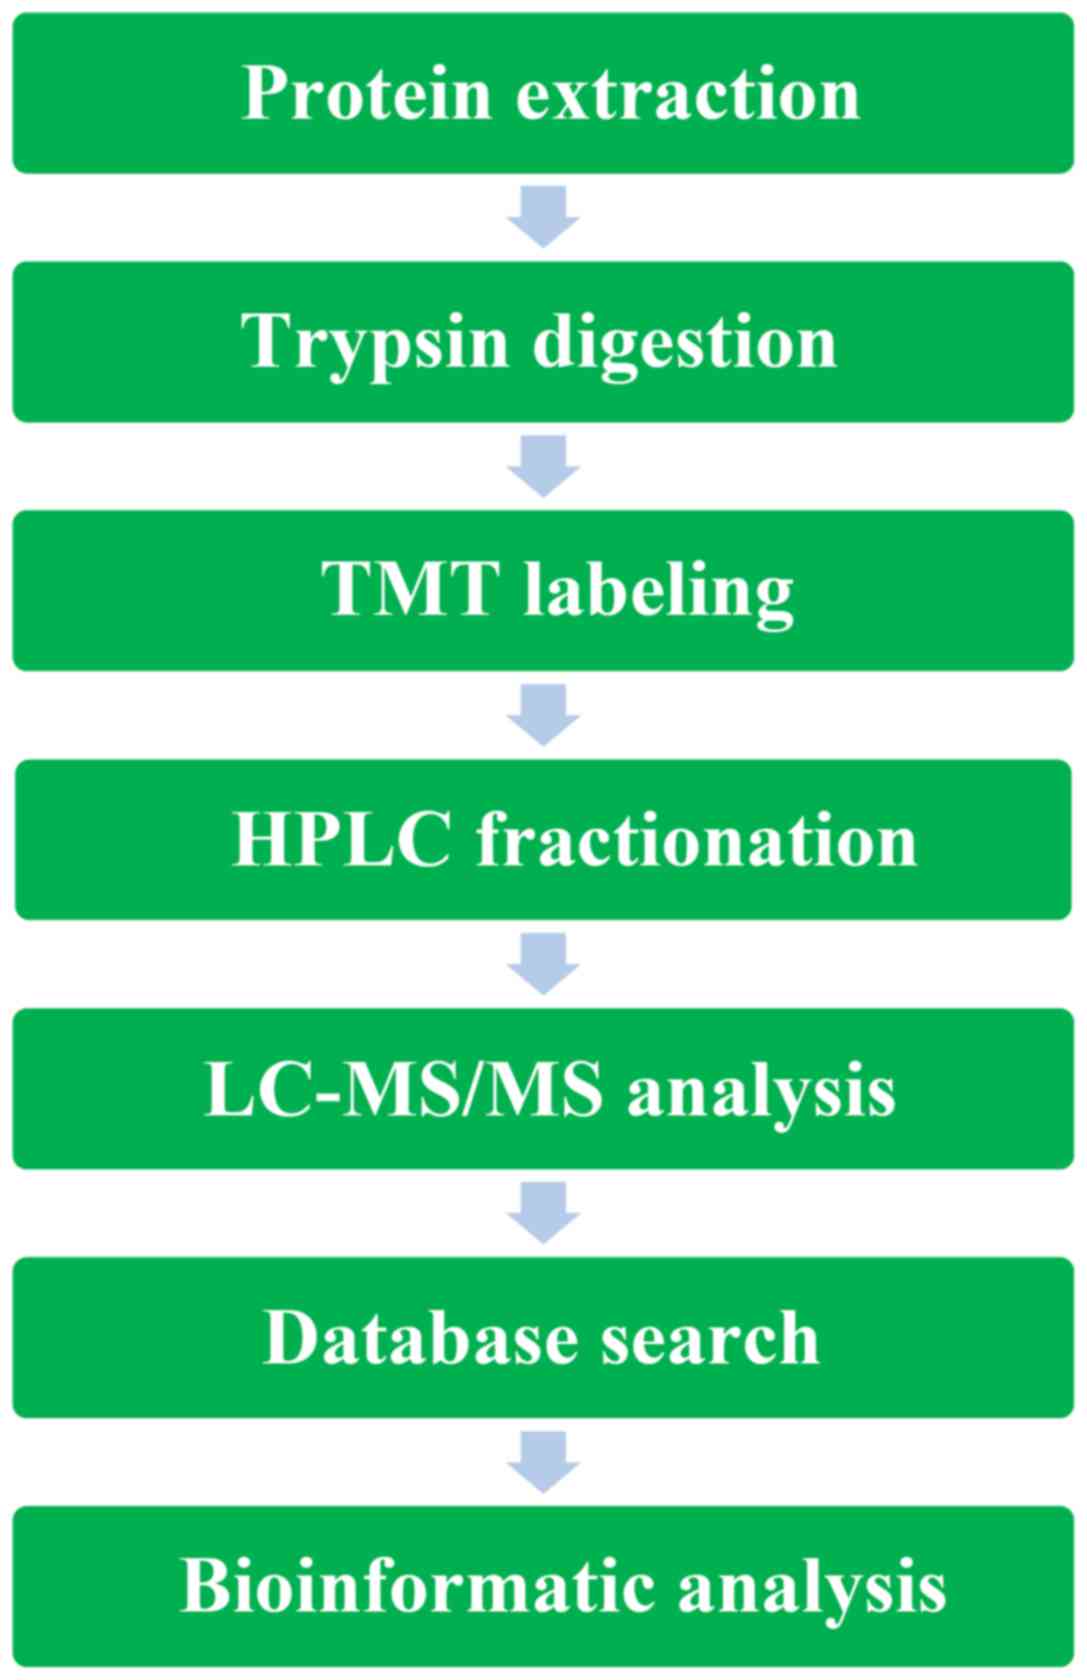
In the present study, in an aim to identify new
biomarkers for rNPC, and in order to analyze serum-expressed
proteins, we performed tandem mass tag (TMT) labeling and high
performance liquid chromatography (HPLC) fractionation followed by
liquid chromatography-tandem mass spectrometry (LC-MS/MS). We
considered that this would be an effective tool for screening
proteomic biomarkers.
Patients and methods
Ethics
The present study was approved by the Joint Ethics
Committee of the Guangxi Medical University Health Authority. All
patients provided written informed consent prior to obtaining any
samples. All human serum and clinical information was obtained from
the Affiliated Cancer Hospital of Guangxi Medical University.
According to the criteria established by the Chinese staging system
of NPC in 2008 and the UICC/AJCC staging system in 2010; each
patient with NPC was diagnosed and confirmed by a pathological
examination.
Patient information
We selected 114 patients with NPC with
histologically proven squamous cell carcinoma who were treated by
IMRT or conventional radiotheraphy (con-RT) (a total prescribed
dose of ≥70 Gy), using a modified linear accelerator at the
Affiliated Cancer Hospital of Guangxi Medical University, China,
from January 2010 to June 2015. In total we recruited 52 patients
with rNPC and 62 with non-recurrent NPC (nrNPC). The patients with
rNPC were defined as those with histologically proven recurrence,
and with no metastasis proven by imaging following radical cure RT
3 months later (with or without chemotherapy). Patients with nrNPC
were those in which no proven recurrence or metastasis following
radical cure RT (with or without chemotherapy) was found. The basic
clinical parameters of the included patients are shown in Table I.
 | Table IBasic clinical parameters between
patients with recurrent NPC, and those with non-recurrent NPC. |
Table I
Basic clinical parameters between
patients with recurrent NPC, and those with non-recurrent NPC.
A, Discovery samples
|
|---|
| Variables | nrNPC | rNPC | P-value |
|---|
| Sex (no.) | | | |
| Male | 15 | 16 | >0.05 |
| Female | 5 | 4 | >0.05 |
| Clinical stage
(no.) | | | |
| Low (i+ii) | 5 | 2 | |
| High (iii+iv) | 15 | 18 | >0.05 |
| Median age
(years) | 42 | 48.5 | >0.05 |
|
| B, Validation
samples | | | |
|
| Variables | nrNPC | rNPC | P-value |
|
| Sex (no.) | | | |
| Male | 35 | 29 | >0.05 |
| Female | 7 | 3 | >0.05 |
| Clinical stage
(no.) | | | |
| Low (i+ii) | 8 | 5 | |
| High (iii+iv) | 34 | 27 | >0.05 |
| Median age
(years) | 45 | 46 | >0.05 |
Serum separation
A total of 3 ml venous blood was collected from each
subject. Samples were placed standing for 30 min and then
centrifuged at 3,000 rpm for 10 min. The supernatant was separated
and stored in different tubes at −80°C. A part of the serum was
utilized for the discovery of dysregulated peptide, whereas the
other part was prepared for the validation of target proteins.
Materials and reagents
Two pairs (termed studies; 10 rNPC and 10
nrNPC/study) patient sera were randomly selected and dissolved in a
refrigerator at 2–8°C. Subsequently, for reducing individual
heterogeneity (16), an equal
amount of 10 NPC samples from both the rNPC and nrNPC groups were
mixed to generate 2 sample pools. Of the 20 Discovery samples (20
rNPC and 20 nrNPC) study1 randomly included 10 rNPC and 10 nrNPC
samples; the remaining 10 rNPC and 10 nrNPC samples, were included
as study2.
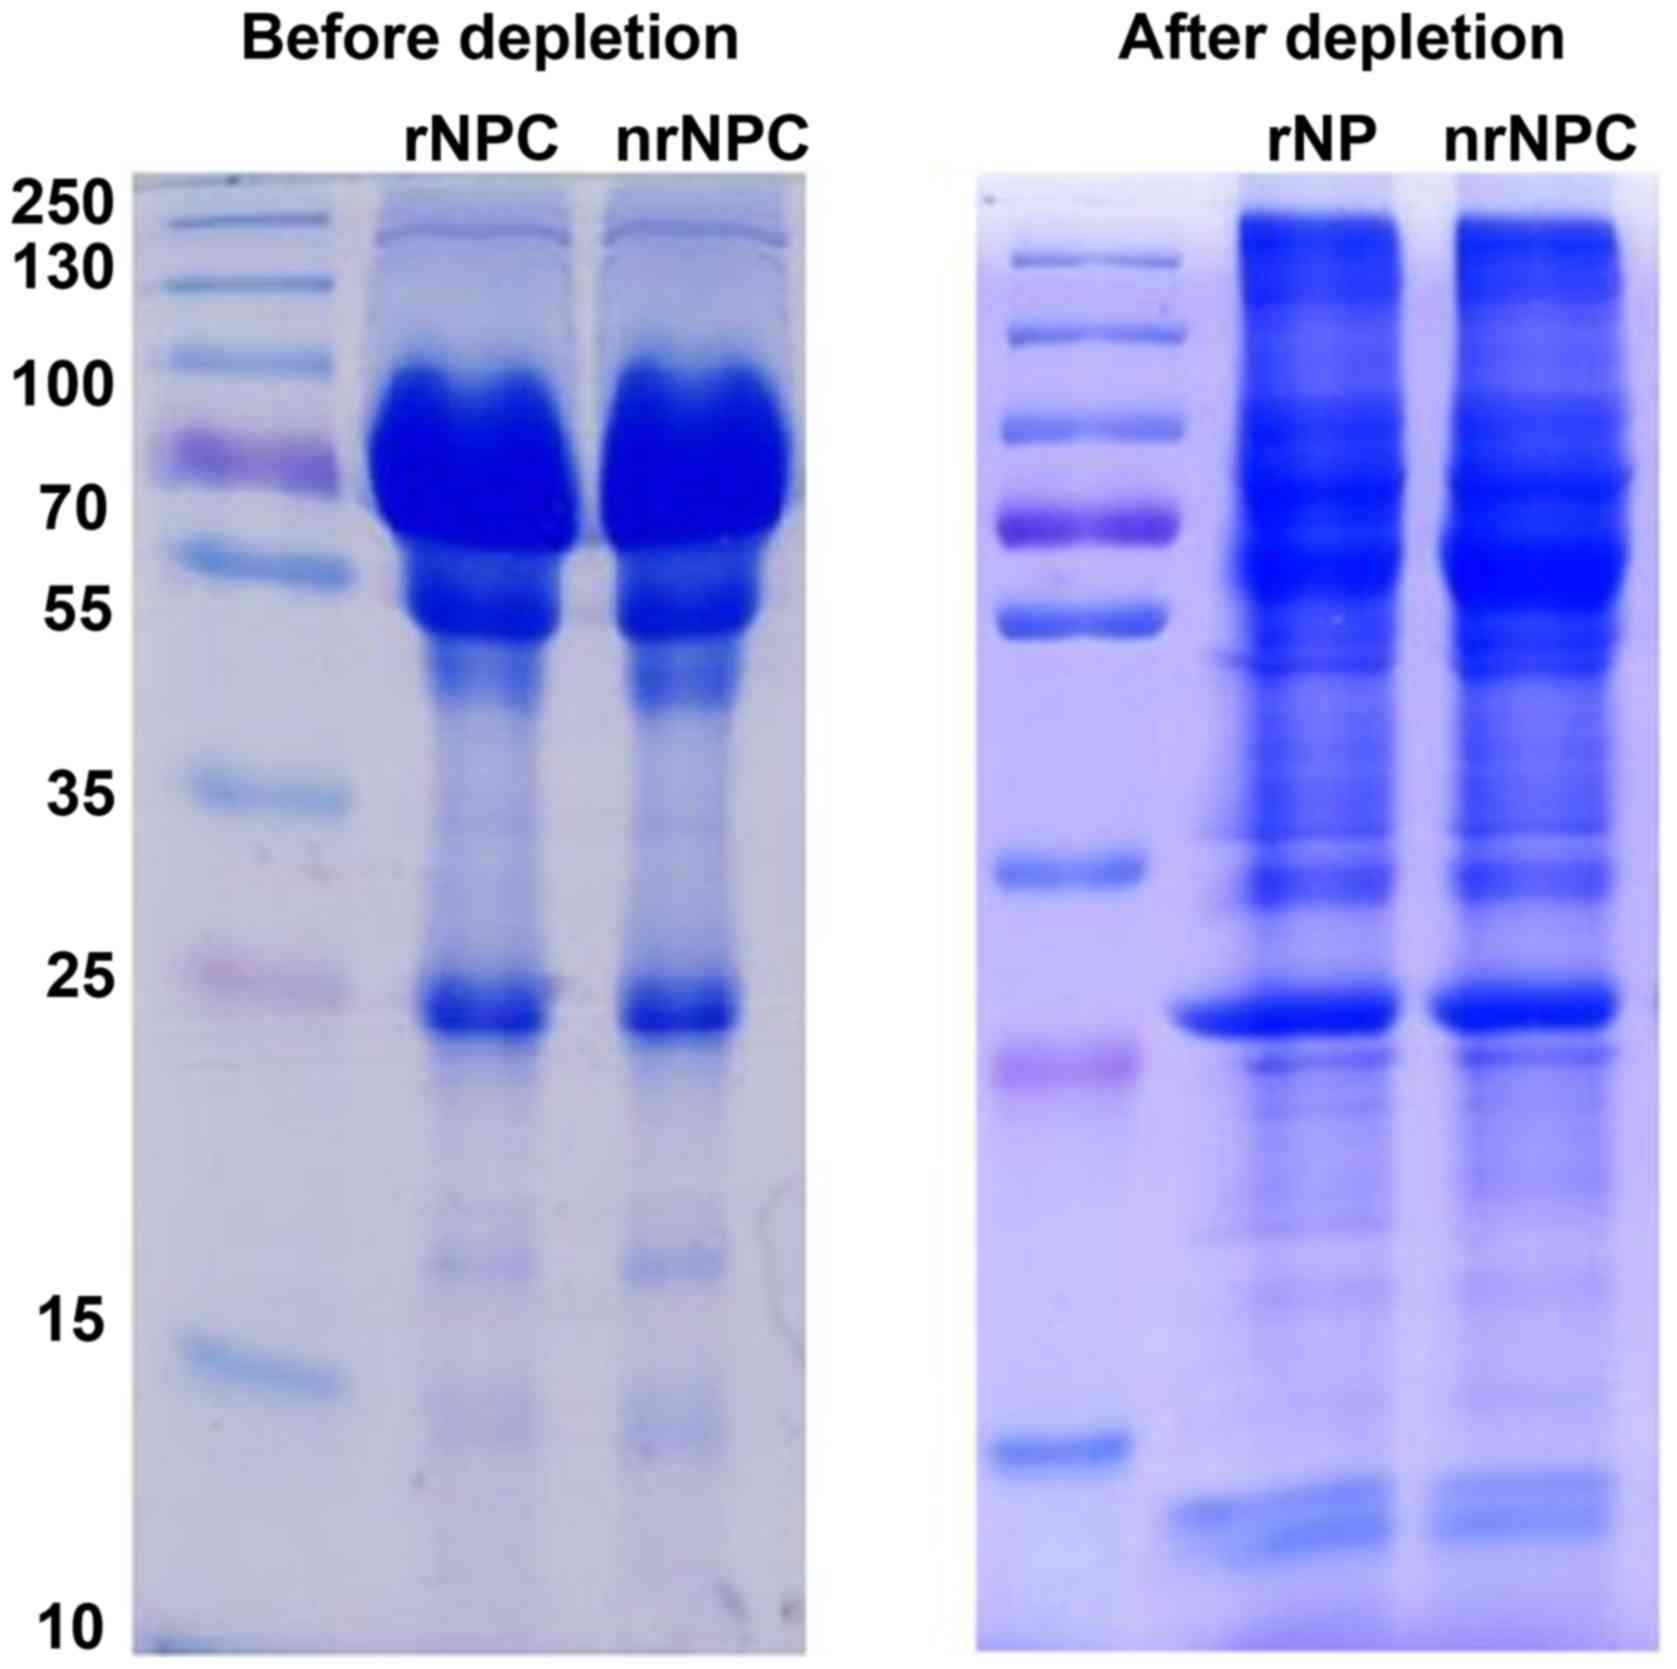
High-abundance protein depletion
To enhance the accuracy of TMT analysis,
high-abundance proteins were removed from the pooled samples using
the ProteMiner (Protein Enrichment Large-Capacity kit, cat. no.
163-3006; Bio-Rad Laboratories, Inc., Hercules, CA, USA). The
concentrated proteins were immunodepleted one more time. Finally,
the protein was precipitated with cold 15% TCA for 2 h at −20°C.
Following centrifugation at 20,000 × g at 4°C for 10 min, the
supernatant was discarded. The remaining precipitate was washed
with cold acetone 3 times. The protein was redissolved in buffer (8
M urea, 100 mM TEAB, pH 8.0), and the protein concentration was
determined with 2-D Quant kit (GE Healthcare Bio-Sciences,
Pittsburgh, PA, USA). SDS-PAGE was used to evaluate the efficiency
of high-abundance protein depletion in the two pooled samples
(Fig. 1).
Trypsin digestion
For digestion, the protein solution was reduced with
10 mM DTT for 1 h at 37°C and alkylated with 20 mM IAA (both from
Sigma, St. Louis, MO, USA) for 45 min at room temperature in the
dark. For trypsin digestion, the protein sample was diluted by the
addition of 100 mM TEAB to the urea concentration to <2 M.
Finally, trypsin was added at 1:50 trypsin-to-protein mass ratio
for the first digestion overnight and 1:100 trypsin-to-protein mass
ratio for a second 4 h digestion. Approximately 100 µg
protein for each sample was digested with trypsin for the following
experiments.
TMT labeling
Following trypsin digestion, for TMT labeling,
peptide was desalted by a Strata-X C18 SPE column (Phenomenex,
Inc., Torrance, CA, USA) and vacuum-dried. The peptide was
reconstituted in 0.5 M TEAB and processed according to the
manufacturer's instructions provided with the 6-plex TMT kit
(Thermo Fisher Scientific, Waltham, MA, USA). Briefly, one unit of
TMT reagent (defined as the amount of reagent required to label 100
µg of protein) was thawed and reconstituted in 24 µl
ACN (Thermo Fisher Scientific, Inc.). The peptide mixtures were
then incubated for 2 h at room temperature and pooled, desalted and
dried by vacuum centrifugation.
HPLC fractionation
The sample was then fractionated into fractions by
high pH reverse-phase HPLC using an Agilent 300Extend-C18 column (5
µm particles, 4.6 mm ID, 250 mm length; Agilent
Technologies, Santa Clara, CA, USA). Briefly, the peptides were
first separated with a gradient of 2–60% acetonitrile in 10 mM
ammonium bicarbonate pH 10.0 over 80 min into 80 fractions. The
peptides were then combined into 18 fractions and dried by vacuum
centrifugation.
LC-MS/MS analysis
The peptides were dissolved in 0.1% FA (Fluka, Buchs
St. Gallen, Switzerland), directly loaded onto a reversed-phase
pre-column (Acclaim PepMap 100; Thermo Fisher Scientific, Inc.).
Peptide separation was performed using a reversed-phase analytical
column (Acclaim PepMap RSLC; Thermo Fisher Scientific, Inc.). The
gradient was comprised of an increase from 7 to 20% solvent B (0.1%
FA in 98% ACN) over 24 min, 20–35% in 8 min, 35–80% for 5 min and
holding at 80% for the last 3 min, all at a constant flow rate of
300 nl/min on an EASY-nLC 1000 UPLC system (Thermo Fisher
Scientific, Inc.). The resulting peptides were analyzed by Q
Exactive™ Hybrid Quadrupole-Orbitrap Mass Spectrometer (Thermo
Fisher Scientific, Inc.).
The peptides were subjected to NSI source followed
by tandem mass spectrometry (MS/MS) on a Q Exactive™ mass
spectrometer (Thermo Fisher Scientific, Inc.) coupled online to the
UPLC. Intact peptides were detected in the Orbitrap at a resolution
of 70,000. Peptides were selected for MS/MS using NCE setting as
27, 30, 33; ion fragments were detected in the Orbitrap at a
resolution of 17,500. A data-dependent procedure that alternated
between one MS scan followed by 20 MS/MS scans was applied for the
top 20 precursor ions above a threshold ion count of 1.0E4 in the
MS survey scan with 30.0 sec dynamic exclusion. The electrospray
voltage applied was 2.0 kV. Automatic gain control was used to
prevent overfilling of the ion trap; 5E4 ions were accumulated for
generation of MS/MS spectra. For MS scans, the m/z scan range was
350–1,800. Fixed first mass was set as 100 m/z.
Database search
The resulting MS/MS data were processed using Mascot
search engine (v.2.3.0). Tandem mass spectra were searched against
the Swiss-Prot Human Database (20,203 sequences). Trypsin/P was
specified as cleavage enzyme allowing up to 2 missing cleavages.
Mass error was set to 10 ppm for precursor ions and 0.02 Da for
fragment ions. Carbamidomethyl on Cys, TMT-6 plex (N-term) and
TMT-6plex (K) were specified as fixed modification and oxidation on
Met was specified as variable modifications. FDR was adjusted to
<1% and peptide ion score was set >20.
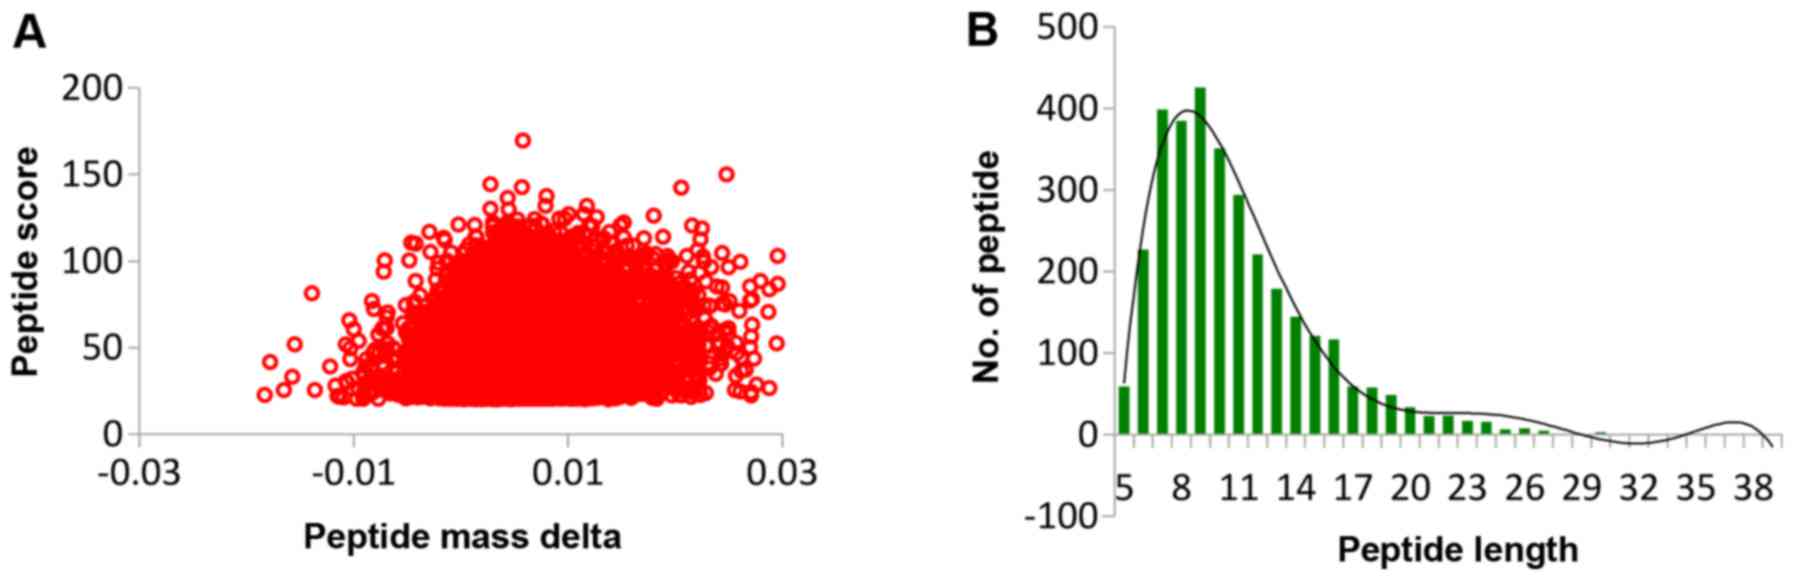
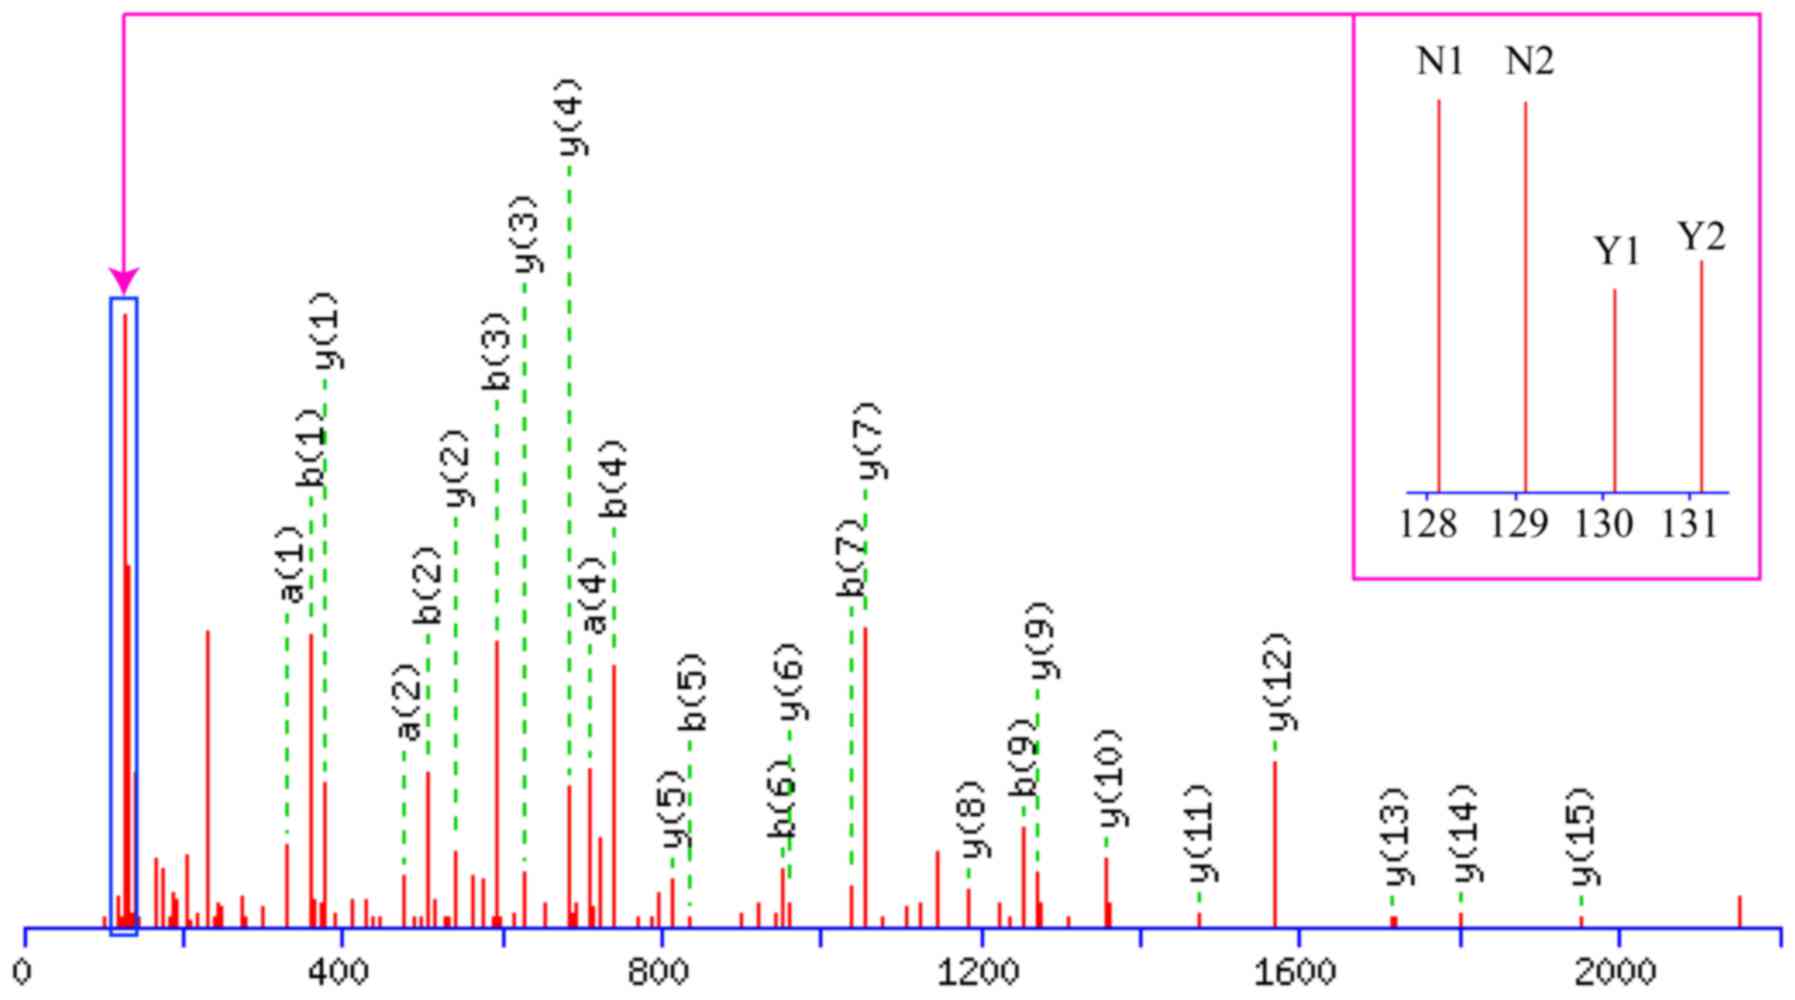
QC validation of MS data
Firstly, we checked the mass error of all the
identified peptides. The distribution of mass error was near zero
and most of them were <0.02 Da, which meant that the mass
accuracy of the MS data fit the requirement. Secondly, the length
of most peptides was distributed between 8 and 16, which are in
agreement with the property of tryptic peptides, which meant that
sample preparation reached the standard (Fig. 2).
Bioinformatics methods
Gene Ontology (GO) analysis
All proteins identified in the serum samples were
assigned a gene symbol using the UniProt-GOA database (http:www.ebi.ac.uk/GOA/). If some identified proteins
were not annotated by UniProt-GOA database, the InterProScan
software would be used to annotated protein's GO functional based
on protein sequence alignment method. Protein classification was
performed by GO annotation based on biological process, cellular
component and molecular function. The differentially expressed
proteins were further analyzed for pathway enrichment analysis by
using Kyoto Encyclopedia of Genes and Genomes (KEGG) database. At
the same time, we performed protein functional enrichment and
performed a functional enrichment-based clustering for protein
groups.
Selection of rNPC biomarkers
Dysregulated proteins were selected for further
verification if they met one or more requirements: i) it should be
a 'secreted' protein (14); ii)
was shown to be involved on the KEGG database; and iii) the fold
change of the protein was ≥1.2 or ≤0.83.
ELISA validation
Human ELISA kits were used for calmodulin (CALM; TSZ
Bioscience, North Brunswick, NJ, USA), and experimental steps were
performed as recommended by the manufacturer. Serum samples were
analyzed for a total of 74 patients with NPC (32 rNPC + 42
nrNPC).
Statistical analysis
All statistical analyses were performed using SPSS
21.0 software and GraphPad Prism 5.0 software. The differences
between the two states of NPC were analyzed using a Mann-Whitney U
test. In addition, the target protein was evaluated for its
capacity to distinguish between rNPC and nrNPC by making their ROC
curves based on the ELISA scores. A value of P<0.05 was
considered to indicate a statistically significant difference.
Results
A schematic of the work flow is shown in Fig. 3. Using TMT labeling and HPLC
fractionation followed by high-resolution LC-MS/MS analysis, we
compared the 2 pooled NPC samples from the 10 patients with rNPC
and the 10 patients with nrNPC (controls) in biological repeats. We
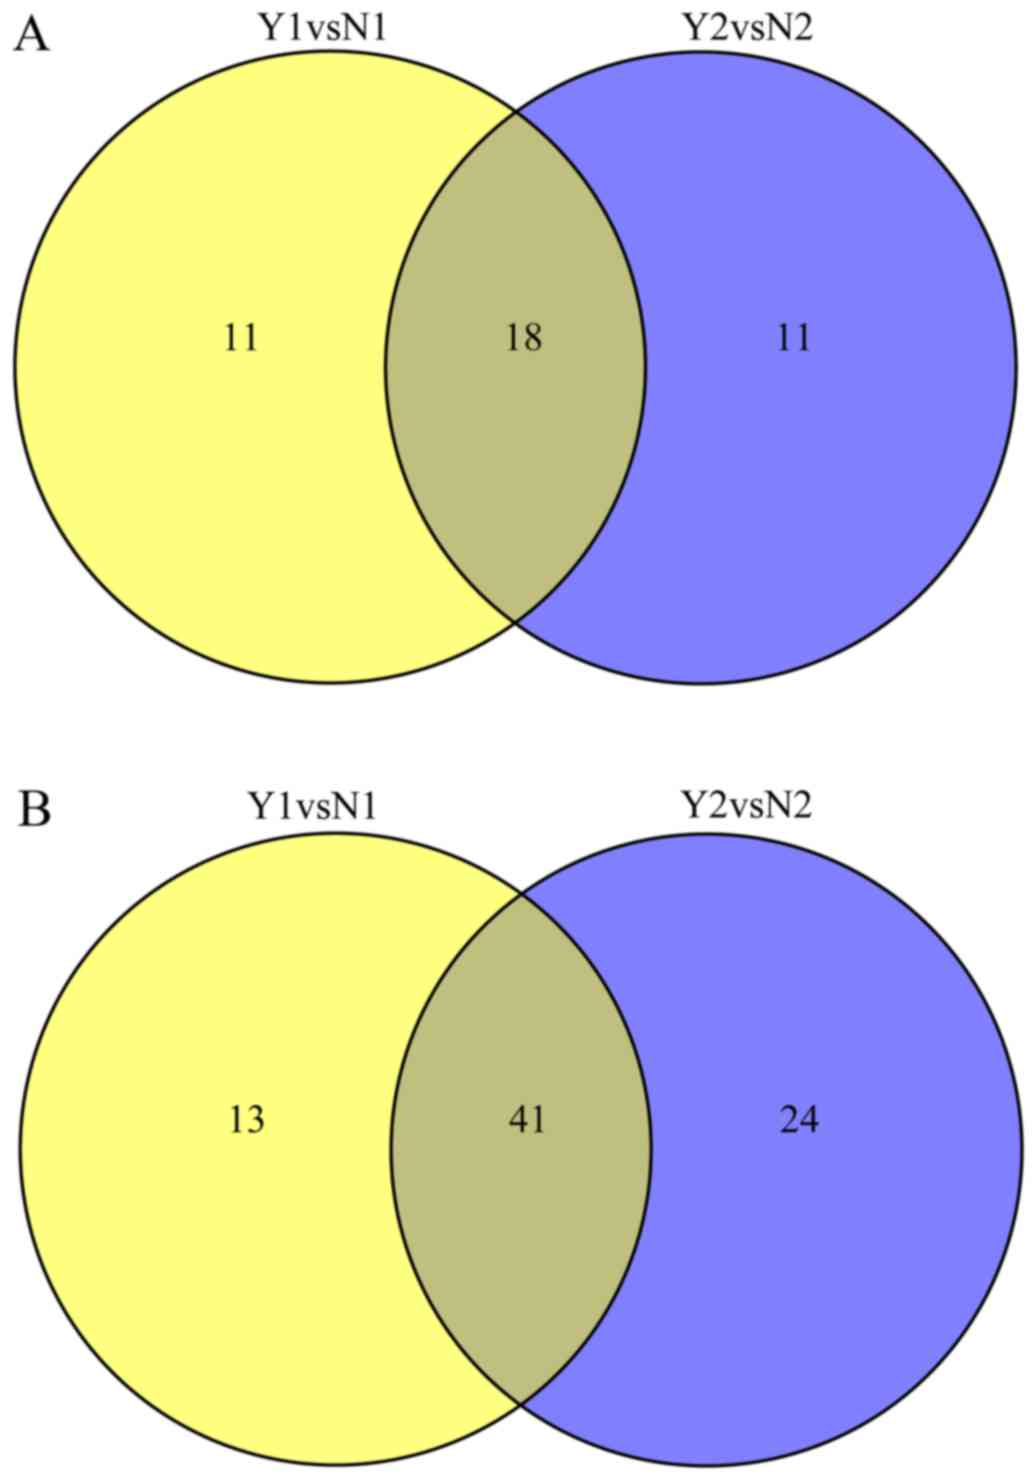
indentified 635 protein groups from pooling human serum with a 99%
confidence score and a 1% local FDR in each of the 2 analyzed
groups, among which 413 proteins were quantified proteins, all were
considered to be dysregulated if TMT ratios were ≥1.2 or ≤0.83 in
≥50% in rNPC relative to nrNPC; finally, dysregulated proteins were
obtained in each group. The dysregulated proteins are shown in
Table II and Fig. 4.
| Table IIDifferentially expressed and
dysregulated proteins in nasopharyngeal carcinoma. |
Table II
Differentially expressed and
dysregulated proteins in nasopharyngeal carcinoma.
A, Summary of
differentially quantified proteins (>1.2, or <0.83)
|
|---|
| Name | Upregulated
(>1.2) | Downregulated
(<0.83) |
|---|
| Y1vsN1 | 29 | 54 |
| Y2vsN2 | 29 | 65 |
| YvsN | 28 | 47 |
| N1vsN2 | 0 | 1 |
| Y1vsY2 | 0 | 1 |
B, Top 5 of
upregulated proteins (Y1:rNPC, N1:rNPC)
|
|---|
| Protein accession
no. | Gene name | Protein
description | MW (Da) | pI | AASC (%) | MP | Score | Y1/N1 ratio | Y1/N1 P-value |
|---|
| P02741 | CRP | C-reactive
protein | 28,631 | 5.45 | 23.7 | 7 | 781 | 3.862 | 3.249E-12 |
| P13637 | ATP1A3 |
Sodium/potassium-transporting ATPase
subunit alpha-3 | 126,394 | 5.22 | 2.9 | 2 | 98 | 2.356 | 0 |
| P02686 | MBP | Myelin basic
protein | 37,681 | 9.79 | 7.2 | 2 | 78 | 2.26 | 0.030696 |
| P62158 | CALM2 | Calmodulin | 18,889 | 4.09 | 16.1 | 3 | 40 | 2.11 | 0.019282 |
| P60174 | TPI1 | Triosephosphate
isomerase | 35,869 | 5.65 | 7 | 2 | 49 | 2.045 | 0.127868 |
C, Top 5 of
downregulated proteins
|
|---|
| Protein accession
no. | Gene name | Protein
description | MW (Da) | pI | AASC (%) | MP | Score | Y1/N1 ratio | Y1/N1 P-value |
|---|
| P25705 | ATP5A1 | ATP synthase
subunit alpha, mitochondrial | 66,932 | 9.16 | 12.1 | 6 | 200 | 0.280 | 8.69E-06 |
| Q99798 | ACO2 | Aconitate
hydratase, mitochondrial | 98,946 | 7.36 | 2.2 | 2 | 64 | 0.329 | 0.036558 |
| P06576 | ATP5B | ATP synthase
subunit beta, mitochondrial | 62,025 | 5.26 | 12.9 | 5 | 170 | 0.339 | 0.003399 |
| P09972 | ALDOC |
Fructose-bisphosphate aldolase C | 44,872 | 6.41 | 10.2 | 2 | 129 | 0.347 | 0.2142 |
| P11678 | EPX | Eosinophil
peroxidase | 86,771 | 10.31 | 7.6 | 4 | 99 | 0.408 | 0.038348 |
| P61160 | ACTR2 | Actin-related
protein 2 | 50,976 | 6.3 | 4.6 | 2 | 91 | 0.501 | 0.148856 |
D, All dysregulated
proteins
|
|---|
| Protein accession
no. | Protein
description | Y/N ratio | Regulated type |
|---|
| P02741 | C-reactive
protein | 3.862 | Up |
| Q9BXR6 | Complement factor
H-related protein 5 | 1.433 | Up |
| P62158 | Calmodulin | 2.11 | Up |
| P67936 | Tropomyosin alpha-4
chain | 1.464 | Up |
| O43852 | Calumenin | 1.361 | Up |
| P04211 | Ig lamda chain V
region 4A | 1.517 | Up |
| P02743 | Serum amyloid
P-component | 1.295 | Up |
| P20742 | Pregnancy zone
protein | 1.208 | Up |
| Q15485 | Ficolin-2 | 1.502 | Up |
| P0DJI9 | Serum amyloid A-2
protein | 2.036 | Up |
| P02671 | Fibrinogen α
chain | 1.217 | Up |
| P01598 | Ig kappa chain V-I
region EU | 1.507 | Up |
| Q9HBI1 | Beta-parvin | 1.638 | Up |
| Q9Y490 | Talin-1 | 1.521 | Up |
| Q13201 | Multimerin-1 | 1.238 | Up |
| Q08830 | Fibrinogen-like
protein 1 | 1.361 | Up |
| P02686 | Myelin basic
protein | 2.26 | Up |
| P35542 | Serum amyloid A-4
protein | 1.494 | Up |
| P05155 | Plasma protease C1
inhibitor | 0.763 | Down |
| P80748 | Ig lamda chain
V-III region LOI | 0.772 | Down |
| P05534 | HLA class I
histocompatibility antigen, A-24 α chain | 0.545 | Down |
| O75882 | Attractin | 0.616 | Down |
| P36955 | Pigment
epithelium-derived factor | 0.721 | Down |
| P06314 | Ig kappa chain V-IV
region B17 | 0.759 | Down |
| Q5QNW6 | Histone H2B type
2-F | 0.693 | Down |
| P01597 | Ig kappa chain V-I
region DEE | 0.747 | Down |
| P04217 |
Alpha-1B-glycoprotein | 0.729 | Down |
| Q16610 | Extracellular
matrix protein 1 | 0.675 | Down |
| P06312 | Ig kappa chain V-IV
region (fragment) | 0.746 | Down |
| P25705 | ATP synthase
subunit alpha, mitochondrial | 0.28 | Down |
| P25311 |
Zinc-alpha-2-glycoprotein | 0.678 | Down |
| P23083 | Ig heavy chain V-I
region V35 | 0.687 | Down |
| P01009 |
Alpha-1-antitrypsin | 0.78 | Down |
| P01767 | Ig heavy chain
V-III region BUT | 0.671 | Down |
| P08571 | Monocyte
differentiation antigen CD14 | 0.58 | Down |
| P06576 | ATP synthase
subunit β, mitochondrial | 0.339 | Down |
| P01042 | Kininogen-1 | 0.817 | Down |
| P01859 | Ig gamma-2 chain C
region | 0.765 | Down |
| P01860 | Ig gamma-3 chain C
region | 0.766 | Down |
| P32119 |
Peroxiredoxin-2 | 0.642 | Down |
| Q99798 | Aconitate
hydratase, mitochondrial | 0.329 | Down |
| P01034 | Cystatin-C | 0.769 | Down |
| P01593 | Ig κ chain V-I
region AG | 0.535 | Down |
| P01834 | Ig κ chain C
region | 0.789 | Down |
| P01615 | Ig κ chain V-II
region FR | 0.785 | Down |
| P01781 | Ig heavy chain
V-III region GAL | 0.77 | Down |
| P49747 | Cartilage
oligomeric matrix protein | 0.659 | Down |
| B9A064 | Immunoglobulin
lamda-like polypeptide 5 | 0.778 | Down |
| P01611 | Ig kappa chain V-I
region Wes | 0.755 | Down |
| P00488 | Coagulation factor
XIII A chain | 0.764 | Down |
| P68871 | Hemoglobin subunit
beta | 0.566 | Down |
| P02790 | Hemopexin | 0.606 | Down |
| P00738 | Haptoglobin | 0.818 | Down |
| P06396 | Gelsolin | 0.711 | Down |
| P62805 | Histone H4 | 0.766 | Down |
| P01625 | Ig kappa chain V-IV
region Len | 0.755 | Down |
| P02763 | Alpha-1-acid
glycoprotein 1 | 0.757 | Down |
| P01768 | Ig heavy chain
V-III region CAM | 0.64 | Down |
| P05546 | Heparin cofactor
2 | 0.754 | Down |
Functional classification of
differentially quantified proteins
According to the GO annotation information of
identified proteins, we calculated the number of differentially
expressed proteins in each GO term of level 2. The upregulated
proteins were main involved in the biological process of
single-organism process (26/29), cellular process (25/29), response
to stimulus 20/29) etc, and the cellular component main included
cell (23/29), organelle (21/29), macromolecular complex (13/29)
etc. Molecular function mainly included binding (15/29), catalytic
activity (11/29) etc. The details are shown in Table III.
| Table IIIThe GO terms of level 2 distribution
of the proteins of Y/N. |
Table III
The GO terms of level 2 distribution
of the proteins of Y/N.
| GO terms level
1 | GO terms level
2 | No. of protein |
|---|
| Upregulated
proteins | | |
| Biological
process | Single-organism
process | 26 |
| Cellular
process | 25 |
| Response to
stimulus | 20 |
| Biological
regulation | 19 |
| Localization | 14 |
| Metabolic
process | 13 |
| Signaling | 12 |
| Multicellular
organismal process | 12 |
| Cellular component
organization or biogenesis | 12 |
| Developmental
process | 9 |
| Immune system
process | 7 |
| Locomotion | 5 |
| Multi-organism
process | 4 |
| Other | 5 |
| Cellular
component | Cell | 23 |
| Organelle | 21 |
| Macromolecular
complex | 13 |
| Membrane | 11 |
| Extracellular
region | 10 |
| Membrane-enclosed
lumen | 8 |
| Cell junction | 2 |
| Other | 2 |
| Molecular
function | Binding | 15 |
| Catalytic
activity | 11 |
| Structural molecule
activity | 6 |
| Enzyme regulator
activity | 3 |
| Electron carrier
activity | 1 |
| Downregulated
proteins | | |
| Biological
process | Single-organism
process | 40 |
| Biological
regulation | 39 |
| Response to
stimulus | 35 |
| Metabolic
process | 29 |
| Cellular
process | 27 |
| Multicellular
organismal process | 20 |
| Immune system
process | 17 |
| Localization | 13 |
| Developmental
process | 12 |
| Cellular component
organization or biogenesis | 11 |
| Multi-organism
process | 8 |
| Other | 16 |
| Cellular
component | Extracellular
region | 37 |
| Cell | 34 |
| Membrane | 20 |
| Organelle | 20 |
| Macromolecular
complex | 13 |
| Membrane-enclosed
lumen | 11 |
| Extracellular
matrix | 5 |
| Other | 2 |
The downregulated proteins were main involved in
single-organism process (40/54), biological regulation (39/54),
response to stimulus (35/54) etc, the cellular component main
included extracellular region (37/54), cell (34/54), membrane
(20/54) etc. Molecular function main included binding (15/29),
catalytic activity (11/29) etc. The details are shown in Table III.
GO-based enrichment analysis
We then we performed a GO-based enrichment analysis,
molecular function included guanyl ribonucleotide binding, GTP
binding etc, and most proteins were formed nucleosome, DNA bending
complex, microtubule cytoskeleton etc. In addition, numerous
proteins were involved in response to calcium, regulated cell cycle
biological process etc. The details are shown in Fig. 5.
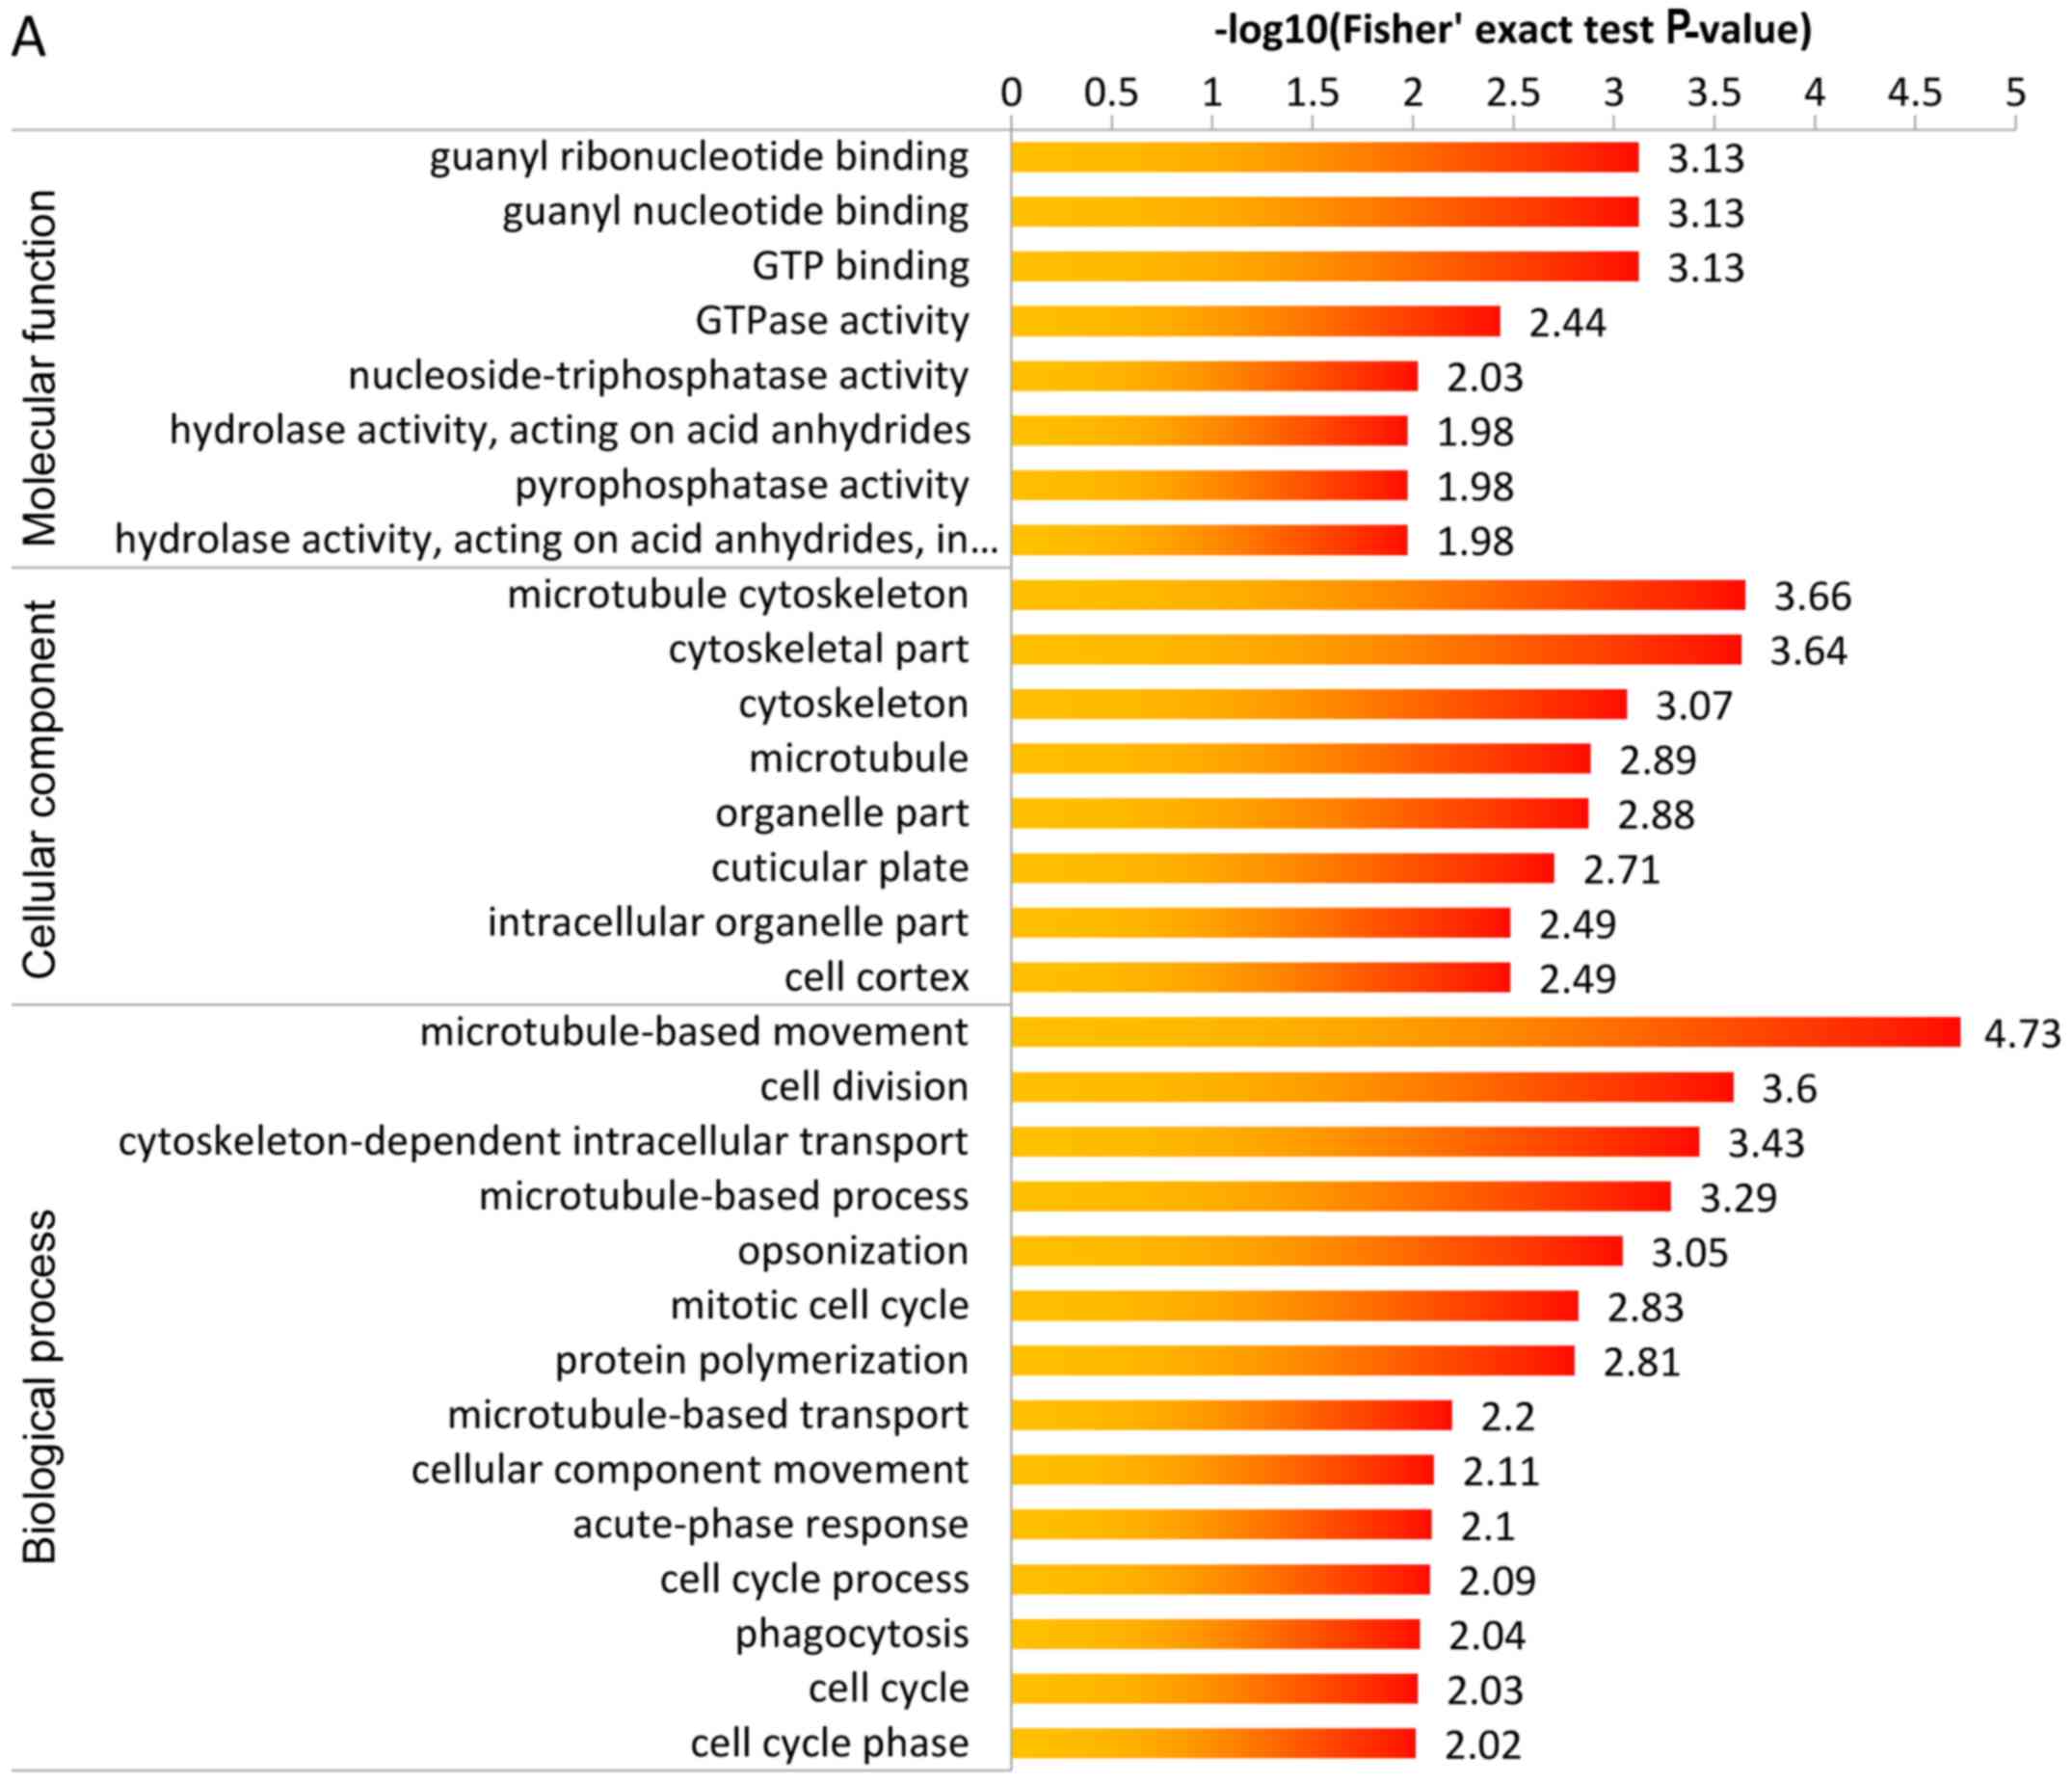 | Figure 5(A) GO-based enrichment analysis of
upregulated proteins, which shows guanyl ribonucleotide binding,
guanyl nucleotide binding, GTP binding were the highest enrichment
in cellular component, microtubule cytoskeleton, cytoskeletal part
were the highest enrichment in molecular function,
microtubule-based movement was the highest enrichment in biological
process. (B) GO-based enrichment analysis of downregulated
proteins, which shows nucleosome and DNA bending complex were the
highest enrichment in cellular component, and antigen binding was
the highest enrichment in molecular function, and nucleosome
assembly protein-DNA complex assembly, DNA packaging were the
highest enrichment in biological process. GO, Gene Ontology. |
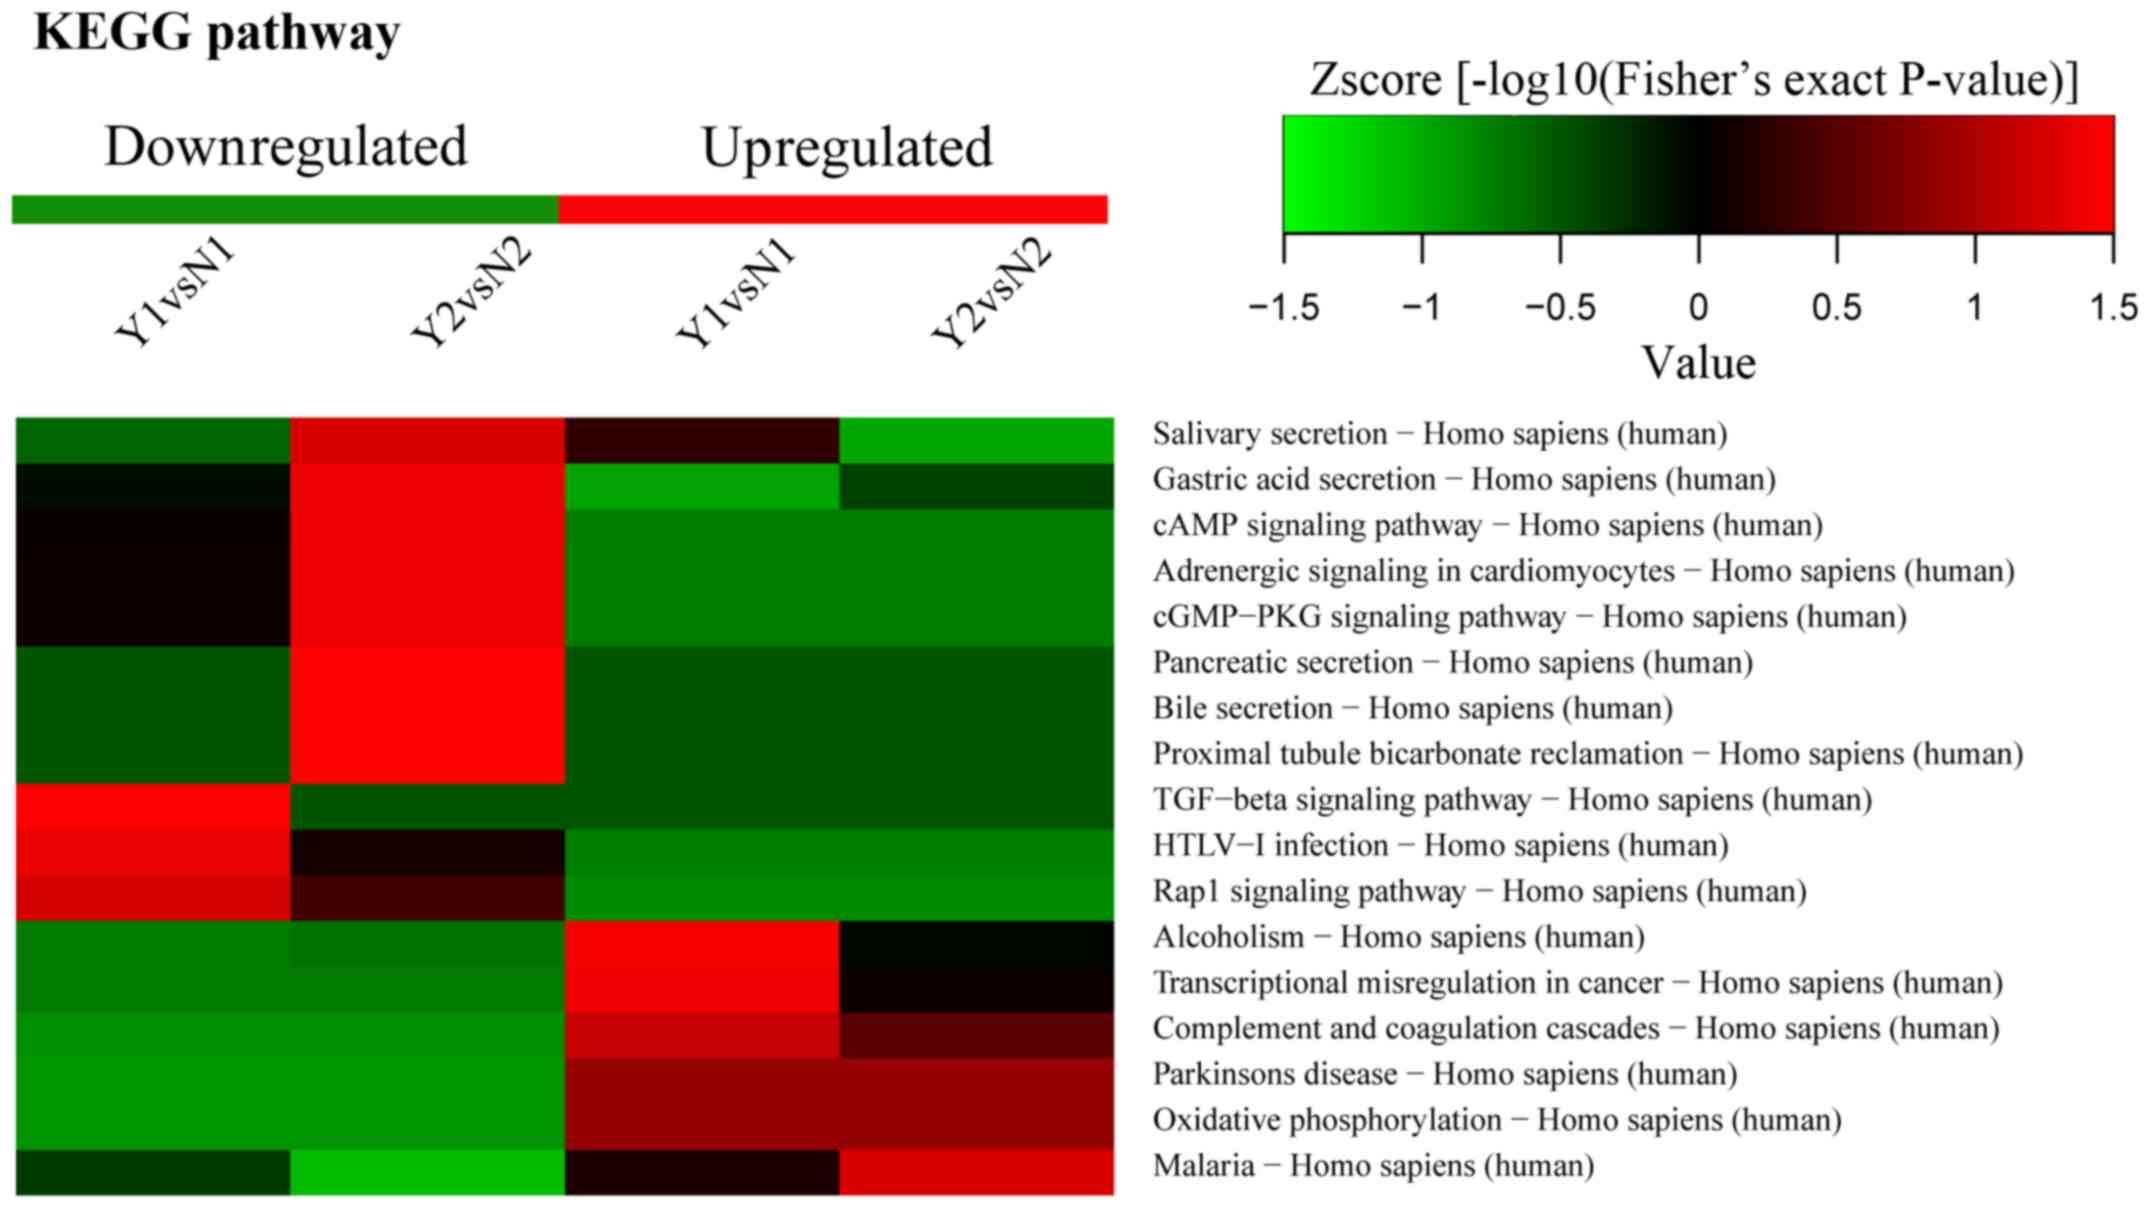
KEGG pathway enrichment
KEGG pathway enrichment included oxidative
phosphorylation. According to KEGG pathway analysis, CALM was
enriched in a significant pathway, and the enrichment ratio of CALM
was the highest; moreover, the fold change of CALM was 2.11
(Fig. 6). Thus, we selected CALM
to perform a further confirmed test.
Clustering analysis
KEGG pathway enrichment-based clustering
demonstrated that the dysregulated proteins mainly involved
oxidative phosphorylation etc; the details are shown in Fig. 7. Functional enrichment-based
clustering revealed that the dysregulated proteins were mainly
involved in responding to calcium ion, oxidative stress, transport
and secrection. The details are shown in Fig. 8.
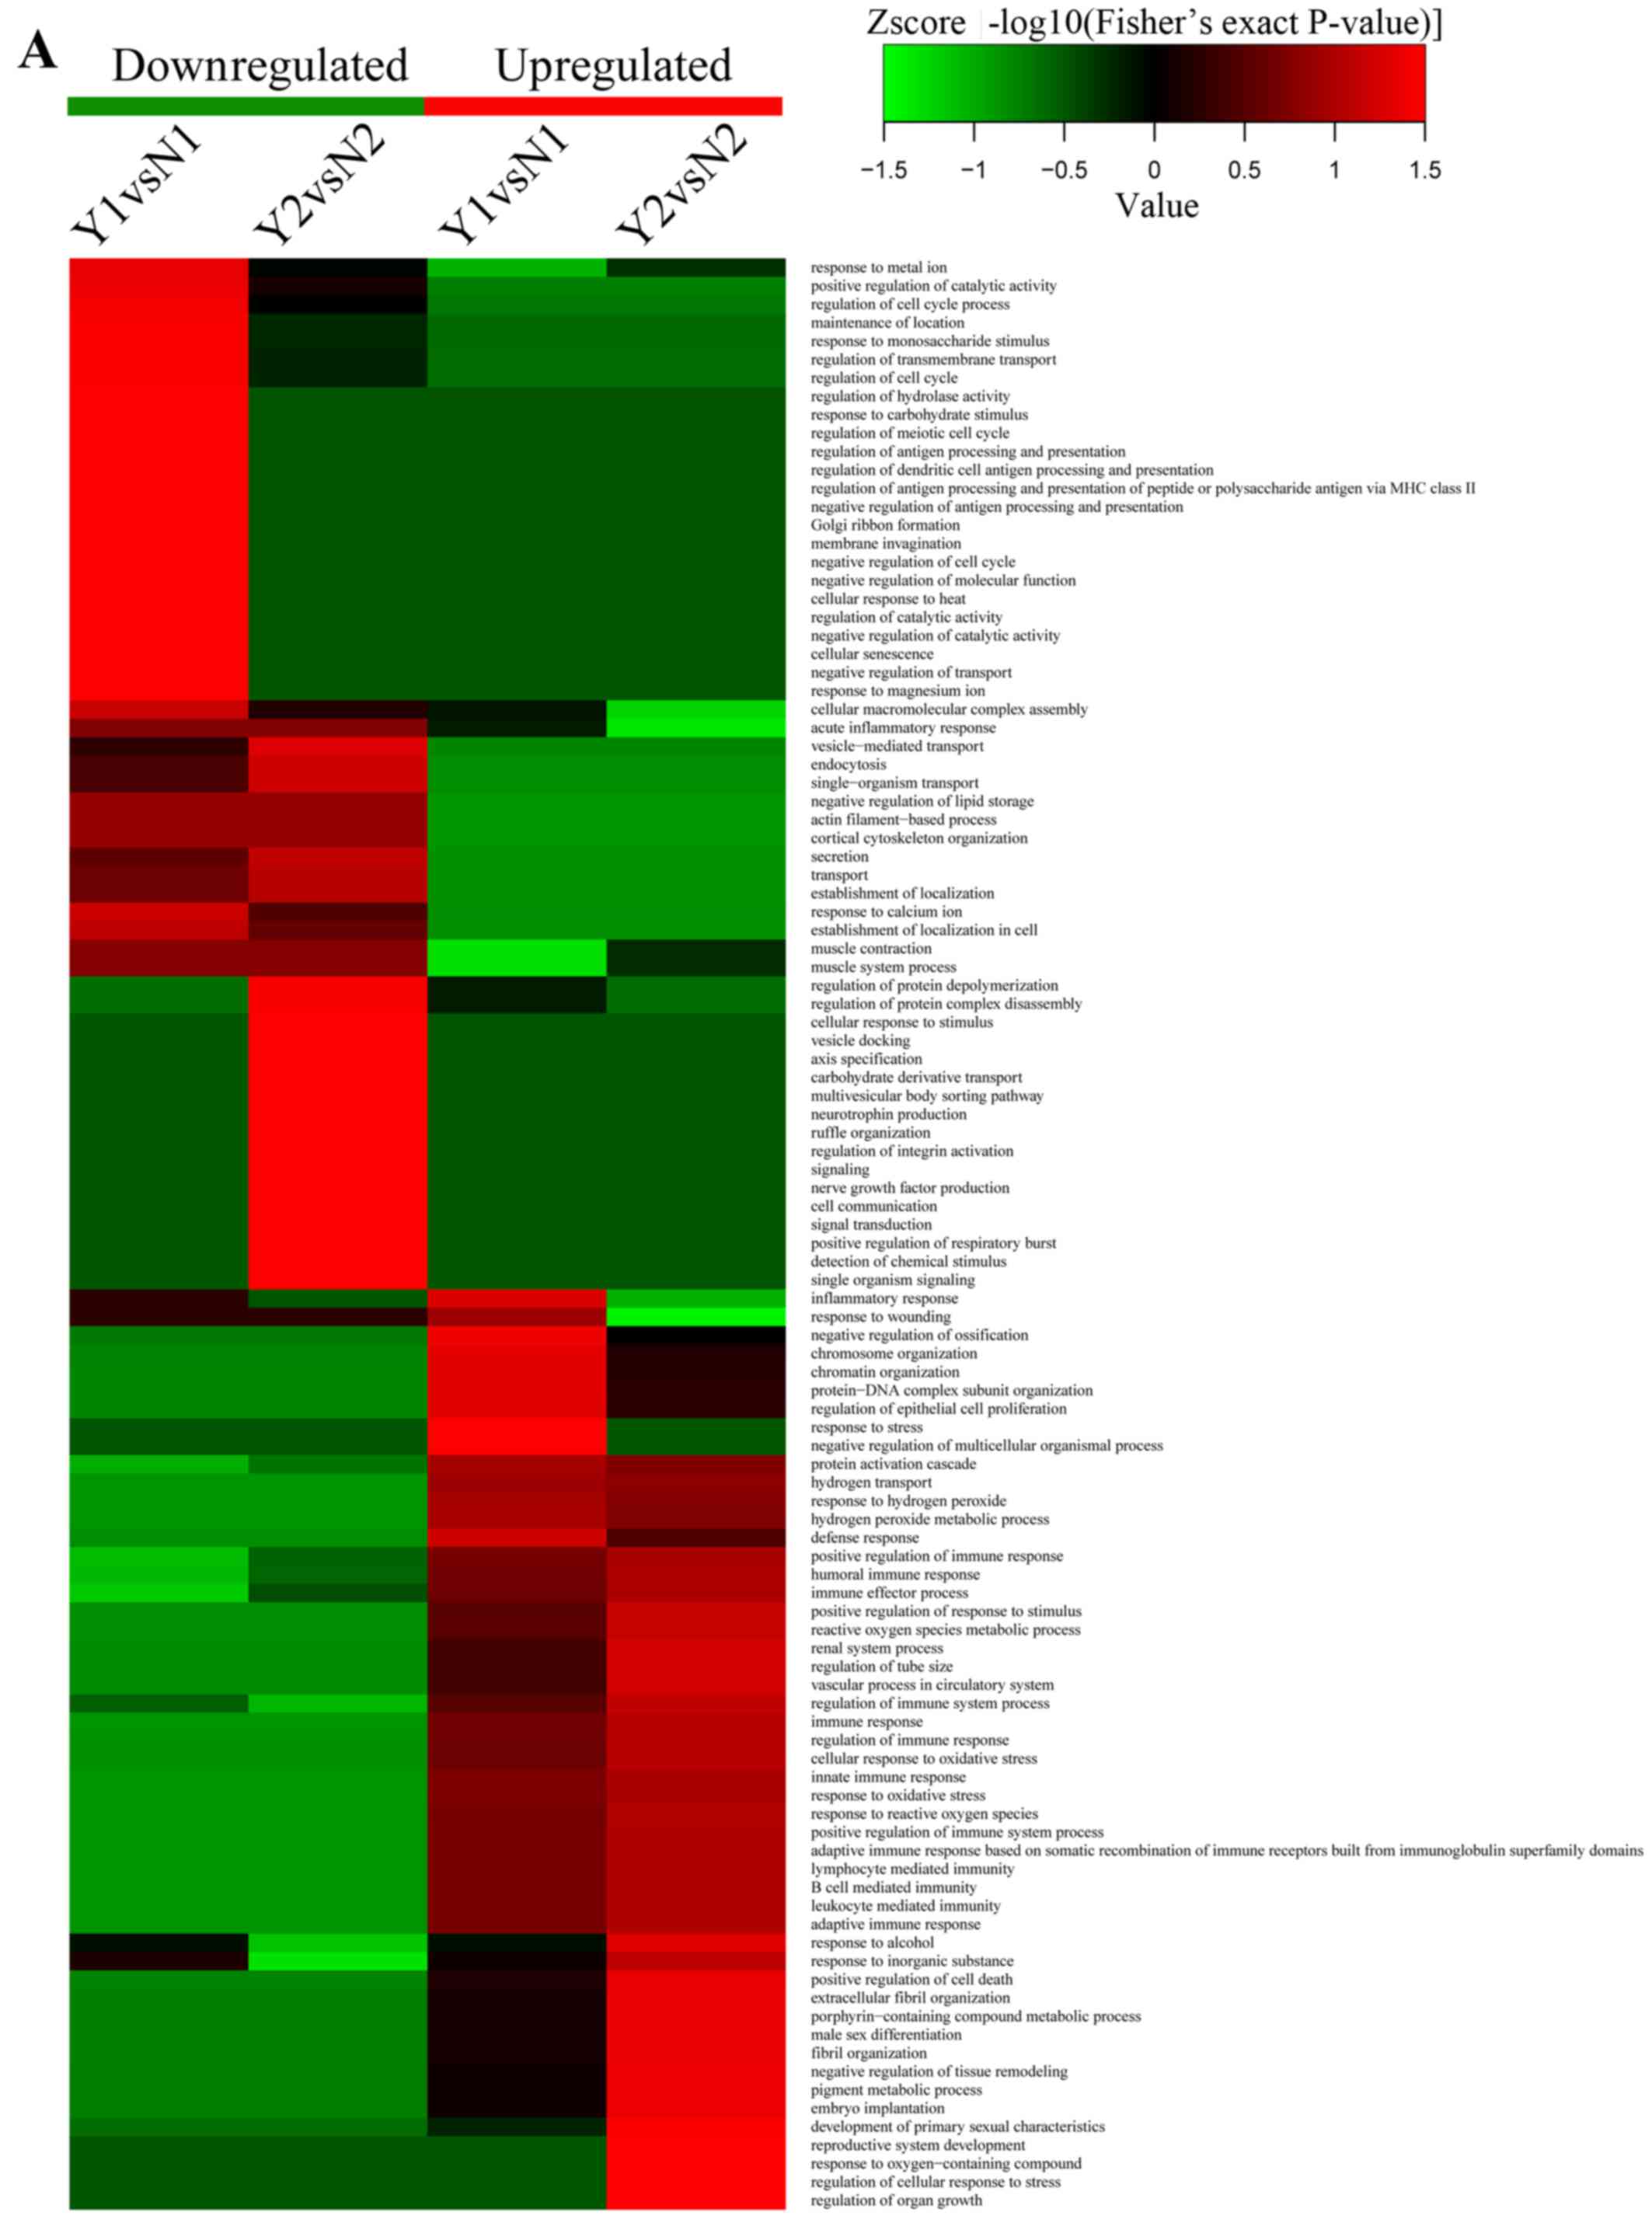 | Figure 8(A) Heatmaps obtained from biological
process enrichment-based cluster analysis, which show antigen
binding, proton-transporting ATPase activity, rotational mechanism,
hydrogen ion transmembrane transporter activity and MHC class I
protein binding processes were the highest enrichment parts. (B)
Heatmaps obtained from cellular component enrichment-based cluster
analysis, which show nucleosome, DNA bending complex, chromatin,
protein-DNA complex, proton-transporting two-sector ATPase complex
and ATPase activity, coupled to transmembrane movement of ions, and
rotational mechanism were the meaningful enrichment parts. (C)
Heatmaps obtained from molecular function enrichment-based cluster
analysis, which show function of proton-transporting ATPase
activity, rotational mechanism, ATPase activity, coupled to
transmembrane movement of ions, rotational mechanism, heme
transporter activity, protein transmembrane transporter activity
and isocitrate hydro-lyase (cis-aconitate-forming) activity were
the meaningful enrichment parts. Y represents recurrent
nasopharyngeal carcinoma (rNPC); N represents non-recurrent
nasopharyngeal carcinoma (nrNPC). |
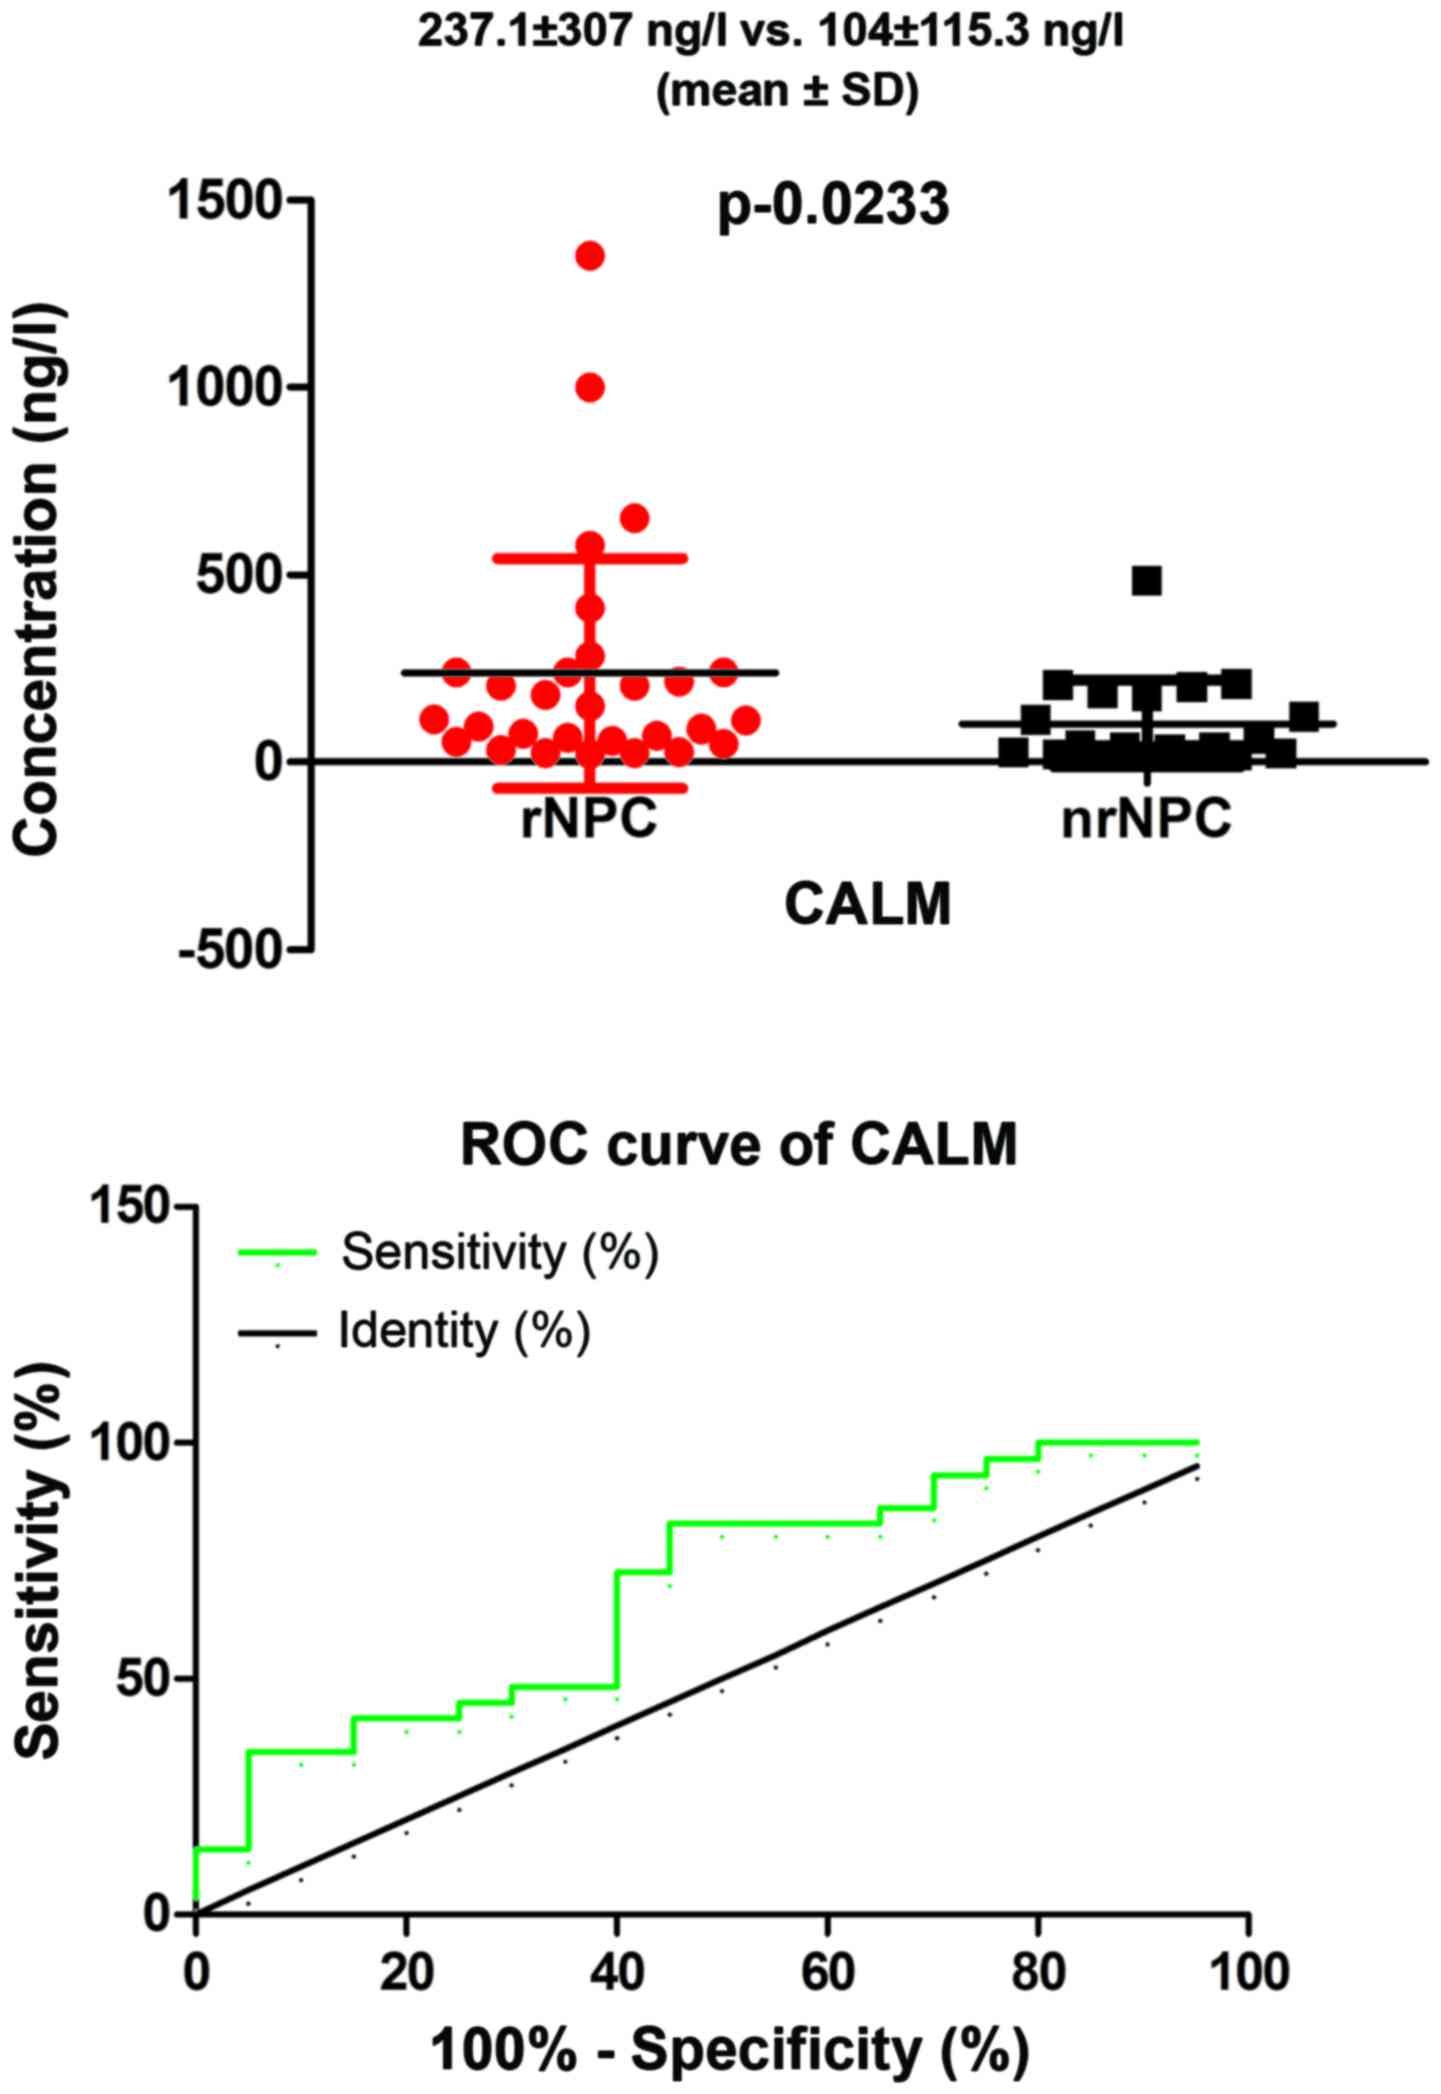
ELISA results
We performed a preliminary analysis to assess the
potential value of CALM as a biomarker in serum from patients with
rNPC. We found a significant difference between patients with rNPC
compared to those with nrNPC (mean ± SD) (237.1±307 ng/l vs.
104±115.3 ng/l), respectively (P=0.0233, P<0.05; Fig. 9) in the levels of serum, which was
in agreement with our MS results. Furthermore, we performed a ROC
curve analysis to evaluate the predictive value of serum CALM; the
area under the ROC curve was 0.6931 (95% CI: 0.5419–0.8443,
P=0.02275, P<0.05). In addition, we have to point out that the
total number in our sample was 74 patients (32 rNPC + 42 nrNPC),
for the reason that some samples contained a low concentration
which was beyond the reach of the ELISA kit; the concentration of
CALM was only found in only 49 patients (29 rNPC + 20 nrNPC). The
difference of the constituent ratio [3/29 (rNPC) vs. 22/42 (nrNPC)]
was significant (P=0.000), which expressed that rNPC serums were
more easily to be tested for CALM. These data suggest that CALM may
be a promising and useful protective marker for patients with
rNPC.
Discussion
A tremendous challenge in rNPC is the lack of tools
which can be used for the early diagnosis of the disease. However,
imaging, such as CT, MRI or PET-CT has limited accuracy and cannot
confirm the nature of the lesion. Moreover, biopsy is an invasive
approach with some side-effects. This results in some patients
being diagnosed at a late stage. A non-invasive blood-based test
will be a revolutionary step in tumor diagnosis.
In this study, we conducted comprehensive
quantitative proteomics analysis to identify a promising biomarker
which can be further studied as a non-invasive test for the
diagnosis of rNPC. We performed the study in biological
replicates.
In two of these, we identified 94 and 83 proteins
that were significantly dysregulated in rNPC compared to nrNPC,
respectively. Intensive bioinformatics analysis was carried out to
annotate these quantifiable targets, including protein annotation,
functional classification, functional enrichment, functional
enrichment-based cluster analysis, etc.
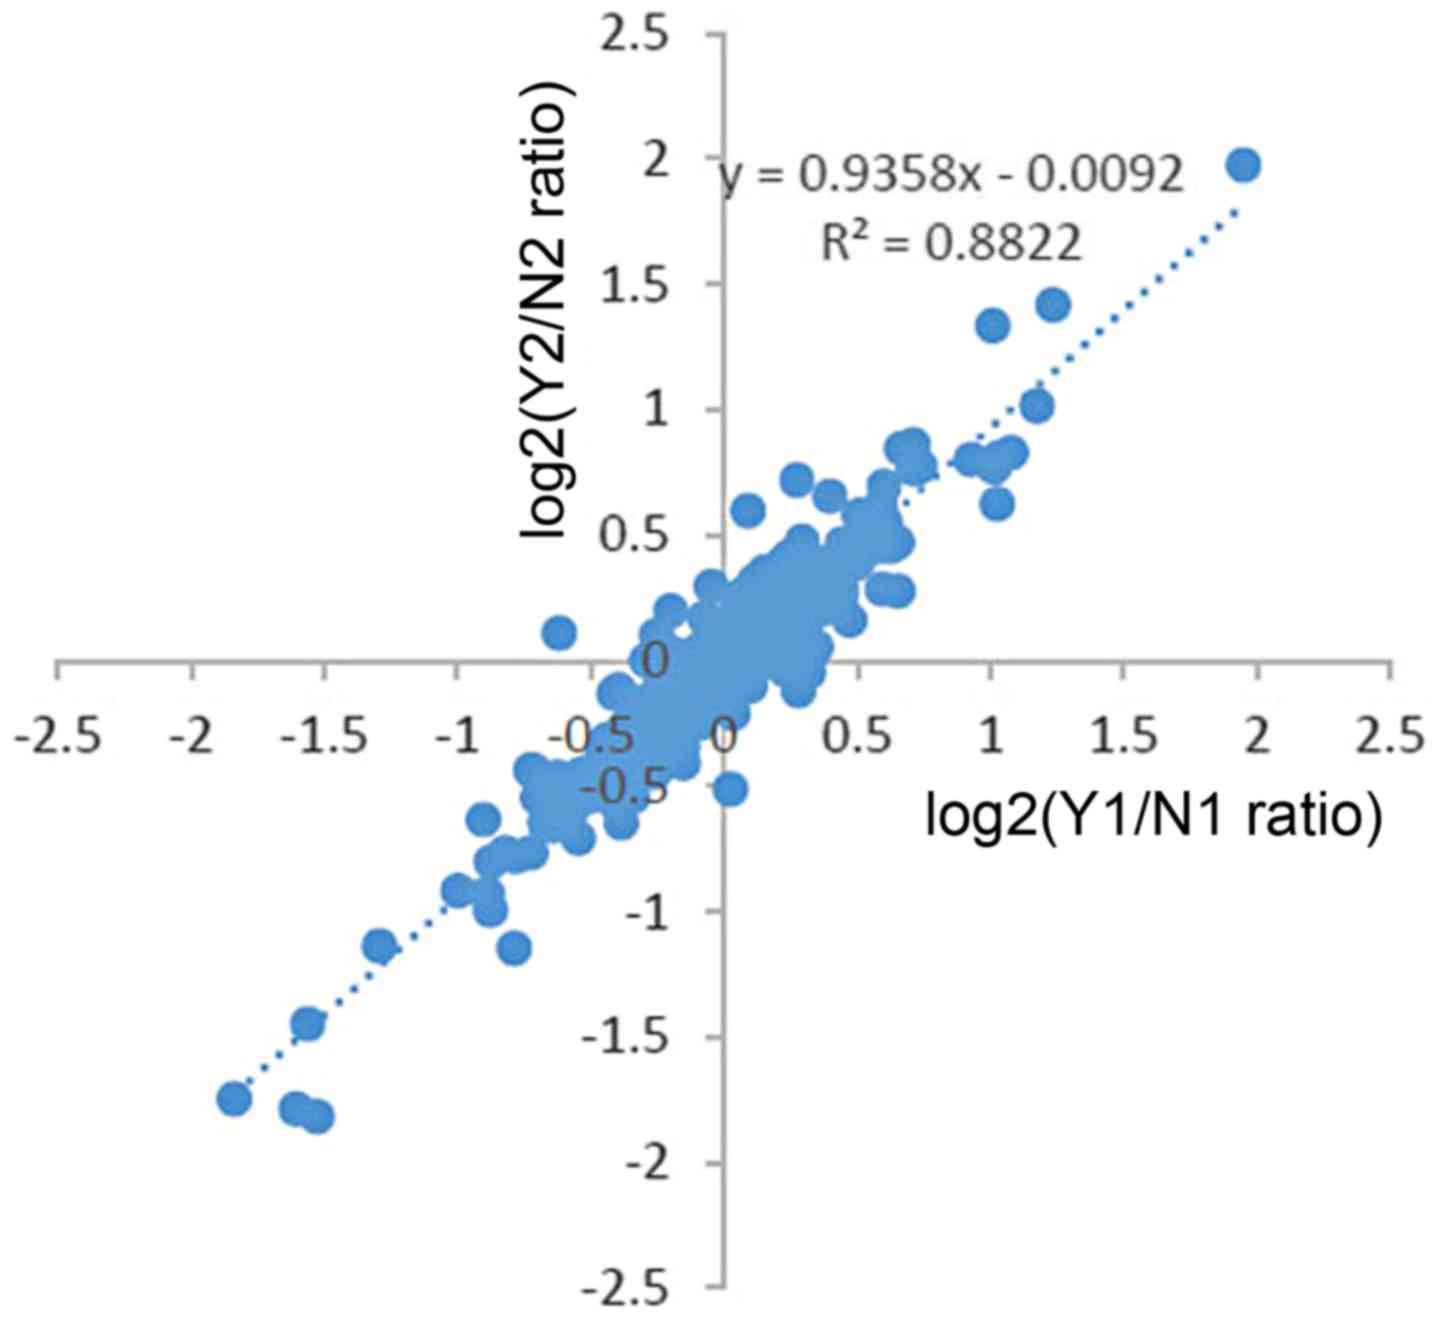
There are some unique aspects in the present study.
The first one, was that we performed biological replicates.
Moreover, the data of two trials receied a low heterogeneity
(Fig. 10), which showed a high
confidence in LC-MS/MS analysis. In addition, we used TMT labeling
which allows for the simultaneous accurate, reproducible and
precise quantification of proteins across complex samples, which is
considered superior to two-dimensional liquid chromatographic
approach and iTRAQ (14,17). It offered a more confident
expression in our study.
Furthermore, we did not find a related report about
rNPC patient serum using TMT labeling, which meant that, at least
to the best of our knowledge, this was the first test comparing the
serum of patients with rNPC and nrNPC in a high throughput
approach.
It is known that NPC is a multifactorial disease,
including host genetics, chronic infection by EBV, environmental
factors and others (18). Even
after effective treatment, there are still 20% patients who suffer
from recurrence; a well known cause of rNPC is radioresistance
(19). The elucidation of the
molecular mechanisms and the potential pathways involved in rNPC
carcinogenesis can certainly aid in the diagnosis and
prognosis.
Of 59 dysregulated proteins, most proteins have been
reported to be connected with tumorigenesis. In our study, CALM was
enriched in 4 pathways, the fold change was 2.11 and the enrichment
ratio was the highest. In addition, CALM has been reported to be
dysregulated in other malignancies (20–23). All the above suggests that CALM
plays a singificant role in rNPC.
To date, it is well known that CALM is considered to
be the major regulator of Ca2+-dependent signaling in
all eukaryotic cells, which is considered the major regulator of
many physiological processes, such as cell proliferation, autophagy
and apoptotic processes (24). A
previous study demonstrated that compared to normal mouse liver,
the concentration of CALM was high in hepatomas (20); others have demonstrated that CALM
level was significantly higher in human primary lung cancer
(25), and in human T lymphocytes
(23) than in normal subjects. A
positive correlation between the degree of tumor malignancy with
the level of cellular CALM has been published (20,21). Furthermore, there are multiple
CALM inhibitors that have been used to inhibit tumor cell growth in
different species either in vivo or in culture, such as
breast adenocarcinomas (21),
lung carcinomas (26), colon
carcinomas (27), leukemia cells
(28) and resistant pancreatic
cancer (29). According to our
results, the CALM level was significantly higher in rNPC serum than
in nrNPC serum, which suggests that the upregulation of CALM can be
a potential biomarker. Even though the association between NPC or
rNPC and CALM has not yet been reported, our data suggest that it
plays an important role in rNPC; however, this needs to be further
confirmed in a larger cohort of patients.
Interestingly, CALM is involved in the Rap1
signaling pathway, cAMP signaling pathway and cGMP-PKG signaling
pathway processes, even though the enrichment ratios of the above
pathways were not high (P>0.05), which may still demonstrate
some connective associations. Several studies have also
demonstrated that under hypoxic conditions, the
Ca2+/CALM complex increases, and it lead to an
improvement in the expression of vascular endothelial growth factor
and the transcriptional activity of hypoxia-inducible factor 1.
CALM antagonists can inhibit the above process (30–32). As we all know, hypoxia is a reason
for the radioresistance of NPC, which suggests that CALM may be
closely associated with rNPC. Further studies are warranted for
elucidate to provide more insight into this.
There are limits to the present study. Firstly, we
used pooled samples for TMT profiling, which is sensitive to
outliers. Thus, it will possible that this may have lead to false
positives. This is the reason why we undertook a validation using
individual samples. Secondly, we stored the serum at −80°C, while
we could not collect the sample at the same time, this may lead to
the loss of some vital proteins. Finally, as mentioned above,
further verifications are required with a large sample size. If the
serum volume of each sample was large enough, a PCR study should
have also been carried out. This may be an approach with which to
elucidate the potential mechanisms responsible for rNPC.
In conclusion, CALM may be a potential biomarker
which may greatly improve the prediction and management of
rNPC.
Acknowledgments
The present study was supported by grants from the
Health Department of Guangxi Province of China (no. 2012091).
References
|
1
|
Chen ZT, Liang ZG and Zhu XD: A review:
Proteomics in nasopharyngeal carcinoma. Int J Mol Sci.
16:15497–15530. 2015. View Article : Google Scholar : PubMed/NCBI
|
|
2
|
Wei YS, Zheng YH, Liang WB, Zhang JZ, Yang
ZH, Lv ML, Jia J and Zhang L: Identification of serum biomarkers
for nasopharyngeal carcinoma by proteomic analysis. Cancer.
112:544–551. 2008. View Article : Google Scholar
|
|
3
|
Du C, Ying H, Zhou J, Hu C and Zhang Y:
Experience with combination of docetaxel, cisplatin plus
5-fluorouracil chemotherapy, and intensity-modulated radiotherapy
for locoregionally advanced nasopharyngeal carcinoma. Int J Clin
Oncol. 18:464–471. 2013. View Article : Google Scholar
|
|
4
|
Tao YL, Li Y, Gao J, Liu ZG, Tu ZW, Li G,
Xu BQ, Niu DL, Jiang CB and Yi W: Identifying FGA peptides as
nasopharyngeal carcinoma-associated biomarkers by magnetic beads. J
Cell Biochem. 113:2268–2278. 2012. View Article : Google Scholar : PubMed/NCBI
|
|
5
|
Zhong Yu LJ: Diagnostic progress of
recurrent nasopharyngeal carcinoma. Clinical Imaging Technology.
24:1633–1674. 2009.
|
|
6
|
Sahu A, Nandakumar N, Sawant S and Krishna
CM: Recurrence prediction in oral cancers: A serum Raman
spectroscopy study. Analyst. 140:2294–2301. 2015. View Article : Google Scholar : PubMed/NCBI
|
|
7
|
Nicholson BD, Shinkins B, Pathiraja I,
Roberts NW, James TJ, Mallett S, Perera R, Primrose JN and Mant D:
Blood CEA levels for detecting recurrent colorectal cancer.
Cochrane Database Syst Rev. 12:CD0111342015.
|
|
8
|
Li GP, Wang H, Lai YK, Chen SC, Lin MC, Lu
G, Zhang JF, He XG, Qian CN and Kung HF: Proteomic profiling
between CNE-2 and its strongly metastatic subclone S-18 and
functional characterization of HSP27 in metastasis of
nasopharyngeal carcinoma. Proteomics. 11:2911–2920. 2011.
View Article : Google Scholar : PubMed/NCBI
|
|
9
|
Xiao Z, Li G, Chen Y, Li M, Peng F, Li C,
Li F, Yu Y, Ouyang Y, Xiao Z and Chen Z: Quantitative proteomic
analysis of formalin-fixed and paraffin-embedded nasopharyngeal
carcinoma using iTRAQ labeling, two-dimensional liquid
chromatography, and tandem mass spectrometry. J Histochem Cytochem.
58:517–527. 2010. View Article : Google Scholar : PubMed/NCBI
|
|
10
|
Seriramalu R, Pang WW, Jayapalan JJ,
Mohamed E, Abdul-Rahman PS, Bustam AZ, Khoo AS and Hashim OH:
Application of champedak mannose-binding lectin in the
glycoproteomic profiling of serum samples unmasks reduced
expression of alpha-2 macroglobulin and complement factor B in
patients with nasopharyngeal carcinoma. Electrophoresis.
31:2388–2395. 2010. View Article : Google Scholar : PubMed/NCBI
|
|
11
|
Tang CE, Tan T, Li C, Chen ZC, Ruan L,
Wang HH, Su T, Zhang PF and Xiao ZQ: Identification of Galectin-1
as a novel biomarker in nasopharyngeal carcinoma by proteomic
analysis. Oncol Rep. 24:495–500. 2010.PubMed/NCBI
|
|
12
|
Cho WC, Yip TT, Yip C, Yip V, Thulasiraman
V, Ngan RK, Yip TT, Lau WH, Au JS and Law SC: Identification of
serum amyloid A protein as a potentially useful biomarker to
monitor relapse of nasopharyngeal cancer by serum proteomic
profiling. Clin Cancer Res. 10:43–52. 2004. View Article : Google Scholar : PubMed/NCBI
|
|
13
|
Yang X, Dai W, Kwong DL, Szeto CY, Wong
EH, Ng WT, Lee AW, Ngan RK, Yau CC and Tung SY: Epigenetic markers
for non-invasive early detection of nasopharyngeal carcinoma by
methylation-sensitive high resolution melting. Int J Cancer.
136:127–135. 2015. View Article : Google Scholar
|
|
14
|
White NM, Masui O, Desouza LV, Krakovska
O, Metias S, Romaschin AD, Honey RJ, Stewart R, Pace K, Lee J, et
al: Quantitative proteomic analysis reveals potential diagnostic
markers and pathways involved in pathogenesis of renal cell
carcinoma. Oncotarget. 5:506–518. 2013. View Article : Google Scholar
|
|
15
|
Tian X, Sun D, Zhao S, Xiong H and Fang J:
Screening of potential diagnostic markers and therapeutic targets
against colorectal cancer. Onco Targets Ther. 8:1691–1699.
2015.PubMed/NCBI
|
|
16
|
Yan LR, Wang DX, Liu H, Zhang XX, Zhao H,
Hua L, Xu P and Li YS: A pro-atherogenic HDL profile in coronary
heart disease patients: an iTRAQ labelling-based proteomic
approach. PloS One. 9:e983682014. View Article : Google Scholar : PubMed/NCBI
|
|
17
|
Sandberg A, Branca RM, Lehtiö J and
Forshed J: Quantitative accuracy in mass spectrometry based
proteomics of complex samples: The impact of labeling and precursor
interference. J Proteomics. 96:133–144. 2014. View Article : Google Scholar
|
|
18
|
Janvilisri T: Omics-based identification
of biomarkers for naso-pharyngeal carcinoma. Dis Markers.
2015:7621282015. View Article : Google Scholar
|
|
19
|
Luftig M: Heavy LIFting: Tumor promotion
and radioresistance in NPC. J Clin Invest. 123:4999–5001. 2013.
View Article : Google Scholar : PubMed/NCBI
|
|
20
|
Uenishi K, Criss WE and Kakiuchi S:
Calcium-activatable phosphodiesterase and calcium-dependent
modulator protein in transplantable hepatoma tissues. J Biochem.
87:601–607. 1980. View Article : Google Scholar : PubMed/NCBI
|
|
21
|
Wei JW, Morris HP and Hickie RA: Positive
correlation between calmodulin content and hepatoma growth rates.
Cancer Res. 42:2571–2574. 1982.PubMed/NCBI
|
|
22
|
Colomer J, Agell N, Engel P and Bachs O:
Expression of calmodulin and calmodulin binding proteins in
lymphoblastoid cells. J Cell Physiol. 159:542–550. 1994. View Article : Google Scholar : PubMed/NCBI
|
|
23
|
Colomer J, Agell N, Engel P, Alberola-Ila
J and Bachs O: Calmodulin expression during proliferative
activation of human T lymphocytes. Cell calclum. 14:609–618. 1993.
View Article : Google Scholar
|
|
24
|
Berchtold MW and Villalobo A: The many
faces of calmodulin in cell proliferation, programmed cell death,
autophagy, and cancer. Biochim Biophys Acta. 1843:398–435. 2014.
View Article : Google Scholar
|
|
25
|
Liu GX, Sheng HF and Wu S: A study on the
levels of calmodulin and DNA in human lung cancer cells. Br J
Cancer. 73:889–901. 1996. View Article : Google Scholar
|
|
26
|
Schuller HM, Correa E, Orloff M and Reznik
GK: Successful chemotherapy of experimental neuroendocrine lung
tumors in hamsters with an antagonist of
Ca2+/calmodulin. Cancer Res. 50:1645–1649.
1990.PubMed/NCBI
|
|
27
|
Lönn U and Lönn S: Increased growth
inhibition and DNA lesions in human colon adenocarcinoma cells
treated with methotrexate or 5-fluorodeoxyuridine followed by
calmodulin inhibitor. Cancer Res. 48:3319–3323. 1988.
|
|
28
|
Hait WN, Gesmonde J and Cheng E: Effects
of KS-501, KS-502 and their enantiomers on calmodulin-sensitive
enzyme activity and cellular proliferation. Biochem Pharmacol.
50:69–74. 1995. View Article : Google Scholar : PubMed/NCBI
|
|
29
|
Yuan K, Yong S, Xu F, Zhou T, McDonald JM
and Chen Y: Calmodulin antagonists promote TRA-8 therapy of
resistant pancreatic cancer. Oncotarget. 6:25308–25319. 2015.
View Article : Google Scholar : PubMed/NCBI
|
|
30
|
Mukhopadhyay D and Akbarali HI: Depletion
of [Ca2+]i inhibits hypoxia-induced vascular
permeability factor (vascular endothelial growth factor) gene
expression. Biochem Biophys Res Commun. 229:733–738. 1996.
View Article : Google Scholar : PubMed/NCBI
|
|
31
|
Salnikow K, Kluz T, Costa M, Piquemal D,
Demidenko ZN, Xie K and Blagosklonny MV: The regulation of hypoxic
genes by calcium involves c-Jun/AP-1, which cooperates with
hypoxia-inducible factor 1 in response to hypoxia. Mol Cell Biol.
22:1734–1741. 2002. View Article : Google Scholar : PubMed/NCBI
|
|
32
|
Jung HJ, Kim JH, Shim JS and Kwon HJ: A
novel Ca2+/calmodulin antagonist HBC inhibits
angiogenesis and downregulates hypoxia-inducible factor. J Biol
Chem. 285:25867–25874. 2010. View Article : Google Scholar : PubMed/NCBI
|