Introduction
Osteosarcoma (OS) is most prevalent in children and
young adults, and it is the 8th most common form of childhood
cancer (1). Despite the success
of chemotherapy for OS, it is still associated with one of the
lowest survival rates for pediatric cancer. Even after the complete
removal of the primary tumor, the metastasis of OS contributes to
the poor prognosis of most patients.
With the progress being made in the elucidation of
the molecular mechanisms responsible for tumor development, many
researchers have tried to unveil the molecular mechanisms
underlying the metastasis of OS, which may provide novel
therapeutic targets or diagnostic biomarkers. The PI3K/Akt
signaling pathway (2,3) and NF-κB pathway (4,5)
have been implicated in the promotion of OS metastasis. Notch
signaling has been identified to play a critical role in the
invasion and metastasis of OS (6). The HIF-1α/CXCR4 pathway has also
been shown to promote the hypoxia-induced metastasis of human OS
cells (7).
Several genes implicated in OS metastasis have been
disclosed, such as ezrin (8,9).
It has been reported that β4 integrin promotes OS metastasis and
interacts with ezrin (10).
Moreover, aldolase A (11),
cyclooxygenase-2 (12), and
insulin-like growth factor binding protein 5 (13) have been shown to be involved in
the metastasis of OS. However, knowledge of the molecular
mechanisms responsible for the development of OS is limited. There
is still a lack of effective targeted therapies and tumor-related
biomarkers. Nevertheless, current knowledge is insufficient to
markedly improve the outcomes of patients with metastatic OS.
Gene expression profiling has been utilized to
identify critical genes associated with metastasis (14–16), as well as to develop novel
treatments (17). In order to
identify novel and reliable genes associated with metastasis, a
meta-analysis of gene expression profiles was performed in the
present study. Differentially expressed genes (DEGs) between
metastatic and non-metastatic OS were revealed, followed by
protein-protein interaction (PPI) network analysis. The featured
genes were disclosed via support vector machine (SVM)
classification. Moreover, an SVM classifier was acquired and
validated.
Materials and methods
Gene expression profiles and
pre-treament
Gene expression datasets were retrieved from Gene
Expression Omnibus (GEO) using the key words 'osteosarcoma',
'metastasis', and 'Homo sapiens' by the end of April 28th,
2016. Five datasets (Table I)
that met the following criteria were collected: i) gene expression
data; ii) OS; and iii) information about metastasis was
described.
 | Table IInformation of the gene expression
datasets from GEO. |
Table I
Information of the gene expression
datasets from GEO.
| GEO accession | Platform | Probe no. | Total sample
no. | Metastasis | Non-metastasis |
|---|
| GSE32981 | GPL3307 | 14725 | 23 | 18 | 5 |
| GSE21257 | GPL10295 | 48701 | 53 | 34 | 19 |
| GSE14359 | GPL96 | 22283 | 18 | 8 | 10 |
| GSE14827 | GPL570 | 42450 | 27 | 9 | 18 |
| GSE9508 | GPL6067 | 41059 | 34 | 21 | 13 |
The gene expression datasets GSE14359 and GSE14827
were acquired with Affymetrix platforms. Thus, background
correction and normalization were performed with package 'affy' of
R. Missing values were filled with the median method. Background
correction was carried out using the MSA method. Normalization was
achieved with the quantiles method.
For the other 3 gene expression datasets, probes
were then mapped into genes. Probes corresponding to the same gene
were averaged as the final expression value of the gene.
Normalization was performed with package limma (18) of R.
Screening of DEGs
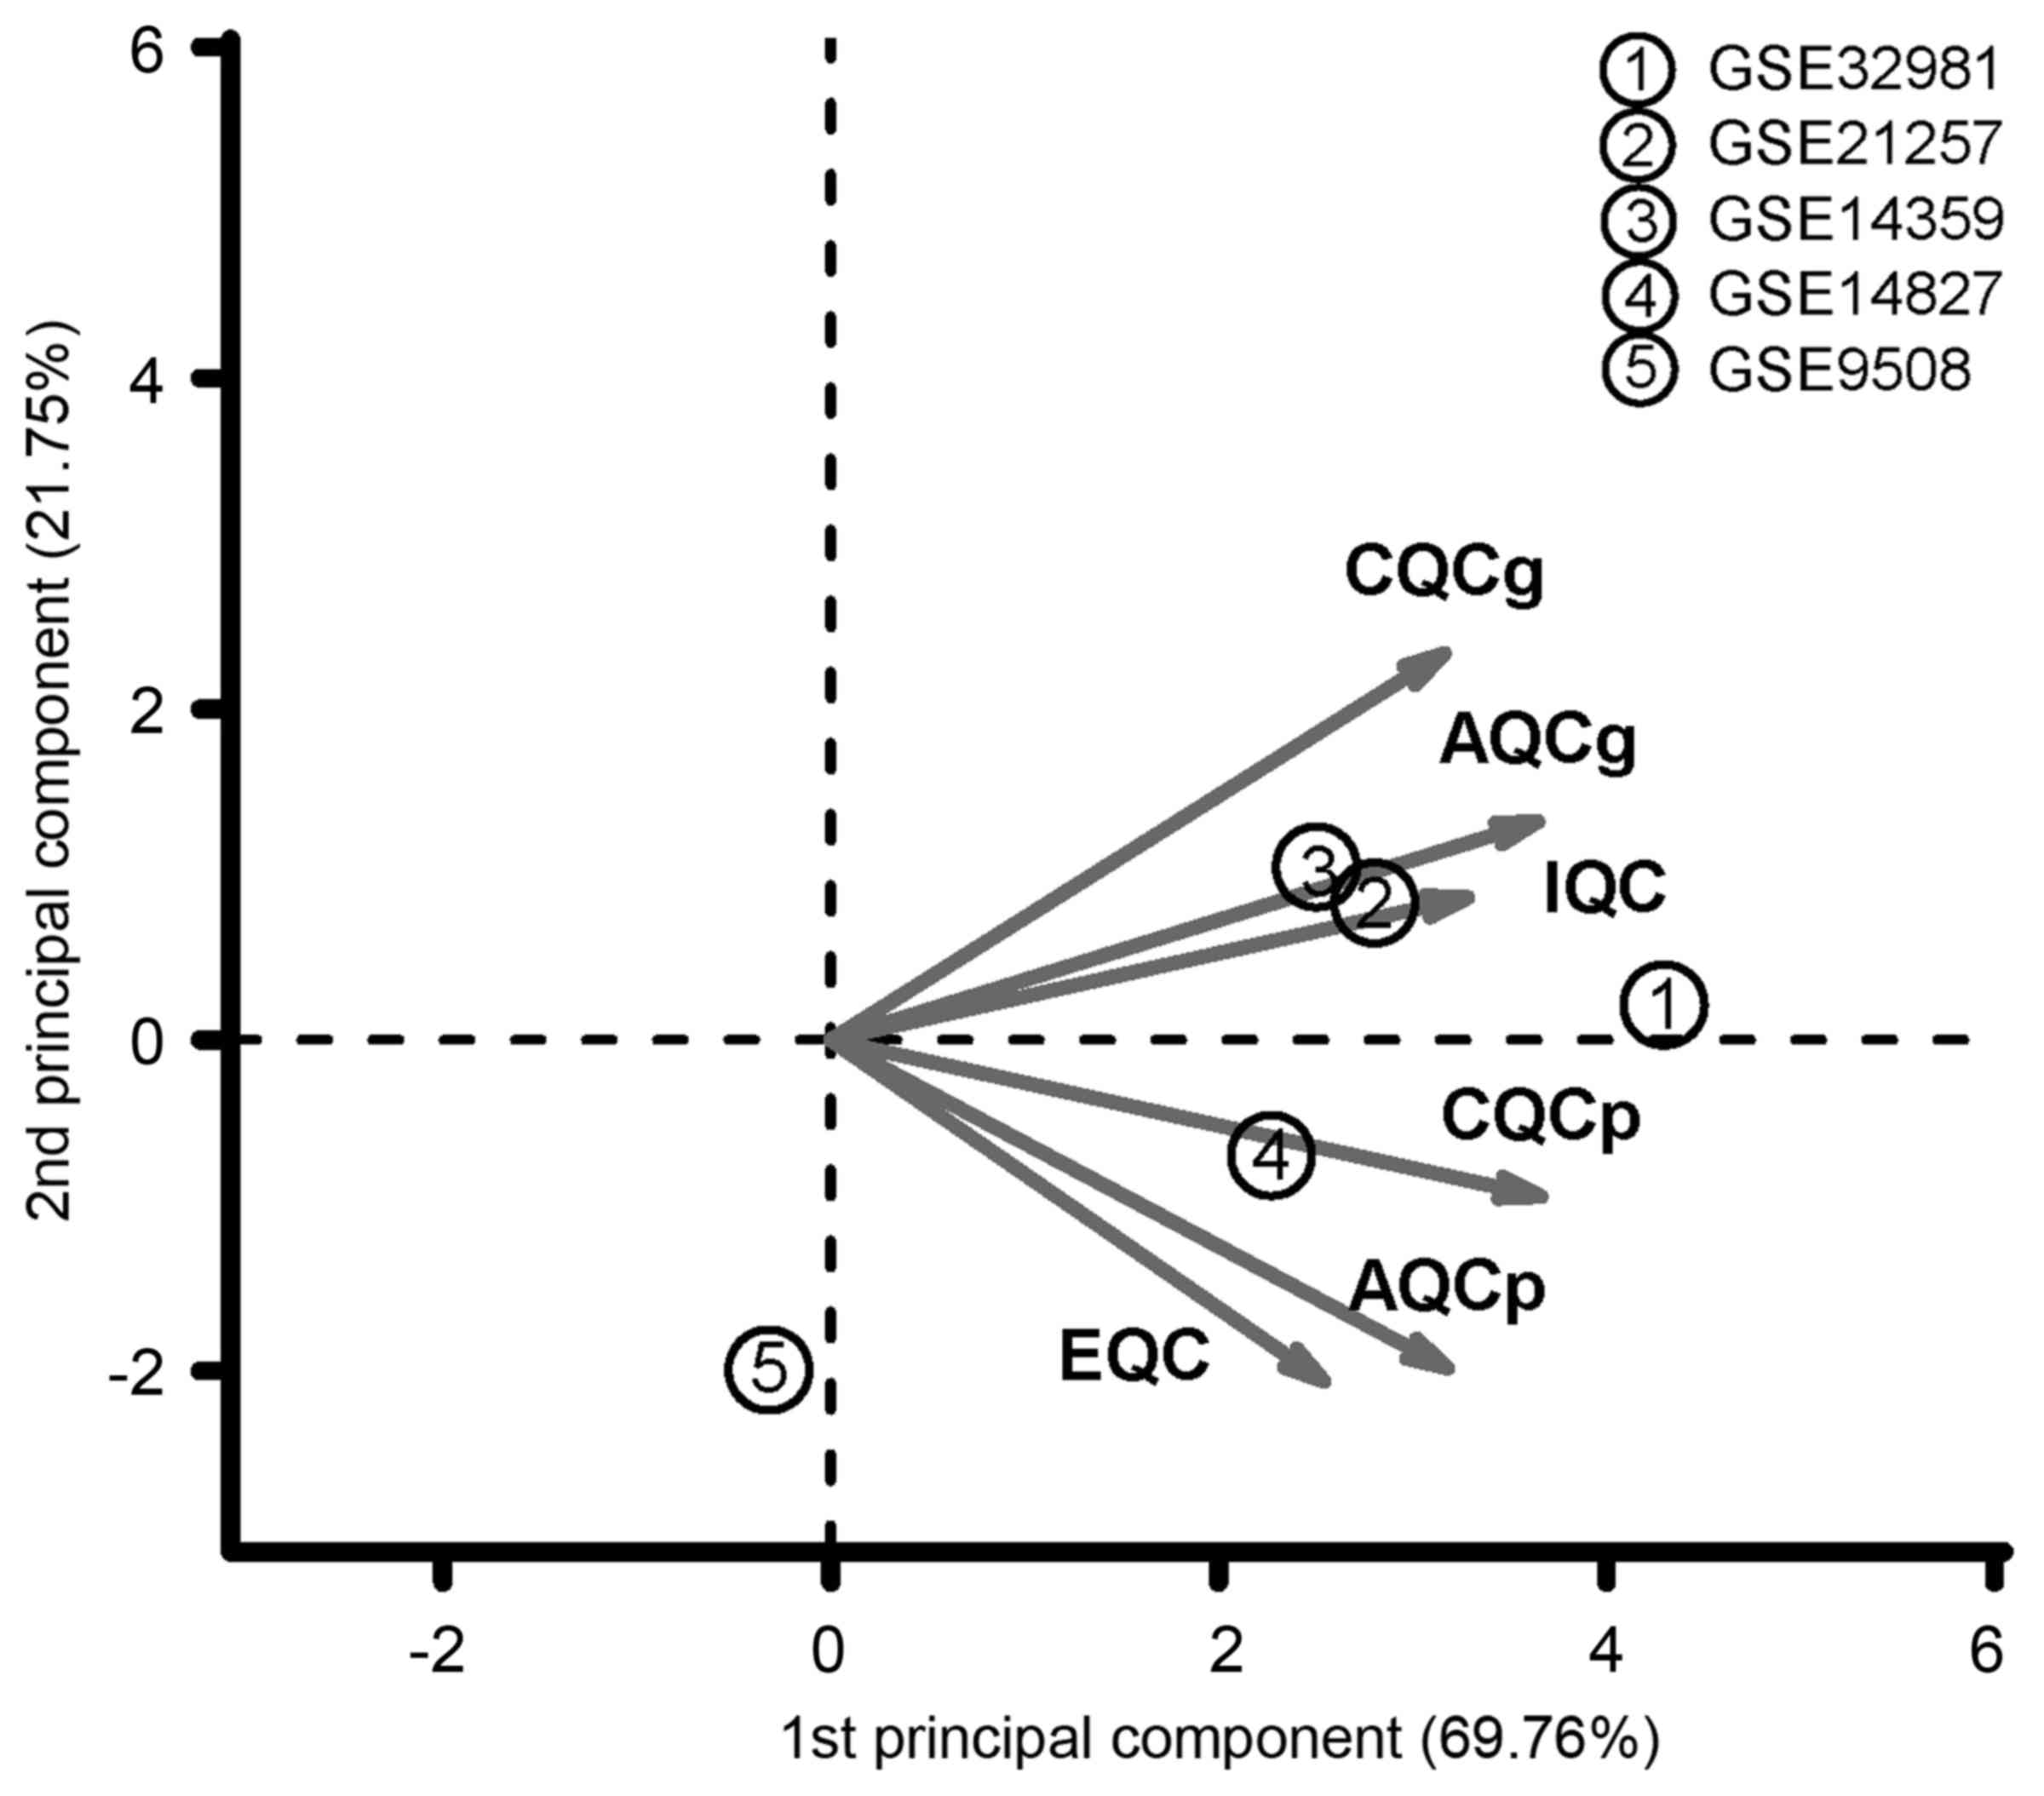
Prior to meta-analysis, the 5 gene expression
datasets were assessed using package MetaQC (19), as well as principal component
analysis (PCA) and standardized mean rank (SMR). The following
criteria were applied in the assessment: i) internal quality
control (IQC), homogeneity test of gene expression profiles among
datasets; ii) external quality control (EQC), homogeneity test of
gene expression profiles with pathway database; iii) accuracy
quality control (AQC), accuracy of featured genes (AQCg) or
pathways (AQCp); and iv) consistency quality control (CQC),
consistency in ranking of featured genes (CQCg) or pathways
(CQCp).
DEGs were screened out using the MetaDE.ES from
package MetaDE. This method first tested the heterogeneity of gene
expression value in various platforms with three statistic
parameters: τ2, Q-value and Qpval. It then tested
differential expression of genes between different groups with
statistic parameters P-value. To ensure the homogeneity of featured
genes, τ2=0, Qpval>0.05 and P<0.05 were set as the
cut-offs.
Construction of protein-protein
interaction (PPI) network
The PPI information was downloaded from the database
of protein, chemical, and genetic interactions (BioGRID, http://thebiogrid.org/) (20), Human Protein Reference Database
(HPRD, http://www.hprd.org/) (21) and Database of Interacting Proteins
(DIP, http://dip.doe-mbi.ucla.edu/dip/Main.cgi) (22). The protein products of the DEGs
were mapped into the whole network and the PPI network for the DEGs
was then acquired. The network was then visualized with Cytoscape
(23).
Calculation of betweenness centrality
(BC)
The featured genes were screened out from the DEGs
using BC, which reflected hubness of the node in the PPI network.
The BC was calculated as follows: where
σst is the shortest path from s to
t; σst(ν) is the number of the
shortest path from s to t passing through node
V; BC score is between 0 and 1, and the greater BC score
indicates the higher degree of hubness.
Training and validation of SVM
classifier
The dataset GSE21257 was selected as the training
set. Genes were ranked based upon the BC value and top 10 genes
were selected out to train the SVM classifier. An increment of 10
genes were added into the classifier until the metastatic OS could
be totally separated from non-metastatic OS. These DEGs were
regarded as featured genes. Two-way clustering of sample and gene
expression was applied on the featured genes and the result was
visualized with a heatmap. The other 3 gene expression datasets
were used as the validation set. Sensitivity (Se), specificity
(Sp), positive predictive value (PPV), negative predictive value
(NPV) and the area under the curve (AUC) were calculated to
evaluate the SVM classifier.
Pathway enrichment analysis
Gene Ontology (GO) biological pathways and Kyoto
Encyclopedia of Genes and Genomes (KEGG) pathways related to
featured genes were identified using runHyperGO and runHyperKEGG
from package EMA of R. The significance was calculated using
Fisher's exact test as follows: where N is the total number of
gene; M is the number of gene in the pathway; K is the number of
featured gene.
Results
DEGs
Quality control test was applied on the 5 gene
expression datasets and the results are listed in Table II. As shown in the PCA result
(Fig. 1), the dataset GSE9508 far
deviated from the other 4 datasets, which was assessed as poor
quality. Thus, the dataset GSE9508 was excluded from the following
analysis.
| Table IIQuality control test of the gene
expression datasets. |
Table II
Quality control test of the gene
expression datasets.
| Dataset | IQC | EQC | CQCg | CQCp | AQCg | AQCp | SMR |
|---|
| GSE32981 | 5.27 | 3.23 | 106.65 | 158.86 | 32.71 | 90.88 | 1.62 |
| GSE21257 | 4.38 | 3.16 | 64.14 | 146.51 | 26.46 | 96.74 | 2.86 |
| GSE14359 | 4.81 | 3.23 | 59.25 | 171.49 | 25.5 | 84.37 | 2.42 |
| GSE14827 | 6.09 | 1.1 | 101.1 | 114.3 | 19.53 | 29.46 | 3.92 |
| GSE9508 | 0.23 | 1.69 | 6.01 | 1.58 | 1.26 | 0.71 | 11.58 |
According to the criteria described above, a total
of 353 DEGs were identified from the 4 datasets. The top 10 DEGs
(ranked by P-value) are listed in Table III, including chromosome 13 open
reading frame 18 (C13orf18), activating transcription factor
3 (ATF3), cadherin 5 (CDH5), epoxide hydrolase 2 (EPHX2),
cadherin 3 (CDH3), ectonucleoside triphosphate
diphosphohydrolase 5 (ENTPD5), forkhead box A1 (FOXA1),
ephrin B2 (EFNB2), bromo adjacent homology domain containing
1 (BAHD1) and chromosome 10 open reading frame 76
(C10orf76).
| Table IIITop 10 DEGs ranked by P-value. |
Table III
Top 10 DEGs ranked by P-value.
| Gene | P-value | Qval | Qpval |
τau2 | Expression |
|---|
|
C13orf18 | 3.20E−05 | 8.32E−01 | 8.42E−01 | 0 | + |
| ATF3 | 6.41E−05 | 1.02E+00 | 7.97E−01 | 0 | + |
| CDH5 | 6.41E−05 | 1.82E+00 | 6.11E−01 | 0 | + |
| EPHX2 | 6.41E−05 | 1.68E+00 | 6.42E−01 | 0 | − |
| CDH3 | 1.25E−04 | 2.64E+00 | 4.51E−01 | 0 | + |
| ENTPD5 | 1.64E−04 | 1.77E+00 | 6.21E−01 | 0 | − |
| FOXA1 | 1.67E−04 | 1.80E+00 | 6.16E−01 | 0 | + |
| EFNB2 | 1.81E−04 | 2.84E+00 | 4.17E−01 | 0 | + |
| BAHD1 | 2.10E−04 | 1.01E+00 | 7.99E−01 | 0 | − |
|
C10orf76 | 2.38E−04 | 2.96E+00 | 3.98E−01 | 0 | − |
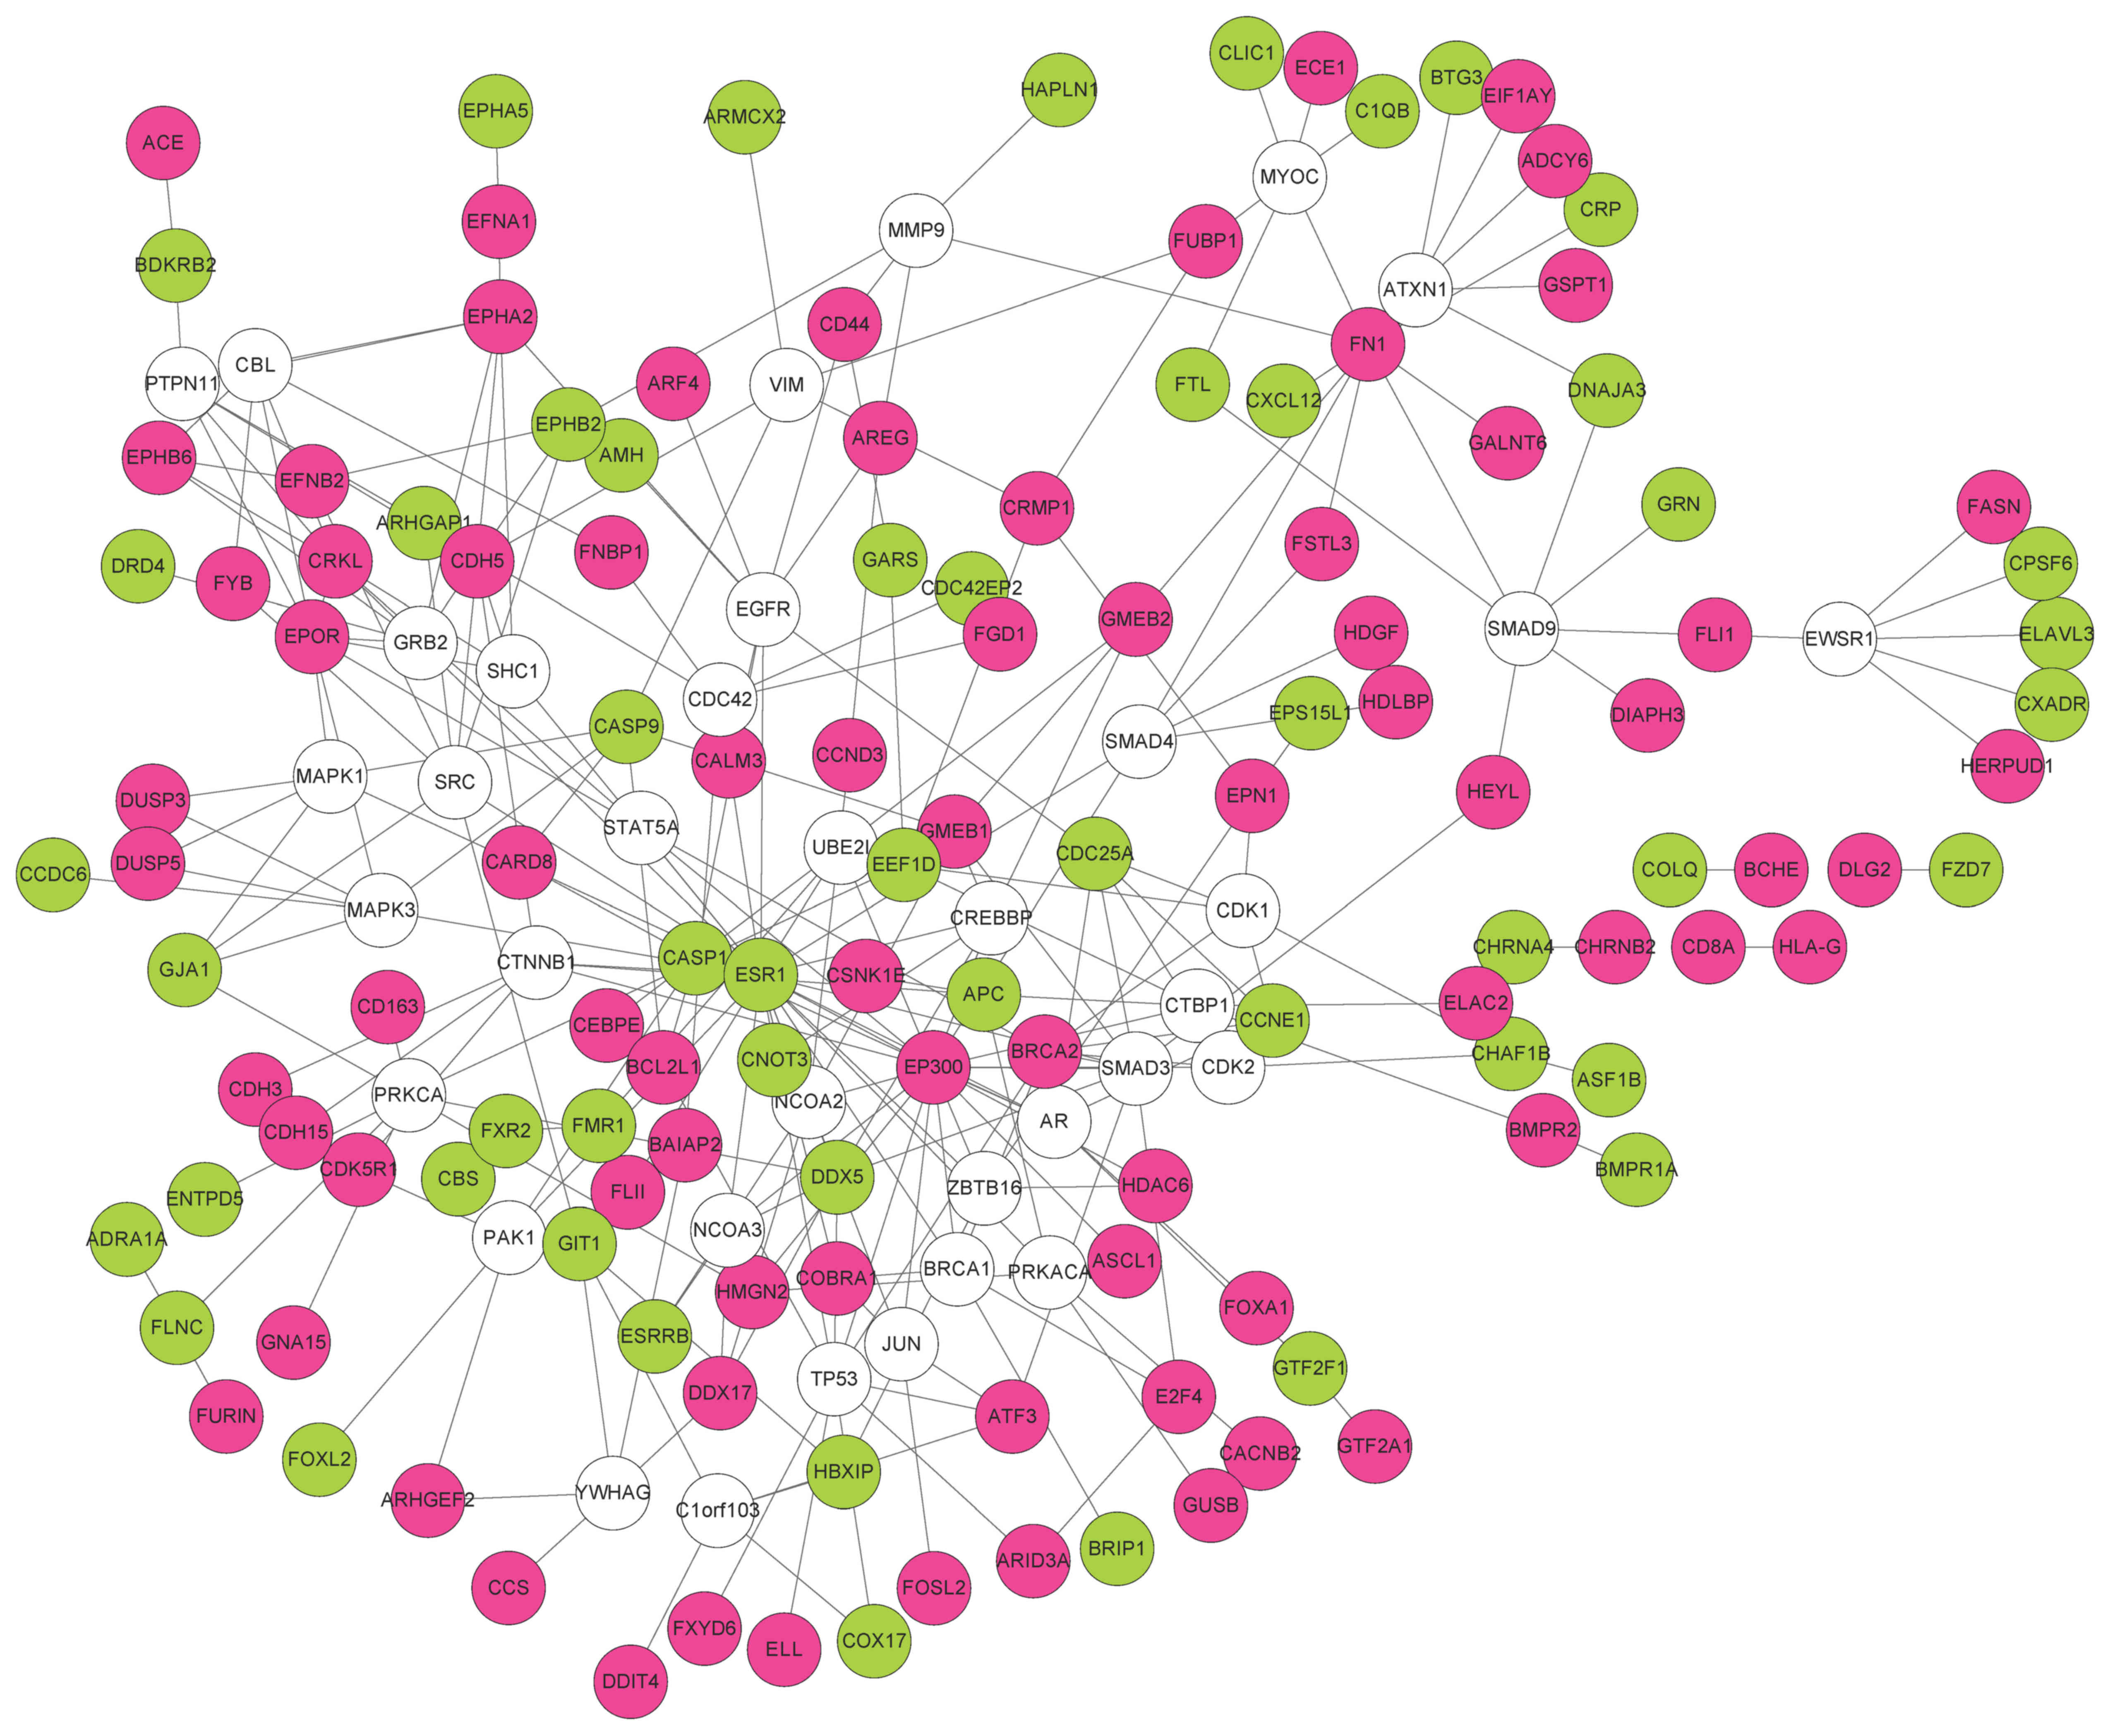
PPI network
Non-DEGs interacting with no less than 5 DEGs were
also included in the PPI network. Finally, a PPI network containing
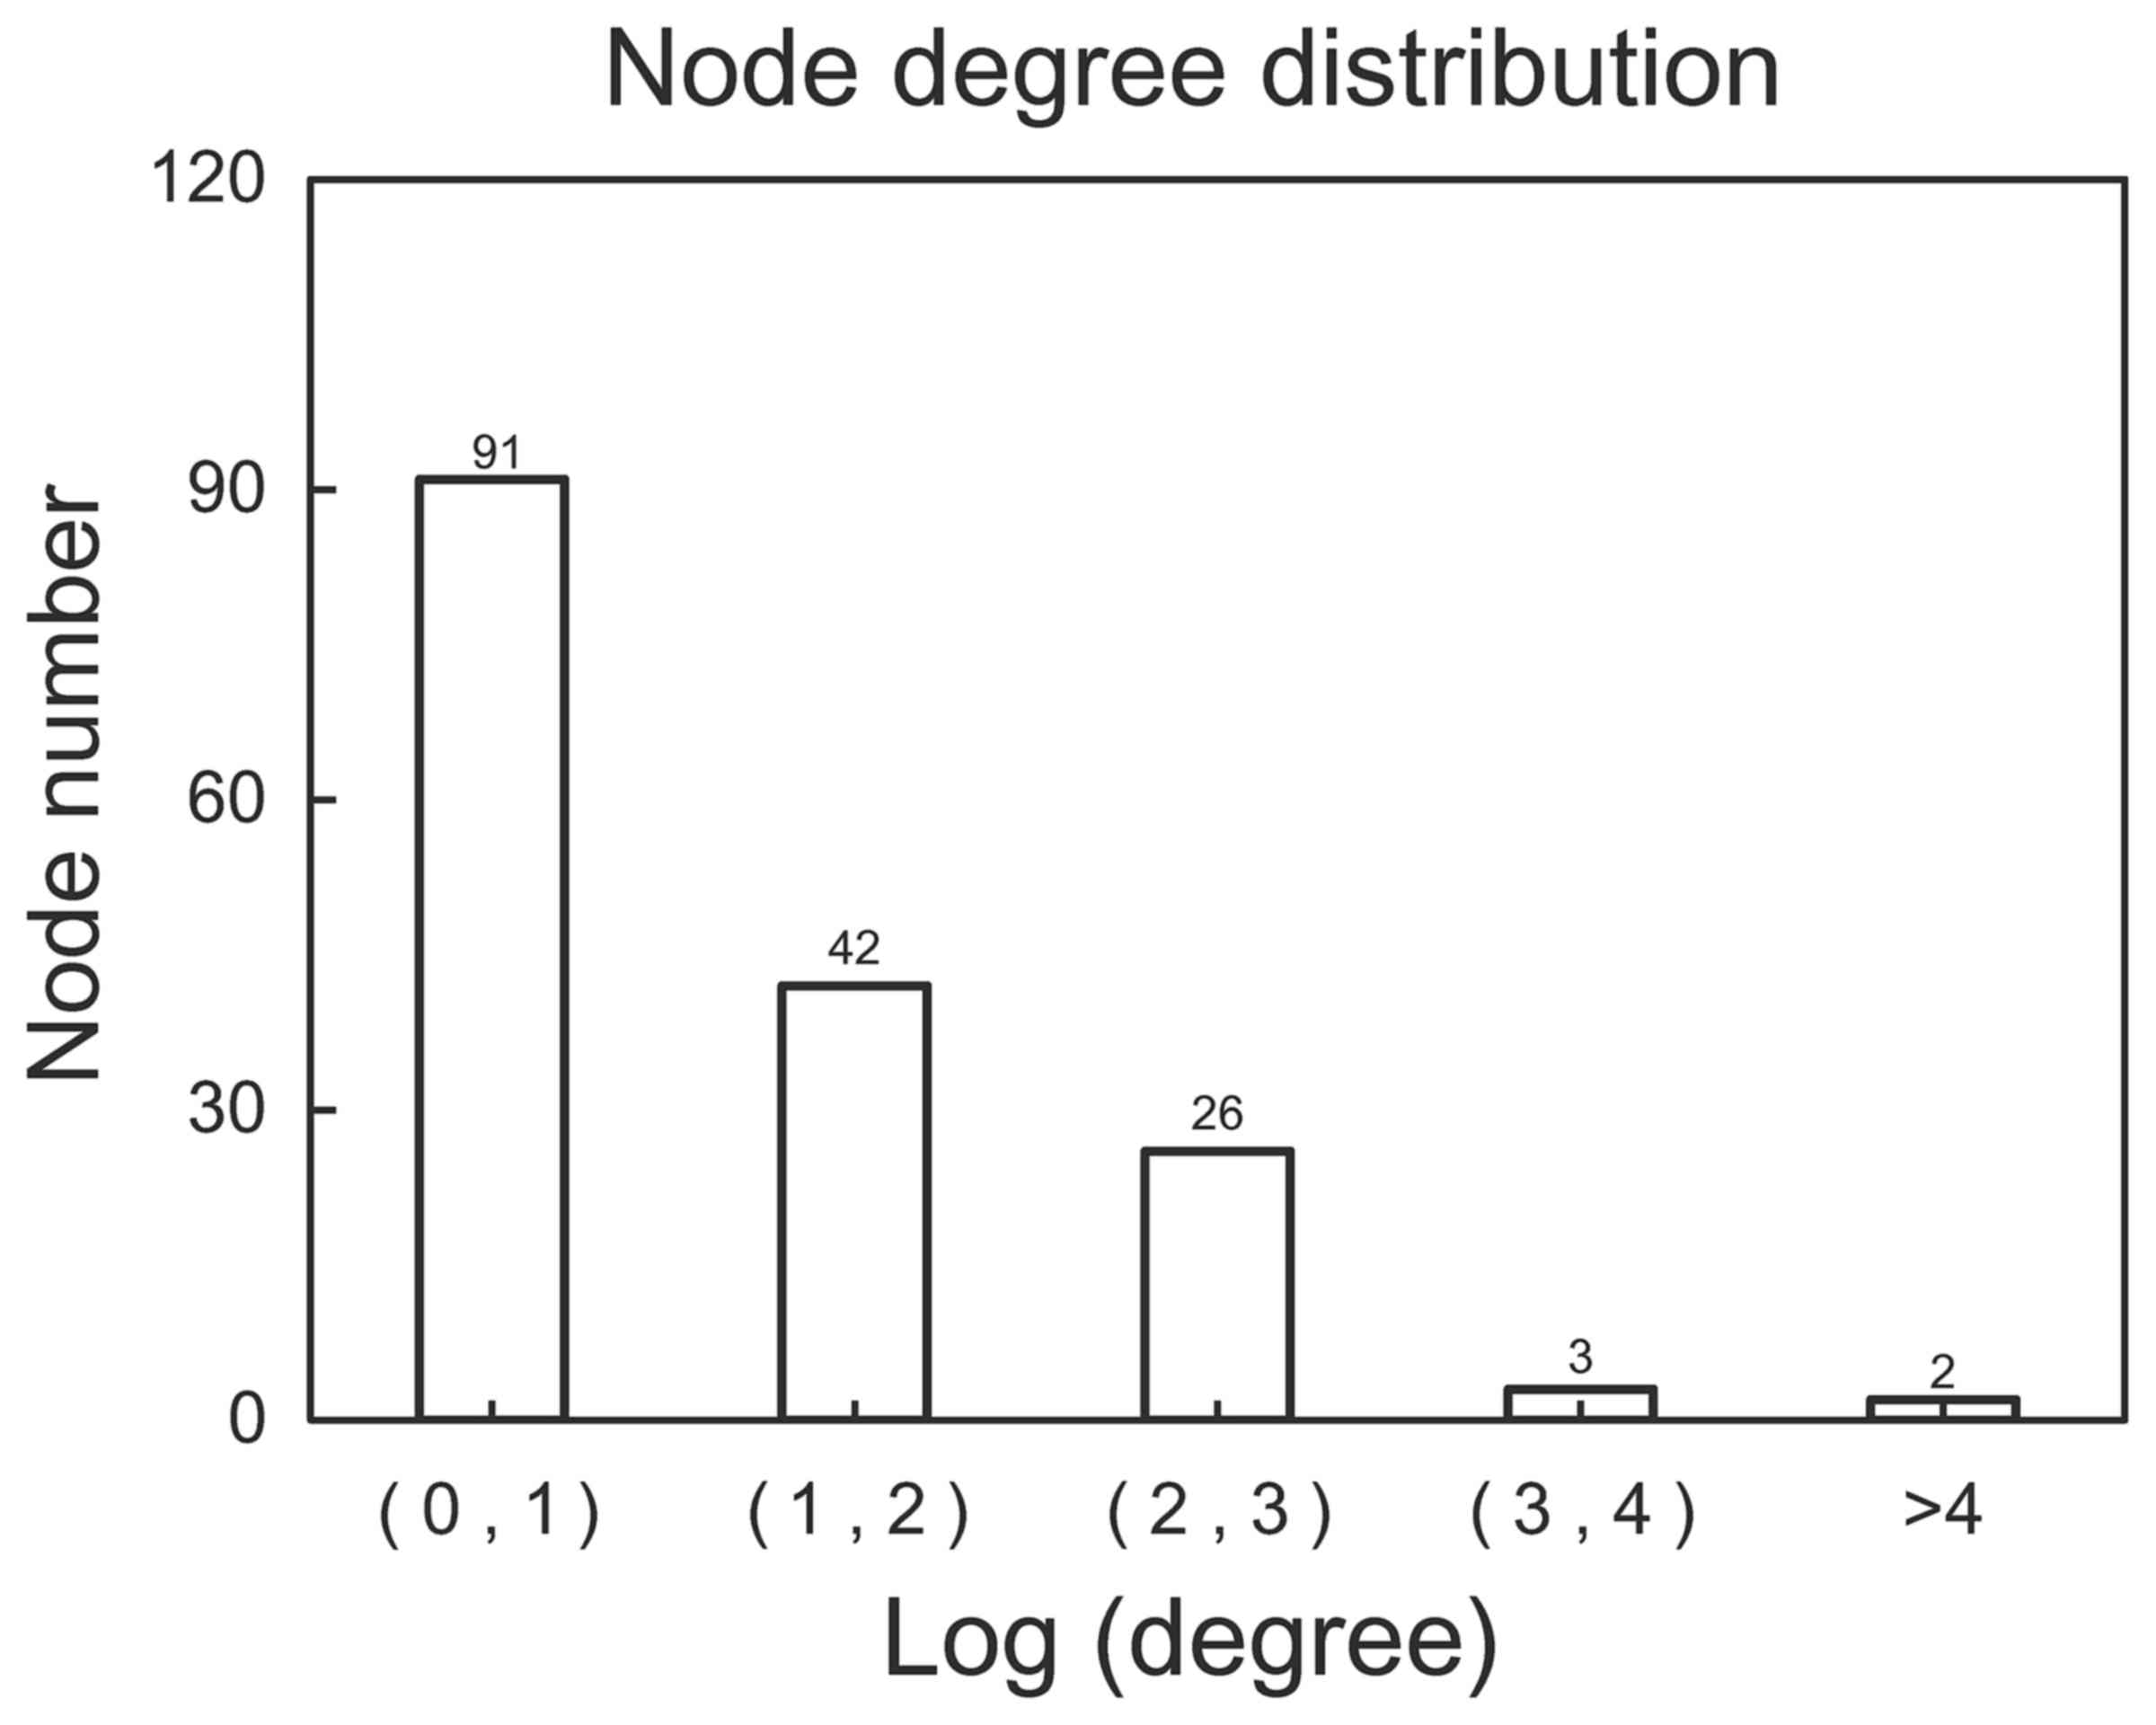
164 nodes and 272 edges was obtained (Fig. 2). The distribution of degree is
shown in Fig. 3. Most genes (168
genes) showed a small degree (Log transformed degree <1), while
only 2 genes had a Log transformed degree of >4. Therefore,
similar to most biological networks, this PPI network exhibited
scale-free property. These genes with a high degree were hub genes
and may thus play important roles in the development of
diseases.
Featured genes
BC was calculated for each node and the top 10 genes
are listed in Table IV. These
were estrogen receptor 1 (ESR1), E1A binding protein p300
(EP300), tumor protein p53 (TP53), SMAD family member
3 (SMAD3), epidermal growth factor receptor (EGFR),
fibronectin 1 (FN1), SRC proto-oncogene, non-receptor
tyrosine kinase (SRC), protein kinase Cα (PRKCA),
DEAD-box helicase 5 (DDX5) and erythropoietin receptor
(EPOR).
| Table IVTop 10 genes ranked by BC. |
Table IV
Top 10 genes ranked by BC.
| Gene | BC | EXP | Degree | P-value | Qval | Qpval | τ2 |
|---|
| ESR1 | 4.03E−01 | − | 26 | 1.60E−02 | 2.73E+00 | 4.35E−01 | 0 |
| EP300 | 1.90E−01 | + | 19 | 4.86E−02 | 1.12E+00 | 7.73E−01 | 0 |
| TP53 | 6.70E−02 | Null | 10 | − | − | − | − |
| SMAD3 | 1.02E−01 | Null | 9 | − | − | − | − |
| EGFR | 7.40E−02 | Null | 9 | − | − | − | − |
| FN1 | 1.33E−01 | + | 8 | 9.80E−03 | 2.63E+00 | 4.52E−01 | 0 |
| SRC | 9.92E−02 | Null | 8 | − | − | − | − |
| PRKCA | 8.43E−02 | Null | 8 | − | − | − | − |
| DDX5 | 6.33E−02 | − | 8 | 1.00E−03 | 1.04E+00 | 7.91E−01 | 0 |
| EPOR | 2.35E−02 | + | 8 | 3.80E−02 | 6.93E−01 | 8.75E−01 | 0 |
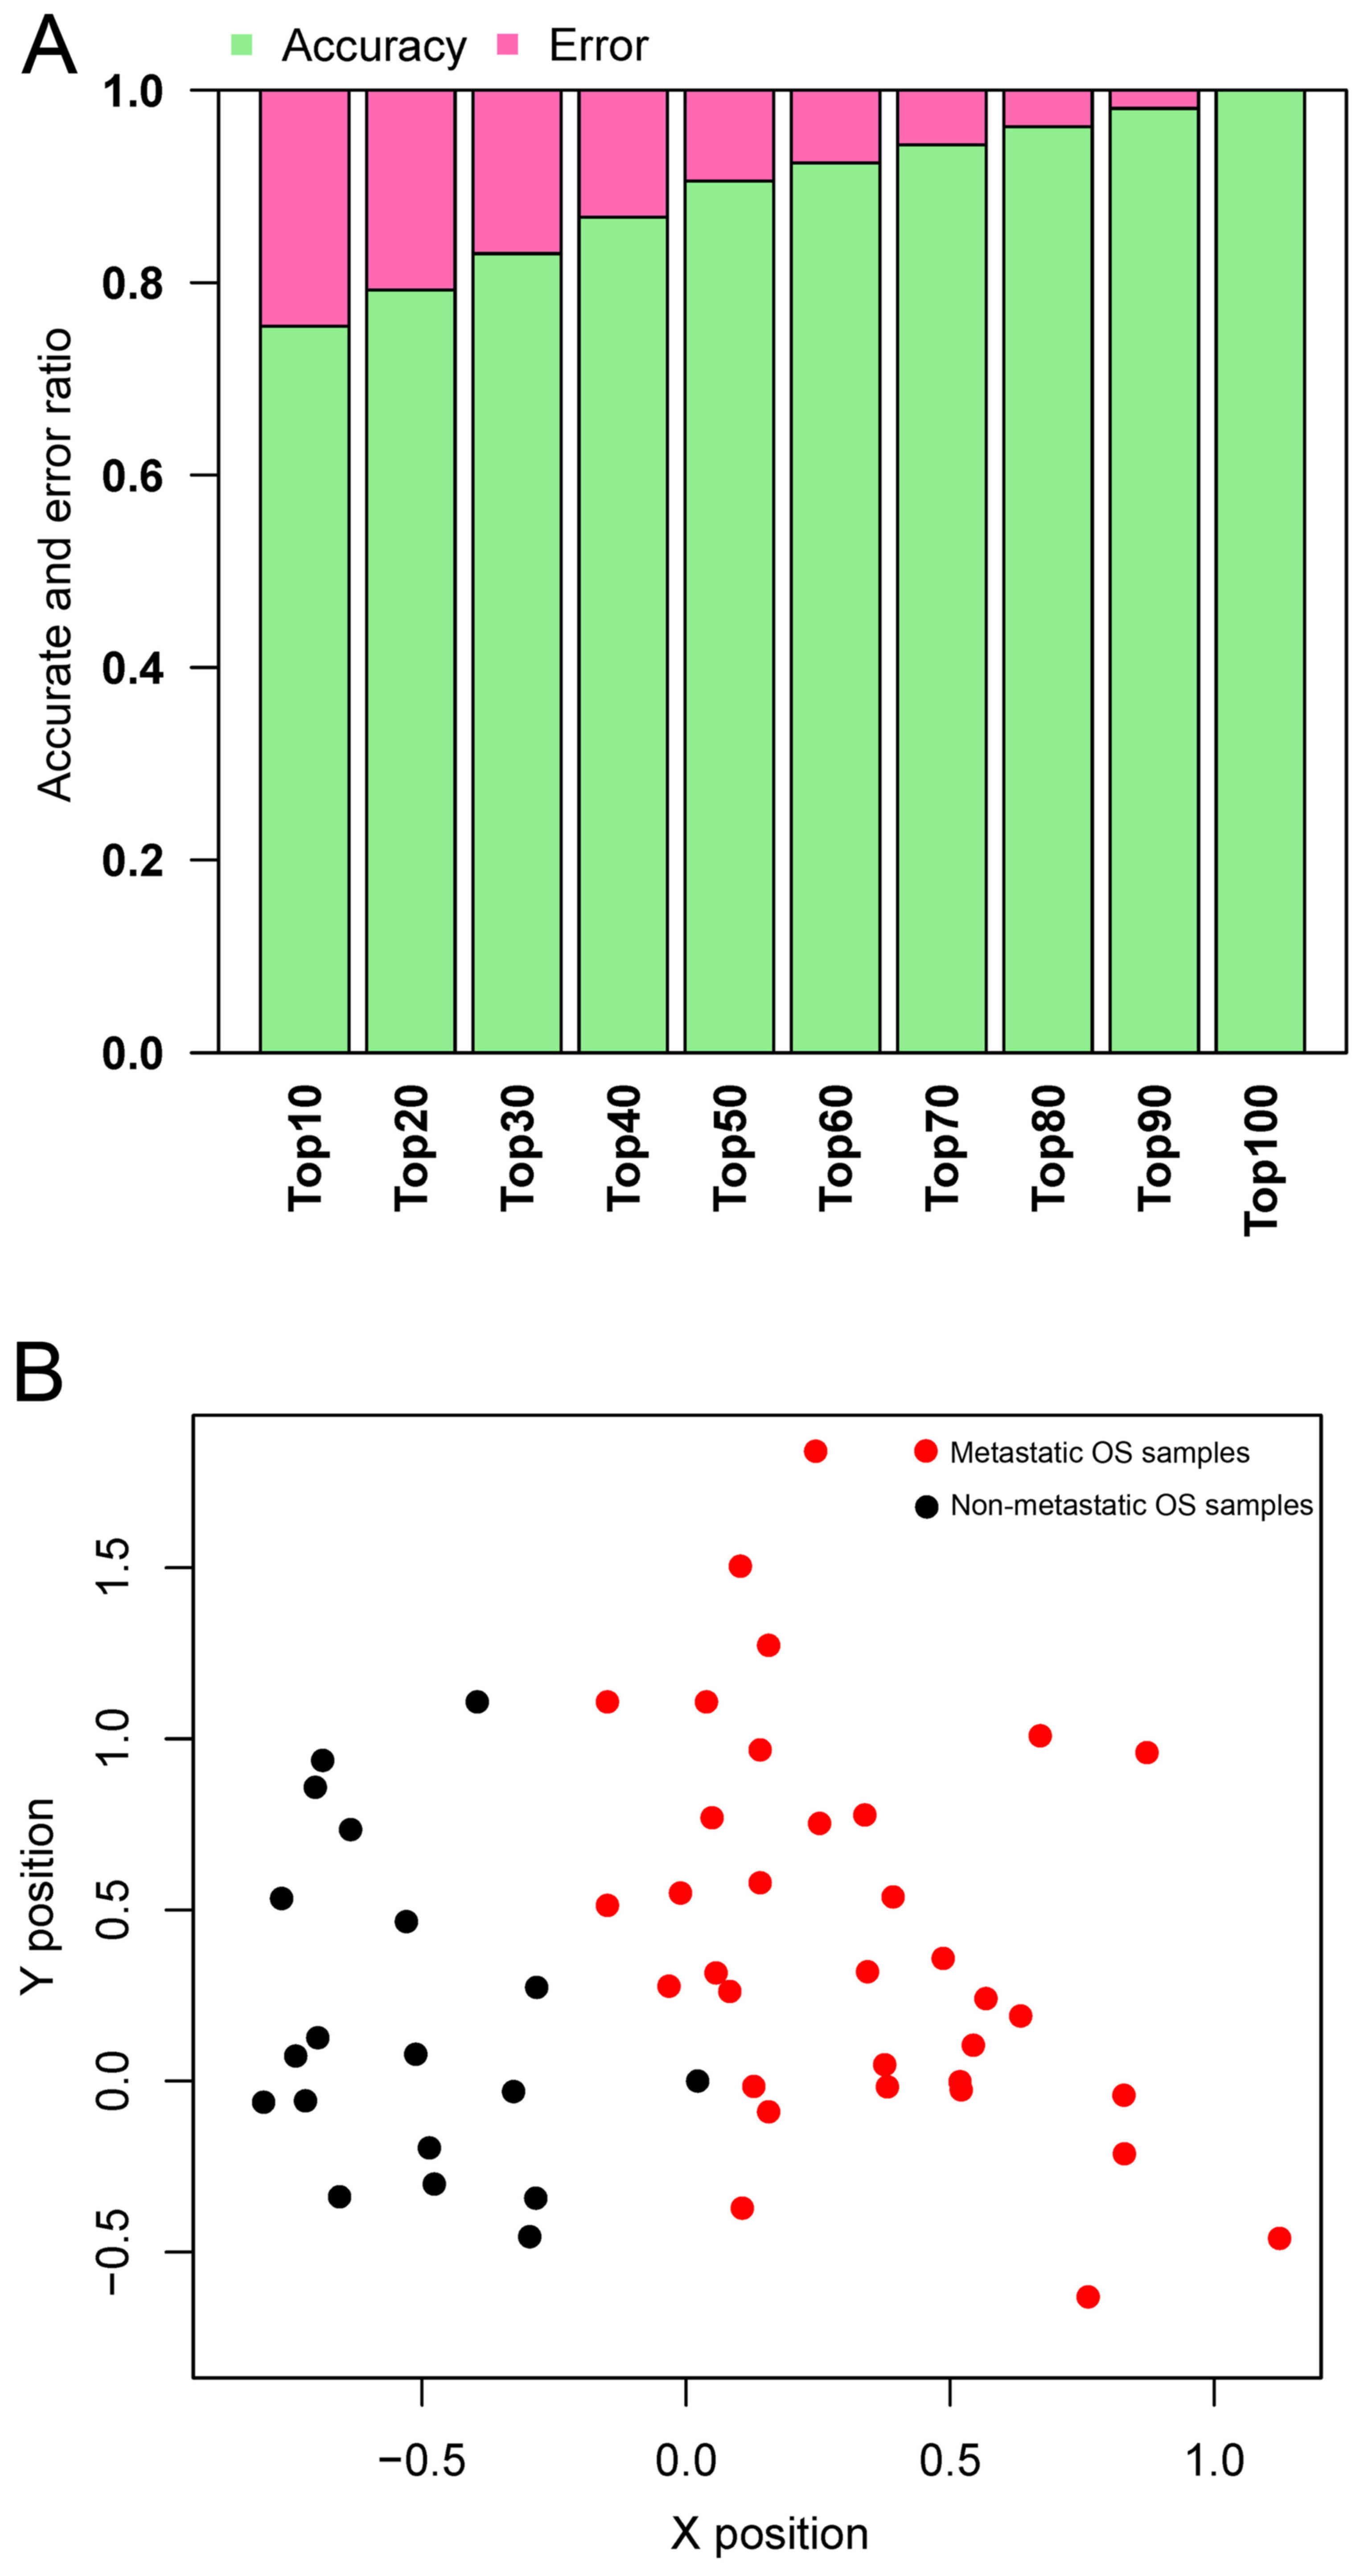
SVM classifier
Top genes were selected out to train the SVM
classifier with the dataset GSE21257. As shown in Fig. 4A, the accuracy increased from 75
to 100%, while more genes were included in the classifier. The
accuracy reached 100%, while the top 100 genes (containing 64 DEGs;
data not shown) were included in the classifier. Therefore, the top
64 featured genes (data not shown) were selected to construct the
SVM classifier. The classifier could separate metastatic OS from
non-metastatic OS in the dataset GSE21257 (Fig. 4B).
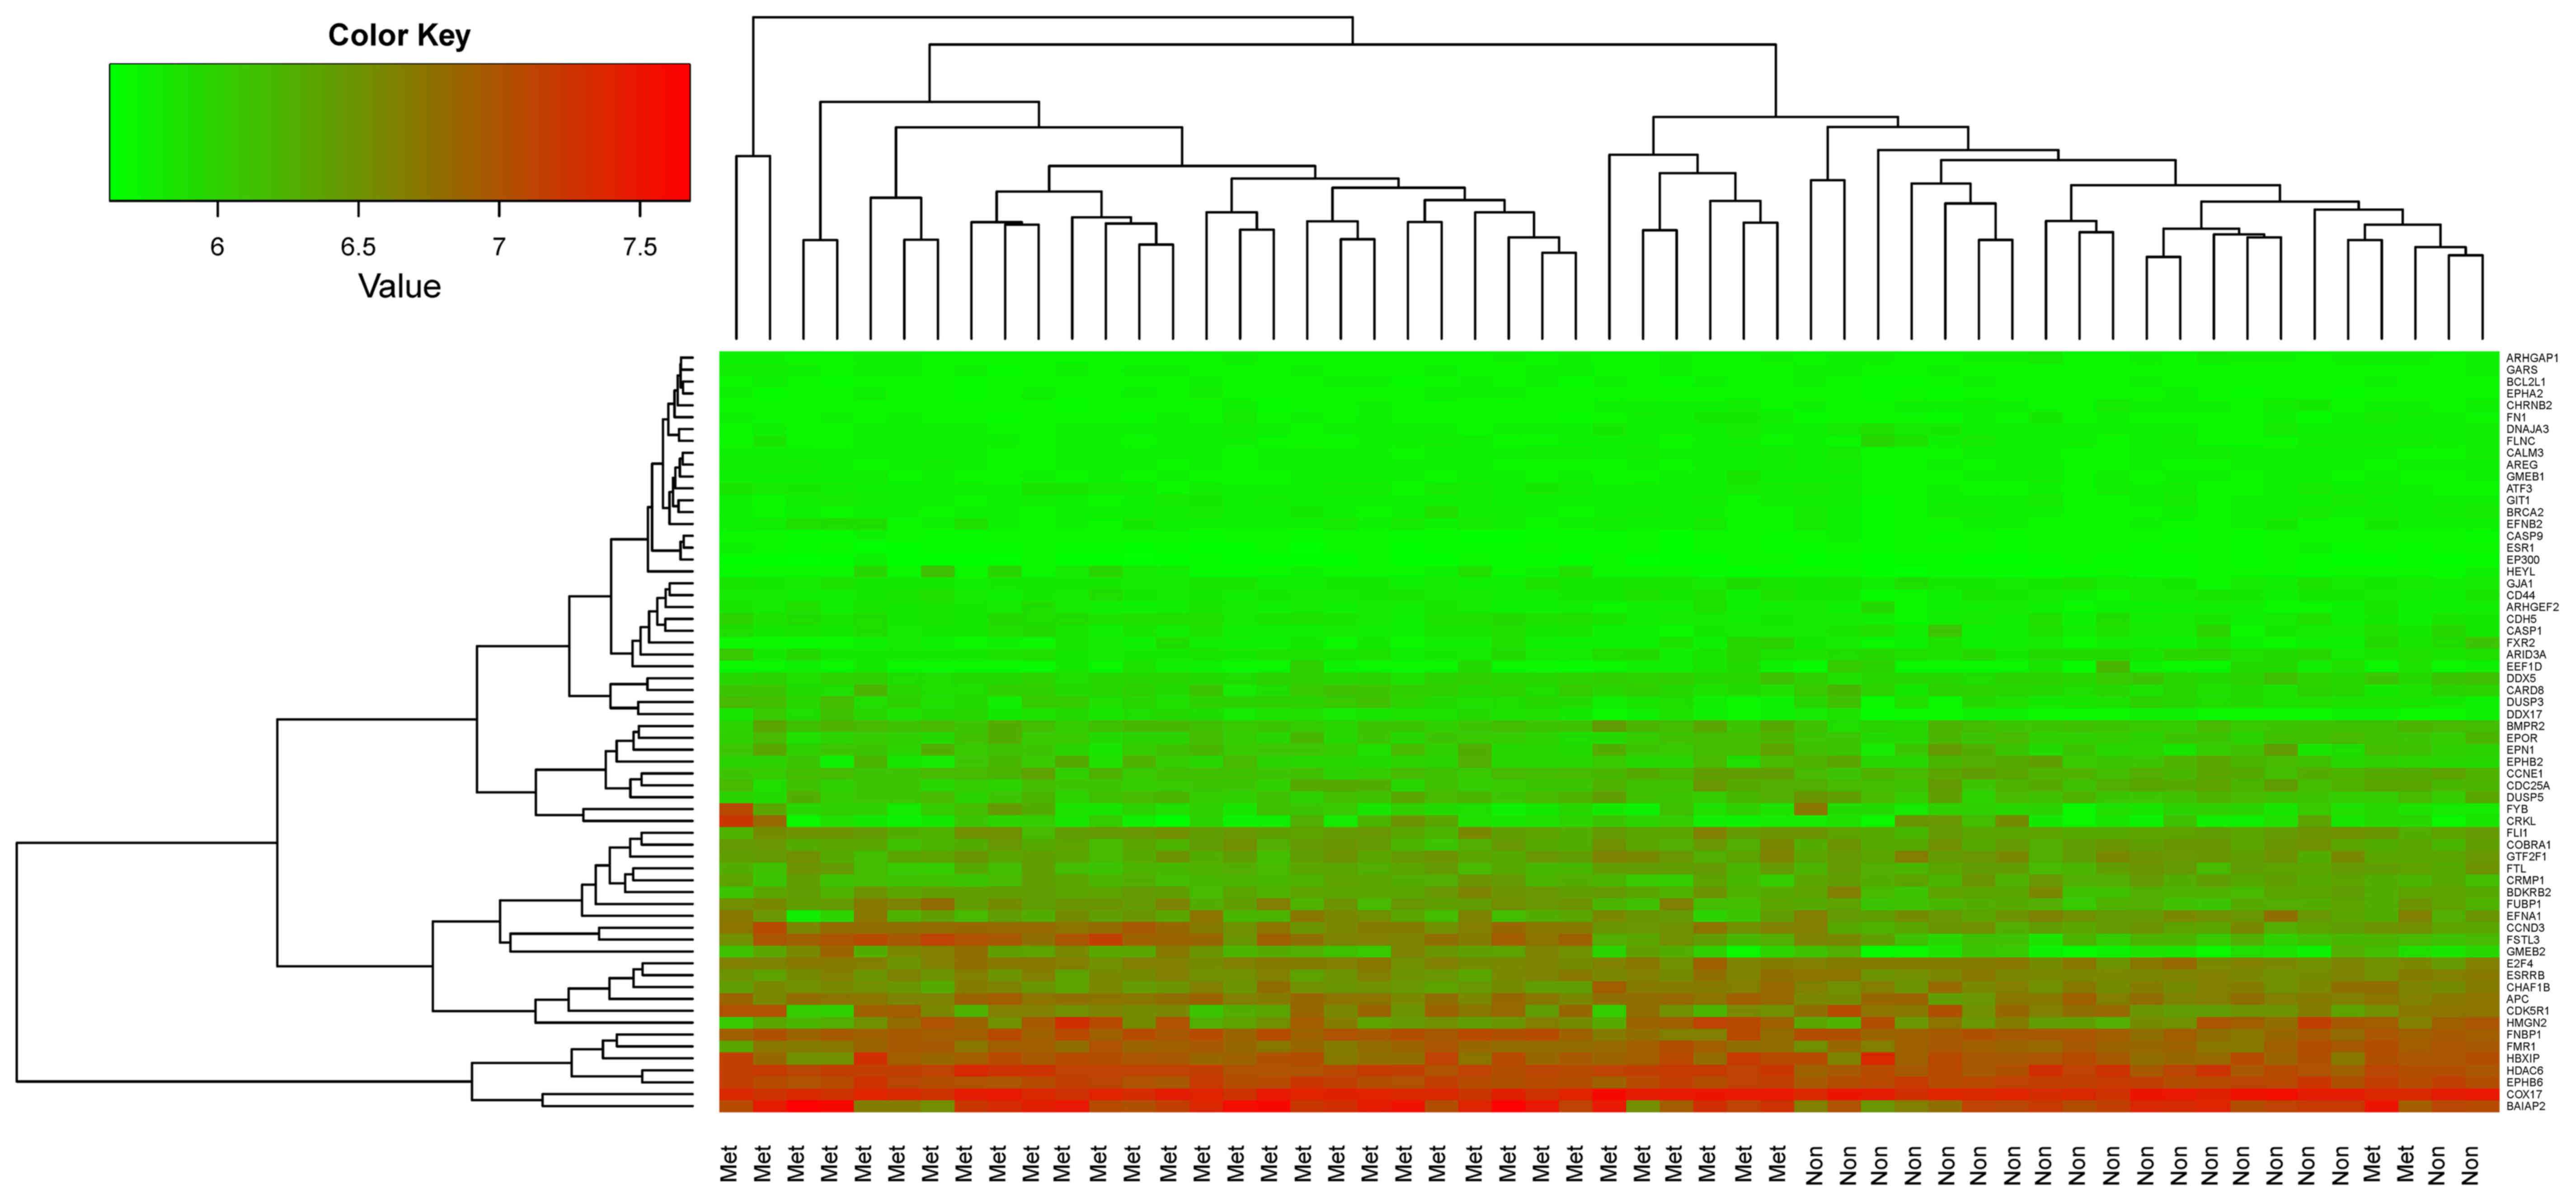
Hierarchical clustering was performed for the 53
samples from the training dataset GSE21257 using the 64 featured
genes and the results are shown in Fig. 5. The 64 featured genes could well
distinguish metastatic OS samples from non-metastatic OS
samples.
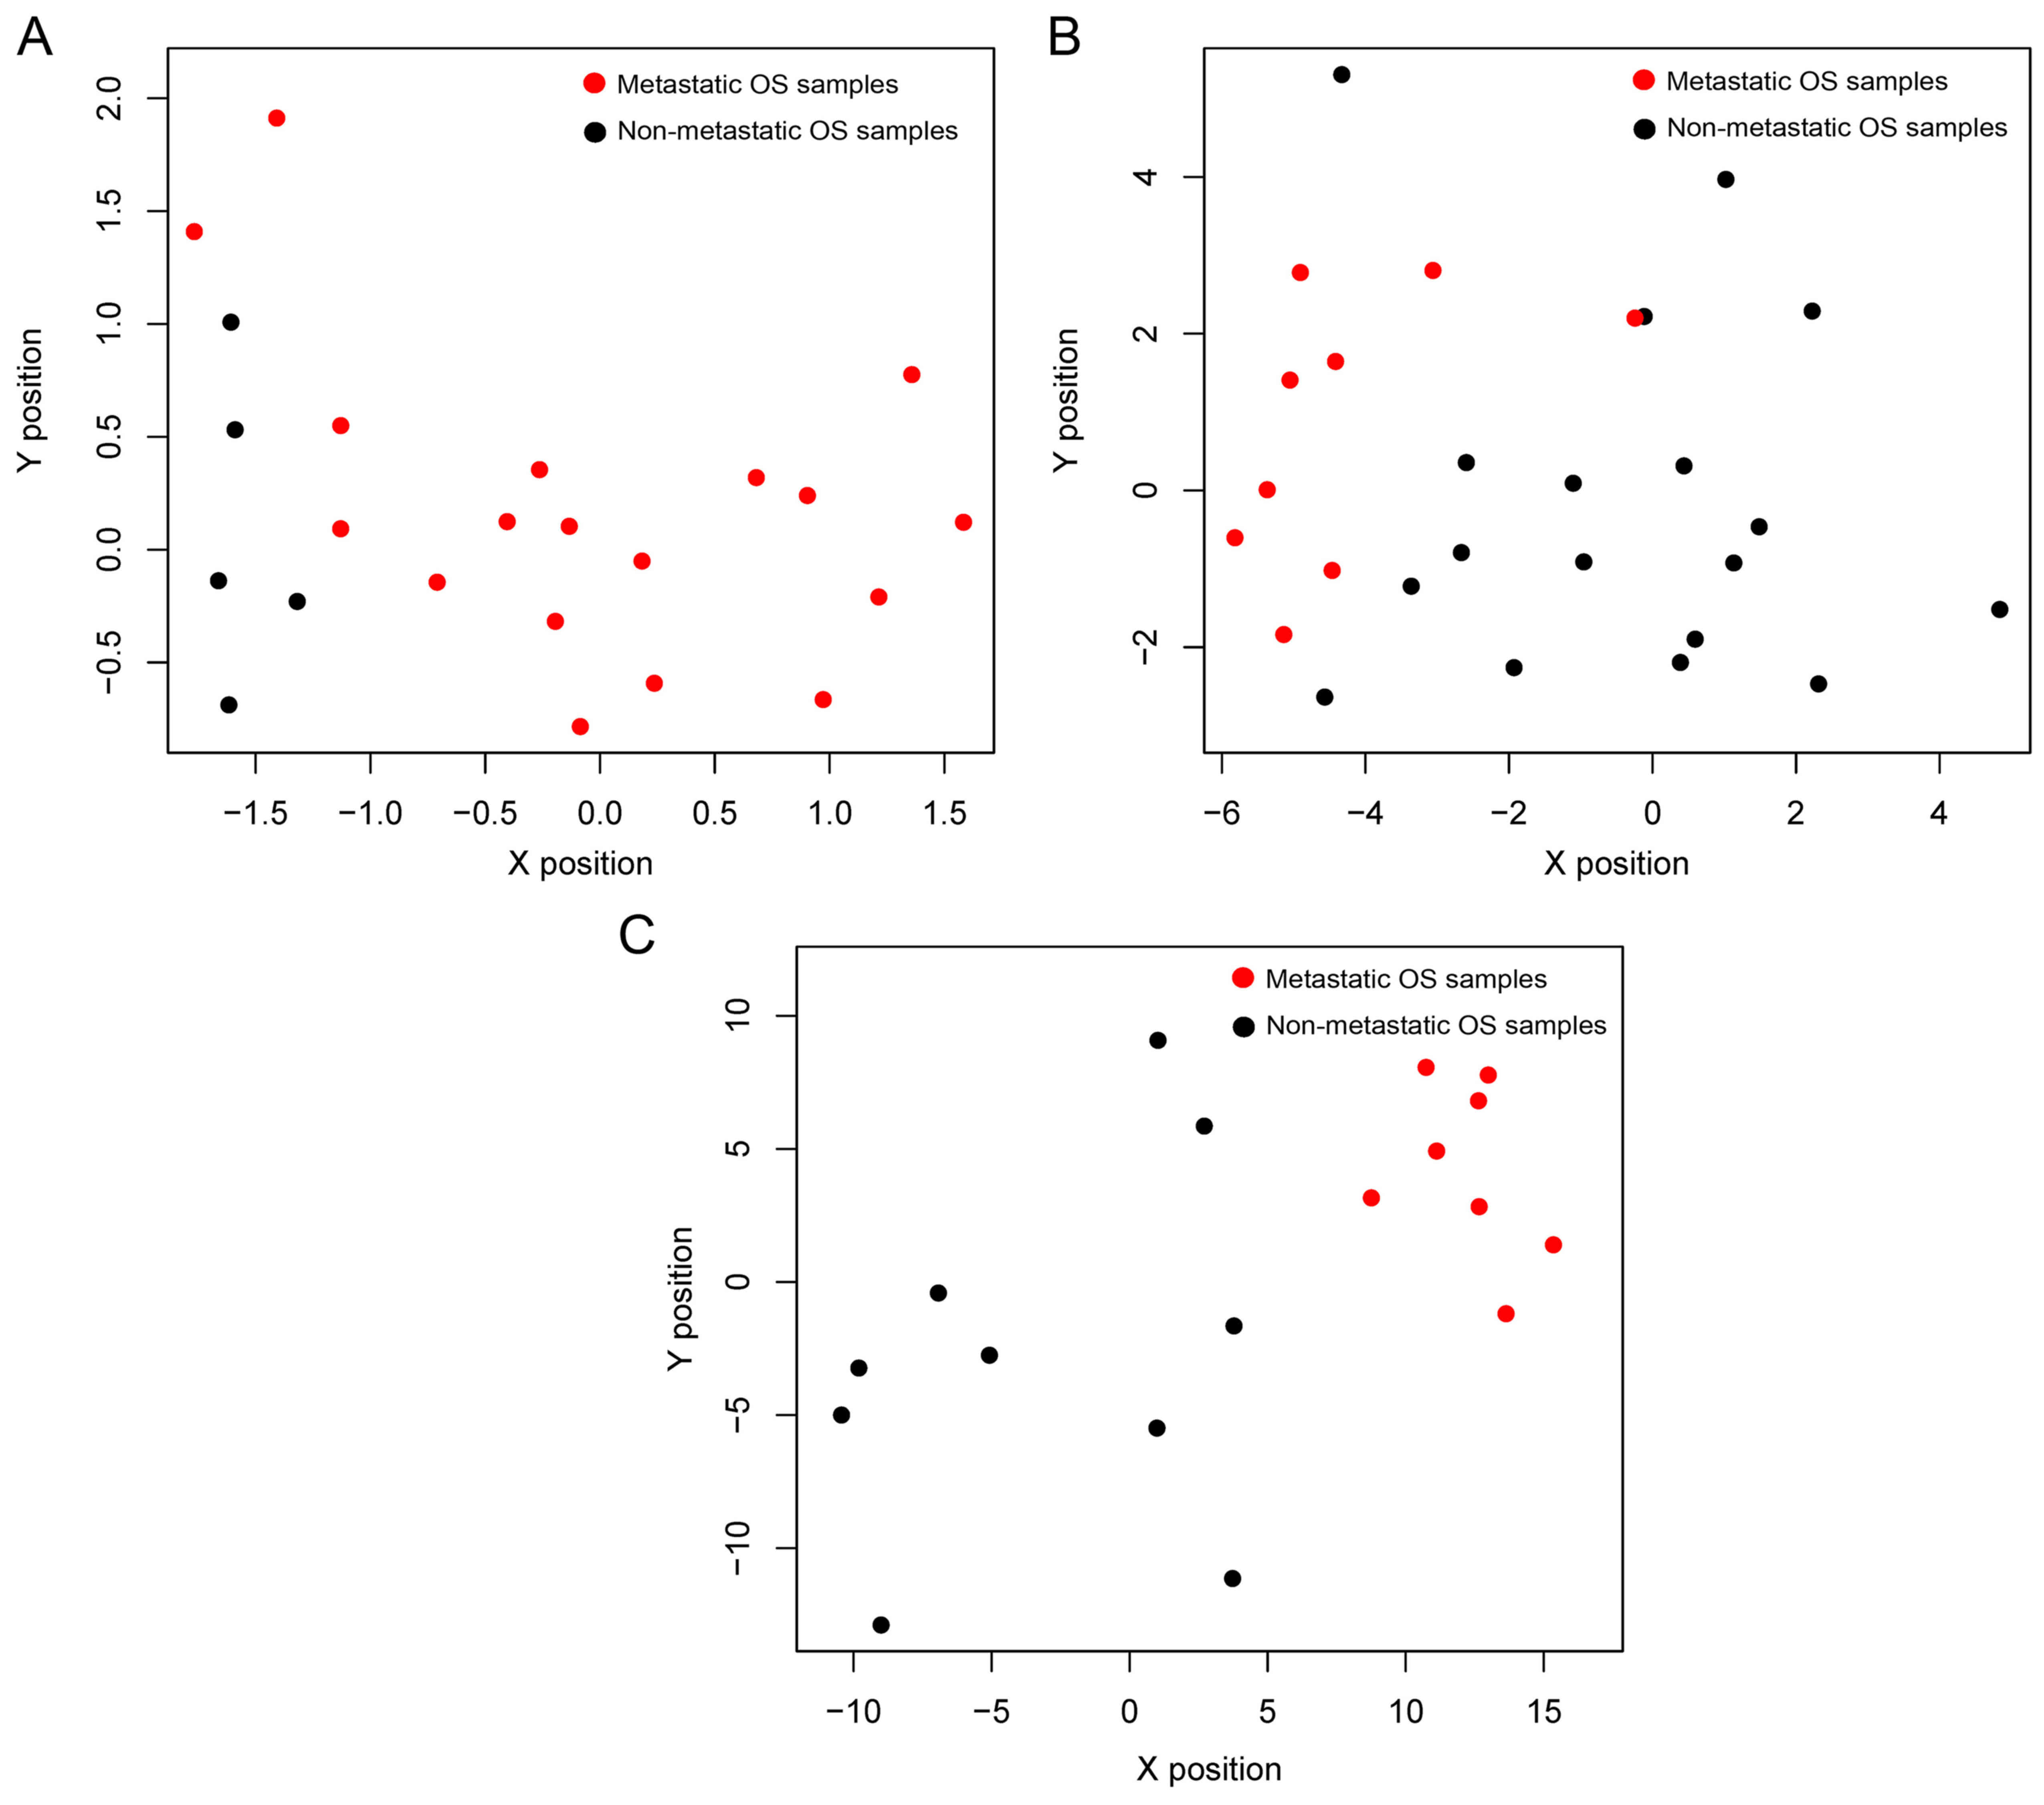
The SVM classifier was validated using the other 3
independent datasets GSE32981, GSE14827 and GSE14359. The
accuracies were high in all datasets, with a prediction accuracy of
100% in dataset GSE32981 (Fig.
6A) and GSE14359 (Fig. 6C)
and 92.6% in dataset GSE14827 (Fig.
6B). Two non-metastatic OS samples were predicted wrong as
metastatic samples in dataset GSE14827. The accuracy, sensitivity,
specificity, PPV, NPV and AUC are listed in Table V.
| Table VPrediction results of the SVM
classifier. |
Table V
Prediction results of the SVM
classifier.
| Datasets | No. of samples | Prediction
error | Accuracy | Sensitivity | Specificity | PPV | NPV | AUROC |
|---|
| GSE21257 | 53 | 0 | 1.000 | 1.000 | 1.000 | 1.000 | 1.000 | 1.000 |
| GSE32981 | 23 | 0 | 1.000 | 1.000 | 1.000 | 1.000 | 1.000 | 1.000 |
| GSE14827 | 27 | 2 | 0.926 | 1.000 | 0.889 | 0.818 | 1.000 | 0.931 |
| GSE14359 | 18 | 0 | 1.000 | 1.000 | 1.000 | 1.000 | 1.000 | 1.000 |
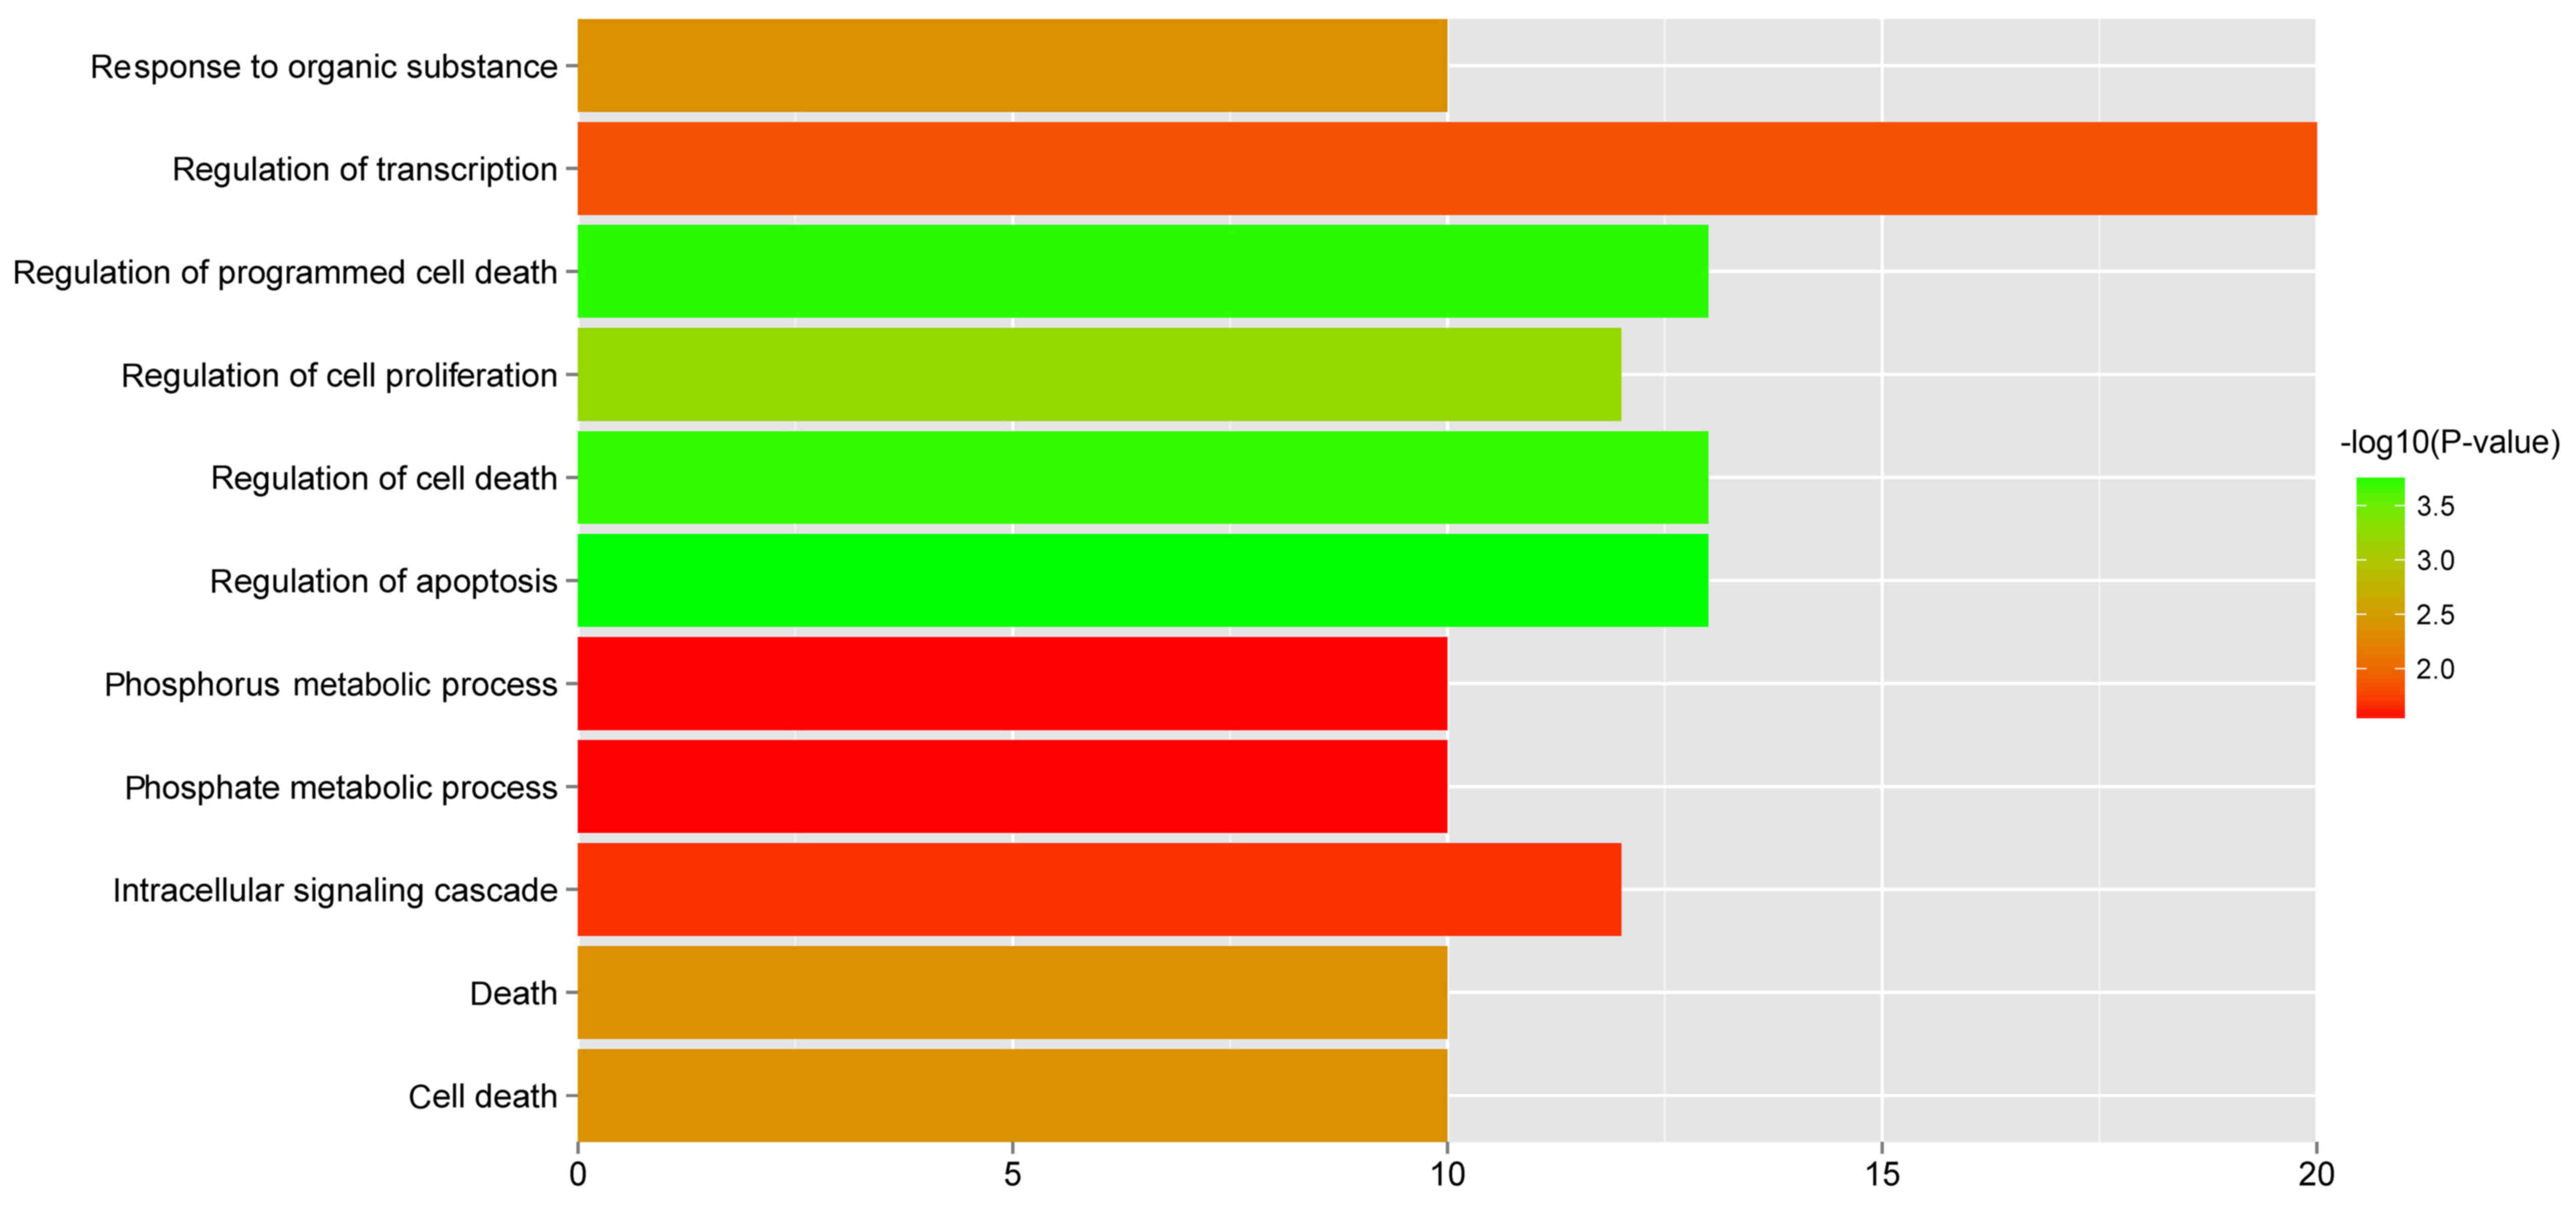
Over-represented biological pathways
A total of 11 GO biological pathways (Fig. 7) and 5 KEGG pathways (Table VI) were identified in the 64
featured genes. Some pathways were significantly over-represented
in the featured genes, such as regulation of cell proliferation,
regulation of apoptosis, pathways in cancer, regulation of actin
cytoskeleton and the TGF-β signaling pathway.
| Table VIKEGG pathways significantly
over-represented in the 64 featured genes. |
Table VI
KEGG pathways significantly
over-represented in the 64 featured genes.
| KEGG pathway | P-value | Genes |
|---|
| hsa05200:pathways
in cancer | 1.28E−02 | CCNE1, CRKL,
EP300, CASP9, BRCA2, BCL2L1, FN1, APC |
| hsa04110:cell
cycle | 1.61E−02 | CCNE1, EP300,
E2F4, CCND3, CDC25A |
| hsa04360:axon
guidance | 1.78E−02 | EPHB6, EFNA1,
EFNB2, EPHA2, EPHB2 |
| hsa04810:regulation
of actin cytoskeleton | 2.54E−02 | GIT1, CRKL,
BAIAP2, BDKRB2, FN1, APC |
| hsa04350:TGF-β
signaling pathway | 3.03E−02 | AMH, EP300,
E2F4, BMPR2 |
Discussion
Four gene expression datasets were included in this
meta-analysis. A total of 353 DEGs were identified and a PPI
network including 164 nodes, as well as 272 edges was constructed.
The top 64 featured genes ranked by BC were included in the SVM
classifier. The prediction accuracies for the 4 datasets were 100,
100, 92.6 and 100%, respectively. Pathways, such as regulation of
cell proliferation, regulation of apoptosis, pathways in cancer,
regulation of actin cytoskeleton and the TGF-β signaling pathway
were significantly over-represented in the 64 featured genes. These
pathways were closely associated with cancer and cell mobility.
In the featured genes, some have been implicated in
the metastasis of OS. CD44 molecule (CD44) is a cell-surface
glycoprotein involved in cell-cell interactions, cell adhesion and
migration. It participates in a wide variety of cellular functions,
including metastasis. Kim et al reported that the expression
of CD44 isoforms correlated with the metastatic potential of OS
(24). Zhao et al found
that miR-34a inhibited the metastasis of OS cells by suppressing
the expression of CD44 (25). EPH
receptor A2 (EPHA2) is involved in the mitogenic signaling
pathway and it may stimulate OS metastasis (26). EPHA2 was identified as a
receptor for the targeted drug delivery of OS (27). High mobility group nucleosomal
binding domain 2 (HMGN2) exhibits inhibitory effects on
growth and migration of human OS cell lines (28). Yang et al found that
recurrent LDL receptor-related protein 1 (LRP1)-small
nuclear ribonucleoprotein U11/U12 subunit 25 (SNRNP25) and
potassium calcium-activated channel subfamily M regulatory β
subunit 4 (KCNMB4)-cyclin D3 (CCND3) fusion genes
promoted tumor cell motility in human OS (29). The overexpression of cyclin E1
(CCNE1) has been observed in many tumors. The inhibition of
CCNE1 suppresses the proliferation of OS cells (30).
Several featured genes were not reported in the
metastasis of OS, while they have been previously shown to be
involved in the metastasis of other types of cancer. Histone
deacetylase 6 (HDAC6) has been shown to be involved in the
metastasis of melanoma cells (31) and oral squamous cell carcinoma
(OSCC) cells (32). The reduced
expression of EPH receptor B2 (EPHB2) parallels invasion and
metastasis in colorectal tumors (33). The overexpression of the
EPHA4 gene and the reduced expression of the EPHB2
gene correlate with liver metastasis in colorectal cancer (34). Cell division cycle 25A
(CDC25A) regulates matrix metalloprotease 1 through Foxo1
and mediates the metastasis of breast cancer cells (35). Their roles in OS metastasis remain
to be disclosed with further research.
Hypermethylated ESR1 gene promoter in serum
can be used as a candidate biomarker for the diagnosis and
treatment efficacy of breast cancer metastasis (36). The aberrant DNA methylation of
ESR1 may be a useful as prognostic indicator in OS (37). We speculated that it may be
involved in OS metastasis. Further studies may provide potential
diagnostic biomarkers or therapeutic targets for OS.
In conclusion, in this study, an SVM classifier of
high accuracy was obtained with 64 featured genes. Several critical
genes associated with OS metastasis were also revealed, some of
which are not previously implicated in OS. The findings based on
bioinformatics analysis should be further confirmed by experimental
studies.
These findings may promote the development of
genetic diagnostic methods and may enhance our understanding of the
molecular mechanisms underlying the metastais of OS.
Acknowledgments
This study was supported by the National Natural
Science Foundation of China (Grant No. 81472071 and Grant No.
81772445).
References
|
1
|
Jaffe N, Bruland OS and Bielack S:
Pediatric and Adolescent Osteosarcoma. Springer; pp. 152Berlin:
2010
|
|
2
|
Hou CH, Lin FL, Tong KB, Hou SM and Liu
JF: Transforming growth factor alpha promotes osteosarcoma
metastasis by ICAM-1 and PI3K/Akt signaling pathway. Biochem
Pharmacol. 89:453–463. 2014. View Article : Google Scholar : PubMed/NCBI
|
|
3
|
Dong Y, Liang G, Yuan B, Yang C, Gao R and
Zhou X: MALAT1 promotes the proliferation and metastasis of
osteosarcoma cells by activating the PI3K/Akt pathway. Tumour Biol.
36:1477–1486. 2015. View Article : Google Scholar
|
|
4
|
Guo YS, Zhao R, Ma J, Cui W, Sun Z, Gao B,
He S, Han YH, Fan J, Yang L, et al: βig-h3 promotes human
osteosarcoma cells metastasis by interacting with integrin α2β1 and
activating PI3K signaling pathway. PLoS One. 9:e902202014.
View Article : Google Scholar
|
|
5
|
Liao D, Zhong L, Duan T, Zhang RH, Wang X,
Wang G, Hu K, Lv X and Kang T: Aspirin suppresses the growth and
metastasis of osteosarcoma through the NF-κB pathway. Clin Cancer
Res. 21:5349–5359. 2015. View Article : Google Scholar : PubMed/NCBI
|
|
6
|
Zhang P, Yang Y, Zweidler-McKay P and
Hughes DPM: Retraction: Critical role of notch signaling in
osteosarcoma invasion and metastasis. Clin Cancer Res.
19:5256–5257. 2013. View Article : Google Scholar : PubMed/NCBI
|
|
7
|
Guan G, Zhang Y, Lu Y, Liu L, Shi D, Wen
Y, Yang L, Ma Q, Liu T, Zhu X, et al: The HIF-1α/CXCR4 pathway
supports hypoxia-induced metastasis of human osteosarcoma cells.
Cancer Lett. 357:254–264. 2015. View Article : Google Scholar
|
|
8
|
Khanna C, Wan X, Bose S, Cassaday R, Olomu
O, Mendoza A, Yeung C, Gorlick R, Hewitt SM and Helman LJ: The
membrane-cytoskeleton linker ezrin is necessary for osteosarcoma
metastasis. Nat Med. 10:182–186. 2004. View
Article : Google Scholar : PubMed/NCBI
|
|
9
|
Ren L, Hong SH, Cassavaugh J, Osborne T,
Chou AJ, Kim SY, Gorlick R, Hewitt SM and Khanna C: The
actin-cytoskeleton linker protein ezrin is regulated during
osteosarcoma metastasis by PKC. Oncogene. 28:792–802. 2009.
View Article : Google Scholar
|
|
10
|
Wan X, Kim SY, Guenther LM, Mendoza A,
Briggs J, Yeung C, Currier D, Zhang H, Mackall C, Li WJ, et al:
Beta4 integrin promotes osteosarcoma metastasis and interacts with
ezrin. Oncogene. 28:3401–3411. 2009. View Article : Google Scholar : PubMed/NCBI
|
|
11
|
Long F, Cai X, Luo W, Chen L and Li K:
Role of aldolase A in osteosarcoma progression and metastasis: In
vitro and in vivo evidence. Oncol Rep. 32:2031–2037. 2014.
View Article : Google Scholar : PubMed/NCBI
|
|
12
|
Qu L and Liu B: Cyclooxygeanse-2 promotes
metastasis in osteosarcoma. Cancer Cell Int. 15:692015. View Article : Google Scholar : PubMed/NCBI
|
|
13
|
Su Y, Wagner ER, Luo Q, Huang J, Chen L,
He BC, Zuo GW, Shi Q, Zhang BQ, Zhu G, et al: Insulin-like growth
factor binding protein 5 suppresses tumor growth and metastasis of
human osteosarcoma. Oncogene. 30:3907–3917. 2011. View Article : Google Scholar : PubMed/NCBI
|
|
14
|
Namløs HM, Kresse SH, Müller CR, Henriksen
J, Holdhus R, Sæter G, Bruland OS, Bjerkehagen B, Steen VM and
Myklebost O: Global gene expression profiling of human
osteosarcomas reveals metastasis-associated chemokine pattern.
Sarcoma. 2012:6390382012. View Article : Google Scholar : PubMed/NCBI
|
|
15
|
Odagiri H, Kadomatsu T, Endo M, Masuda T,
Morioka MS, Fukuhara S, Miyamoto T, Kobayashi E, Miyata K, Aoi J,
et al: The secreted protein ANGPTL2 promotes metastasis of
osteosarcoma cells through integrin α5β1, p38 MAPK, and matrix
metalloproteinases. Sci Signal. 7:ra72014. View Article : Google Scholar
|
|
16
|
Endo-Munoz L, Cumming A, Rickwood D,
Wilson D, Cueva C, Ng C, Strutton G, Cassady AI, Evdokiou A,
Sommerville S, et al: Loss of osteoclasts contributes to
development of osteosarcoma pulmonary metastases. Cancer Res.
70:7063–7072. 2010. View Article : Google Scholar : PubMed/NCBI
|
|
17
|
Buddingh EP, Kuijjer ML, Duim RA, Bürger
H, Agelopoulos K, Myklebost O, Serra M, Mertens F, Hogendoorn PC,
Lankester AC, et al: Tumor-infiltrating macrophages are associated
with metastasis suppression in high-grade osteosarcoma: A rationale
for treatment with macrophage activating agents. Clin Cancer Res.
17:2110–2119. 2011. View Article : Google Scholar : PubMed/NCBI
|
|
18
|
Smyth GK: Limma: Linear Models for
Microarray Data. Bioinformatics and Computational Biology Solutions
Using R and Bioconductor. Gentleman R, Carey VJ, Huber W, Irizarry
RA and Dudoit S: Springer; New York, NY: pp. 397–420. 2005,
View Article : Google Scholar
|
|
19
|
Wang X, Kang DD, Shen K, Song C, Lu S,
Chang LC, Liao SG, Huo Z, Tang S, Ding Y, et al: An R package suite
for microarray meta-analysis in quality control, differentially
expressed gene analysis and pathway enrichment detection.
Bioinformatics. 28:2534–2536. 2012. View Article : Google Scholar : PubMed/NCBI
|
|
20
|
Chatr-Aryamontri A, Breitkreutz BJ,
Oughtred R, Boucher L, Heinicke S, Chen D, Stark C, Breitkreutz A,
Kolas N, O'Donnell L, et al: The BioGRID interaction database: 2015
update. Nucleic Acids Res. 43:D470–D478. 2015. View Article : Google Scholar :
|
|
21
|
Keshava Prasad TS, Goel R, Kandasamy K,
Keerthikumar S, Kumar S, Mathivanan S, Telikicherla D, Raju R,
Shafreen B, Venugopal A, et al: Human Protein Reference Database –
2009 update. Nucleic Acids Res. 37:D767–D772. 2009. View Article : Google Scholar
|
|
22
|
Xenarios I, Rice DW, Salwinski L, Baron
MK, Marcotte EM and Eisenberg D: DIP: The database of interacting
proteins. Nucleic Acids Res. 28:289–291. 2000. View Article : Google Scholar
|
|
23
|
Smoot ME, Ono K, Ruscheinski J, Wang PL
and Ideker T: Cytoscape 2.8: New features for data integration and
network visualization. Bioinformatics. 27:431–432. 2011. View Article : Google Scholar :
|
|
24
|
Kim HS, Park YB, Oh JH, Jeong J, Kim CJ
and Lee SH: Expression of CD44 isoforms correlates with the
metastatic potential of osteosarcoma. Clin Orthop Relat Res.
396:184–190. 2002. View Article : Google Scholar
|
|
25
|
Zhao H, Ma B, Wang Y, Han T, Zheng L, Sun
C, Liu T, Zhang Y, Qiu X and Fan Q: miR-34a inhibits the metastasis
of osteosarcoma cells by repressing the expression of CD44. Oncol
Rep. 29:1027–1036. 2013. View Article : Google Scholar : PubMed/NCBI
|
|
26
|
Fritsche-Guenther R, Noske A, Ungethüm U,
Kuban RJ, Schlag PM, Tunn PU, Karle J, Krenn V, Dietel M and Sers
C: De novo expression of EphA2 in osteosarcoma modulates activation
of the mitogenic signalling pathway. Histopathology. 57:836–850.
2010. View Article : Google Scholar : PubMed/NCBI
|
|
27
|
Posthumadeboer J, Piersma SR, Pham TV, van
Egmond PW, Knol JC, Cleton-Jansen AM, van Geer MA, van Beusechem
VW, Kaspers GJ, van Royen BJ, et al: Surface proteomic analysis of
osteosarcoma identifies EPHA2 as receptor for targeted drug
delivery. Br J Cancer. 109:2142–2154. 2013. View Article : Google Scholar : PubMed/NCBI
|
|
28
|
Liang G, Xu E, Yang C, Zhang C, Sheng X
and Zhou X: Nucleosome-binding protein HMGN2 exhibits antitumor
activity in human SaO2 and U2-OS osteosarcoma cell lines. Oncol
Rep. 33:1300–1306. 2015. View Article : Google Scholar
|
|
29
|
Yang J, Annala M, Ji P, Wang G, Zheng H,
Codgell D, Du X, Fang Z, Sun B, Nykter M, et al: Recurrent
LRP1-SNRNP25 and KCNMB4-CCND3 fusion genes promote tumor cell
motility in human osteosarcoma. J Hematol Oncol. 7:762014.
View Article : Google Scholar : PubMed/NCBI
|
|
30
|
Wang J, Xu G, Shen F and Kang Y: miR-132
targeting cyclin E1 suppresses cell proliferation in osteosarcoma
cells. Tumour Biol. 35:4859–4865. 2014. View Article : Google Scholar : PubMed/NCBI
|
|
31
|
Liu J, Gu J, Feng Z, Yang Y, Zhu N, Lu W
and Qi F: Both HDAC5 and HDAC6 are required for the proliferation
and metastasis of melanoma cells. J Transl Med. 14:72016.
View Article : Google Scholar : PubMed/NCBI
|
|
32
|
Wang XC, Ma Y, Meng PS, Han JL, Yu HY and
Bi LJ: miR-433 inhibits oral squamous cell carcinoma (OSCC) cell
growth and metastasis by targeting HDAC6. Oral Oncol. 51:674–682.
2015. View Article : Google Scholar : PubMed/NCBI
|
|
33
|
Guo DL, Zhang J, Yuen ST, Tsui WY, Chan
AS, Ho C, Ji J, Leung SY and Chen X: Reduced expression of EphB2
that parallels invasion and metastasis in colorectal tumours.
Carcinogenesis. 27:454–464. 2006. View Article : Google Scholar
|
|
34
|
Oshima T, Akaike M, Yoshihara K, Shiozawa
M, Yamamoto N, Sato T, Akihito N, Nagano Y, Fujii S, Kunisaki C, et
al: Overexpression of EphA4 gene and reduced expression of EphB2
gene correlates with liver metastasis in colorectal cancer. Int J
Oncol. 33:573–577. 2008.PubMed/NCBI
|
|
35
|
Feng X, Wu Z, Wu Y, Hankey W, Prior TW, Li
L, Ganju RK, Shen R and Zou X: Cdc25A regulates matrix
metalloprotease 1 through Foxo1 and mediates metastasis of breast
cancer cells. Mol Cell Biol. 31:3457–3471. 2011. View Article : Google Scholar : PubMed/NCBI
|
|
36
|
Zurita M, Lara PC, del Moral R, Torres B,
Linares-Fernández JL, Arrabal SR, Martínez-Galán J, Oliver FJ and
Ruiz de Almodóvar JM: Hypermethylated 14-3-3-σ and ESR1 gene
promoters in serum as candidate biomarkers for the diagnosis and
treatment efficacy of breast cancer metastasis. BMC Cancer.
10:2172010. View Article : Google Scholar
|
|
37
|
Sonaglio V, de Carvalho AC, Toledo SR,
Salinas-Souza C, Carvalho AL, Petrilli AS, de Camargo B and Vettore
AL: Aberrant DNA methylation of ESR1 and 14ARF genes could be
useful as prognostic indicators in osteosarcoma. Onco Targets Ther.
6:713–723. 2013.
|