Introduction
Lung cancer is the leading cause of
cancer-associated mortality worldwide, with an estimated 224,390
newly diagnosed cases and a mortality rate of 158,080 in the United
States in 2016 (1). The prognosis
of patients with lung cancer has been demonstrated to be associated
with stage at diagnosis, and the survival rate for patients at
early stages I and II is generally substantially higher, compared
with those at advanced stages III and IV (2,3).
Therefore, several studies have been performed to attempt to
identify diagnostic biomarkers, which may assist in distinguishing
early-stage from advanced-stage lung cancer in order to plan
suitable therapeutic strategies for improving prognosis (4,5).
The discrimination of stage I and II lung cancer is also clinically
meaningful as patients with stage I or II have different
sucseptibilities to the development of distant metastases and
chance of succumbing to mortality within 5 years (2,3).
However, few studies have been performed on the further
discrimination of stage I and II lung cancer.
Lung cancer consists of two major types, and
non-small cell lung cancer (NSCLC) is the most common form,
accounting for ~85% of lung cancer cases. NSCLC can be further
divided into three subtypes: Adenocarcinoma (40%), squamous
carcinoma (40%) and large-cell cancer (20%). Currently, the
majority of studies on the identification of gene signatures for
staging and prognosis have been focused on NSCLC (6–8)
and its adenocarcinoma subtype (9,10).
However, there have been fewer reports specific for lung squamous
carcinoma (11,12).
The aim of the present study was to perform
screening of a gene expression signature for the discrimination and
predicting the prognosis of stage I and II lung squamous carcinoma
by performing a meta-analysis of microarray datasets. The results
of the meta-analysis may increase the statistical power and improve
the reliability of investigations, compared with single study
analysis (13).
Materials and methods
Microarray data collection and
preprocessing
The Gene Expression Omnibus (GEO) database at the
National Center for Biotechnology Information (http://www.ncbi.nlm.nih.gov/geo/) was used to
retrieve expression profile datasets of human lung squamous
carcinoma. The inclusion criteria were as follows: i) mRNA
expression profiles; ii) lung cancer tissues of patients with lung
squamous carcinoma; iii) specific pathological stage I and II; and
iv) number of samples >50. Finally, seven microarray datasets
were obtained, including GSE43580, GSE50081, GSE42127, GSE41271,
GSE17710, GSE68793 and GSE33532 (Table I).
 | Table IGeneral information of included
expression profiles. |
Table I
General information of included
expression profiles.
| GEO accession | Chip | Probe number | Sample size | Stage I | Stage II |
|---|
| GSE43580 | HG-U133_Plus_2 | 54,676 | 73 | 34 | 39 |
| GSE50081 | HG-U133_Plus_2 | 54,676 | 43 | 27 | 16 |
| GSE42127 | Illumina
HumanWG-6 | 48,803 | 33 | 23 | 10 |
| GSE41271 | Illumina
HumanWG-6 | 48,803 | 48 | 31 | 17 |
| GSE17710 | Agilent-UNC | 33,421 | 53 | 34 | 19 |
| GSE68793 | HT_HG-U133A | 22,277 | 101 | 70 | 31 |
| GSE33532 | HG-U133_Plus_2 | 25,906 | 16 | 8 | 8 |
The raw data (CEL files) of GSE43580, GSE50081,
GSE68793 and GSE33532 were downloaded from the Affymetrix Human
Genome U133 Plus 2.0 Array platform (https://www.ncbi.nlm.nih.gov/geo/query/acc.cgi?acc=GPL570).
Background correction (MAS 5.0), normalization (quantile),
log2-transformation and median polish summarization were
then performed by using the robust multichip average algorithm
(14) implemented in the affy
package from R/Bioconductor (http://www.bioconductor.org/packages/release/bioc/html/affy.html).
The expression value data (TXT files) of the other three microarray
datasets (GSE42127, GSE41271 and GSE17710) were directly downloaded
from their corresponding platforms. The probe IDs were converted
into gene symbols according to the annotation files. The probes
without gene symbols were filtered and the average expression value
of the probes was calculated as the expression value for the gene
with multiple probes, followed by data normalization using the
Linear Models for Microarray Analysis package (15) in R (http://www.R-project.org).
Meta-analysis of multiple microarray
datasetes for screening DEGs
In order to obtain more reliable genes associated
with the stage of lung squamous carcinoma, a meta-analysis of the
above seven microarray datasets was performed as previously
described (16). The MetaQC
package in R was used to eliminate the bias among datasets
downloaded from different platforms by filtering out low-quality
studies. This procedure provided six quantitative quality control
measures, including the internal quality control (IQC, homogeneity
of coexpression structure across studies), external quality control
(EQC, consistency of coexpression information with pathway
database), accuracy quality control (AQCg and AQCp, accuracy of
differentially expressed gene and enriched pathway detection,
respectively), and consistency quality control (CQCg and CQCp,
consistency of differentially expressed gene and enriched pathway
ranking, respectively) (17). In
addition, the principal component analysis and standardized mean
rank summary score were applied to assist in the identification of
problematic studies (17). The
datasets of high quality were screened for identification of DEGs
using the MetaDE. ES algorithm of MetaDE package in R (18). The thresholds of homogeneity were
set as tau2=0 and Qpval >0.05. A false discovery rate
(FDR) of <0.05 was considered as the cut-off criterion for
identifying DEGs between stage I and II of lung squamous carcinoma
samples.
Protein-protein interaction (PPI)
network-based prioritization of DEGs
Cytoscape is software for biological network
visualization and analysis (19),
in which the PPIs are downloaded from acknowledged Human Protein
Reference Database (http://www.hprd.org) (20). The PPI network for the identified
DEGs was constructed using Cytoscape software 3.5.0 to investigate
the DEGs crucial for the development of lung squamous carcinoma. In
addition, the non-differentially expressed genes, which interacted
with at least 10 DEGs were included in this PPI network. The
signaling pathways enrichment analysis was performed for the genes
in the constructed PPI network with the criterion of P<0.05.
Betweenness centrality (BC) is one of the important
topological characteristics of the PPI network for determining the
highly connected nodes (hubs). BC is defined as the fraction of
shortest paths, which pass through a node (v), and nodes
with BC values closer to 1 have a higher hub degree. BC can be
calculated using the following equation:
Where σst is the total number of
shortest paths from node s to node t, and
σst (v) is the number of those paths that pass
through v.
Support vector machine (SVM) modeling and
classification accuracy evaluation
Using the top 100 genes ranked by the BC value, a
supervised SVM classifier was constructed with the e1071 package
for R under the default parameters (radial basis function kernel,
γ=0.5; cost=4; cross=10-fold) (21). Following screening of the optimal
combination of genes, which completely distinguished between stage
I or II lung squamous carcinoma samples by utilizing the dataset
with the maximum sample size as the training sets, its predictive
accuracy was computed using the other datasets as the test sets.
The effects of classification were evaluated based on five
parameters, including the accuracy, sensitivity, specificity,
positive predictive value, negative predictive value, and area
under the receiver operating curve (AUC).
Prognostic validation analysis
To further demonstrate the classification
reliability and prognostic potential of the optimal combination of
genes, an independent dataset, comprising 67 stage I lung squamous
carcinoma samples, 27 stage II lung squamous carcinoma samples and
survival rates was downloaded from The Cancer Genome Atlas (TCGA;
http://tcgadata.nci.nih.gov/tcga/;
TCGA_LUSC_exp_u133a level 3). Cox regression analysis was then
performed for this independent dataset using the R survival package
(22).
Pathway enrichment analysis
Kyoto Encyclopedia of Genes and Genomes (KEGG)
pathway enrichment analysis (http://www.kegg.jp/) was performed for the gene
signature with a two-tailed Fisher's exact test based on the
hypergeometric distribution. The P-value was adjusted for multiple
testing using the Benjamini and Hochberg approach (23), and adjusted P<0.05 was set as
the threshold.
Results
Identification of DEGs with microarray
meta-analysis
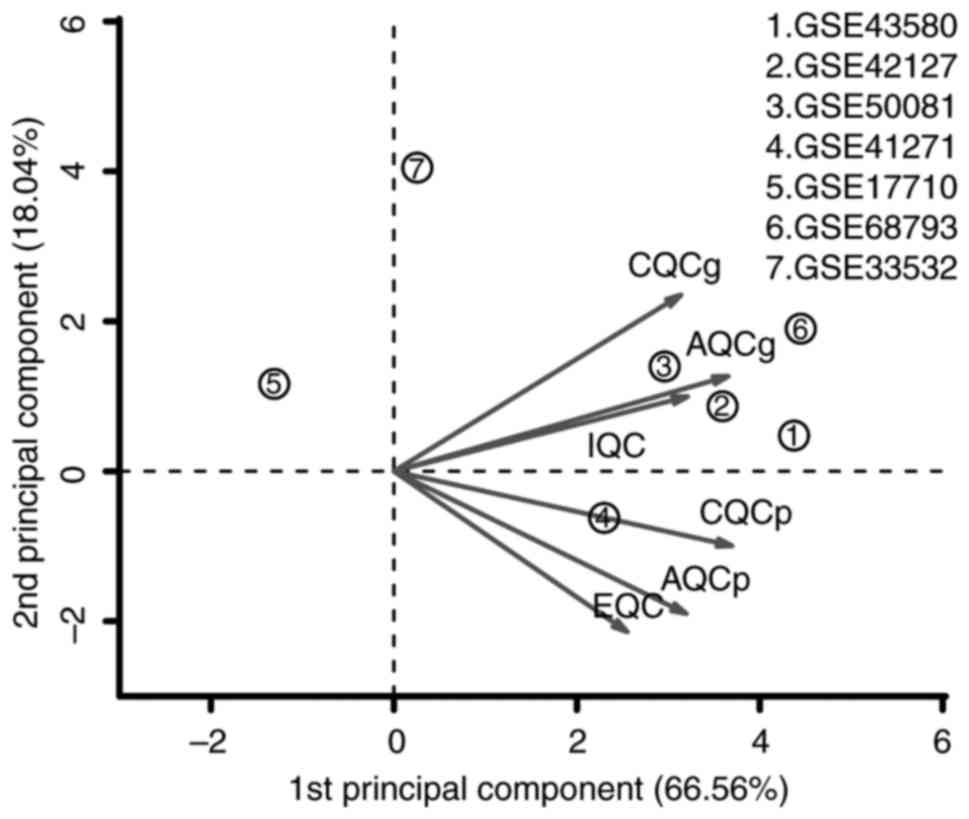
Among the seven microarray datasets downloaded from
the GEO, five datasets (GSE43580, GSE50081, GSE42127, GSE41271 and
GSE68793) were included in the meta-analysis for DEGs following
MetaQC analysis. The other two datasets (GSE17710 and GSE33532)
were excluded due to small sample size and lower quantitative
quality control scores (Table II
and Fig. 1). A total of 964 DEGs
between the stage I and II lung squamous carcinoma samples were
identified using the MetaDE.ES algorithm under the cut-off
criterion of FDR <0.05. The top 10 DEGs ranked by the FDR value
are listed in the Table
III.
| Table IIResults of QC measures and SMRs. |
Table II
Results of QC measures and SMRs.
| Study | IQC | EQC | CQCg | CQCp | AQCg | AQCp | SMR |
|---|
| GSE43580 | 4.52 | 2.00 | 307.65 | 133.86 | 32.71 | 82.01 | 2.17 |
| GSE42127 | 4.96 | 1.70 | 307.65 | 101.51 | 30.42 | 29.94 | 2.58 |
| GSE50081 | 5.42 | 2.00 | 307.65 | 60.02 | 29.49 | 29.18 | 3.33 |
| GSE41271 | 4.58 | 2.00 | 19.10 | 90.31 | 8.24 | 58.61 | 3.25 |
| GSE17710 | 0.23 | 0.37 | 0.09 | 1.89 | 0.05 | 0.36 | 6.83 |
| GSE68793 | 5.92 | 1.10 | 276.14 | 35.54 | 19.03 | 10.66 | 3.92 |
| GSE33532 | 1.79 | 5.00 | 0.59 | 1.69 | 0.52 | 3.21 | 5.67 |
| Table IIITop 10 differentially expressed genes
screened using microarray meta-analysis. |
Table III
Top 10 differentially expressed genes
screened using microarray meta-analysis.
| Symbol | P-value | FDR |
tau2 | Q-value | QP-value |
|---|
| PLP2 | 1.30E-10 | 1.59E-09 | 0 | 3.67E+00 | 4.52E-01 |
| EEF1G | 1.33E-10 | 1.62E-09 | 0 | 1.33E+00 | 8.56E-01 |
| RPL19 | 1.33E-10 | 1.62E-09 | 0 | 3.62E+00 | 4.60E-01 |
| C7 | 1.35E-10 | 1.64E-09 | 0 | 2.90E+00 | 5.75E-01 |
| MDH2 | 1.36E-10 | 1.66E-09 | 0 | 8.43E-01 | 9.33E-01 |
| IGFBP6 | 1.37E-10 | 1.67E-09 | 0 | 2.57E+00 | 6.33E-01 |
| OR12D2 | 1.39E-10 | 1.69E-09 | 0 | 2.12E+00 | 7.14E-01 |
|
SERPINI1 | 1.44E-10 | 1.74E-09 | 0 | 3.88E+00 | 4.23E-01 |
| TNS4 | 1.51E-10 | 1.81E-09 | 0 | 2.30E+00 | 6.82E-01 |
| KDR | 1.54E-10 | 1.84E-09 | 0 | 1.34E+00 | 8.54E-01 |
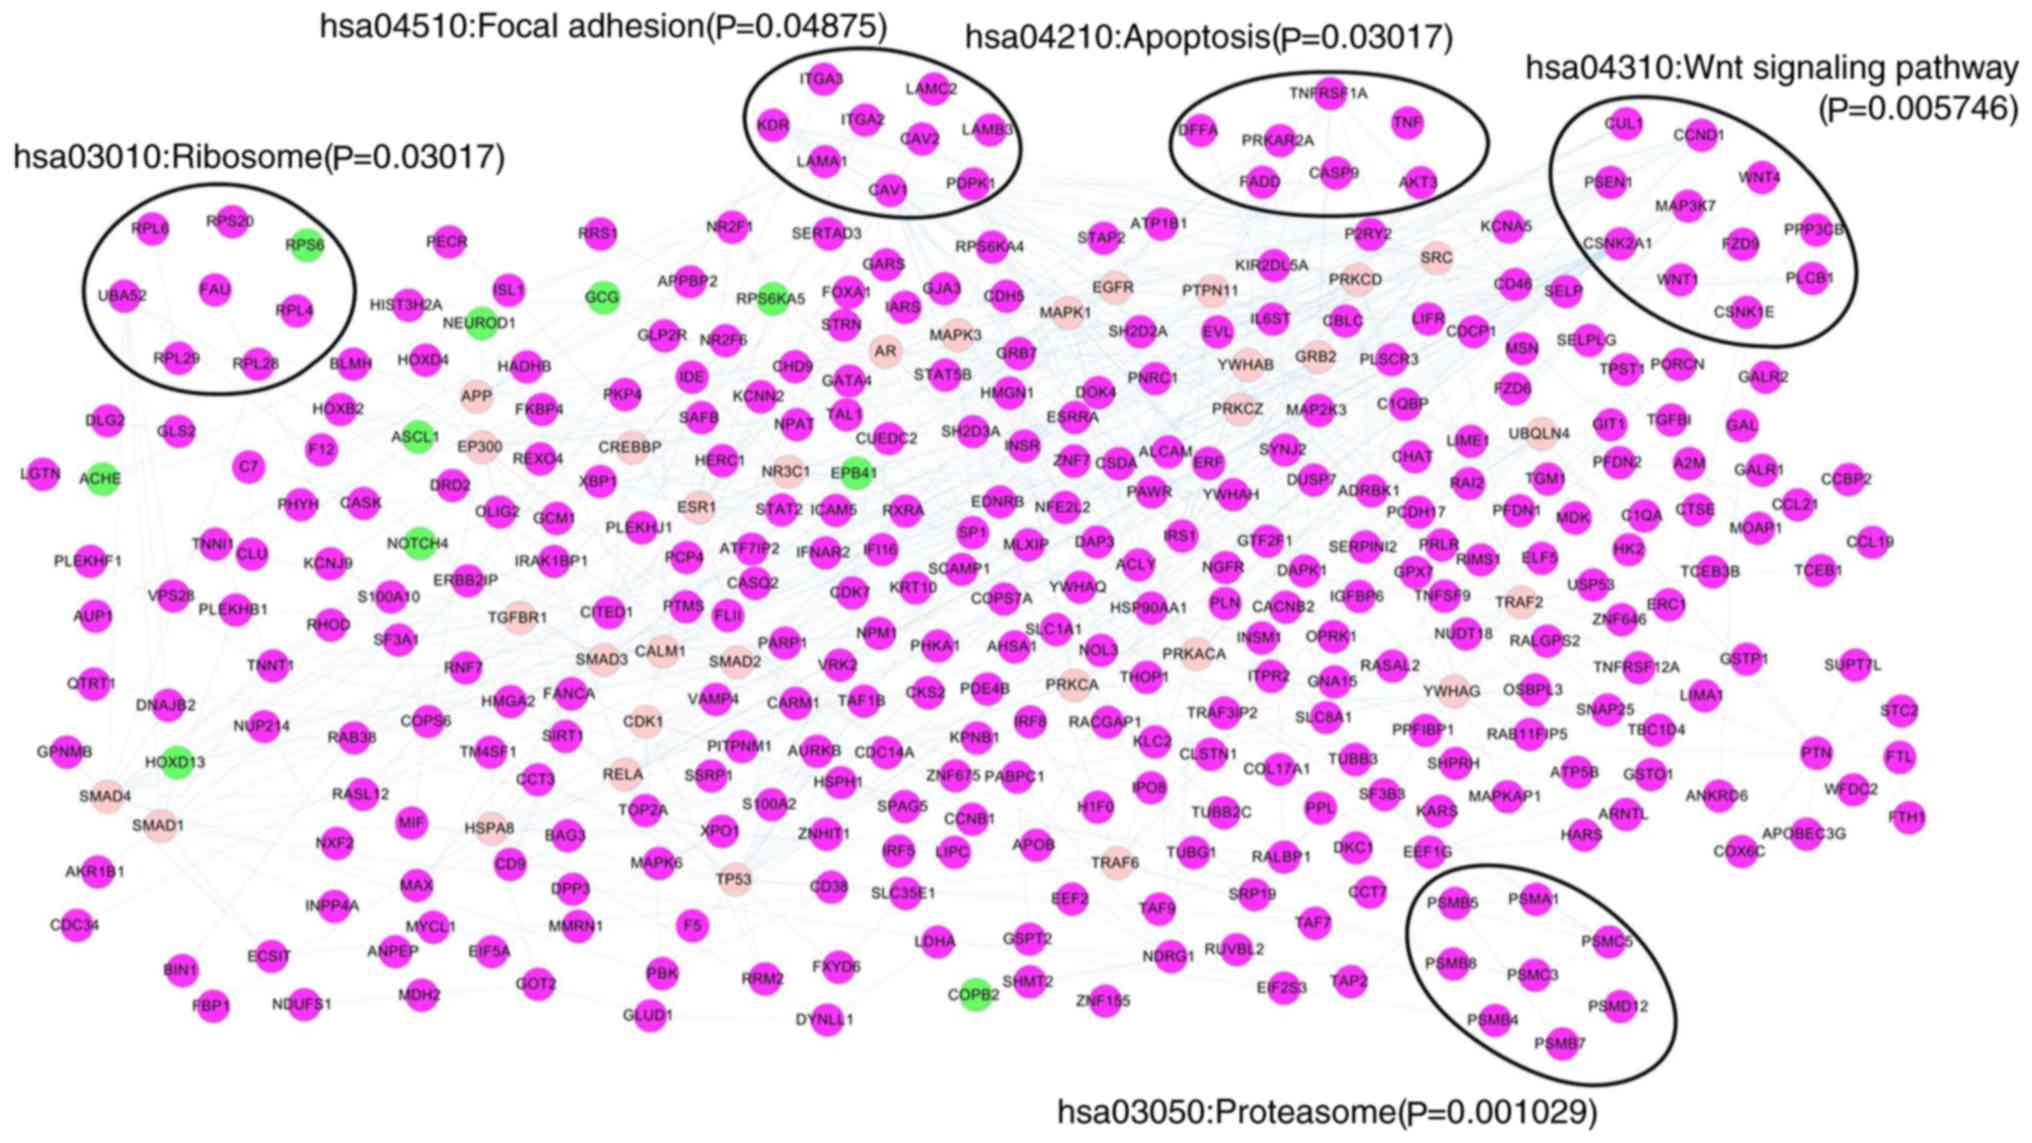
Prioritization of DEGs by PPI network
analysis
The PPI network was constructed by mapping the 964
DEGs into PPI data, consisting of 392 nodes (proteins) and 686
edges (interactions). A total of five pathways were significantly
enriched for genes in the constructed PPI network, including
proteasome, Wnt signaling pathway, ribosome, apoptosis and focal
adhesion (Fig. 2). The top 100
genes ranked by BC value were then selected as important genes in
order to construct an SVM classifier for distinguishing between
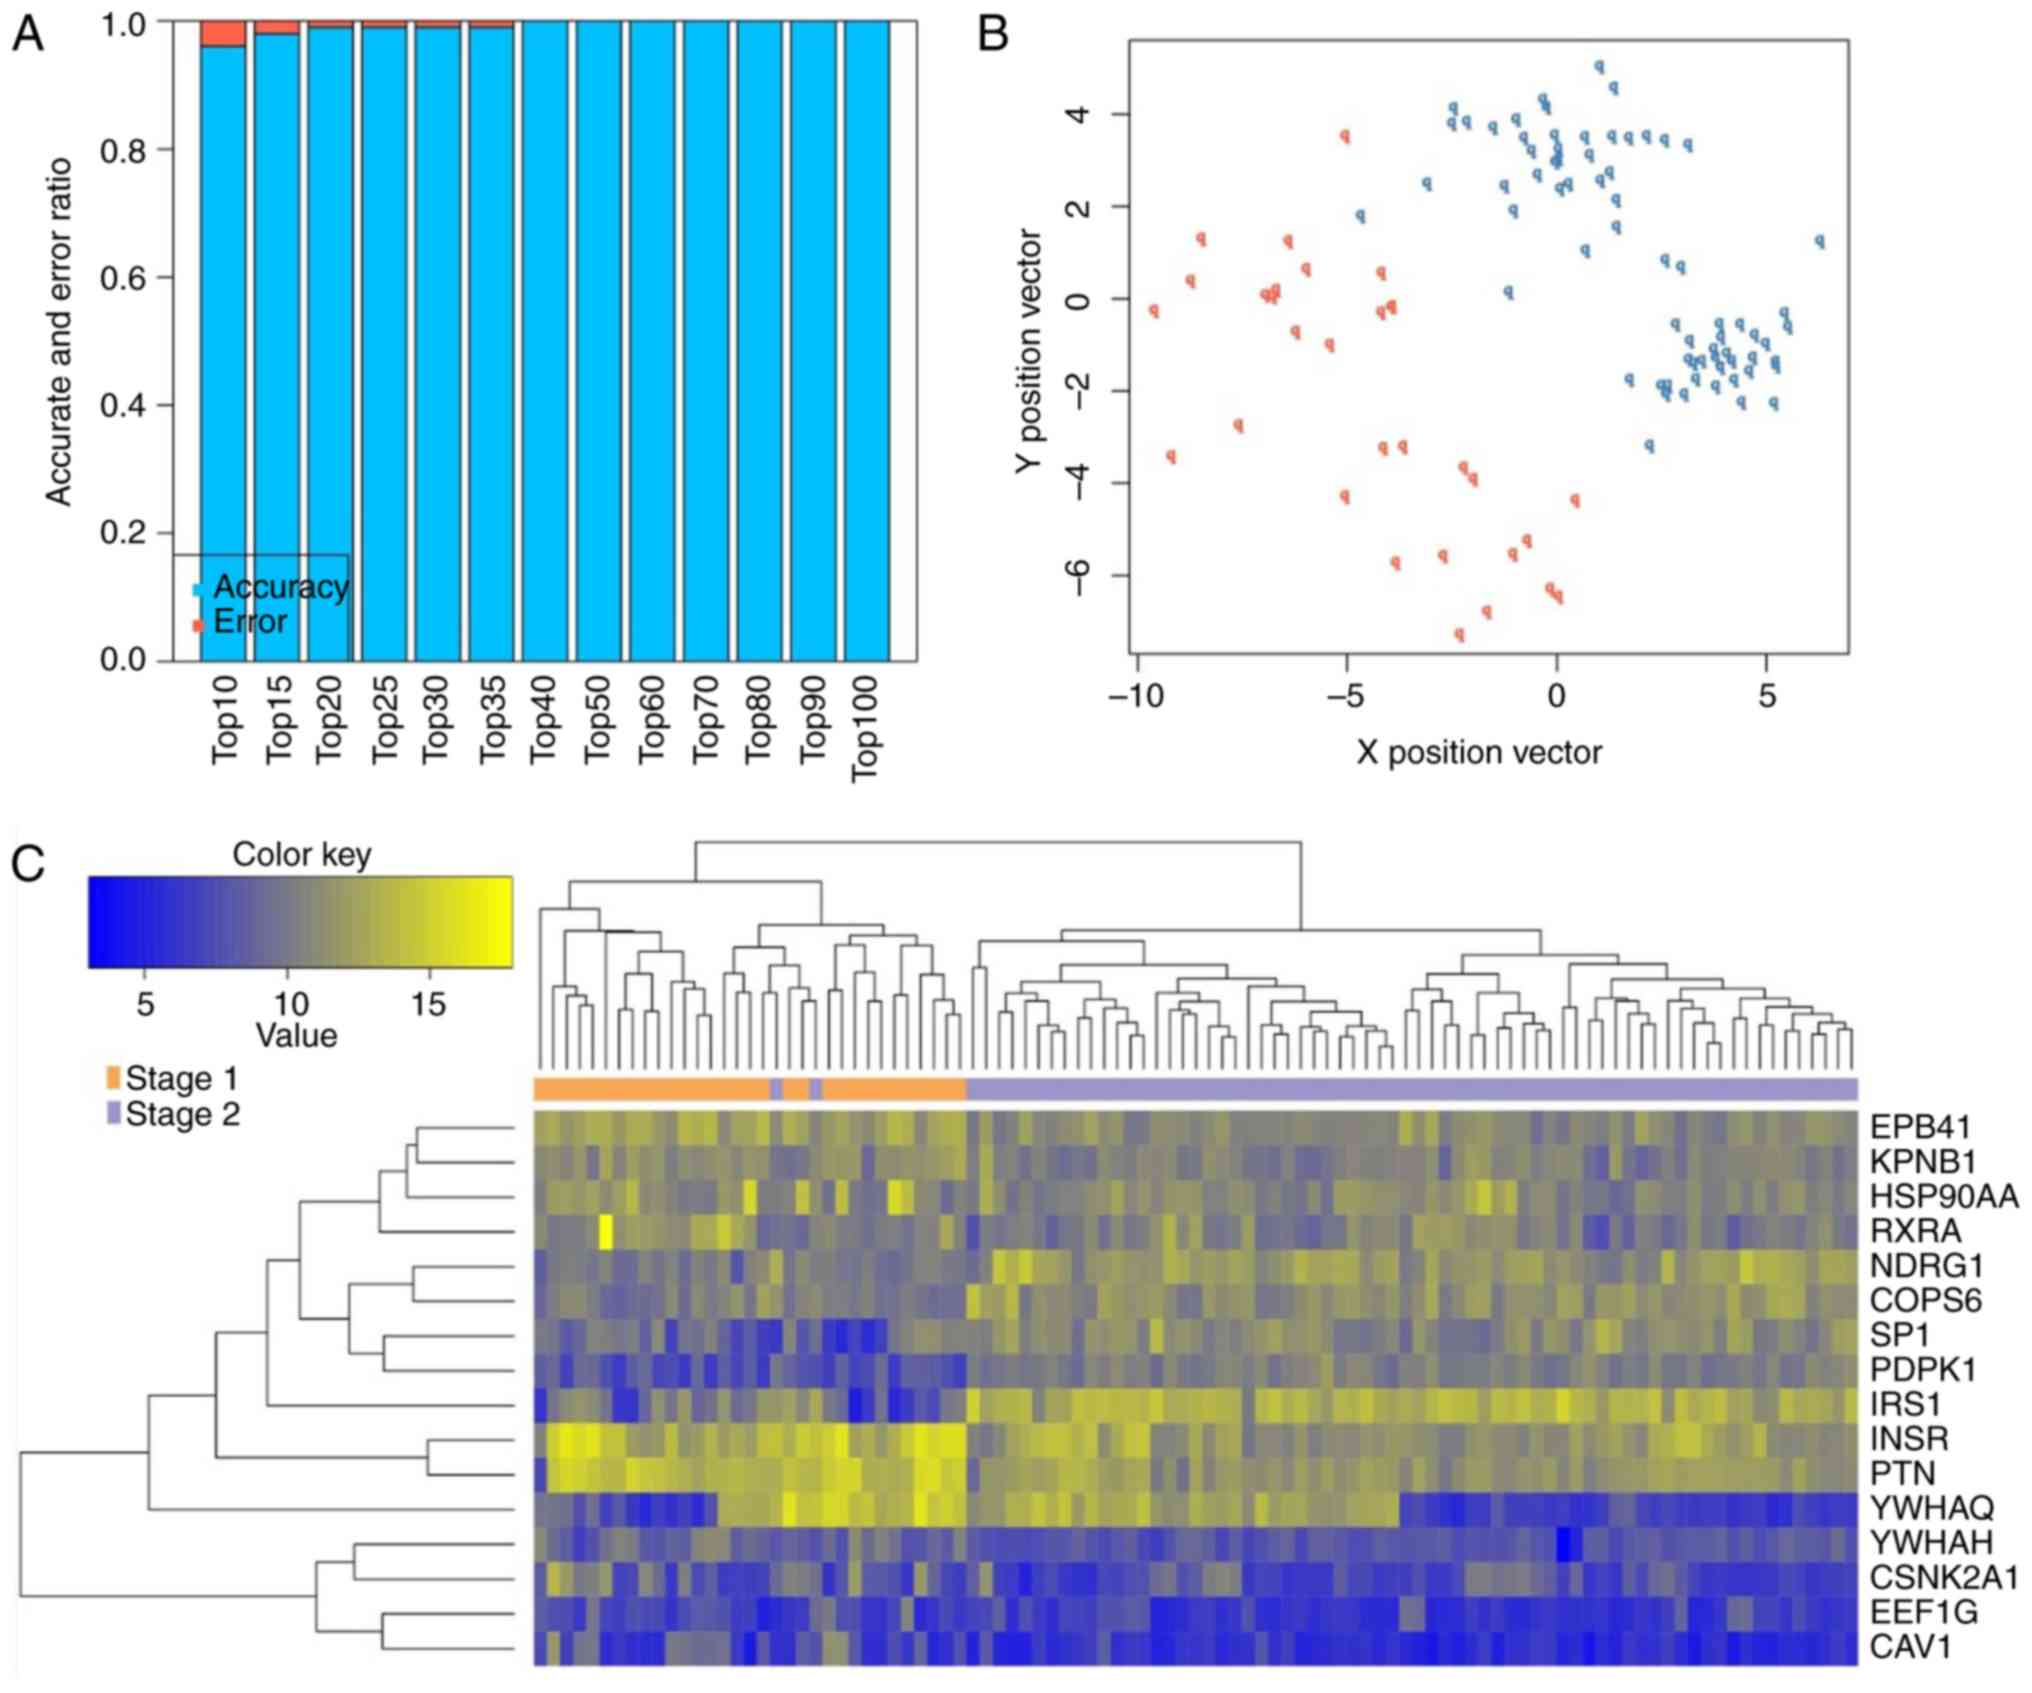
stage I and II lung squamous carcinoma samples (Table IV). Using the GSE68793 dataset as
a training set, the classification accuracy was found to gradually
improve with the increase in the number of DEGs. When the 16 DEGs,
comprising 15 upregulated DEGs in stage II lung squamous carcinoma,
including caveolin 1, (CAV1), eukaryotic translation
elongation factor 1γ (EEF1G), casein kinase 2α1
(CSNK2A1), tyrosine 3-monooxygenase/tryptophan
5-monooxygenase activation η (YWHAH), tyrosine
3-monooxygenase/tryptophan 5-monooxygenase activation θ
(YWHAQ), pleiotrophin (PTN), insulin receptor
(INSR), insulin receptor substrate 1 (IRS1),
3-phosphoinositide-dependent protein kinase-1 (PDPK1),
specificity protein 1 (Sp1), COP9 signalosome subunit 6
(COPS6), N-myc downstream regulated gene 1 (NDRG1),
retinoid X receptor α (RXRA), heat shock protein 90α A1
(HSP90AA1) and karyopherin subunit β1 (KPNB1) and one
downregulated DEG in stage II lung squamous carcinoma, namely
erythrocyte membrane protein band 4.1 (EPB41) were included
in the top 40 crucial genes, 100% accuracy was achieved (Fig. 3). It was also found that high
accuracy was obtained using the other four datasets (GSE43580:
94.5%, 69/73; GSE50081: 97.7%, 42/43; GSE41271: 97.9%, 47/48;
GSE42127: 100%, 33/33) as test sets (Table V).
| Table IVTop 10 genes with highest BC
scores. |
Table IV
Top 10 genes with highest BC
scores.
| Gene | BC score | Expression | P-value | FDR |
tau2 | Q-value | QP-value |
|---|
| PORCN | 0.6667 | 1 | 2.45E-02 | 3.26E-01 | 0 | 5.66E-01 | 9.67E-01 |
| WNT1 | 0.5000 | 1 | 1.44E-02 | 2.90E-01 | 0 | 2.25E+00 | 6.89E-01 |
| WNT4 | 0.5000 | 1 | 1.50E-02 | 2.95E-01 | 0 | 3.03E+00 | 5.54E-01 |
| CAV1 | 0.1587 | 1 | 2.00E-03 | 1.45E-01 | 0 | 7.05E-01 | 9.51E-01 |
| CSNK2A1 | 0.1452 | 1 | 4.00E-02 | 3.74E-01 | 0 | 2.39E+00 | 6.64E-01 |
|
HSP90AA1 | 0.1436 | 1 | 1.14E-02 | 2.66E-01 | 0 | 2.09E+00 | 7.20E-01 |
| YWHAG | 0.1087 | – | 9.95E-02 | 5.04E-01 | 7.70E-02 | 7.86E+00 | 9.70E-02 |
| TP53 | 0.0993 | – | 8.75E-01 | 9.68E-01 | 2.15E-01 | 1.47E+01 | 5.40E-03 |
| SP1 | 0.0966 | 1 | 1.70E-03 | 1.40E-01 | 0 | 3.41E+00 | 4.92E-01 |
| YWHAQ | 0.0861 | 1 | 1.01E-02 | 2.54E-01 | 0 | 2.08E+00 | 7.21E-01 |
| Table VSupport vector machine classifier
confirmation in test datasets. |
Table V
Support vector machine classifier
confirmation in test datasets.
| Dataset | Sample size
(n) | Correct rate,
% | Sensitivity | Specificity | PPV | NPV | AUROC |
|---|
| GSE43580 | 73 | 94.5 | 0.941 | 0.949 | 0.941 | 0.949 | 0.989 |
| GSE50081 | 43 | 97.7 | 1.000 | 0.936 | 0.964 | 1.000 | 0.991 |
| GSE41271 | 48 | 97.9 | 1.000 | 0.941 | 0.969 | 1.000 | 0.994 |
| GSE42127 | 33 | 100.0 | 1.000 | 1.000 | 1.000 | 1.000 | 1.000 |
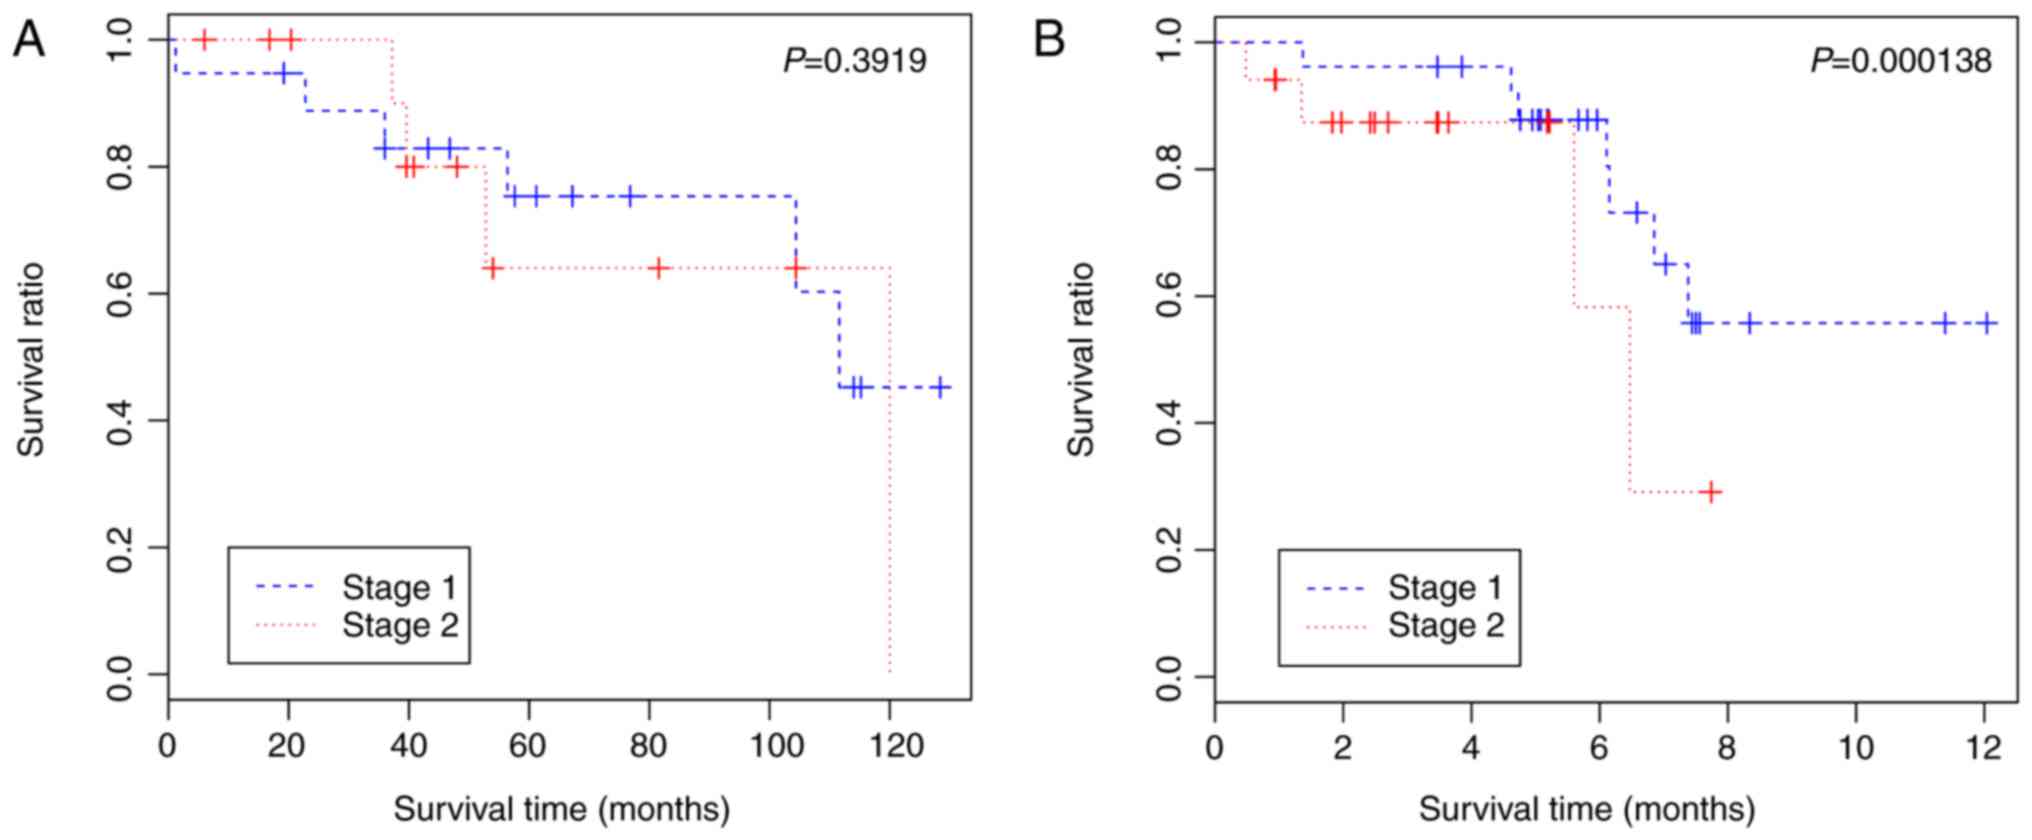
The present study also examined the prognostic value
of the 16 DEGs by performing survival analysis with the GSE42127,
GSE50081 and GSE41271 (Fig. 4)
datasets. The results indicated that patients with stage I lung
squamous carcinoma exhibited significantly higher survival rates,
compared with the patients with stage II lung squamous carcinoma in
GSE50081 (P=0.000138) using these 16 genes (Fig. 4B). Therefore, this classification
model may also be effective for clinical prognosis and treatment
guidance.
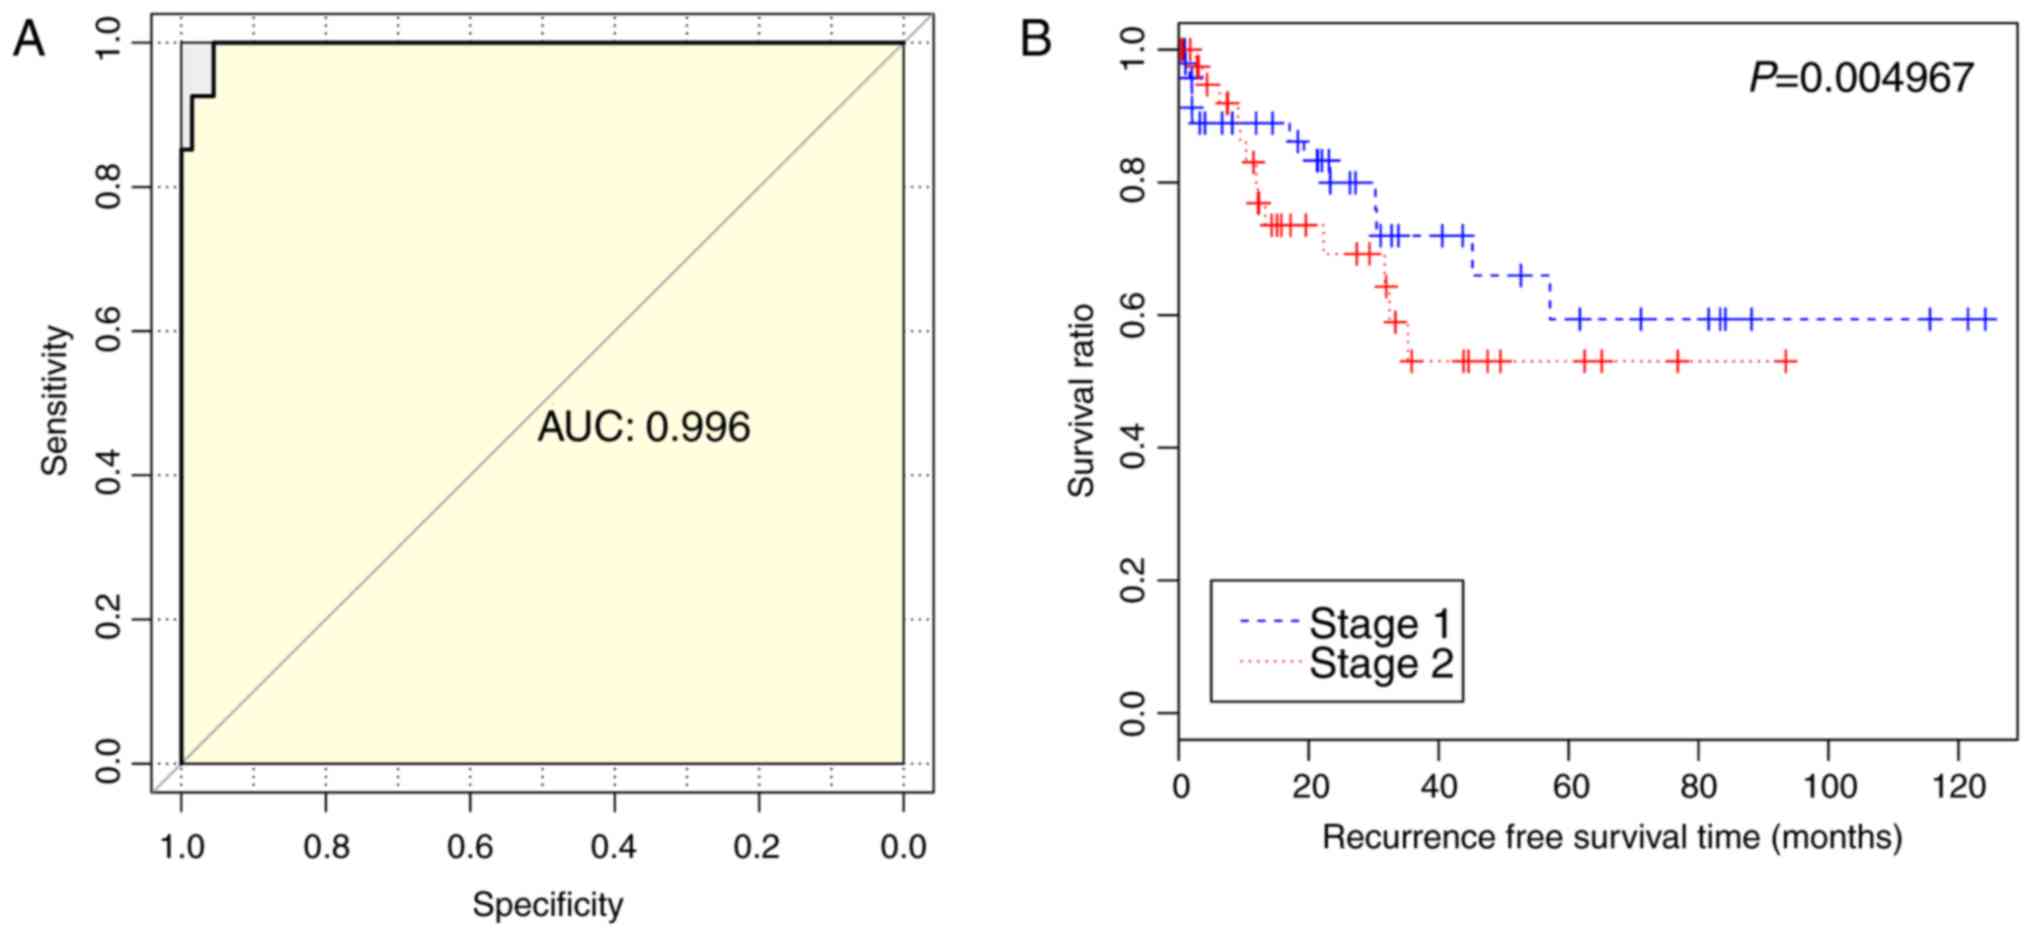
To further confirm the classification reliability of
the above selected 16 genes, another independent dataset was
downloaded from TCGA database. The results indicated that these 16
genes provided a predictive accuracy of 100% (67/67) for stage I
lung squamous carcinoma samples, a predictive accuracy of 92.59%
(25/27) for stage II lung squamous carcinoma, an overall predictive
accuracy of 97.87% (92/94) and an AUC of 0.996 (Fig. 5A). The survival analysis also
demonstrated that the survival rates of patients with stage II lung
squamous carcinoma were significantly lower, compared with those of
patients with stage I lung squamous carcinoma (P=0.004967)
(Fig. 5B).
Pathway enrichment analysis
Only one significant KEGG pathway, the
phosphoinositide 3-kinase (PI3K)-Akt signaling pathway (adjusted
P=0.020268797), was enriched for seven DEGs (YWHAQ,
IRS1, PDPK1, HSP90AA1, INSR,
RXRA and YWHAH). No pathway was significantly
enriched for the other nine DEGs.
Discussion
The present study identified 16 DEGs, which can be
used as a gene signature to distinguish stage I from stage II lung
squamous carcinoma and are of value for predicting prognosis. There
were 15 upregulated DEGs (CAV1, EEF1G,
CSNK2A1, YWHAH, YWHAQ, PTN,
INSR, IRS1, PDPK1, Sp1, COPS6,
NDRG1, RXRA, HSP90AA1 and KPNB1) and
one downregulated DEG (EPB41) in stage II lung squamous
carcinoma.
CAV1, encoding a 22–24 kDa structural protein
component of caveolae in the plasma membrane, has been demonstrated
to be upregulated in NSCLC (24).
In addition, high expression of CAV1 has shown to be associated
with poor prognosis in patients with NSCLC (25,26). The high expression level of
EEF1G may promote the synthesis of several proteins to
prevent oxidative stress and nutrient deprivation, resulting in the
excessive proliferation of cells and development of cancer
(27). However, direct
investigations of EEF1G remain limited and further
confirmation of EEF1G in lung squamous carcinoma remains
essential. CSNK2A1, encoding an α catalytic subunit of
protein kinase CK2, promotes tumor cell growth, adhesion and
migration by activating the Janus kinase/signal transducer and
activator of transcription, nuclear factor-κB, PI3K/AKT, Hsp90, Wnt
and Hedgehog pathways (28). A
study by O-charoenrat et al indicated that CSNK2A1
may serve as a potential predictor of poor prognosis for lung
squamous carcinoma (29), which
is consistent with the present study to a certain extent.
PTN is a heparin-binding growth factor, with high secretion
levels in NSCLC cells (30).
PTN regulates cell proliferation and migration in NSCLC by
activating its cell surface receptors and PI3K signaling (31,32), which may lead to a poor prognosis
(33). Sp1, an oncogenic
transcription factor for lung squamous carcinoma, may be involved
in regulating the promoter activity of its target genes (34,35). Detecting the expression level of
Sp1 is considered to be an effective approach for the
diagnosis and prognosis of lung cancer (36).
COPS6, encoding one of the eight subunits of
the COP9 signalosome, mediates the upregulation of E6AP by
reducing E6AP poly-ubiquitination and targeting p53 for
proteasome-mediated degradation, which in turn decreases the
transcriptional activity of p53 target genes to induce cervical
cell growth and motility (37).
However, the underlying mechanism of COPS6 in lung squamous
carcinoma remains to be fully elucidated. NDRG1, a member of
the N-myc downstream regulated gene family, can be overexpressed in
several types of lung cancer, including lung squamous cell
carcinoma (38,39). The survival rate of patients
negative for the nuclear expression of NDRG1 has been
reported to be significantly higher, compared with that in patients
who positive for NDRG1 (38). In addition, a high expression of
NDRG1 may promote the progression of lung squamous cell
carcinoma by upregulating vascular endothelial growth
factor-A and interleukin-8/C-X-C-motif chemokine ligand 8
(38). EPB41, encoding the
erythrocyte membrane protein band 4.1, has been shown to function
as a tumor suppressor gene in meningioma cell lines (40). However, the role and mechanism of
EPB41 in lung cancer remains to be fully elucidated and
further experiments are essential.
According to the pathway enrichment analysis in the
present study, seven DEGs (YWHAQ, IRS1, PDPK1,
HSP90AA1, INSR, RXRA and YWHAH) among
the 16 DEGs were significantly involved in the PI3K-Akt signaling
pathway. Increasing evidence suggests that activation of the
PI3K-Akt signaling pathway is correlated with poor prognosis in
patients with NSCLC, as this pathway antagonizes apoptosis and
contributes to the proliferation and metastasis of NSCLC cells
(41,42). It has been reported that
upregulated expression levels of HSP90AA1 and PDPK1
are significantly associated with shorter overall survival rates in
patients with NSCLC (43,44). INSR can be activated by the
insulin ligand to trigger the PI3K/AKT signaling pathway and
enhance tumor growth, migration and angiogenesis (45,46). Previous multivariate analysis
revealed patients with high expression levels of INSR had
shorter overall survival rates, compared with those with low
expression levels (47). A
truncated version of RXR-α has been demonstrated to significantly
contribute to the anchorage-independent growth of cancer cells by
activation of the PI3K/AKT pathway (48). YWHAH and YWHAQ
mediate oncogenic transformation by stimulating PI3K signaling, and
these two genes may be correlated with a more advanced pathologic
stage and lower overall survival rate (49,50). Therefore, it may be that these
seven upregulated DEGs involved in the PI3K-Akt signaling pathway
may also be associated with decreased survival rate in patients
with stage II lung squamous carcinoma.
In conclusion, the 16-gene expression signature
identified in the present study may be of value in the
discrimination of patients with stage I or II lung squamous
carcinoma and prediction of prognosis. Further investigations aim
to analyze the association between the gene expression levels of
this 16-gene signature and prognosis based on the prognosis of
clinical patients.
References
|
1
|
Siegel RL, Miller KD and Jemal A: Cancer
statistics, 2017. CA Cancer J Clin. 66:7–30. 2017. View Article : Google Scholar
|
|
2
|
McPhail S, Johnson S, Greenberg D, Peake M
and Rous B: Stage at diagnosis and early mortality from cancer in
England. Br J Cancer. 112(Suppl 1): S108–S115. 2015. View Article : Google Scholar : PubMed/NCBI
|
|
3
|
Walters S, Maringe C, Coleman MP, Peake
MD, Butler J, Young N, Bergström S, Hanna L, Jakobsen E, Kölbeck K,
et al: Lung cancer survival and stage at diagnosis in Australia,
Canada, Denmark, Norway, Sweden and the UK: A population-based
study, 2004–2007. Thorax. 68:551–564. 2013. View Article : Google Scholar : PubMed/NCBI
|
|
4
|
Klarod K, Hongsprabhas P, Khampitak T,
Wirasorn K, Kiertiburanakul S, Tangrassameeprasert R, Daduang J,
Yongvanit P and Boonsiri P: Serum antioxidant levels and
nutritional status in early and advanced stage lung cancer
patients. Nutrition. 27:1156–1160. 2011. View Article : Google Scholar : PubMed/NCBI
|
|
5
|
Lim W, Zhang WH, Miller CR, Watters JW,
Gao F, Viswanathan A, Govindan R and McLeod HL: PTEN and
phosphorylated AKT expression and prognosis in early-and late-stage
non-small cell lung cancer. Oncol Rep. 17:853–857. 2007.PubMed/NCBI
|
|
6
|
Lemon Lu Y, Liu W, Yi PY, Morrison Y, Yang
C, Sun P, Szoke Z, Gerald J, Watson WLM, et al: A gene expression
signature predicts survival of patients with stage I non-small cell
lung cancer. PLoS Med. 3:e4672006. View Article : Google Scholar : PubMed/NCBI
|
|
7
|
Der SD, Sykes J, Pintilie M, Zhu CQ,
Strumpf D, Liu N, Jurisica I, Shepherd FA and Tsao MS: Validation
of a histology-independent prognostic gene signature for
early-stage, non-small-cell lung cancer including stage IA
patients. J Thorac Oncol. 9:59–64. 2014. View Article : Google Scholar
|
|
8
|
Huang S, Reitze NJ, Ewing AL, McCreary S,
Uihlein AH, Brower SL, Wang D, Wang T, Gabrin MJ, Keating KE, et
al: Analytical performance of a 15-gene prognostic assay for
early-stage non-small-cell lung carcinoma using RNA-stabilized
tissue. J Mol Diagn. 17:438–445. 2015. View Article : Google Scholar : PubMed/NCBI
|
|
9
|
Skrzypski M, Jassem E, Taron M, Sanchez
JJ, Mendez P, Rzyman W, Gulida G, Raz D, Jablons D, Provencio M, et
al: Three-gene expression signature predicts survival in
early-stage squamous cell carcinoma of the lung. Clin Cancer Res.
14:4794–4799. 2008. View Article : Google Scholar : PubMed/NCBI
|
|
10
|
Krzystanek M, Moldvay J, Szüts D, Szallasi
Z and Eklund AC: A robust prognostic gene expression signature for
early stage lung adenocarcinoma. Biomarker Res. 4:12016. View Article : Google Scholar
|
|
11
|
Hwang JA, Song JS, Yu DY, Kim HR, Park HJ,
Park YS, Kim WS and Choi CM: Peroxiredoxin 4 as an independent
prognostic marker for survival in patients with early-stage lung
squamous cell carcinoma. Int J Clin Exp Pathol. 8:6627–6635.
2015.PubMed/NCBI
|
|
12
|
Zhu CQ, Strumpf D, Li CY, Li Q, Liu N, Der
S, Shepherd FA, Tsao MS and Jurisica I: Prognostic gene expression
signature for squamous cell carcinoma of lung. Clin Cancer Res.
16:5038–5047. 2010. View Article : Google Scholar : PubMed/NCBI
|
|
13
|
Kim TH, Choi SJ, Lee YH, Song GG and Ji
JD: Gene expression profile predicting the response to anti-TNF
treatment in patients with rheumatoid arthritis; analysis of GEO
datasets. Joint Bone Spine. 81:325–330. 2014. View Article : Google Scholar : PubMed/NCBI
|
|
14
|
Bolstad BM, Irizarry RA, Åstrand M and
Speed TP: A comparison of normalization methods for high density
oligonucleotide array data based on variance and bias.
Bioinformatics. 19:185–193. 2003. View Article : Google Scholar : PubMed/NCBI
|
|
15
|
Smyth GK: Limma: Linear models for
microarray data. Bioinformatics and computational biology solutions
using R and Bioconductor. Springer; pp. 397–420. 2005, View Article : Google Scholar
|
|
16
|
Yang ZH, Zheng R, Gao Y and Zhang Q:
Identification of suitable genes contributes to lung adenocarcinoma
clustering by multiple meta-analysis methods. Clin Respir J.
10:631–646. 2016. View Article : Google Scholar
|
|
17
|
Kang DD, Sibille E, Kaminski N and Tseng
GC: MetaQC: Objective quality control and inclusion/exclusion
criteria for genomic meta-analysis. Nucleic Acids Res. 40:e152012.
View Article : Google Scholar :
|
|
18
|
Chang LC, Lin HM, Sibille E and Tseng GC:
Meta-analysis methods for combining multiple expression profiles:
Comparisons, statistical characterization and an application
guideline. BMC Bioinformatics. 14:3682013. View Article : Google Scholar : PubMed/NCBI
|
|
19
|
Kohl M, Wiese S and Warscheid B:
Cytoscape: Software for visualization and analysis of biological
networks. Methods Mol Biol. 696:291–303. 2011. View Article : Google Scholar
|
|
20
|
Peri S, Navarro JD, Kristiansen TZ,
Amanchy R, Surendranath V, Muthusamy B, Gandhi TK, Chandrika KN,
Deshpande N, Suresh S, et al: Human protein reference database as a
discovery resource for proteomics. Nucleic Acids Res. 32:D497–D501.
2004. View Article : Google Scholar :
|
|
21
|
Meyer D and Wien FT: Support vector
machines. The interface to libsvm in package. e10712015.
|
|
22
|
Therneau T: A package for survival
analysis in S. R package version 2.37-4. URL http://CRANR-project.org/package=survivalBox980032.
pp. 23298–20032. 2013
|
|
23
|
Benjamini Y and Hochberg Y: Controlling
the false discovery rate: A practical and powerful approach to
multiple testing. J Royal Statistical Soc Series B. 57:289–300.
1995.
|
|
24
|
Sunaga N, Miyajima K, Suzuki M, Sato M,
White MA, Ramirez RD, Shay JW, Gazdar AF and Minna JD: Different
roles for caveolin-1 in the development of non-small cell lung
cancer versus small cell lung cancer. Cancer Res. 64:4277–4285.
2004. View Article : Google Scholar : PubMed/NCBI
|
|
25
|
Chen D, Shen C, Du H, Zhou Y and Che G:
Duplex value of caveolin-1 in non-small cell lung cancer: A meta
analysis. Familial Cancer. 13:449–457. 2014. View Article : Google Scholar : PubMed/NCBI
|
|
26
|
Ho CC, Kuo SH, Huang PH, Huang HY, Yang CH
and Yang PC: Caveolin-1 expression is significantly associated with
drug resistance and poor prognosis in advanced non-small cell lung
cancer patients treated with gemcitabine-based chemotherapy. Lung
Cancer. 59:105–110. 2008. View Article : Google Scholar
|
|
27
|
Matassa D, Amoroso MR, Agliarulo I,
Maddalena F, Sisinni L, Paladino S, Romano S, Romano MF, Sagar V,
Loreni F, et al: Translational control in the stress adaptive
response of cancer cells: A novel role for the heat shock protein
TRAP1. Cell Death Dis. 4:e8512013. View Article : Google Scholar : PubMed/NCBI
|
|
28
|
Zheng Y, McFarland BC, Drygin D, Yu H,
Bellis SL, Kim H, Bredel M and Benveniste EN: Targeting protein
kinase CK2 suppresses prosurvival signaling pathways and growth of
glioblastoma. Clin Cancer Res. 19:6484–6494. 2013. View Article : Google Scholar : PubMed/NCBI
|
|
29
|
O-charoenrat P, Rusch V, Talbot SG,
Sarkaria I, Viale A, Socci N, Ngai I, Rao P and Singh B: Casein
kinase II alpha subunit and C1-inhibitor are independent predictors
of outcome in patients with squamous cell carcinoma of the lung.
Clinical Cancer Res. 10:5792–5803. 2004. View Article : Google Scholar
|
|
30
|
Jäger R, List B, Knabbe C, Souttou B,
Raulais D, Zeiler T, Wellstein A, Aigner A, Neubauer A and Zugmaier
G: Serum levels of the angiogenic factor pleiotrophin in relation
to disease stage In lung cancer patients. Br J Cancer. 86:858–863.
2002. View Article : Google Scholar : PubMed/NCBI
|
|
31
|
Feng ZJ, Gao SB, Wu Y, Xu XF, Hua X and
Jin GH: Lung cancer cell migration is regulated via repressing
growth factor PTN/RPTP β/ζ signaling by menin. Oncogene.
29:5416–5426. 2010. View Article : Google Scholar : PubMed/NCBI
|
|
32
|
Gao S, Feng Z, Xu B, Wu Y, Yin P, Yang Y,
Hua X and Jin GH: Suppression of lung adenocarcinoma through menin
and poly-comb gene-mediated repression of growth factor
pleiotrophin. Oncogene. 28:4095–4104. 2009. View Article : Google Scholar : PubMed/NCBI
|
|
33
|
Du ZY, Shi MH, Ji CH and Yu Y: Serum
pleiotrophin could be an early indicator for diagnosis and
prognosis of non-small cell lung cancer. Asian Pac J Cancer Prev.
16:1421–1425. 2014. View Article : Google Scholar
|
|
34
|
Brown KC, Perry HE, Lau JK, Jones DV,
Pulliam JF, Thornhill BA, Crabtree CM, Luo H, Chen YC and Dasgupta
P: Nicotine induces the up-regulation of the α7-nicotinic receptor
(α7-nAChR) in human squamous cell lung cancer cells via the
Sp1/GATA protein pathway. J Biol Chem. 288:33049–33059. 2013.
View Article : Google Scholar : PubMed/NCBI
|
|
35
|
Li M, Ling B, Xiao T, Tan J, An N, Han N,
Guo S, Cheng S and Zhang K: Sp1 transcriptionally regulates BRK1
expression in non-small cell lung cancer cells. Gene. 542:134–140.
2014. View Article : Google Scholar : PubMed/NCBI
|
|
36
|
Cha N, Lv M, Zhao YJ, Yang D, Wang EH and
Wu GP: Diagnostic utility of VEGF mRNA and SP1 mRNA expression in
bronchial cells of patients with lung cancer. Respirology.
19:544–548. 2014. View Article : Google Scholar : PubMed/NCBI
|
|
37
|
Gao S, Fang L, Phan LM, Qdaisat A, Yeung
SC and Lee MH: COP9 signalosome subunit 6 (CSN6) regulates
E6AP/UBE3A in cervical cancer. Oncotarget. 6:28026–28041. 2015.
View Article : Google Scholar : PubMed/NCBI
|
|
38
|
Azuma K, Kawahara A, Hattori S, Taira T,
Tsurutani J, Watari K, Shibata T, Murakami Y, Takamori S, Ono M, et
al: NDRG1/Cap43/Drg-1 may predict tumor angiogenesis and poor
outcome in patients with lung cancer. J Thorac Oncol. 7:779–789.
2012. View Article : Google Scholar : PubMed/NCBI
|
|
39
|
Wang D, Tian X and Jiang Y: NDRG1/Cap43
overexpression in tumor tissues and serum from lung cancer
patients. J Cancer Res Clin Oncol. 138:1813–1820. 2012. View Article : Google Scholar : PubMed/NCBI
|
|
40
|
Robb VA, Li W, Gascard P, Perry A,
Mohandas N and Gutmann DH: Identification of a third Protein 4.1
tumor suppressor, Protein 4.1 R, in meningioma pathogenesis.
Neurobiol Dis. 13:191–202. 2003. View Article : Google Scholar : PubMed/NCBI
|
|
41
|
Zhou L, Luan H, Liu Q, Jiang T, Liang H,
Dong X and Shang H: Activation of PI3K/Akt and ERK signaling
pathways antagonized sinomenine-induced lung cancer cell apoptosis.
Mol Med Rep. 5:1256–1260. 2012.PubMed/NCBI
|
|
42
|
Zhang C, Lan T, Hou J, Li J, Fang R, Yang
Z, Zhang M, Liu J and Liu B: NOX4 promotes non-small cell lung
cancer cell proliferation and metastasis through positive feedback
regulation of PI3K/Akt signaling. Oncotarget. 5:4392–4405. 2014.
View Article : Google Scholar : PubMed/NCBI
|
|
43
|
Gallegos Ruiz MI, Floor K, Roepman P,
Rodriguez JA, Meijer GA, Mooi WJ, Jassem E, Niklinski J, Muley T,
van Zandwijk N, et al: Integration of gene dosage and gene
expression in non-small cell lung cancer, identification of HSP90
as potential target. PLoS One. 3:e00017222008. View Article : Google Scholar : PubMed/NCBI
|
|
44
|
Han L, Zhang G, Zhang N, Li H, Liu Y, Fu A
and Zheng Y: Prognostic potential of microRNA-138 and its target
mRNA PDK1 in sera for patients with non-small cell lung cancer. Med
Oncol. 31:1292014. View Article : Google Scholar : PubMed/NCBI
|
|
45
|
Taniguchi CM, Emanuelli B and Kahn CR:
Critical nodes in signalling pathways: Insights into insulin
action. Nat Rev Mol Cell Biol. 7:85–96. 2006. View Article : Google Scholar : PubMed/NCBI
|
|
46
|
Heidegger I, Kern J, Ofer P, Klocker H and
Massoner P: Oncogenic functions of IGF1R and INSR in prostate
cancer include enhanced tumor growth, cell migration and
angiogenesis. Oncotarget. 5:2723–2735. 2014. View Article : Google Scholar : PubMed/NCBI
|
|
47
|
Kim JS, Kim ES, Liu D, Lee JJ, Solis L,
Behrens C, Lippman SM, Hong WK, Wistuba II and Lee HY: Prognostic
impact of insulin receptor expression on survival of patients with
nonsmall cell lung cancer. Cancer. 118:2454–2465. 2012. View Article : Google Scholar
|
|
48
|
Wang GH, Jiang FQ, Duan YH, Zeng ZP, Chen
F, Dai Y, Chen JB, Liu JX, Liu J, Zhou H, et al: Targeting
truncated retinoid X receptor-α by CF31 Induces TNF-α-dependent
apoptosis. Cancer Res. 73:307–318. 2013. View Article : Google Scholar
|
|
49
|
Radhakrishnan VM and Martinez JD:
14-3-3gamma induces oncogenic transformation by stimulating MAP
kinase and PI3K signaling. PLoS One. 5:e114332010. View Article : Google Scholar : PubMed/NCBI
|
|
50
|
Fan T, Li R, Todd NW, Qiu Q, Fang HB, Wang
H, Shen J, Zhao RY, Caraway NP, Katz RL, et al: Up-regulation of
14-3-3zeta in lung cancer and its implication as prognostic and
therapeutic target. Cancer Res. 67:7901–7906. 2007. View Article : Google Scholar : PubMed/NCBI
|