Introduction
Colorectal cancer (CRC) is one of the most lethal
diseases worldwide, and it is estimated to account for >9% of
all cases of cancer. The incidence of CRC varies according to
geographical location, and the majority of cases occur in developed
countries (1). Based on
epidemiological data, it was estimated that 136,830 individuals
would be diagnosed with CRC and 50,310 would succumb to the disease
in the USA in 2014 (2).
Genetic factors have been established as major
regulators that affect CRC pathogenesis. Germline mutations of
susceptibility genes, such as adenomatous polyposis coli, MutL
homolog 1, MutL homolog 2 and the three loci recently identified
near to the genes paired like homeodomain 1, cyclin D2 and
hydroxyacid oxidase 1, are considered to be tightly associated with
CRC risk (3). SRY-box containing
gene 17 is a transcription factor (TF) that functions as an
inhibitor in the Wnt pathway, and its abnormal expression caused by
promoter hypermethylation may influence CRC development (4). The activation of nuclear factor-κB
signaling and its regulated genes also serve important roles in the
promotion of CRC progression (5).
Metastasis is the most common cause of cancer-associated mortality,
and accounts for ~90% of all cancer deaths (6). Patients with metastatic CRC have a
poor 5-year survival rate of <10% (7). A number of studies have investigated
the molecular mechanisms of metastatic CRC. For instance, the
overexpression of AKT serine/threonine kinase 2 has been indicated
to be a causative factor for CRC metastasis (8). Another study identified several
metastasis-associated genes in CRC, which mainly participate in
extracellular matrix interactions and cell signaling functions, and
include integrin subunit β1, integrin subunit β5, collagen type Vα1
and secreted phosphoprotein 1 (9). A further study indicated that
metastatic gene signatures, such as chemokine (C-X-C Motif)
receptor 7, adenylate kinase 1 and early growth response 1 are able
to predict the risk of recurrence and mortality in patients with
CRC (10). Despite these profound
findings, the etiology of CRC metastasis remains obscure.
The support vector machine (SVM) classifier is a
kernel algorithm that bases its analysis on data obtained only
through dot-products. The SVM classifier is widely applied in
bioinformatics due to its high accuracy, and has the ability to
identify the multivariate statistical properties of data that
distinguish between two different groups (11,12). Henneges et al (13) demonstrated that the SVM
classifier, in combination with liquid chromatography ion trap mass
spectrometry, is a promising tool for crucial gene predictions in
non-invasive breast cancer. In addition, another study using SVM
established a model that was able to discriminate normal samples
from those of CRC patients; via this classification method, several
biomarkers were predicted, including cadherin 3, claudin 1 and
interleukin-8 (14). However, to
the best of our knowledge, there have been no previous reports
regarding the application of the SVM classifier to CRC
metastasis.
Therefore, the present study was performed using the
SVM method to classify metastatic and non-metastatic CRC samples.
Three datasets were integrated using meta-analysis and an
additional dataset from The Cancer Genome Atlas (TCGA) database was
utilized to validate the precision of the SVM classifier. Several
bioinformatic methods were then carried out to reveal function and
pathway information of the identified SVM-classified signature
genes, on the basis of which a comprehensive evaluation of the
metastatic mechanisms in CRC was conducted and novel biomarkers
identified.
Materials and methods
Data resources and pretreatment
The Gene Expression omnibus (GEO; http://www.ncbi.nlm.nih.gov/geo) database was
searched for all eligible open public datasets with the key search
terms of 'colon cancer' and 'homo sapiens'. Datasets that satisfied
the following criteria were included in the study: i) The data
comprised gene expression profiles; ii) the data were associated
with CRC and metastasis; iii) information on samples from patients
with CRC and controls was elaborated. Based on these selection
criteria, five microarray datasets, GSE68468 (15), GSE62321 (16), GSE22834 (17), GSE14297 (18) and GSE6988 (19) were included in the present
study.
Among these datasets, GSE68468 and GSE62321 were
from the same platform, Affymetrix HG-U133 arrays (Thermo Fisher
Scientific, Inc., Waltham, MA, USA). GSE68468 consisted of 240 CRC
samples, of which 47 were metastatic and 193 were non-metastatic.
GSE62321 comprised a total of 39 CRC samples, including 19
metastatic and 20 non-metastatic samples. For these two datasets,
raw data in the CEL format was downloaded from the GEO database,
followed by background correction and normalization using the
Microarray Suite and quantiles, respectively (20,21). The median method was used for the
supplementation of missing values. These pretreatments were
performed using the Affy package in R version 1.42.3 (http://www.bioconductor.org/packages/release/bioc/html/affy.html).
Regarding the remaining three datasets, GSE22834 was
obtained from the Stanford Microarray Database print platform
(Stanford University, Stanford, CA, USA), and consisted of 63 CRC
samples (32 metastatic and 31 non-metastatic); GSE14297 was derived
from the Illumina human-6 v2.0 expression beadchip (extended)
(Illumina, Inc., San Diego, CA, USA), and included 36 CRC samples
(18 metastatic and 18 non-metastatic); and GSE6988 was from the
human 17K cDNA-GeneTrack platform (Genomic Tree, Inc., Daegeon,
Korea), and comprised 53 CRC samples (33 metastatic and 20
non-metastatic). For these three datasets, raw data in the txt
format was downloaded in the respective platform. In each
annotation platform, the probe identification number was
transformed into gene expression symbols. Probes that had a vacancy
were deleted, and multiple probes that corresponded to a single
gene were averaged to obtain the gene expression value. The Linear
Models for Microarray Analysis (limma; http://www.biocon-ductor.org/packages/release/bioc/html/limma.html)
package version 3.22.1 was then used to normalize the data
(22).
Selection of differentially expressed
genes (DEGs) using meta-analysis
To eliminate the bias from different platforms, the
MetaQC package version 0.1.13 was utilized to perform quality
control of the different datasets, in combination with principal
component analysis and standardized mean rank (23). The standards in MetaQC included:
i) Internal quality control, which was used to determine the
structural homogeneity of gene expression values among different
datasets; ii) external quality control, which was used for the
consistency testing of gene expression in a pathway database; iii)
accuracy quality control, which was used to determine the accuracy
of a differentially DEG or recognition of a pathway; iv)
consistency quality control of a DEG and pathway.
Following quality control, MetaDE.ES in the MetaDE
package [(23) https://cran.r-project.org/web/packages/MetaQC/index.html]
was utilized to identify DEGs in the integrated dataset. First, the
heterogeneity of the expression of each gene in different platforms
was detected based on parameters including τ2, the Q
value and Qpval (τ2=0 indicates homogeneity and a lack
of bias; a Q statistic obeying the χ2 test with a
freedom of K-1 and Qpval >0.05 indicate homogeneity and a lack
of bias). DEGs between the different groups in this integrated
dataset were then selected, and the P-value and false discovery
rate (FDR) were obtained. FDR <0.05 indicated a significant
difference. Thresholds for DEGs among different groups in the
present study were τ2=0, Qpval >0.05 and FDR
<0.05. Thereafter, these DEGs were subjected to bi-directional
hierarchical clustering analysis using the pheatmap R package
version 1.0.2 (http://cran.r-project.org/web/packages/pheatmap/index.html).
Construction of a protein-protein
interaction (PPI) network and its topological properties
Information in the human protein reference database
(HPRD; http://www.hprd.org/) was integrated
with that in the Biological General Repository for Interaction
Datasets (BioGRID; http://www.thebiogrid.org) (24,25) to construct a PPI network for the
identified DEGs. The network was visualized using Cytoscape
software version 3.6.0 (http://cytoscape.org/).
The betweenness centrality (BC or CB)
algorithm was used to reflect the topological property of each gene
in this network and to optimize candidate genes (26). The BC value of each DEG was
calculated based on the following formula:
In the formula, v, s and t denote three nodes
(protein production of DEGs) in the PPI network, σst is
the number of shortest paths from 's' to 't', and σst
(v) reflects the number of σst that pass the node 'v'.
The BC value varies from 0–1, and the greatest value indicates the
highest centrality of a node in the PPI network.
Training of the optimal SVM
classification model and performance evaluation
The DEGs were sorted in descending order based on
their BC values, and for those ranked at 10 to 100, the dataset
that conformed to the quality control and had the largest sample
number was set as the training dataset to perform training of the
optimal SVM classification model, until it could absolutely
distinguish one sample from another (27). DEGs obtained by this SVM
classifier were then further investigated using bi-directional
hierarchical clustering analysis, with visualization using the
aforementioned heatmap software. Afterwards, the remaining datasets
were taken as the validation datasets to evaluate the accuracy of
the optimal SVM classifier.
Validation via an individual dataset
A CRC dataset that was downloaded from the TCGA
database (https://cancergenome.nih.gov/), with the accession
number TCGA_COAD_G4502A_07_3-2015-02-24 (level 3), was used for the
validation. The dataset included a total of 193 specimens, and 90
of them had available clinical information, including 14 and 76
cases with and without the appearance of additional tumors,
respectively.
Enrichment analysis
Kyoto Encyclopedia of Genes and Genomes (KEGG;
http://www.genome.jp/kegg/pathway.html) pathway
enrichment analysis was carried out for these DEGs to identify
their potential pathways, using Fisher's exact test based on the
following formula:
In the formula, N represents total gene counts in
the whole genome, M indicates gene counts in the pathways, K
denotes DGE counts, and p represents the probability of ≥x of the K
DEGs being enriched in the pathway.
Results
DEGs detected by meta-analysis
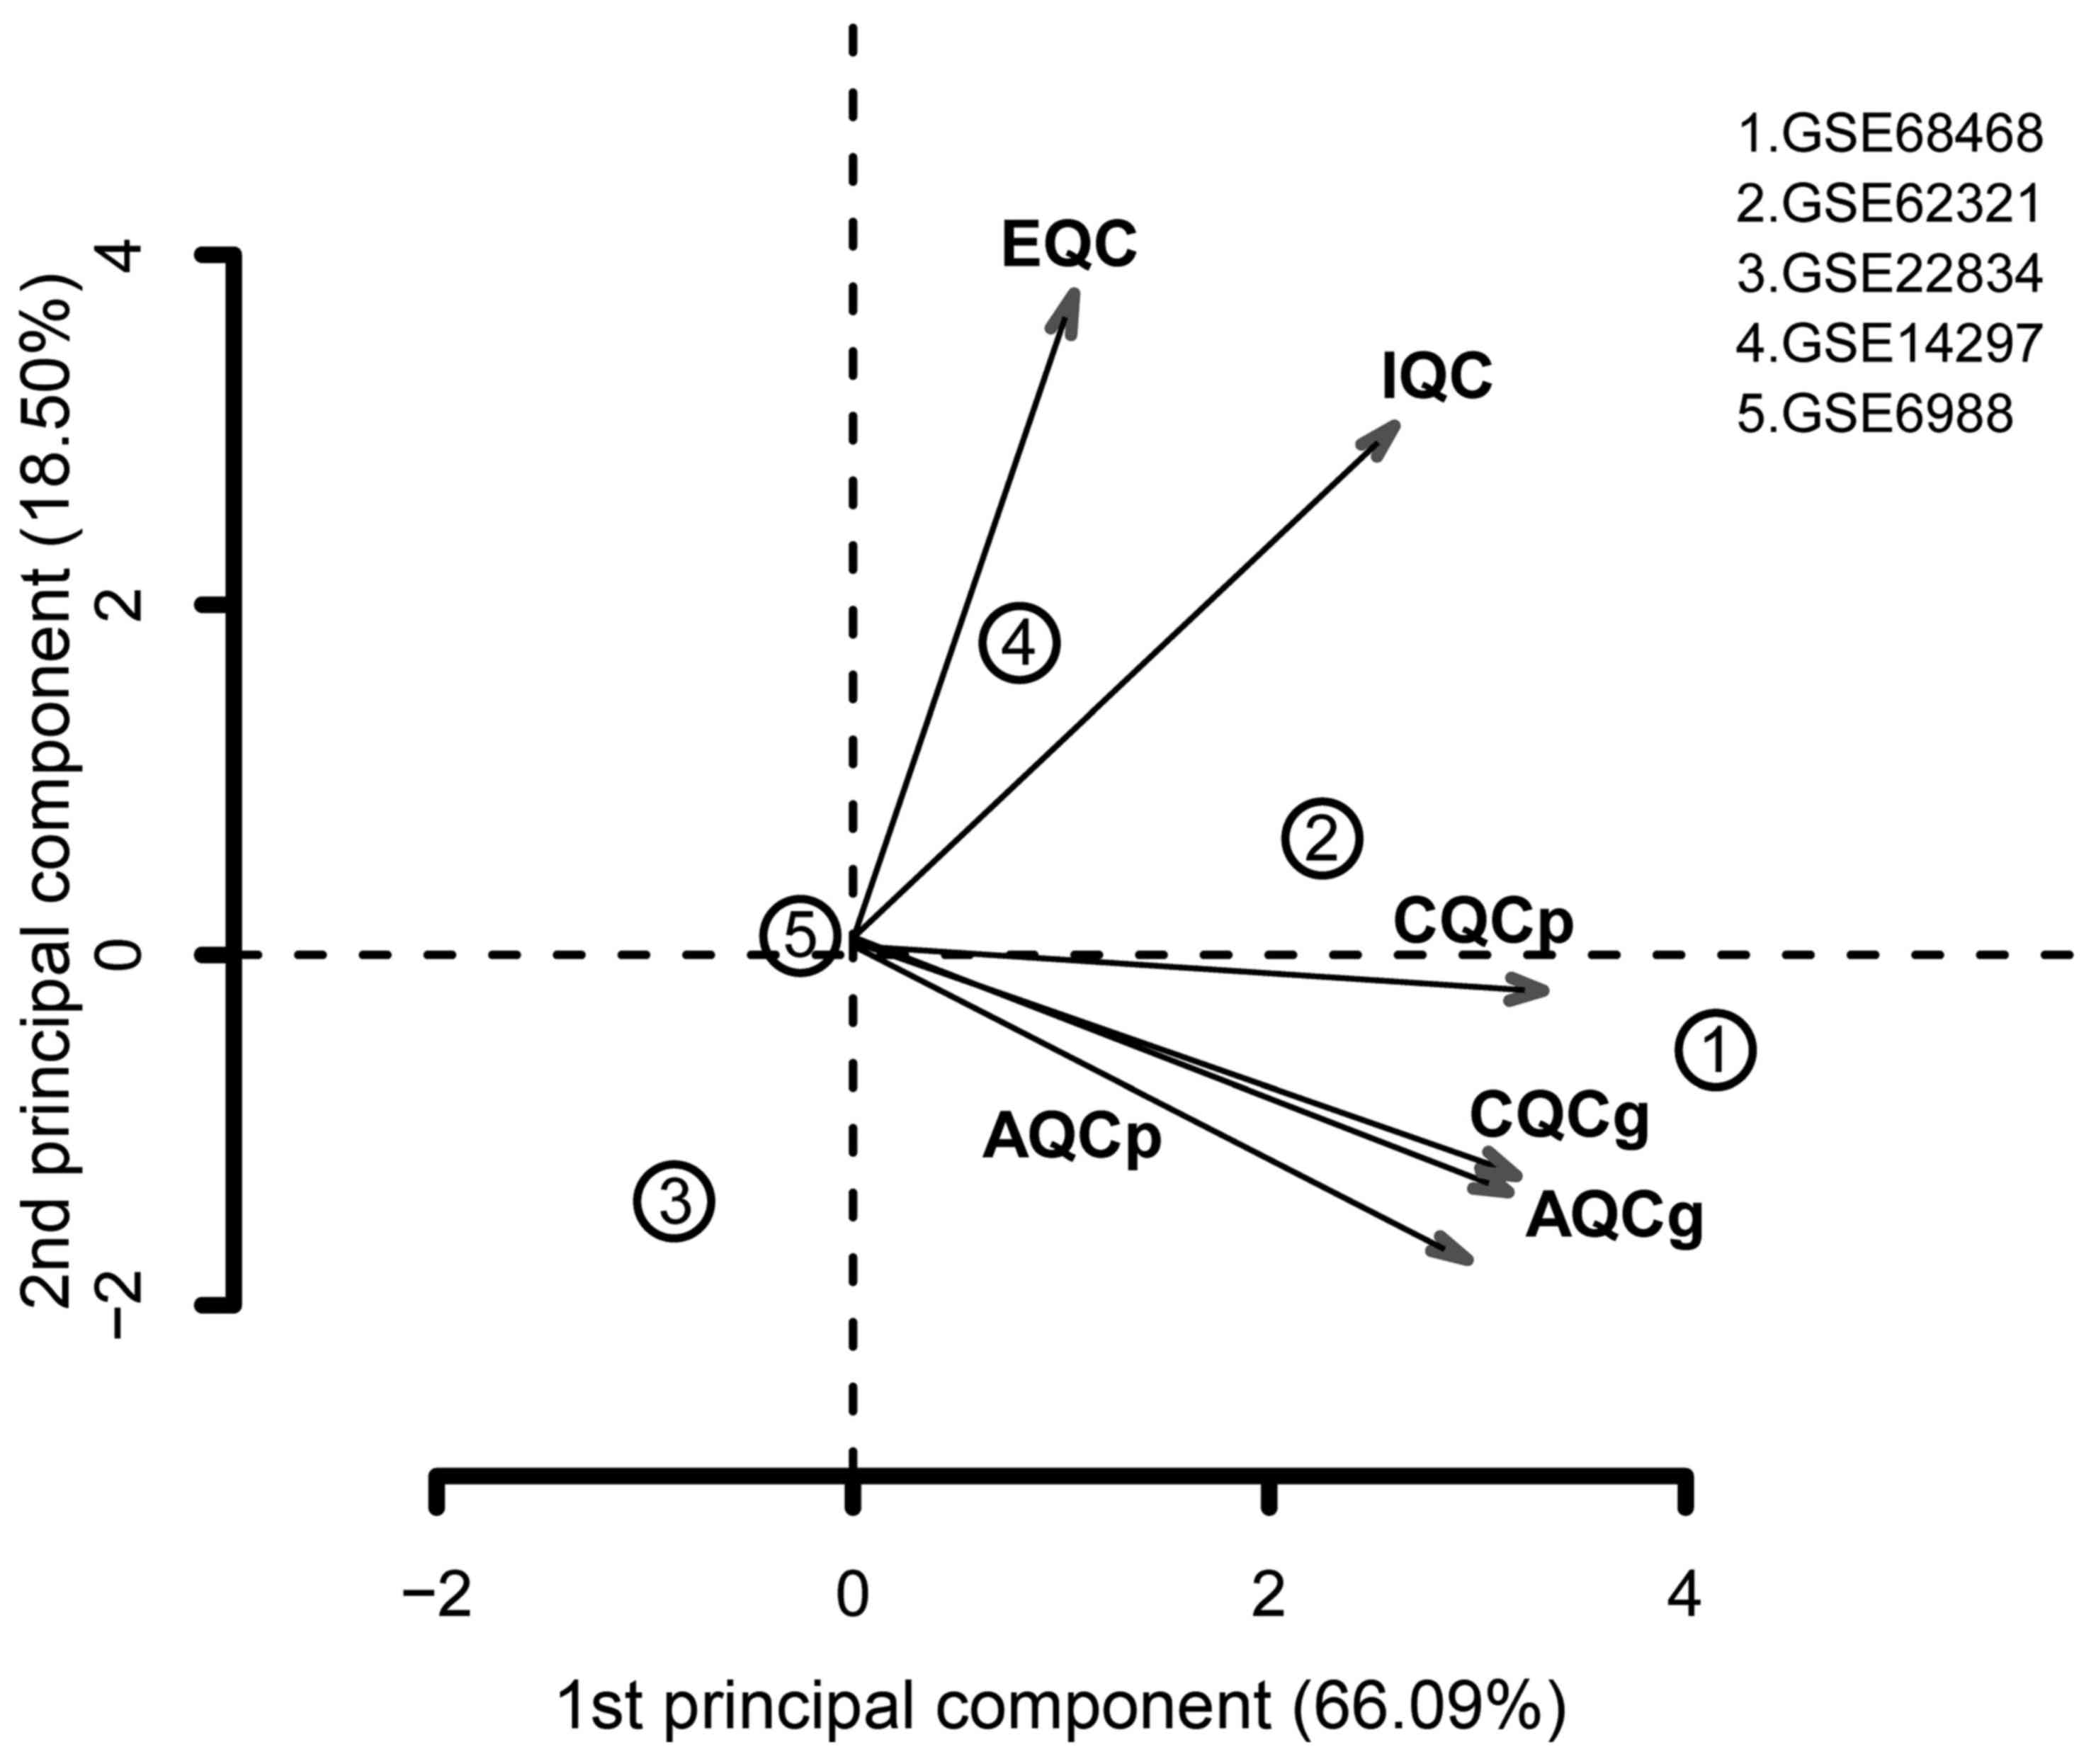
Quality control conducted using MetaQC indicated
that the GSE22834 and GSE6988 datasets had relatively low quality,
compared with the others (Table
I). In addition, GSE22834 markedly deviated from the other four
datasets, and GSE6988 also exhibited evident bias (Fig. 1). For these reasons, these two
datasets were excluded. The remaining three datasets were selected
for data integration via meta-analysis. The parameters pval, FDR,
τ2, Qpval and Qval were calculated using MetaDE. Based
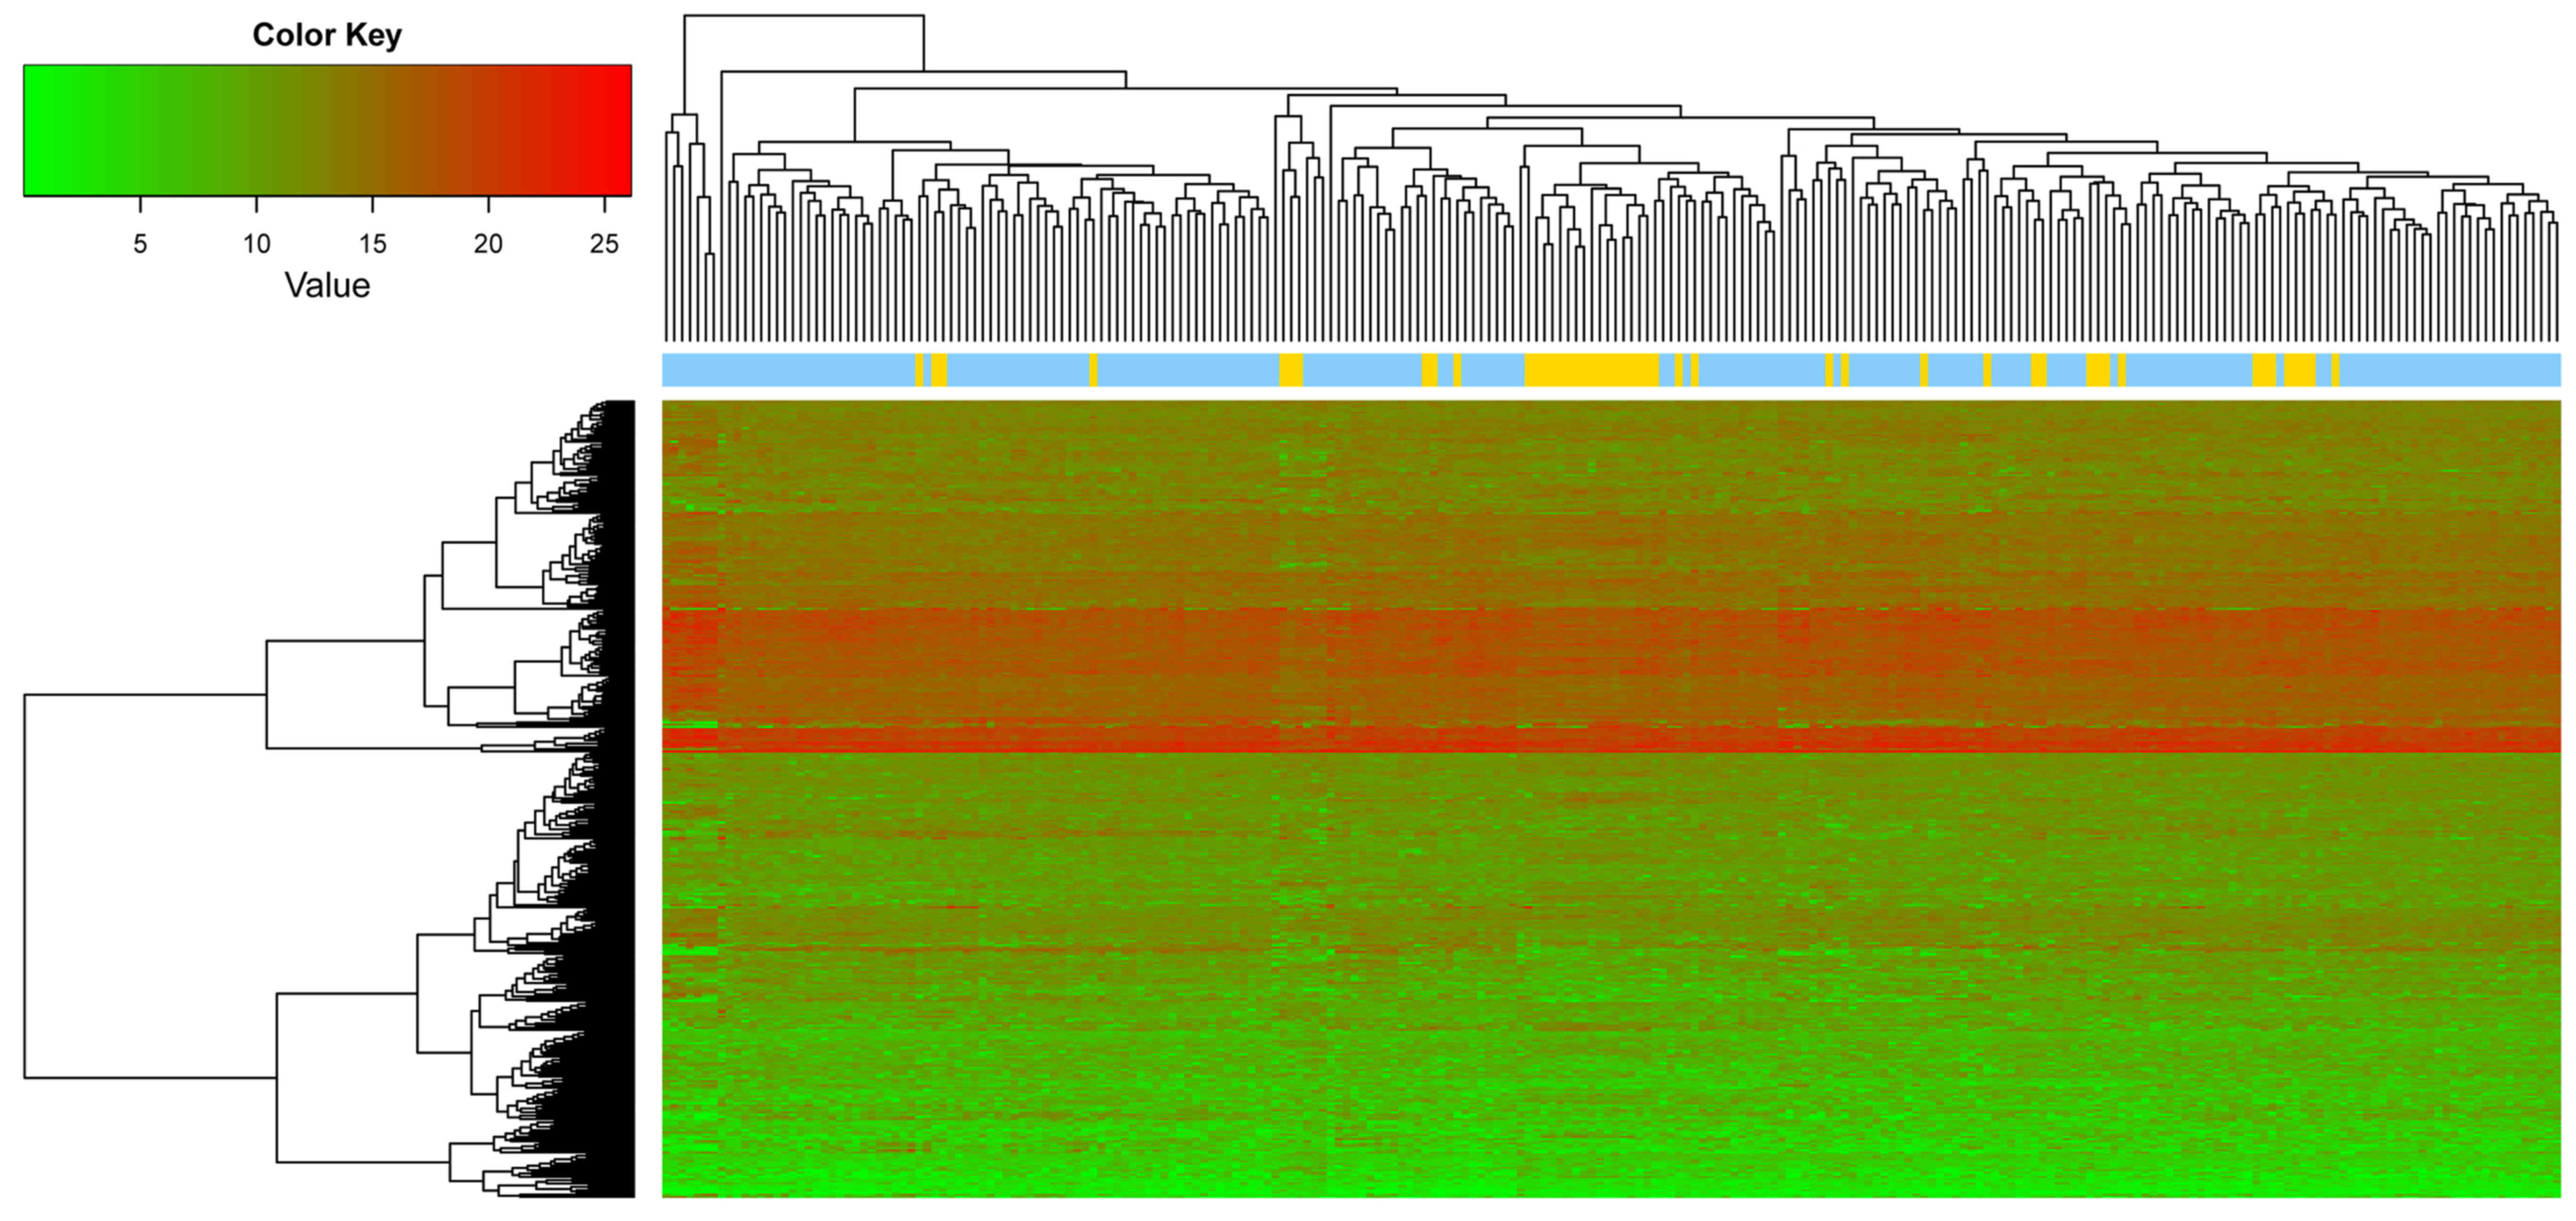
on the aforementioned selection criteria, a total of 358 DEGs were
identified by integrating the three datasets, and the top 10 DEGs
are listed in Table II. A heat
map of the gene expression of the 358 genes is presented in
Fig. 2.
 | Table IQuality control results of the five
datasets. |
Table I
Quality control results of the five
datasets.
| Dataset | IQC | EQC | CQCg | CQCp | AQCg | AQCp | SMR |
|---|
| GSE68468 | 5.19 | 3.28 | 69.15 | 103.59 | 27.46 | 56.31 | 2.13 |
| GSE62321 | 3.76 | 3.15 | 56.7 | 148.66 | 33.78 | 47.61 | 3.59 |
| GSE22834 | 0.21 | 0.67 | 0.01 | 0.27 | 0.83 | 1.98 | 13.87 |
| GSE14297 | 7.65 | 4.32 | 1.92 | 59.62 | 21.19 | 2.39 | 6.02 |
| GSE6988 | 0.03 | 1.19 | 0.86 | 0.53 | 1.73 | 1.96 | 8.62 |
| Table IITop 10 differentially expressed genes
identified via meta-analysis of the three integrated datasets. |
Table II
Top 10 differentially expressed genes
identified via meta-analysis of the three integrated datasets.
| Gene | P-value | FDR | Q | Qp | τ2 |
|---|
| MCF2L |
1.00×10⁻²⁰ |
3.45×10⁻¹⁸ | 1.7104 | 0.4252 | 0 |
| TCF21 |
1.00×10⁻²⁰ |
3.45×10⁻¹⁸ | 0.9410 | 0.6247 | 0 |
| FGD6 |
1.00×10⁻²⁰ |
3.45×10⁻¹⁸ | 0.9375 | 0.6258 | 0 |
| MED28 |
1.00×10⁻²⁰ |
3.45×10⁻¹⁸ | 0.7498 | 0.6874 | 0 |
| PRDM1 |
1.00×10⁻²⁰ |
3.45×10⁻¹⁸ | 0.7372 | 0.6917 | 0 |
| TMED10 |
1.00×10⁻²⁰ |
3.45×10⁻¹⁸ | 0.6972 | 0.7057 | 0 |
| F5 |
1.00×10⁻²⁰ |
3.45×10⁻¹⁸ | 0.4327 | 0.8054 | 0 |
| NUMA1 |
1.00×10⁻²⁰ |
3.45×10⁻¹⁸ | 0.2751 | 0.8715 | 0 |
| ELOVL6 |
3.62×10⁻⁶ |
7.69×10⁻⁴ | 1.9948 | 0.3688 | 0 |
| DLD |
3.62×10⁻⁶ |
7.69×10⁻⁴ | 1.8035 | 0.4059 | 0 |
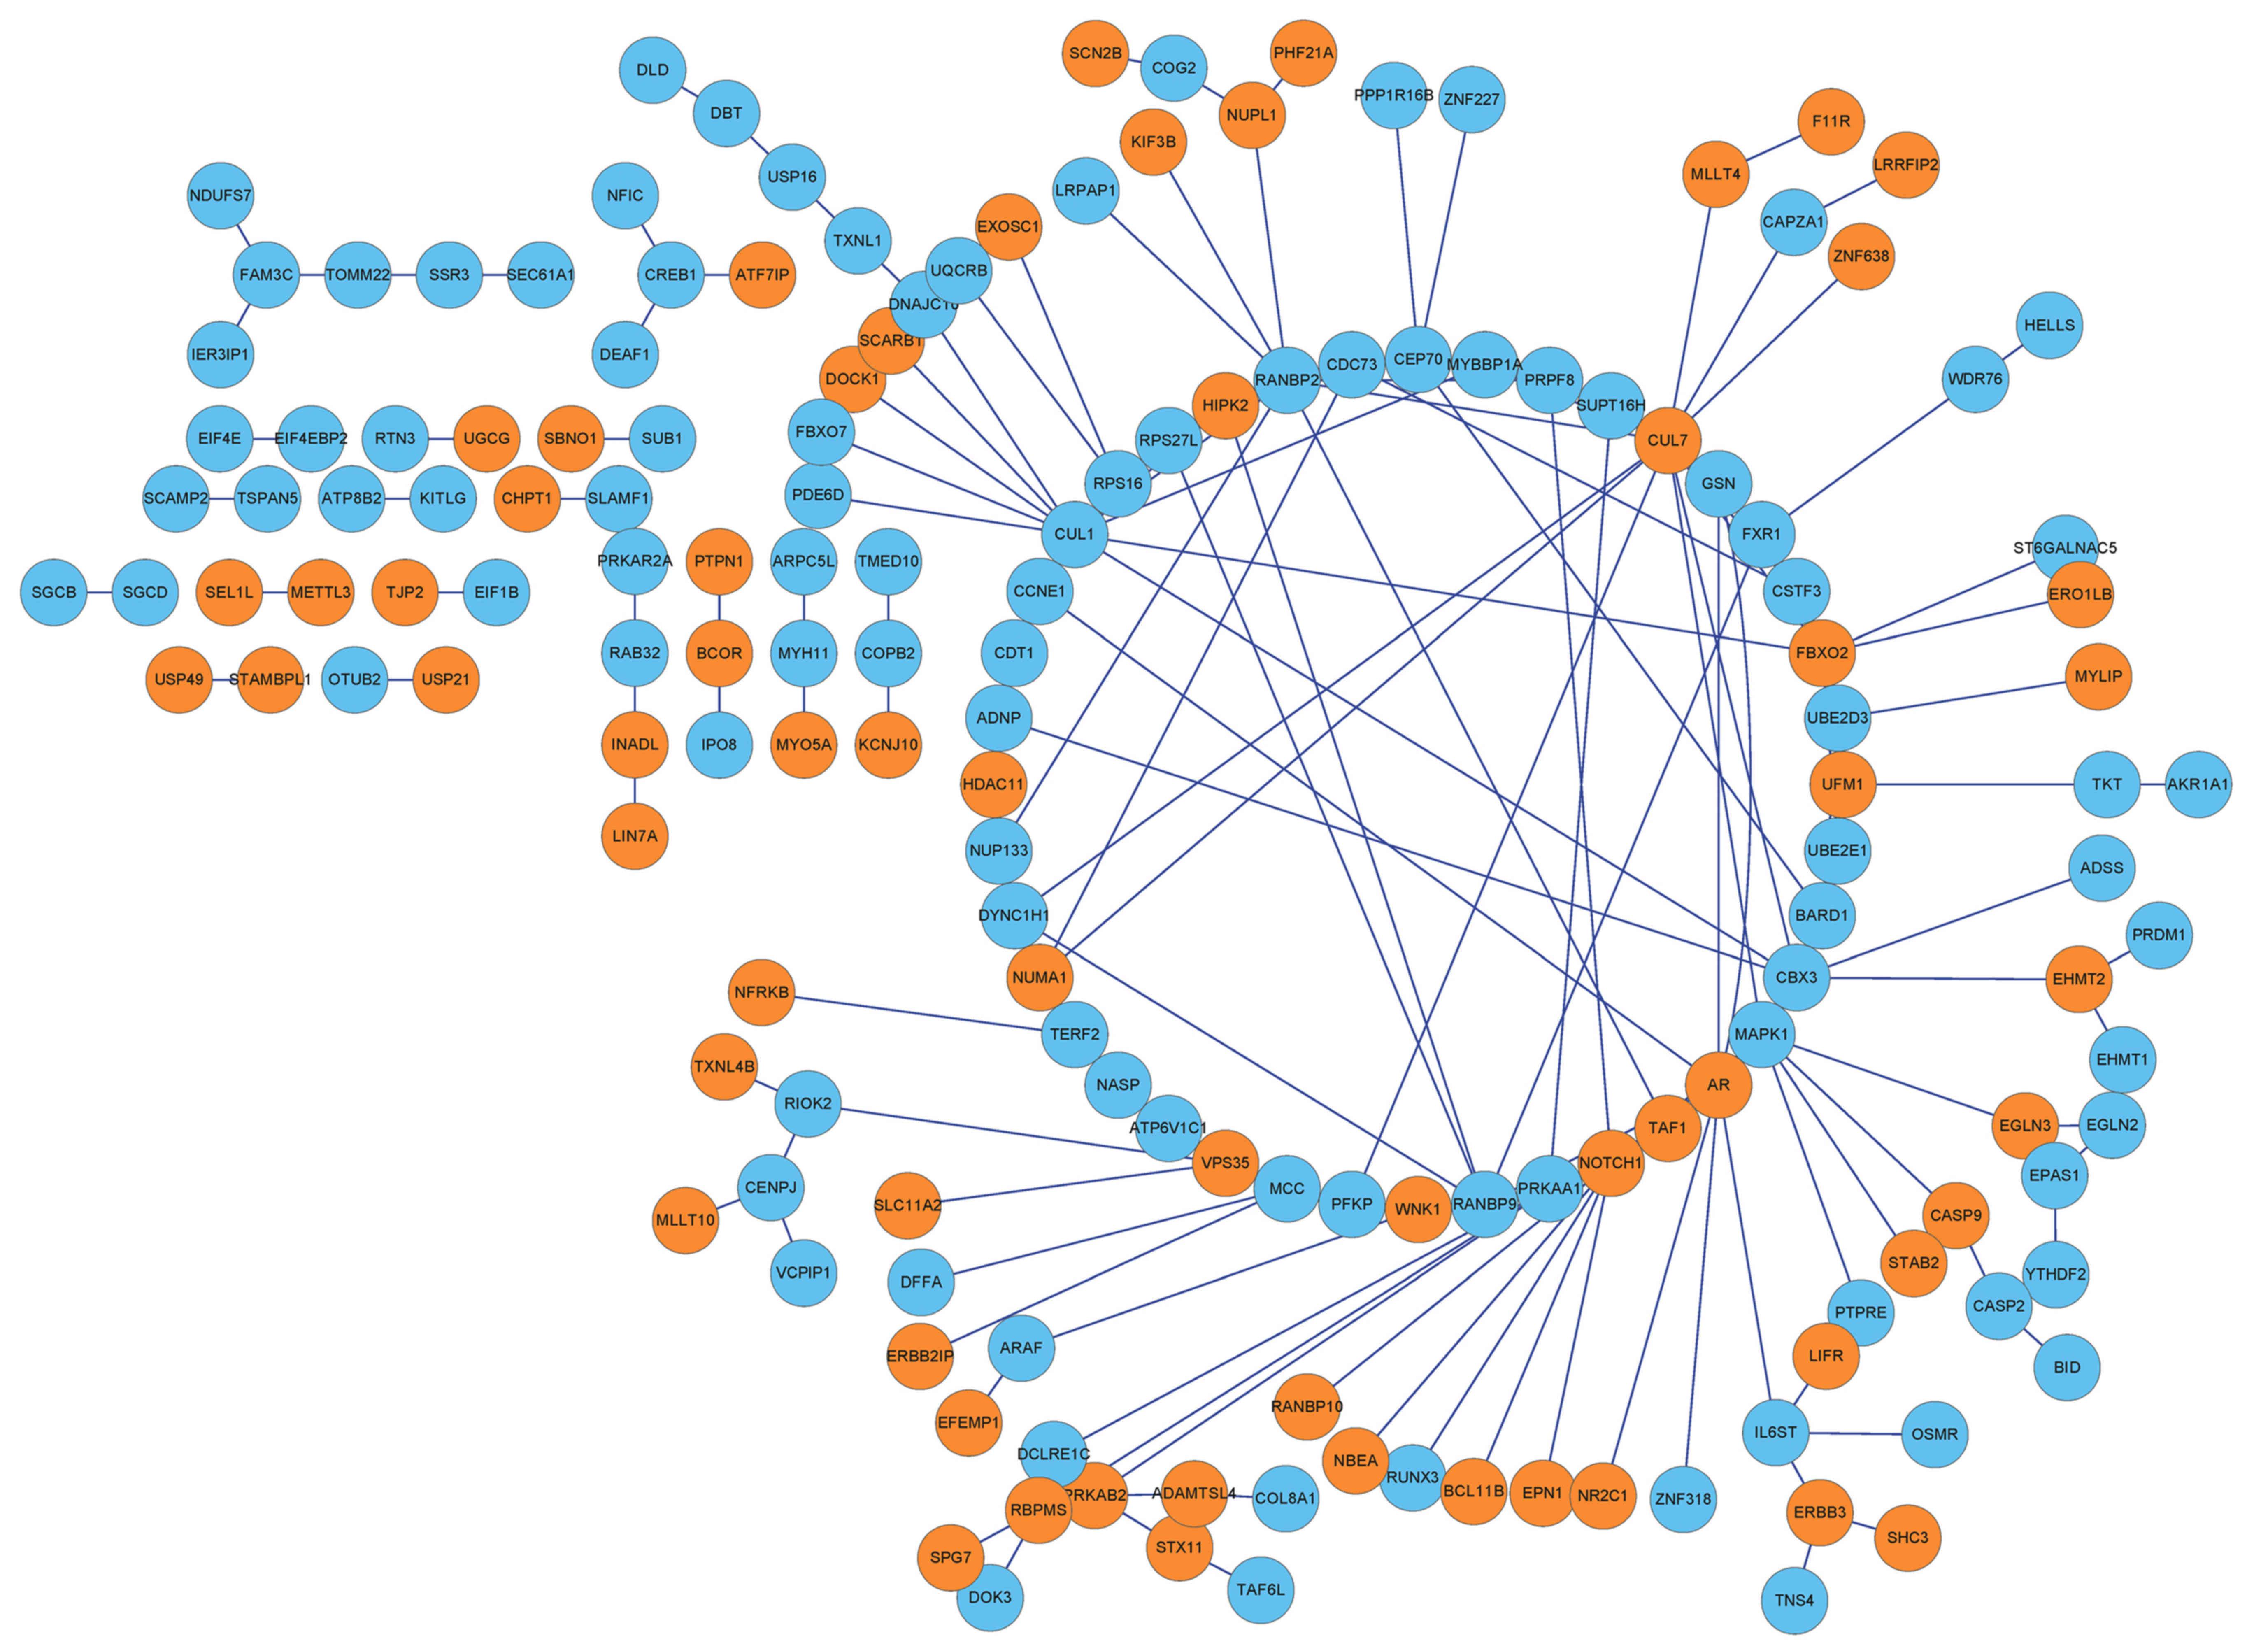
PPI network of the DEGs
By integrating protein information in the HPRD
database with that in BioGRID, interactions among the 358 DEGs were
extracted to form a PPI network, which contained 162 nodes and 193
interactions (Fig. 3).
DEGs optimized by BC of the network
Based on the BC algorithm, the BC value of each node
was obtained, and the top 10 nodes were: BCL6 corepressor; coatomer
protein complex subunit β 2; cAMP responsive element binding
protein 1 (CREB1); myosin heavy chain 11; family with sequence
similarity 3 member C; InaD-like (also known as PATJ, crumbs cell
polarity complex component); RAB32, member RAS oncogene family;
translocation of outer mitochondrial membrane 22; cullin 7 (CUL7);
and signal sequence receptor 3 (SSR3). Detailed information is
listed in Table III.
| Table IIITop 10 differentially expressed genes
ranked by their betweenness centrality value. |
Table III
Top 10 differentially expressed genes
ranked by their betweenness centrality value.
| Gene | BC | Exp | Degree | P-value | FDR | Q | Qp | τ2 |
|---|
| BCOR | 1 | 1 | 2 |
1.41×10⁻² | 0.1337 | 0.1198 | 0.9418 | 0 |
| COPB2 | 1 | 0 | 2 |
6.28×10⁻³ | 0.0845 | 0.8227 | 0.6627 | 0 |
| CREB1 | 1 | 0 | 4 |
2.44×10⁻² | 0.1812 | 0.6522 | 0.7217 | 0 |
| MYH11 | 1 | 0 | 2 |
7.17×10⁻⁴ | 0.0236 | 0.8618 | 0.6499 | 0 |
| FAM3C | 0.7 | 0 | 3 |
3.82×10⁻² | 0.2279 | 0.0720 | 0.9646 | 0 |
| INADL | 0.6667 | 1 | 2 |
3.26×10⁻⁵ | 0.0030 | 1.6994 | 0.4275 | 0 |
| RAB32 | 0.6667 | 0 | 3 |
3.02×10⁻² | 0.1990 | 0.4374 | 0.8036 | 0 |
| TOMM22 | 0.6 | 0 | 2 |
2.54×10⁻⁵ | 0.0028 | 1.6978 | 0.4279 | 0 |
| CUL7 | 0.4595 | 1 | 16 |
6.92×10⁻⁴ | 0.0234 | 1.0330 | 0.5966 | 0 |
| SSR3 | 0.4 | 0 | 2 |
1.04×10⁻³ | 0.0291 | 1.5003 | 0.4723 | 0 |
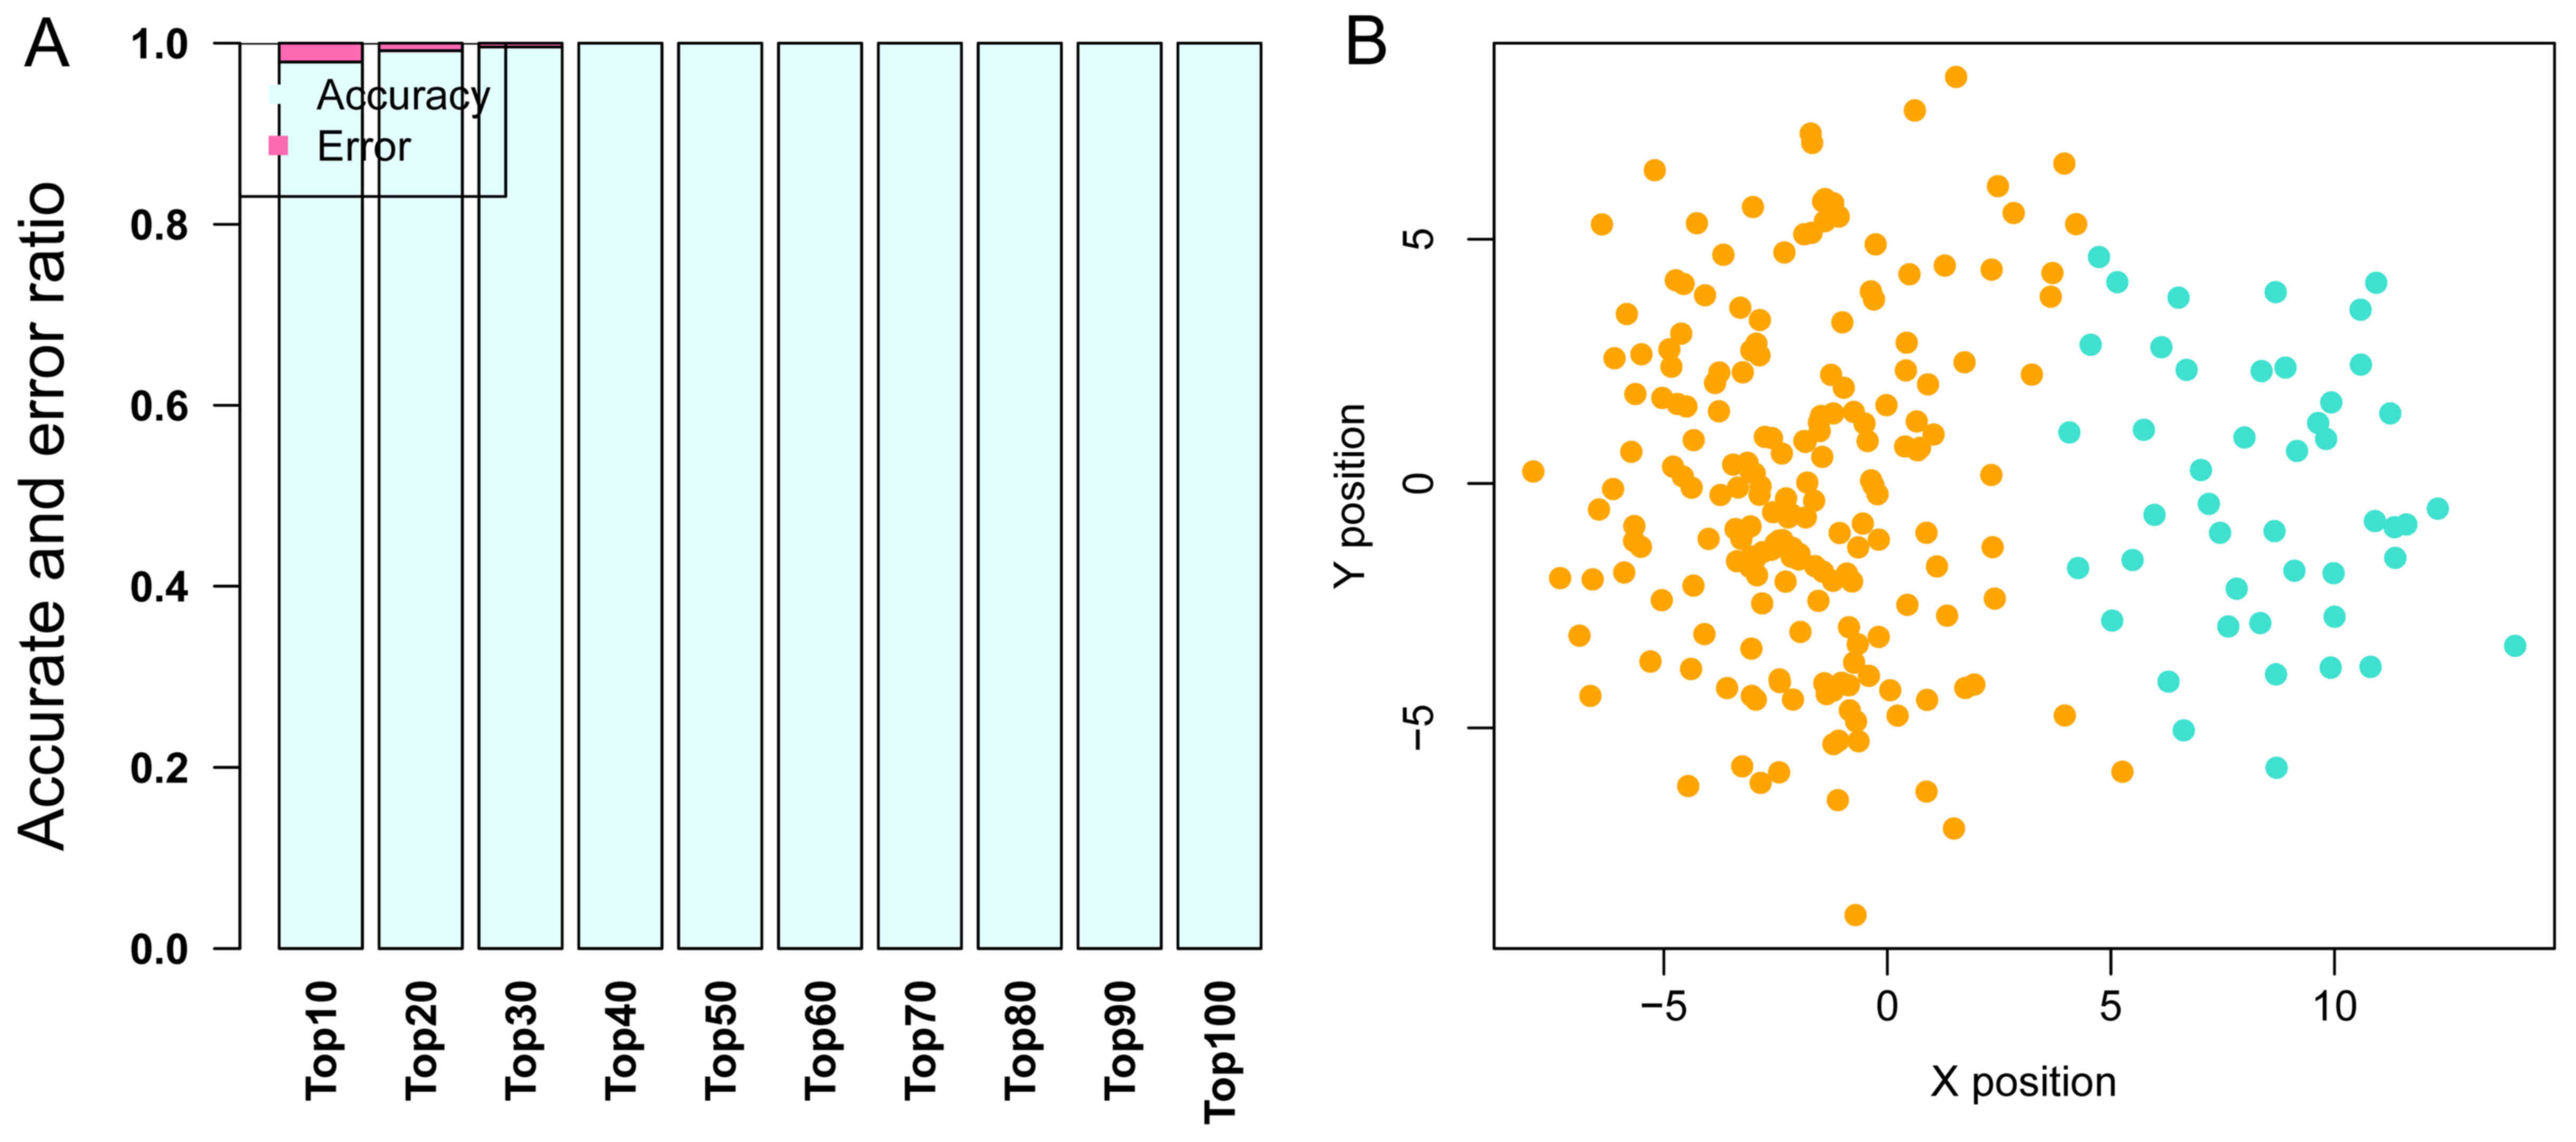
Optimal SVM classification model and
performance evaluation results
GSE68468, which includes 47 metastatic and 193
non-metastatic CRC samples, was used as the training dataset to
perform SVM classification training, until the SVM classification
was able to completely distinguish the two types of sample. In the
training process, as the number of DEGs was increased from the top
10 to the top 100, the precision of the SVM classification
increased from 98 to 100%. Notably, the precision remained at 100%
as the number of DEGs increased from the top 40 to the top 100.
Therefore, the DEGs whose BC value ranked within the top 40 were
selected to build the SVM classification model with a strong
ability to distinguish metastatic samples from non-metastatic ones.
The scattergram is shown in Fig.
4.
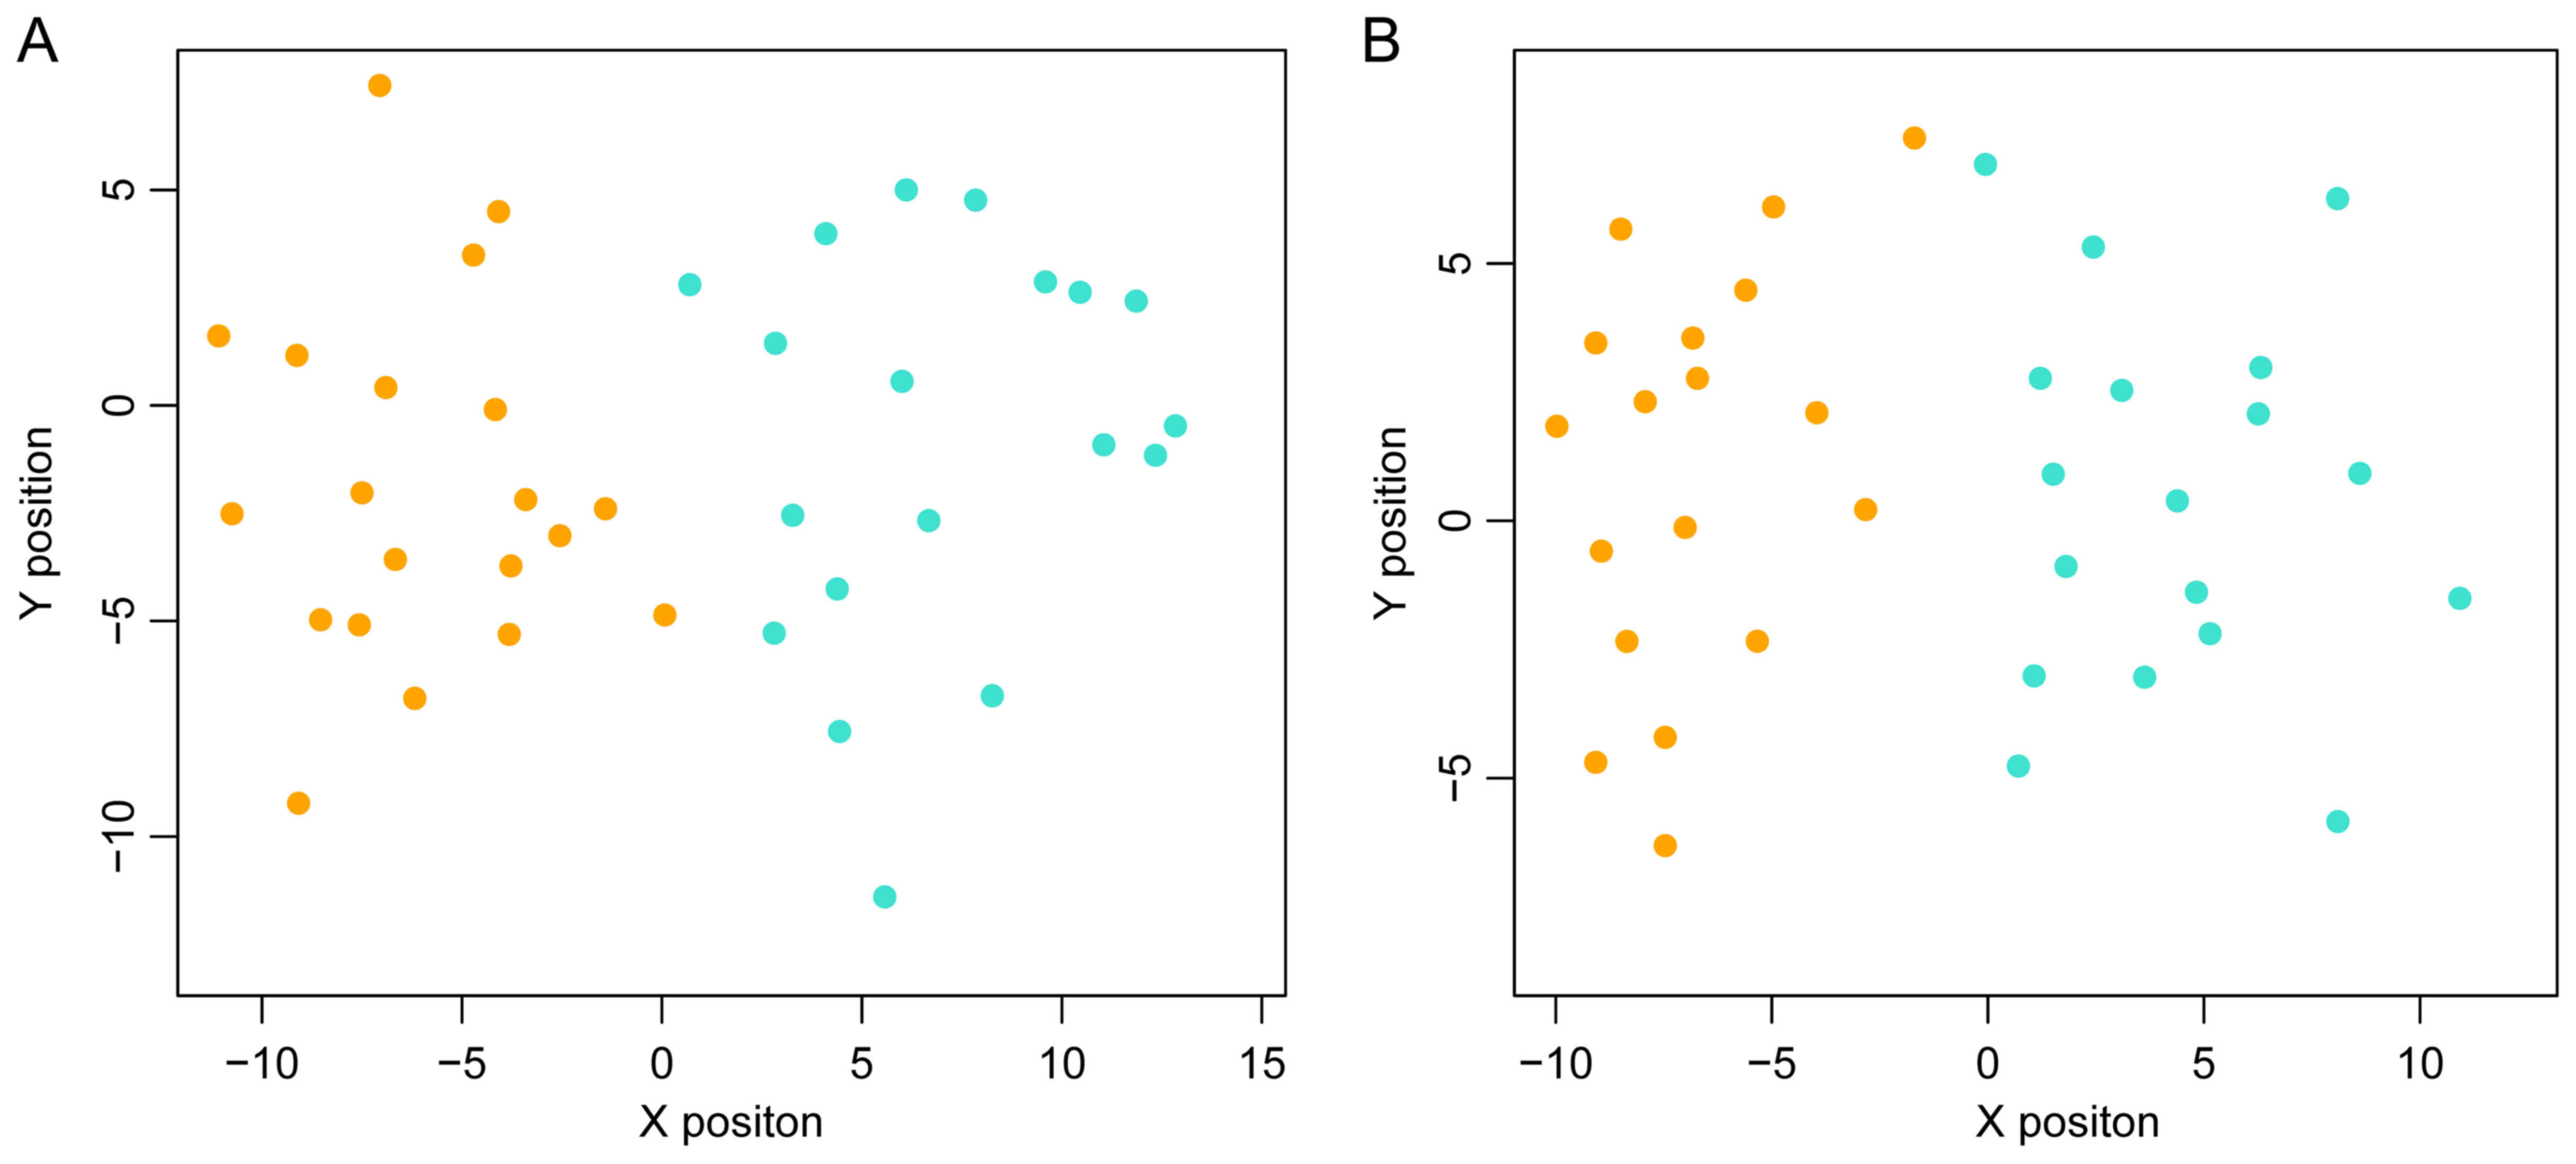
To determine whether the SVM classification
constructed using the top 40 genes was repeatable, two other
datasets, GSE62321 and GSE14297 were used to test the precision of
the classification. As shown in Fig.
5, this SVM classification was clearly able to distinguish
between metastatic and non-metastatic samples in these two
datasets.
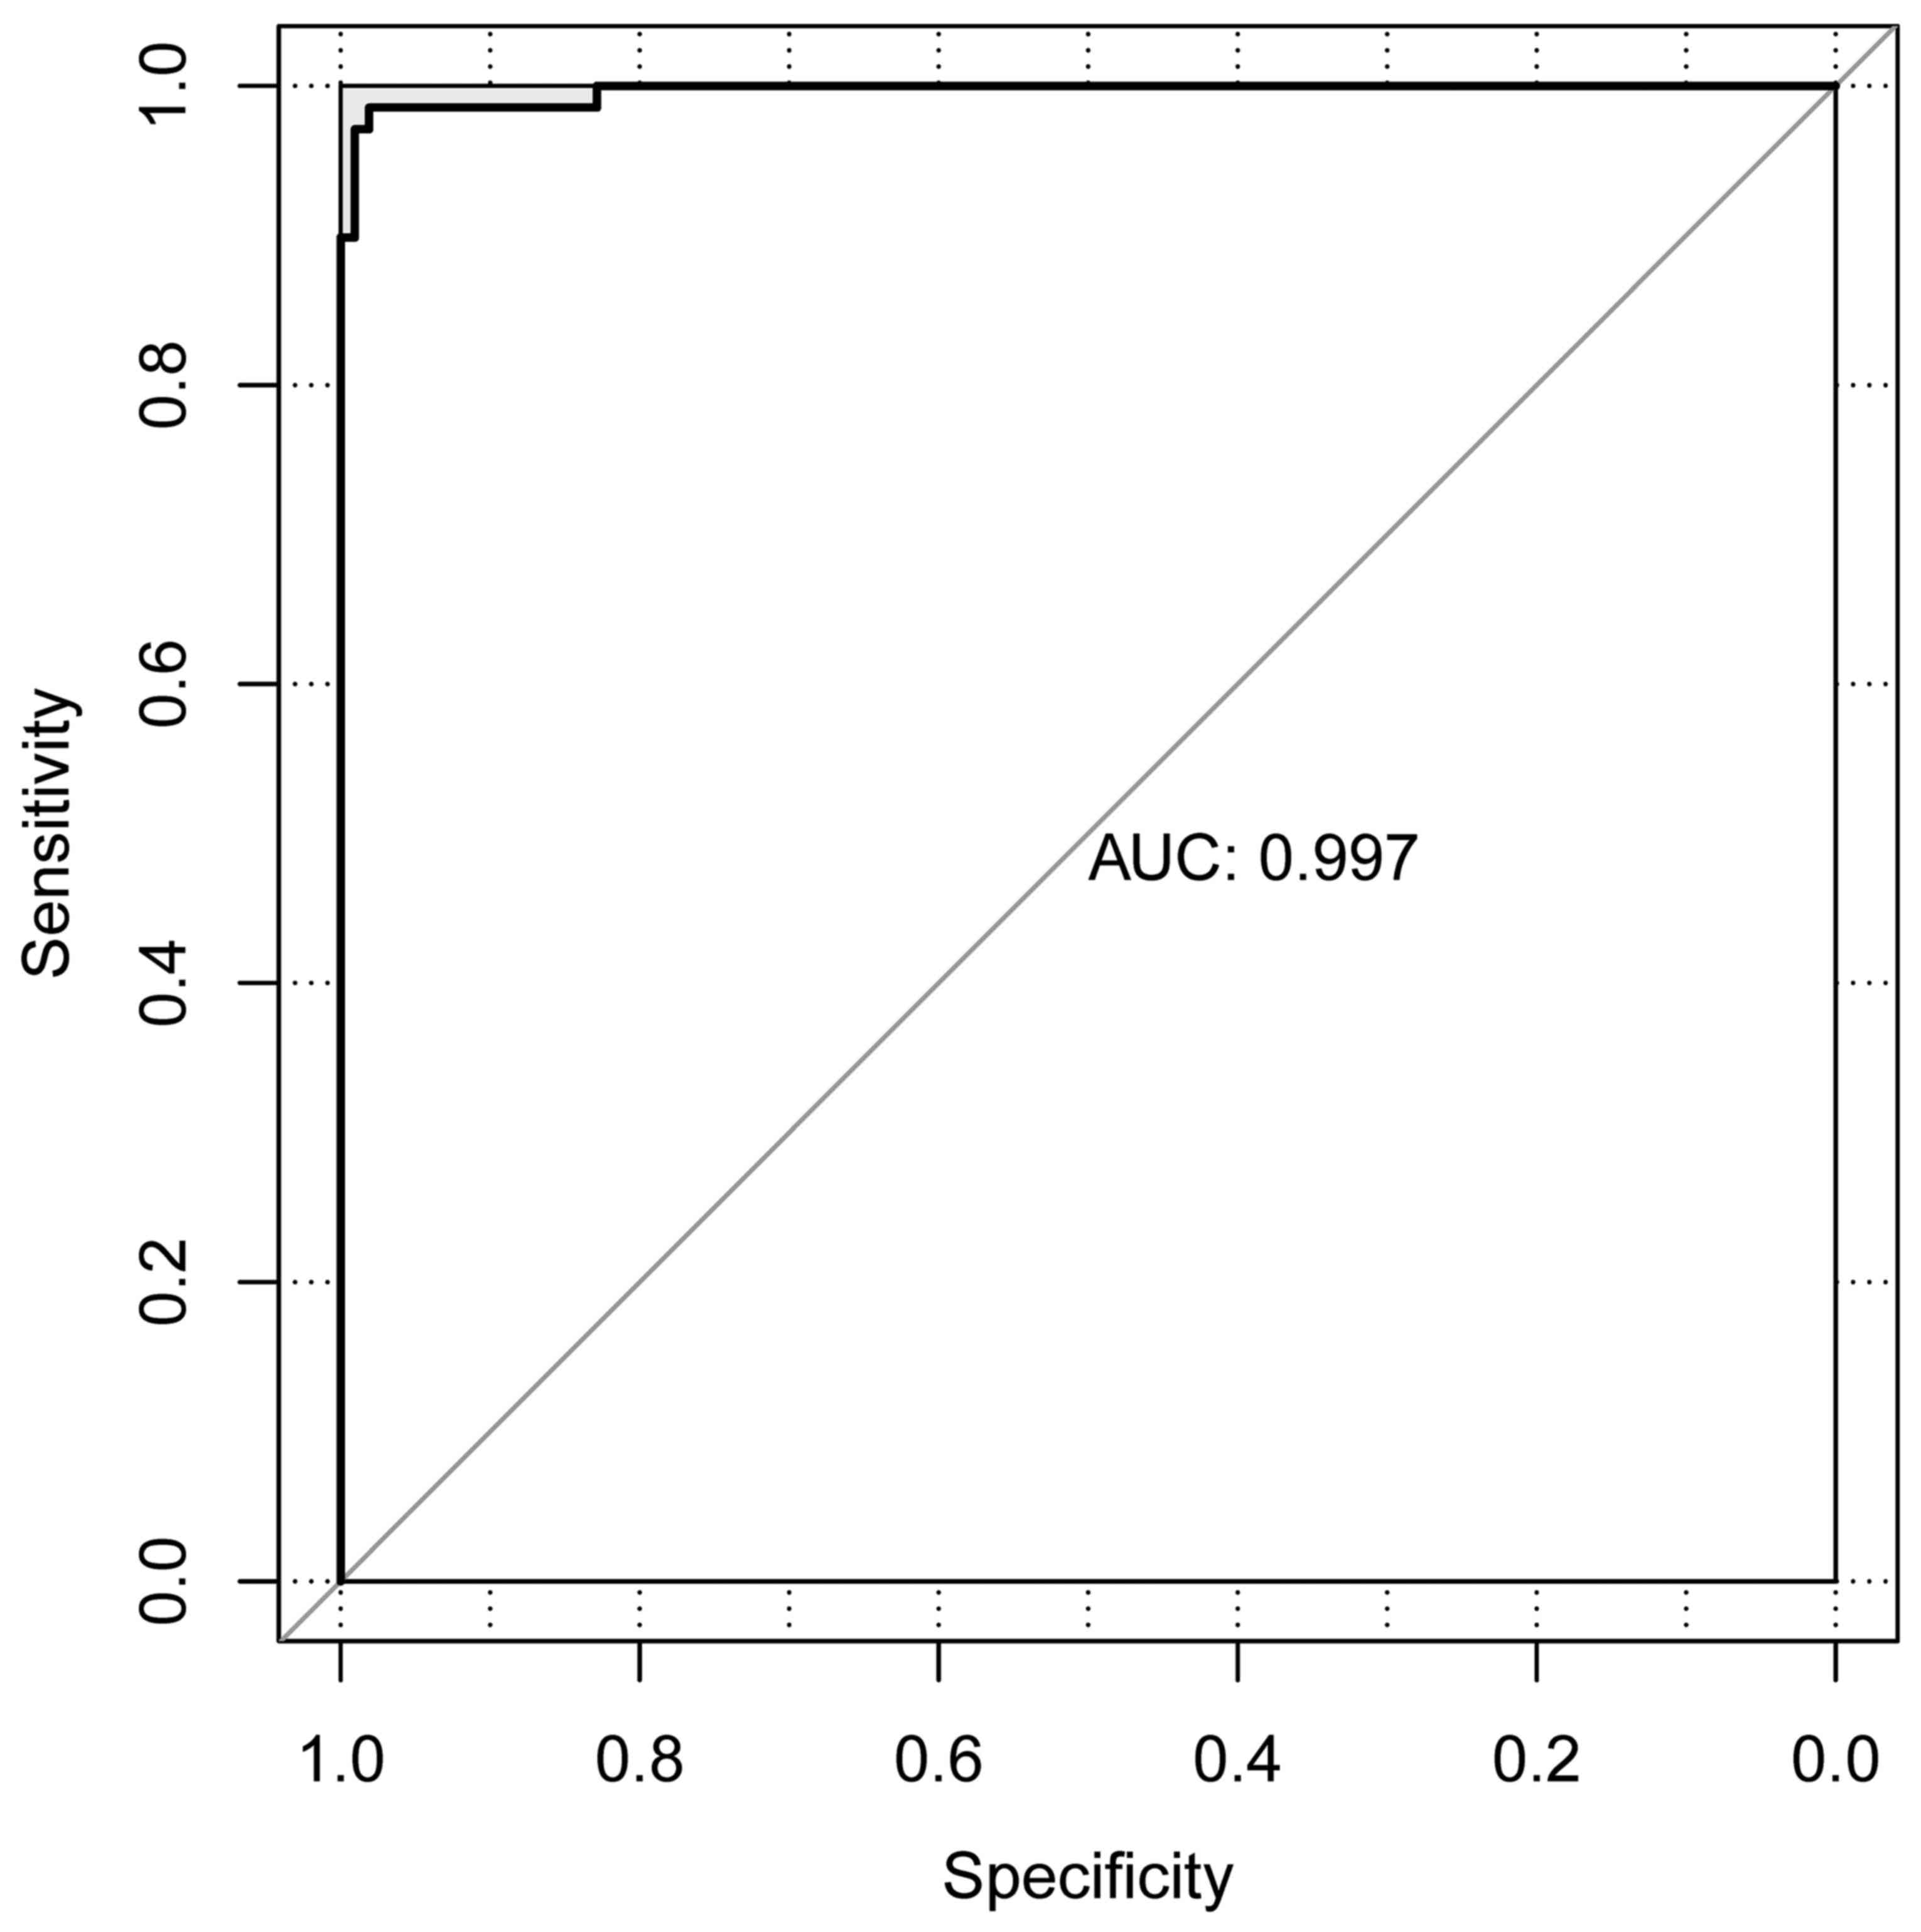
Validation results
The CRC dataset downloaded from TCGA was set as the
individual validation dataset, which was used to testify the
performance evaluation of the SVM classification. As a result, 13
metastatic and 76 non-metastatic samples were correctly identified.
Only 1 sample was wrongly classified and the area under the curve
was 0.997 (Fig. 6).
Pathways of the 40 DEGs
On the basis of Fisher's exact test, five pathways
were identified for these 40 DEGs (Table IV), namely protein processing in
endoplasmic reticulum (ER) [e.g., F-box protein 2 (FBXO2),
DnaJ heat shock protein family (Hsp40) member C10 (DNAJC10)
and SSR3], AMP-activated protein kinase (AMPK) signaling
pathway [e.g., protein kinase AMP-activated non-catalytic subunit β
2 (PRKAB2), phosphofructokinase, platelet (PFKP) and
CREB1], dorso-ventral axis formation [e.g.,
mitogen-activated protein kinase 1 (MAPK1) and notch 1
(NOTCH1)], ubiquitin mediated proteolysis [e.g.,
FBXO2, CUL7 and ubiquitin conjugating enzyme E2 D3
(UBE2D3)] and prion diseases (e.g., MAPK1 and
NOTCH1).
| Table IVPathway enrichment results of the
crucial 40 genes. |
Table IV
Pathway enrichment results of the
crucial 40 genes.
| Term | ID | Count | P-value | Genes |
|---|
| Protein processing
in ER | hsa04141 | 5 | 0.0089 | FBXO2, DNAJC10,
SSR3, CUL1, UBE2D3 |
| AMPK signaling
pathway | hsa04152 | 4 | 0.0144 | PRKAB2, PFKP,
PRKAA1, CREB1 |
| Dorso-ventral axis
formation | hsa04320 | 2 | 0.0188 | MAPK1, NOTCH1 |
| Ubiquitin mediated
proteolysis | hsa04120 | 4 | 0.0199 | FBXO2, CUL1, CUL7,
UBE2D3 |
| Prion diseases | hsa05020 | 2 | 0.0313 | MAPK1, NOTCH1 |
Discussion
The present study identified 40 SVM-classified
signature genes in metastatic CRC, including CREB1,
CUL7 and SSR3, which were significantly enriched in
protein processing in ER, AMPK signaling pathway and ubiquitin
mediated proteolysis functions. The precision of the SVM-classified
40 gene signatures was as high as 100%, and the validation using a
dataset from TCGA indicated that the majority of the metastatic and
non-metastatic samples could be clearly distinguished from each
other using these 40 genes.
CREB1 is a TF that belongs to the leucine zipper
family. The CREB1 gene is reported to increase the
proliferation of CRC cells, while the knockdown of CREB1
inhibits this process (28). In
addition, multiple microRNAs (miRs) function as tumor suppressors
in CRC development through targeting this gene, including miR-9,
miR-34b and miR-200b (29). A
soluble resistance-related calcium binding protein, sorcin, has
been demonstrated to increase the metastasis of CRC (30). Notably, the overexpression of
sorcin activates the CREB pathway by increasing the phosphorylation
of CREB1 (30), which implicates
the expression of CREB1 in CRC metastasis, as predicted in
the present study. AMPK is a heterotrimeric protein kinase that
serves as a metabolic master switch. AMPK induces apoptosis in the
development of CRC, and resveratrol is reported to exert
therapeutic effects via inhibition of the AMPK signaling pathway
(31). In the present study,
CREB1 was significantly enriched in the AMPK signaling
pathway, suggesting that the alteration of this gene may affect the
AMPK signaling pathway, whereby it may contribute to the metastasis
of CRC. Based on this finding, it may be inferred that the
CREB1-mediated AMPK signaling pathway has the potential to serve as
a therapeutic marker for the diagnosis of CRC metastasis.
As a major component of the ubiquitin proteasome
system, E3 ubiquitin ligases serve an important function in
orchestrating the substrate ubiquitination in the cullin, Skp and
F-box-containing complex (32).
Disruption of their roles is the primary cause of the occurrence of
various types of cancer (33).
The CUL7 protein is a complex of the E3 ubiquitin-protein ligase
that also comprises the S-phase kinase-associated protein 1,
F-box/WD repeat-containing protein 8 (FBXW8) and E3
ubiquitin-protein ligase RBX1 proteins. Reportedly, the CUL7/FBXW8
complex inhibits cell growth in gastric cancer by inducing the
expression of insulin receptor substrate 1 (34). The overexpression of CUL7
has been detected in hepatocellular carcinoma (HCC) tissues,
particularly in metastatic HCC, and in vitro experiments
have demonstrated that the knockdown of this gene pronouncedly
decreases the metastatic capacity of HCC (32). In addition, the expression of
CUL7 has been observed to be increased in non-small cell
lung cancer cells, with its high expression potentially promoting
the invasion and metastasis of these cells (35). Cyclin D1 is a vital protein for
cell proliferation in various types of cancer. Its activation is
controlled via the degradation caused by ubiquitin-mediated
proteolysis (36). In the present
study, CUL7 and its family member CUL1 were enriched
in the ubiquitin-mediated proteolysis pathway, suggesting that
their activation through this pathway may also regulate cell
proliferation in CRC. However, there is insufficient evidence
supporting the involvement of CUL7 in metastatic CRC. The results
of the present study indicate that CUL7 is a signature gene
that is able to distinguish between metastatic and non-metastatic
CRC. In combination with the previously reported findings that
CUL7 is involved in the metastasis of other cancers, it is
speculated that this gene may also be implicated in metastatic CRC,
and is activated via the ubiquitin-mediated proteolysis
pathway.
SSR is a glycosylated membrane receptor responsible
for protein entry into the ER (37). As one of the four SSR family
members, SSR3 is a non-glycosylated subunit that mediates the
translocation of nascent polypeptide through the ER membrane
(38). Reportedly, in pancreatic
cancer (PAC) and prostate cancer, the expression of SSR3 is
elevated, and the inhibition of this gene may weaken the potential
tumor growth of PAC (39,40). Furthermore, in a study using an
RNA sequencing method, it was predicted that SSR3 is a
target of a long noncoding RNA, RP5-890E16.4, that may have crucial
roles in esophageal squamous cell carcinoma (41). In murine breast tumor, SSR3
has been identified as a DEG associated with metastasis, using an
exon-based clustering method (42). However, to the best of our
knowledge, no further information is available concerning the role
of this gene in CRC progression, particularly in metastasis. In the
present study, SSR3 was demonstrated to be a critical gene
signature of metastatic CRC that was enriched in the protein
processing in ER pathway. Together, the aforementioned information
suggests that SSR3 may serve an important function in the
metastasis of CRC via involvement in the protein processing in ER
pathway, and could be used as a novel therapeutic target for the
treatment of metastatic CRC.
Despite these comprehensive analyses and the
precision of the SVM classifier, the present study has the
limitation that all the predicted results lack experimental
validation. Nevertheless, the findings are valuable as they provide
novel insights into the regulatory mechanisms of the metastasis of
CRC and identify novel biomarkers for the prognosis of this
disease.
In conclusion, the SVM-classified gene signatures in
the present study precisely distinguished metastatic CRC samples
from non-metastatic ones, using genes including CREB1,
CUL7 and SSR3. The genes could be used as biomarkers
for the prognosis of metastatic CRC. However, substantial
additional experiments are required to validate the predicted
expression levels and functions.
References
|
1
|
Haggar FA and Boushey RP: Colorectal
cancer epidemiology: Incidence, mortality, survival, and risk
factors. Clin Colon Rectal Surg. 22:191–197. 2009. View Article : Google Scholar :
|
|
2
|
Siegel R, Desantis C and Jemal A:
Colorectal cancer statistics, 2014. CA Cancer J Clin. 64:104–117.
2014. View Article : Google Scholar : PubMed/NCBI
|
|
3
|
Zhang B, Jia WH, Matsuda K, Kweon SS,
Matsuo K, Xiang YB, Shin A, Jee SH, Kim DH, Cai Q, et al: Genetics
and Epidemiology of Colorectal Cancer Consortium (GECCO);
Colorectal Transdisciplinary (CORECT) Study; Colon Cancer Family
Registry (CCFR): Large-scale genetic study in East Asians
identifies six new loci associated with colorectal cancer risk. Nat
Genet. 46:533–542. 2014. View
Article : Google Scholar : PubMed/NCBI
|
|
4
|
Zhang W, Glöckner SC, Guo M, Machida EO,
Wang DH, Easwaran H, Van Neste L, Herman JG, Schuebel KE, Watkins
DN, et al: Epigenetic inactivation of the canonical Wnt antagonist
SRY-box containing gene 17 in colorectal cancer. Cancer Res.
68:2764–2772. 2008. View Article : Google Scholar : PubMed/NCBI
|
|
5
|
Kunnumakkara AB, Diagaradjane P, Guha S,
Deorukhkar A, Shentu S, Aggarwal BB and Krishnan S: Curcumin
sensitizes human colorectal cancer xenografts in nude mice to
gamma-radiation by targeting nuclear factor-kappaB-regulated gene
products. Clin Cancer Res. 14:2128–2136. 2008. View Article : Google Scholar : PubMed/NCBI
|
|
6
|
Chaffer CL and Weinberg RA: A perspective
on cancer cell metastasis. Science. 331:1559–1564. 2011. View Article : Google Scholar : PubMed/NCBI
|
|
7
|
Di Nicolantonio F, Martini M, Molinari F,
Sartore-Bianchi A, Arena S, Saletti P, De Dosso S, Mazzucchelli L,
Frattini M, Siena S, et al: Wild-type BRAF is required for response
to panitumumab or cetuximab in metastatic colorectal cancer. J Clin
Oncol. 26:5705–5712. 2008. View Article : Google Scholar : PubMed/NCBI
|
|
8
|
Rychahou PG, Kang J, Gulhati P, Doan HQ,
Chen LA, Xiao SY, Chung DH and Evers BM: Akt2 overexpression plays
a critical role in the establishment of colorectal cancer
metastasis. Proc Natl Acad Sci USA. 105:20315–20320. 2008.
View Article : Google Scholar : PubMed/NCBI
|
|
9
|
Jorissen RN, Gibbs P, Christie M, Prakash
S, Lipton L, Desai J, Kerr D, Aaltonen LA, Arango D, Kruhøffer M,
et al: Metastasis-associated gene expression changes predict poor
outcomes in patients with dukes stage B and C colorectal cancer.
Clin Cancer Res. 15:7642–7651. 2009. View Article : Google Scholar : PubMed/NCBI
|
|
10
|
Smith JJ, Deane NG, Wu F, Merchant NB,
Zhang B, Jiang A, Lu P, Johnson JC, Schmidt C, Bailey CE, et al:
Experimentally derived metastasis gene expression profile predicts
recurrence and death in patients with colon cancer.
Gastroenterology. 138:958–968. 2010. View Article : Google Scholar
|
|
11
|
Ben-Hur A and Weston J: A user's guide to
support vector machines. Humana Press; 2010
|
|
12
|
Mourao-Miranda J, Reinders AA, Rocha-Rego
V, Lappin J, Rondina J, Morgan C, Morgan KD, Fearon P, Jones PB,
Doody GA, et al: Individualized prediction of illness course at the
first psychotic episode: A support vector machine MRI study.
Psychol Med. 42:1037–1047. 2012. View Article : Google Scholar :
|
|
13
|
Henneges C, Bullinger D, Fux R, Friese N,
Seeger H, Neubauer H, Laufer S, Gleiter CH, Schwab M, Zell A, et
al: Prediction of breast cancer by profiling of urinary RNA
metabolites using support vector machine-based feature selection.
BMC Cancer. 9:1042009. View Article : Google Scholar : PubMed/NCBI
|
|
14
|
Gabere MN, Hussein MA and Aziz MA:
Filtered selection coupled with support vector machines generate a
functionally relevant prediction model for colorectal cancer. Onco
Targets Ther. 9:3313–3325. 2016.PubMed/NCBI
|
|
15
|
Gross AM, Kreisberg JF and Ideker T:
Analysis of matched tumor and normal profiles reveals common
transcriptional and epigenetic signals shared across cancer types.
PLoS One. 10:e01426182015. View Article : Google Scholar : PubMed/NCBI
|
|
16
|
Del Rio M, Mollevi C, Vezzio-Vie N, Bibeau
F, Ychou M and Martineau P: Specific extracellular matrix
remodeling signature of colon hepatic metastases. PLoS One.
8:e74599. 2013. View Article : Google Scholar : PubMed/NCBI
|
|
17
|
Lin AY, Chua MS, Choi YL, Yeh W, Kim YH,
Azzi R, Adams GA, Sainani K, van de Rijn M, So SK, et al:
Comparative profiling of primary colorectal carcinomas and liver
metastases identifies LEF1 as a prognostic biomarker. PLoS One.
6:e166362011. View Article : Google Scholar : PubMed/NCBI
|
|
18
|
Stange DE, Engel F, Longerich T, Koo BK,
Koch M, Delhomme N, Aigner M, Toedt G, Schirmacher P, Lichter P, et
al: Expression of an ASCL2 related stem cell signature and IGF2 in
colorectal cancer liver metastases with 11p15.5 gain. Gut.
59:1236–1244. 2010. View Article : Google Scholar : PubMed/NCBI
|
|
19
|
Ki DH, Jeung HC, Park CH, Kang SH, Lee GY,
Lee WS, Kim NK, Chung HC and Rha SY: Whole genome analysis for
liver metastasis gene signatures in colorectal cancer. Int J
Cancer. 121:2005–2012. 2007. View Article : Google Scholar : PubMed/NCBI
|
|
20
|
Cho WK, Geimer S and Meurer J: Cluster
analysis and comparison of various chloroplast transcriptomes and
genes in Arabidopsis thaliana. DNA Res. 16:31–44. 2009. View Article : Google Scholar :
|
|
21
|
Bolstad BM, Irizarry RA, Astrand M and
Speed TP: A comparison of normalization methods for high density
oligonucleotide array data based on variance and bias.
Bioinformatics. 19:185–193. 2003. View Article : Google Scholar : PubMed/NCBI
|
|
22
|
Smyth GK; Limma: Linear models for
microarray data: Bioinformatics and Computational Biology Solutions
Using R and Bioconductor. Gentleman R, Carey VJ, Huber W, Irizarry
RA and Dudoit S: Statistics for Biology and Health. Springer; New
York, NY: 2005
|
|
23
|
Kang DD, Sibille E, Kaminski N and Tseng
GC: MetaQC: objective quality control and inclusion/exclusion
criteria for genomic meta-analysis. Nucleic Acids Res. 40:e152012.
View Article : Google Scholar :
|
|
24
|
Keshava Prasad TS, Goel R, Kandasamy K,
Keerthikumar S, Kumar S, Mathivanan S, Telikicherla D, Raju R,
Shafreen B, Venugopal A, et al: human Protein Reference Database -
2009 update. Nucleic Acids Res. 37:D767–D772. 2009. View Article : Google Scholar
|
|
25
|
Stark C, Breitkreutz BJ, Chatr-Aryamontri
A, Boucher L, Oughtred R, Livstone MS, Nixon J, Van Auken K, Wang
X, Shi X, et al: The BioGRID Interaction Database: 2011 update.
Nucleic Acids Res. 39:D698–D704. 2011. View Article : Google Scholar :
|
|
26
|
Kintali S: Betweenness Centrality :
Algorithms and Lower Bounds. Comput Sci. 0809.1906v22008.
|
|
27
|
Guyon I, Weston J, Barnhill S and Vapnik
V: Gene Selection for Cancer Classification using Support Vector
Machines. Mach Learn. 46:389–422. 2002. View Article : Google Scholar
|
|
28
|
Li P, Xue WJ, Feng Y and Mao QS:
MicroRNA-205 functions as a tumor suppressor in colorectal cancer
by targeting cAMP responsive element binding protein 1 (CREB1). Am
J Transl Res. 7:2053–2059. 2015.PubMed/NCBI
|
|
29
|
Wang YW, Chen X, Ma R and Gao P:
Understanding the CREB1-miRNA feedback loop in human malignancies.
Tumour Biol. 37:8487–8502. 2016. View Article : Google Scholar : PubMed/NCBI
|
|
30
|
Tong W, Sun D, Wang Q and Suo J: Sorcin
enhances metastasis and promotes epithelial-to-mesenchymal
transition of colorectal cancer. Cell Biochem Biophys. 72:453–459.
2015. View Article : Google Scholar : PubMed/NCBI
|
|
31
|
Hwang JT, Kwak DW, Lin SK, Kim HM, Kim YM
and Park OJ: Resveratrol induces apoptosis in chemoresistant cancer
cells via modulation of AMPK signaling pathway. Ann NY Acad Sci.
1095:441–448. 2007. View Article : Google Scholar : PubMed/NCBI
|
|
32
|
Zhang D, Yang G, Li X, Xu C and Ge H:
Inhibition of liver carcinoma cell invasion and metastasis by
knockdown of cullin7 in vitro and in vivo. Oncol Res. 23:171–181.
2016. View Article : Google Scholar : PubMed/NCBI
|
|
33
|
Satija YK, Bhardwaj A and Das S: A
portrayal of E3 ubiquitin ligases and deubiquitylases in cancer.
Int J Cancer. 133:2759–2768. 2013.PubMed/NCBI
|
|
34
|
Chen P and Yao GD: The role of cullin
proteins in gastric cancer. Tumour Biol. 37:29–37. 2016. View Article : Google Scholar
|
|
35
|
Song Q, Wang L, Lu Y, Zhang J and Fu J:
Abstract 2008: CUL7 promotes non-small cell lung cancer cells
migration and invasion. Cancer Res. 74(Suppl 19): 20082014.
View Article : Google Scholar
|
|
36
|
Achiwa Y, Hasegawa K and Udagawa Y: Effect
of ursolic acid on MAPK in cyclin D1 signaling and RING-type E3
ligase (SCF E3s) in two endometrial cancer cell lines. Nutr Cancer.
65:1026–1033. 2013. View Article : Google Scholar : PubMed/NCBI
|
|
37
|
Wang L and Dobberstein B: Oligomeric
complexes involved in translocation of proteins across the membrane
of the endoplasmic reticulum. FEBS Lett. 457:316–322. 1999.
View Article : Google Scholar : PubMed/NCBI
|
|
38
|
Chen HZ, Wen Q, Wang WJ, He JP and Wu Q:
The orphan nuclear receptor TR3/Nur77 regulates ER stress and
induces apoptosis via interaction with TRAPγ. Int J Biochem Cell
Biol. 45:1600–1609. 2013. View Article : Google Scholar : PubMed/NCBI
|
|
39
|
Dehm SM and Tindall DJ: Molecular
regulation of androgen action in prostate cancer. J Cell Biochem.
99:333–344. 2006. View Article : Google Scholar : PubMed/NCBI
|
|
40
|
Chen Y, Jesnowski R and Löhr JM: Cloning
and characterization of genes differentially expressed in human
pancreatic carcinoma. Z Gastroenterol. 43:2005. View Article : Google Scholar
|
|
41
|
Li Y, Shi X, Yang W, Lu Z, Wang P, Chen Z
and He J: Transcriptome profiling of lncRNA and co-expression
networks in esophageal squamous cell carcinoma by RNA sequencing.
Tumour Biol. 37:13091–13100. 2016. View Article : Google Scholar : PubMed/NCBI
|
|
42
|
Dutertre M, Lacroix-Triki M, Driouch K, de
la Grange P, Gratadou L, Beck S, Millevoi S, Tazi J, Lidereau R,
Vagner S, et al: Exon-based clustering of murine breast tumor
transcriptomes reveals alternative exons whose expression is
associated with metastasis. Cancer Res. 70:896–905. 2010.
View Article : Google Scholar : PubMed/NCBI
|