Introduction
Pseudomonas aeruginosa (PA) is an ubiquitous
Gram-negative bacterium that inhabits a wide array of natural
environments, and is important in a clinical context, as it is a
multi-antibiotic-resistant human pathogen associated with hospital
infections (1,2) and is a major cause of morbidity and
mortality in patients with cystic fibrosis (CF). PA colonizes the
lower respiratory and gastrointestinal tracts, as well as the
mucosa and skin of hospitalized patients treated with
broad-spectrum antibiotics. The development of chronic PA
respiratory infections is mediated through a complex adaptive
process that effects essential physiological changes in both
bacterial cells and the host, that allow PA to survive and persist
in the host environment. PA cells secrete small molecules that act
as specific chemical signals to positively regulate pathogenic
pathways (3), which direct the
production of virulence factors for pathogenic infection, host
colonization and interspecies microbial interactions (4). Knowledge on the bacterial signals
required to promote the pathogen adaptation and/or transition from
acute to chronic infection remains rudimentary (5).
Bacterial cell walls are complex, consisting of
integrated macromolecules including carbohydrates, lipids and
proteins (6). The structure and
synthesis of these cell walls is unique, with many of the
components not found anywhere else in nature (7). Current understanding of bacterial
cell wall structures is based on data derived from the destructive
analyses of its individual components (7), and as such, this in vitro
data may not faithfully reflect the native structural and
conformational information. An alternative approach to such
analyses is the non-targeted profiling of the physiological state
of bacterial cells, such as metabolomic profiling.
Metabolomics is the comprehensive determination of
the low molecular weight metabolite complement within a biological
sample. As metabolites are downstream from gene transcription and
enzyme activities, metabolomics has the potential to provide a more
accurate snapshot of the actual physiological state of a cell or
cells, as opposed to transcriptome and proteome profiling (8).
To this end, metabolomics has been used to study the
responses of bacteria to different physiological states and
stressors (9–11), and nuclear magnetic resonance
(NMR) spectroscopy has been employed to profile microbial species
for differentiation and classification, including in vivo
profiles of yeast strains, and of marine unicellular algae via
magic-angle spinning (12).
Cell high-resolution magic-angle spinning (HRMAS)
NMR spectroscopy can be used to distinguish detailed structures
present on bacteria (13,14). Moreover, multi-dimensional HRMAS
NMR is a powerful tool for the in vivo analysis of live
bacterial cells (15). HRMAS is a
novel non-destructive methodology that substantially improves
spectral line-widths to allow high-resolution spectra to be
obtained from intact cells, cell tissue cultures (16,17) and unprocessed tissues (18,19). 1H HRMAS NMR has also
enabled the investigation of the associations between metabolites
and cellular processes (21), and
NMR spectroscopic analyses have reported the presence of bacteria
and PA on extracted cells (22).
To avoid chemical modifications by the extraction/purification of
metabolites, and to maintain cell integrity, in the present study,
we applied HRMAS NMR methodology to live PA to characterize and
quantify the metabolic profile of these cells and their surface
structures. We also specifically focus on specific metabolites that
are likely involved in PA-mediated host inflammation.
Materials and methods
Cell samples
The PA strain used in the present study was RifR
human clinical isolate UCBPP-PA14. The mutants of PA14 described in
this study are isogenic to UCBPP-PA14. The bacteria were grown at
37°C in Luria-Bertani (LB) broth or on plates of LB agar containing
appropriate antibiotics or the compounds, unless mentioned
otherwise. The overnight PA14 cultures were grown in LB and diluted
the following day in fresh medium in triplicate. A total of 10 ml
of culture adjusted to an OD600 of 2.0 nm was
centrifuged, and the pellet was washed once with PBS.
NMR spectroscopy
Following bacterial growth in LB to an
OD600 of 2.5, bacterial samples (50 and 40 µl)
were introduced into the 4-mm Zr rotor and 10 µl
D2O (deuterium lock reference) containing 10 mM
trimethylsilyl propionic-2,2,3,3-d4 acid (TSP;
Mw=172, δ=0 ppm, external chemical shift reference) was
added to the rotor with the sample plus 10 µl
TSP/D2O solution (50 mM). 1H HRMAS NMR
spectroscopy experiments were performed on a Bruker Bio-Spin Avance
NMR spectrometer (600.13 MHz) using a 4-mm triple resonance
(1H, 13C, 2H) HRMAS probe (Bruker
Biospin Corp, Billerica, MA, USA). The temperature was controlled
at 4°C by a BTO-2000 unit in combination with a MAS pneumatic unit
(Bruker).
Samples were spun at 3,000 Hz, and two different
types of one-dimensional (1D) proton spectra were acquired using a
water-suppressed spin-echo Carr-Purcell-Meiboom -Gill (CPMG) pulse
sequence [90°-(τ-180°-τ)n-acquisition], as previously described
(23). CPMG includes inter-pulse
delay (τ=2π/ωr=400 µsec); 256 transients; spectral width of
7.2 kHz; 8 k data points; and TR=3 sec. Further investigation of
the metabolites was performed using a novel approach that combines
a two-dimensional (2D), solid-state, HRMAS proton (1H)
NMR method, total through-bond correlation spectroscopy (TOBSY)
(24), which maximizes the
advantages of HRMAS, and a robust classification strategy. Typical
acquisition parameters were as follows: 2 k points direct dimension
(13 ppm spectral width), 200 points indirect dimension (7.5 ppm
spectral width), 8 scans with 2 dummy scans, 1 sec water
pre-saturation, 2 sec total repetition time, 45 msec mixing time
and total acquisition time 45 min.
Quantification of metabolites
Concentrations using MestReC software (Mestrelab
Research, Santiago de Compostela, Spain), an automated fitting
routine based on the Levenberg-Marquardt algorithm, was applied
after manual peak selection, adjusting peak positions, intensities,
linewidths and Lorentzian/Gaussian ratio until the residual
spectrum was minimized, as previously described (25,26). The metabolite concentration
(mol/kg) was calculated using the following equation:
Mass TSP(mg)Mol Weight(TSP)×Met Peak AreaTSP Peak Area×NTSPNMET×1,000g/kgSample Weight(mg)
where mass TSP was constant (0.069 mg), the molecular weight of
TSP=172.23 g/mol, metabolites (Met), NTSP is the number
of proton of TSP (9 1H) and NMet is the
number of proton of metabolites, as previously described (
27).
Statistical analysis
The data are presented as the means ± standard
error. Statistical analysis was performed using the Student's
t-test: two paired samples were used for means. A p-value <0.05
was considered to indicate a statistically significant difference
(Table I).
 | Table I1H chemical shift (δ, ppm)
of metabolites detected in 1D and 2D HRMAS spectra of bacterial
cells. |
Table I
1H chemical shift (δ, ppm)
of metabolites detected in 1D and 2D HRMAS spectra of bacterial
cells.
| Entry | Metabolite | δ
1H | Assignment | PA14 (mmol/g) | 2-AA (mmol/g) | % Δ | p-value |
|---|
| 1 | Leucine | 0.95 (d) |
δ-CH3 | 0.40±0.05 | 0.51±0.11 | +28 | 0.40 |
| 0.97 (d) |
δ-CH3 | | | | |
| 1.70 | γ-CH | | | | |
| 1.72 |
β-CH2 | | | | |
| 3.75 | α-CH | | | | |
| 2 | Ile | 0.99 (d) |
δ-CH3 | 0.15± 0.03 | 0.22±0.06 | +47 | 0.18 |
| 1.94 |
β-CH2 | | | | |
| 3.75 | α-CH | | | | |
| 3 | Valine | 0.99 (d) |
γ-CH3 | 0.21±0.02 | 0.32±0.05 | +52 | 0.11 |
| 1.04 (d) |
γ-CH3 | | | | |
| 2.25 | β-CH | | | | |
| 3.61 | α-CH | | | | |
| 4 | Lactate | 1.33 (d) | CH3 | 0.10±0.02 | 0.20±0.02 | +100 | 0.009 |
| 4.11 (q) | CH | | | | |
| 5 | Alanine | 1.48 (d) |
β-CH3 | 0.22±0.02 | 0.38±0.03 | +73 | 0.006 |
| 3.79 (q) | α-CH | | | | |
| 6 | Lysine | 3.04 (t) |
ε-CH2 | 0.21±0.03 | 0.18±0.03 | −14 | 0.45 |
| 1.73 |
δ-CH2 | | | | |
| 1.48 |
γ-CH2 | | | | |
| 1.91 |
β-CH2 | | | | |
| 3.79 (t) | α-CH | | | | |
| 7 | Phospholipids | 0.89 | CH3 | Traces | Traces | | |
| 1.27 | CH2 | | | | |
| 3.27 |
N+(CH3)3 | | | | |
| 8 | Glutamate | 2.35 |
γ-CH2 | 0.16±0.04b | 0.22±0.05b | +38 | 0.35 |
| 2.06, 2.15 |
β-CH2 | | | | |
| 3.77 (t) | α-CH | | | | |
| 9 | Glutamine | 2.48 |
γ-CH2 | 0.089a | 0.08±0.004b | – | – |
| 2.14 |
β-CH2 | | | | |
| 3.79 (t) | α-CH | | | | |
| 10 | Glutathione | 2.55 | γ-CH2
Glu | Traces | Traces | | |
| 2.16 | β-CH2
Glu | | | | |
| 3.80 | α-CH Glu | | | | |
| 2.96 | β-CH2
Cys | | | | |
| 4.57 | α-CH Cys | | | | |
| 3.77 | CH2
Gly | | | | |
| 11 | Aspartic acid | 2.68, 2.82 |
β-CH2 | nd | 0.041a | | |
| 3.90 (dd) | α-CH | | | | |
| 12 | Cysteine | 3.05, 3.08 |
β-CH2 | 0.24±0.05b | 0.25±0.05 | +4 | 0.81 |
| 3.98 | α-CH | | | | |
| 13 | Creatine | 3.04 (s) |
NCH3 | Traces | Traces | | |
| 3.92 (s) | CH2 | | | | |
| 14 | Acetate | 1.92 (s) | CH3 | 0.31±0.05 | 1.05±0.24 | +239 | 0.04 |
| 15 | Phosphocholine | 3.21 (s) |
N(CH3)3 | 0.04±0.01 | 0.07±0.01 | +75 | 0.20 |
| 3.60 |
NCH2 | | | | |
| 4.17 |
OCH2 | | | | |
| 16 | Betaine
compound | 3.27 |
NCH3 | 0.45±0.03 | 1.31±0.3 | +191 | 0.04 |
| 3.90 |
NCH2 | | | | |
| 17 | Glycine | 3.56 (s) | CH2 | 0.45±0.19b | 0.66±0.32 | +47 | 0.50 |
| 18 | N-Ac-from PS | 2.01 (s) | CH3 | 0.26±0.02 | 0.46±0.01 | +77 | 0.01 |
| 2.08 | CH3 | | | | |
| 2.33 | | | | | |
| 2.39 | CH2 | | | | |
| 4.32 | CH2 | | | | |
| 4.41 | CH2 | | | | |
| 5.44 | CH2 | | | | |
| 19 | Citrulline | 1.54 |
β-CH2 | 0.15±0.01 | 0.32±0.02 | +113 | 0.003 |
| 1.88 |
γ-CH2 | | | | |
| 3.15 |
δ-CH2 | | | | |
| 3.76 | α-CH | | | | |
| 20 | Uracil | 5.80 | 5-CHur | Traces | nd | | |
| 7.53 | 6-CHur | | | | |
| 21 | NAD | 8.21 | N5 ring | Traces | Traces | | |
| 8.93 | N3 ring | | | | |
| 9.23 | N2 ring | | | | |
| 9.44 | N6 ring | | | | |
| 22 | Tyrosine | 3.06,3.15 |
β-CH2 | nd | Traces | | |
| 3.93 (dd) | α-CH | | | | |
| 6.88 | Hortho | | | | |
| 7.18 | Hmeta | | | | |
| 23 | UDP | 5.98. | 1-CHrib | Related | Related | | |
| 4.38 | 2-CHrib | to N-Ac | to N-Ac | | |
| 4.34 | 3-CHrib | | | | |
| 4.23 | 4-CHrib | | | | |
| 4.02 | 5-CHrib | | | | |
| 5.97 | 4-CHur | | | | |
| 8.11(d) | 5-CHur | | | | |
| 24 | Phenylalanine | 3.11, 3.28 |
β-CH2 | nd | Traces | | |
| 3.98 | α-CH | | | | |
| 7.33 | Hortho | | | | |
| 7.38 | Hpara | | | | |
| 7.43 | Hmeta | | | | |
Microarray hybridization
Biotinylated cRNA was generated with 10 µg
total cellular RNA, according to the protocol outlined by
Affymetrix Inc. (Santa Clara, CA, USA). cRNA was hybridized onto
GeneChip P. aeruginosa Genome Array oligonucleotide arrays
(Affymetrix Inc.), stained, washed and scanned according to the
Affymetrix protocol.
Genomic data analysis
The PA14 cells were grown in 50 ml of Luria-Bertani
(LB) broth at 37°C without agitation and with 3.0 mM
2-aminoacetophenone (2-AA). Triplicate samples from 2 independent
experiments were harvested at OD600=2.0, and total RNA
was purified using the RNAeasy spin column (Qiagen, Valencia, CA).
The quality of the RNA was analyzed using a BioAnalyzer system
(Agilent Technologies, Santa Clara, CA, USA). cDNA synthesis,
labeling and hybridization was performed according to the
GeneChip® P. aeruginosa Genome array (Affymetrix
Inc).
The Affymetrix DAT files were processed using the
Affymetrix-Gene Chip Operating System (GCOS) to create. Cel
files. The raw intensity. Cel files from the 12 chips, 3
replicates each, were normalized by robust multi-chip analysis
(RMA) (Bioconductor release 1.7) with PM-only models. Array quality
control (QC) metrics generated by Affymetrix Microarray Suite 5.0
were used to assess the hybridization quality. The normalized
expression values were analyzed by significance analysis of
microarrays (SAM) using the permuted unpaired two-class test. Three
replicates of PA14 in the absence of 2-AA were used as the controls
and the experimental groups consisted of 2-AA-treated PA14 cultures
in 3 replicates. Genes whose transcript levels exhibited either up-
or downregulation (absolute fold change of >1.5) and a q-value
of <20% in response to 2-AA treatment versus the controls were
further analyzed.
Results and Discussion
NMR metabolomic and genomic analysis was carried out
on PA, strain PA14. A representative 1D 1H CPMG HRMAS
NMR spectrum obtained from live bacterial cells of the PA14 strain
is shown in Fig. 1. The spectrum
allows for the direct identification of several metabolites, such
as aminoacids, osmolites and phospholipids [1, leucine; 2,
isoleucine; 3, valine; 4, lactate; 5, alanine; 6, lysine; 7, bonded
alanine; 8, phospholipids; 9, glutamate; 10, glutamine; 12,
aspartate; 16, phosphor-choline; 17, betaine compounds; 18,
glycine; 19, uridine monophosphate (UMP); 22, citrulline; 24,
nicotinamide adenine dinucleotide (NAD)]. This novel approach to
bacterial cell analysis is fast and provides important information.
However, the peaks overlap in the 1D NMR spectra, and it is thus
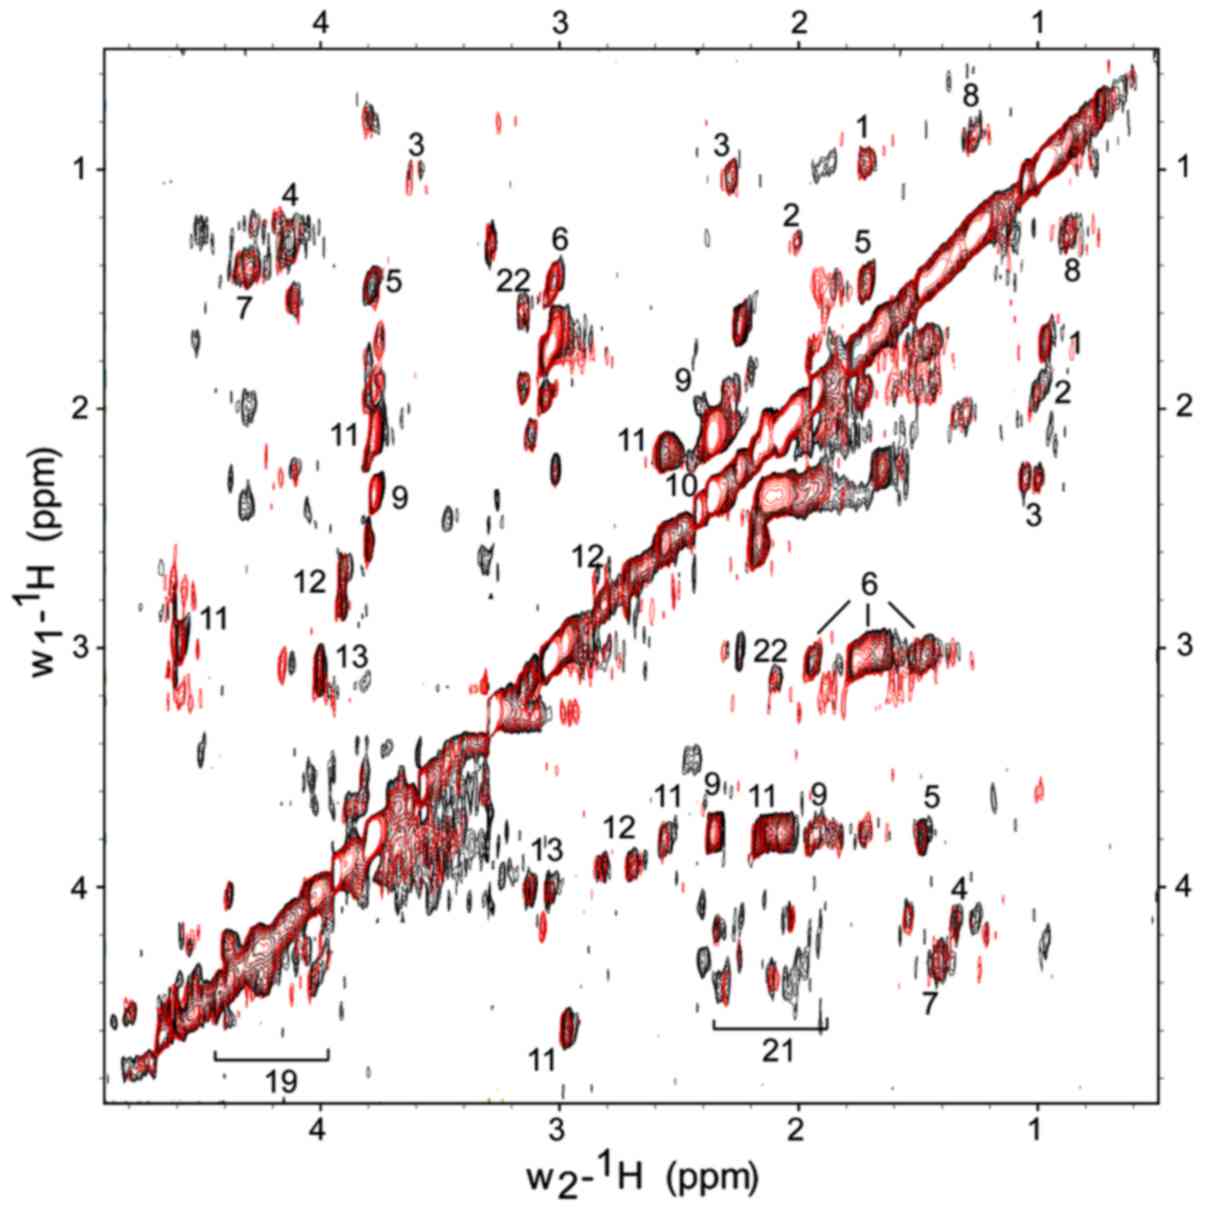
difficult to assign particular peaks to specific molecules. 2D
1H-1H TOBSY HRMAS was performed in order to
better identify and resolve particular molecules, thus completing
the metabolic profiling of bacterial cells (Fig. 2). Fig. 2 shows representative superimposed
2D 1H-1H TOBSY HRMAS NMR spectra of PA14 and
PA14 + 2-AA. Compared to 1D spectra, 2D NMR spectra allowed for the
clearer discrimination of signals. In the 2D NMR spectra,
additional metabolites were identified, such as: 11, glutathione;
13, cysteine; 21, N-acetyl signal; 23, tyrosine; 24, phenylalanine.
As shown for the TOBSY MR spectra, the capsular polysaccharides
were identified due to their N-acetyl signal (represented by the
number 21) (2.02÷2.33/4.10÷4.33 ppm). In addition, glutathione
(represented by the number 11), a major cell antioxidant, was
detected with higher resolution than in the 1D spectrum. The major
difference was in the 18 signals derived from the N-acetyl
compound.
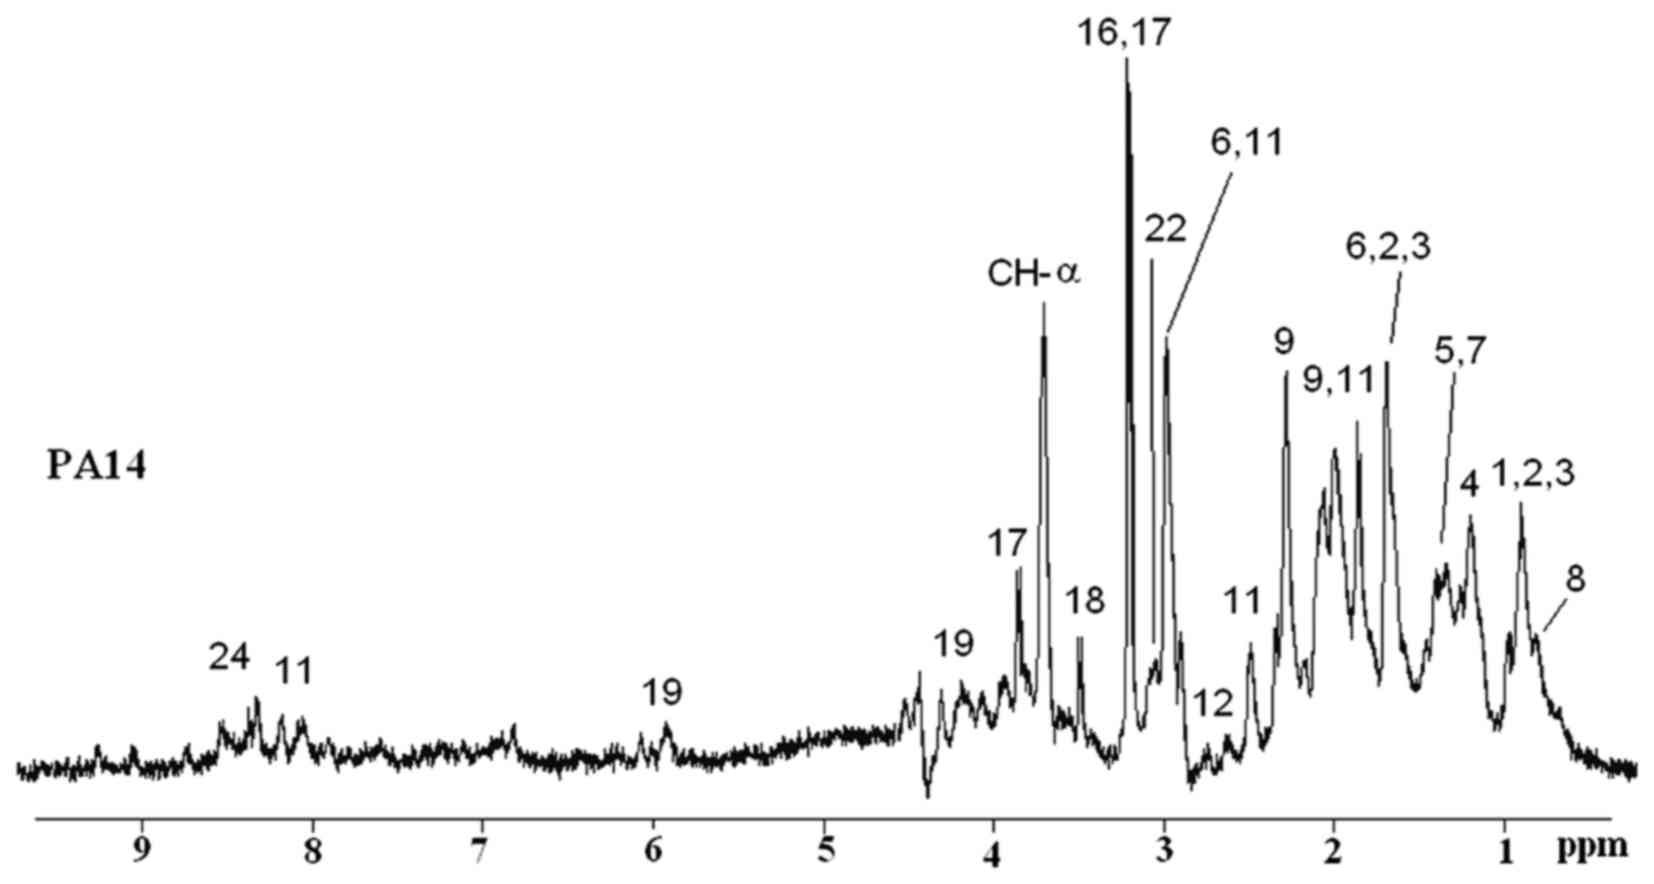 | Figure 1One-dimensional (1D)
1H-Carr-Purcell-Meiboom-Gill (CPMG) of PA14 are
reported, and different metabolites are labeled: 1, leucine; 2,
isoleucine; 3, valine; 4, lactate; 5, alanine; 6, lysine; 7, bonded
alanine; 8, phospholipids; 9, glutamate; 11, glutathione; 12,
aspartate; 16, choline; 17, betaine compounds; 18, glycine; 19,
uridine monophosphate (UMP); 22, citrulline; 24, nicotinamide
adenine dinucleotide (NAD). |
The 24 metabolites were identified from the combined
analysis of the 1D and 2D spectra of PA and are listed in Table I. We detected N-acetyl compound
(signal at 2.02÷2.33/4.10÷4.33 ppm), which is a constituent of the
capsular polysaccharides (28).
The use of TOSBY in HRMAS enabled us to detect all these
metabolites, even when they were present in small amounts and
hidden within other resonances (Fig.
2). The acetylation of bacterial surface polysaccharides, such
as capsular polysaccharides (CPSs), is common in pathogens and has
been shown to have immunogenic and functional importance (29). Other metabolites, such as betaine
compounds were also detected. These molecules are well known to act
as osmoprotectors and have been shown to preserve L-homoserine
lactone (HSL), the Pseudomonas Quinolone Signal (PQS) and
2-heptyl-4-quinolone (HHQ) bacterial cell-to-cell signaling
(30). Betaine is synthesized
from betaine aldehyde via the betB gene product (31). Betaine compounds were increased by
2-AA, thus indicating that 2-AA promotes osmoprotection to possibly
increase bacterial survival in harsh conditions of the host
environment.
The expression of the enzyme betaine aldehyde,
NAD(P)+ oxidoreductase [EC .2.1.8, betaine aldehyde
dehydrogenase (BADH)], involved in the second step of choline
metabolism; betaine aldehyde dehydrogenase is induced by choline
even when PA cells are grown in the presence of other carbon and
nitrogen sources, such as glucose and ammonium (33). BADH from PA thus appears to be a
suitable target for antimicrobial agents. In addition, in order to
participate in the catabolism of choline, this enzyme may be
crucial in the mechanisms of defense against osmotic and oxidative
stress, both of which are conditions present in infected tissues
(34). The acid product of the
BADH from the PA reaction, glycine betaine, is a very efficient
osmoprotectant and most likely acts as such in PA cells growing in
the hyper-osmotic environment of infected tissues (35). Most importantly, the inhibition of
PaBADH will give rise to increased intracellular levels of betaine
aldehyde, a highly toxic compound (36). In fact, a PA strain defective in
BADH cannot grow in choline, even if glucose is also present in the
growth medium, due to the toxicity of betaine aldehyde (36). The finding that PA-BADH is
expressed in the presence of other carbon compounds, such as
glucose, provided that choline is also present in the bacterial
growth medium (32), supports the
possibility of using its inhibition as a means to combat the
pathogen.
In relation to citrulline, we know that ornithine
carbamoyl-transferase (OTCase), (EC 2.1.3.3) catalyzes the
carbamoylation of the γ-amino group of ornithine by carbamoyl
phosphate to provide citrulline and inorganic phosphate (37). This thermodynamically favored
reaction operates in the synthesis of the amino acid, as performed
in this study. PA catabolic OTCase catalyzes the second reaction in
the arginine deiminase pathway, which is involved in ATP synthesis
under conditions of energy depletion (38–40). The coupling system involving the
production and deamination of ATP from ADP, citrulline and Pi in
the presence of carbamate may be used to determine the catabolic
OTCase activity (41). In this
study, in the presence of 2-AA, we observed an increase in
citrulline in the bacterial cells.
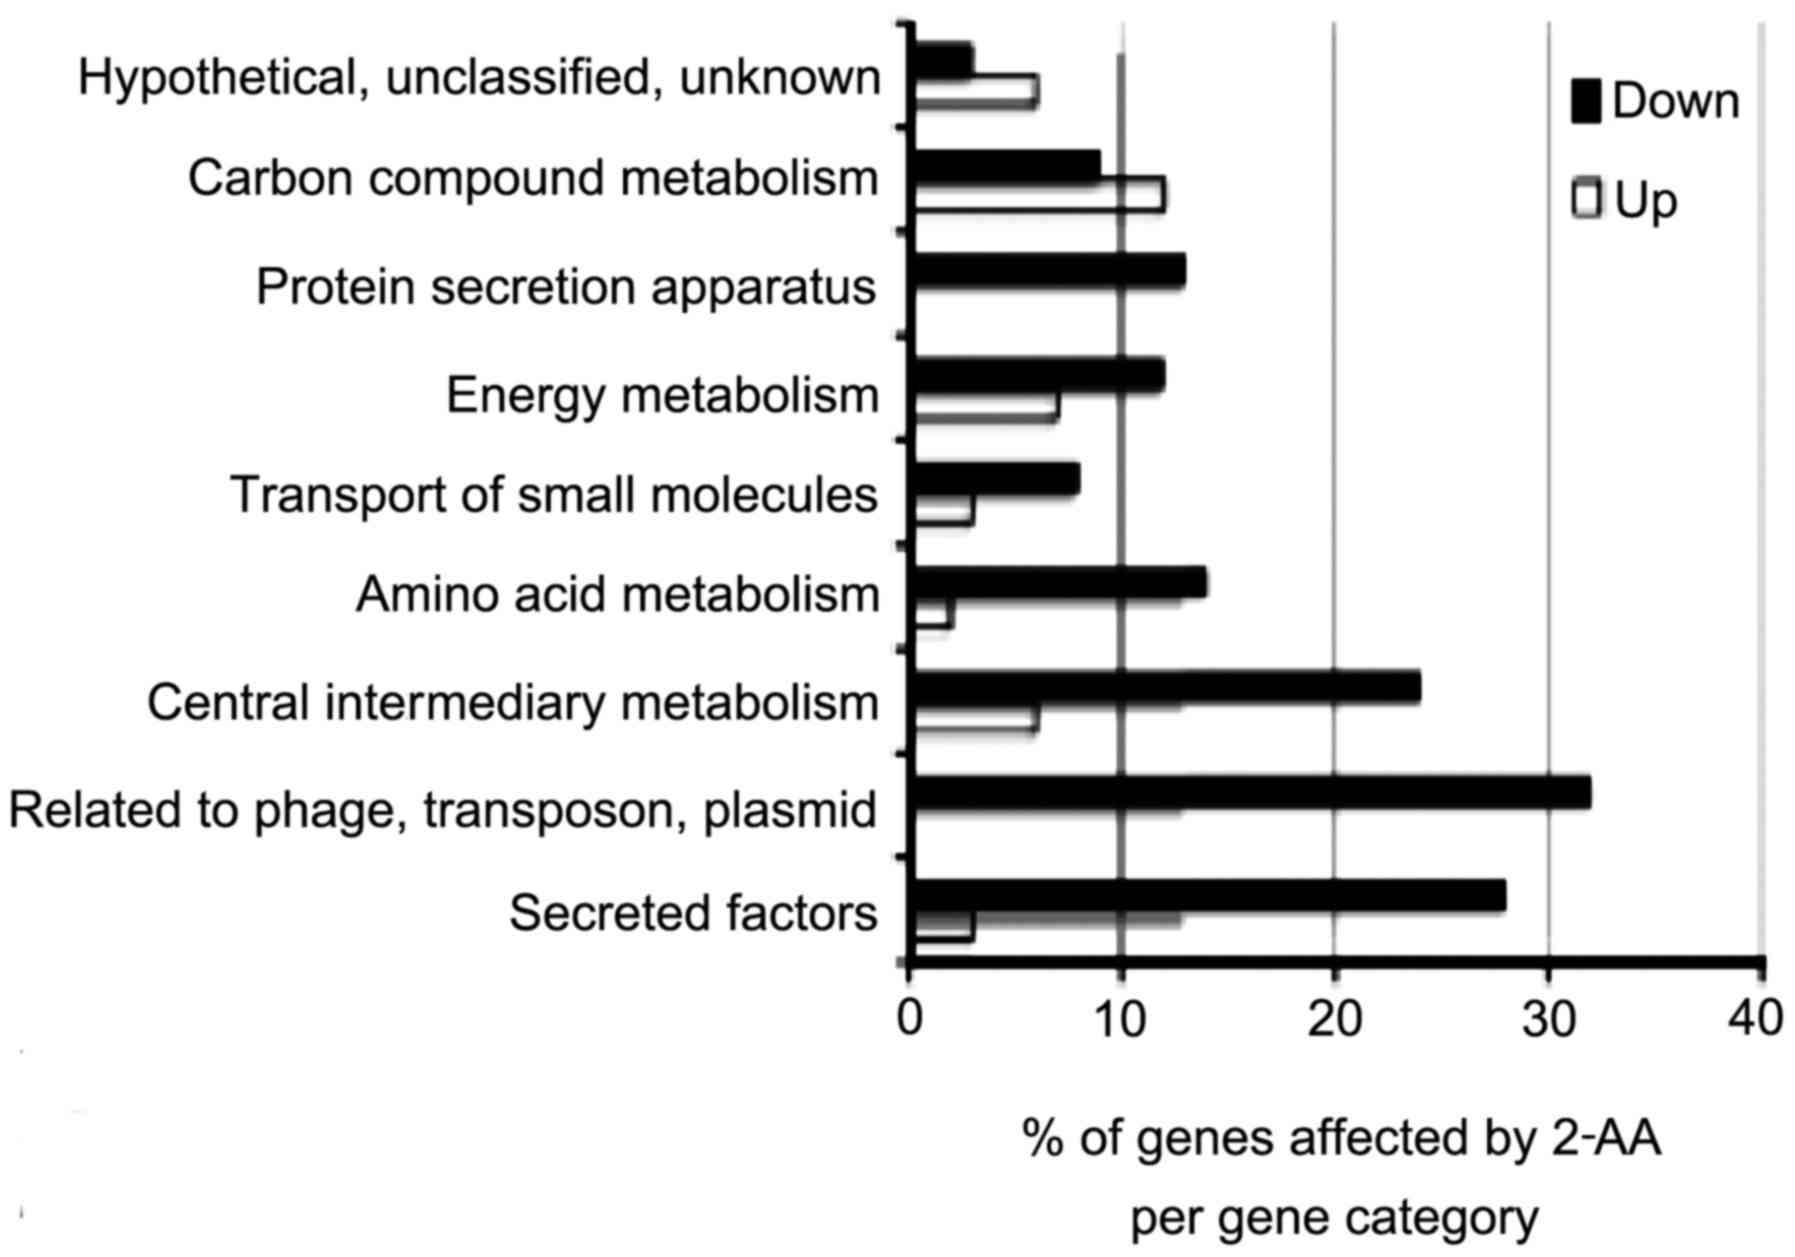
Comparing the whole-genome transcriptome profiles of
PA cells grown with or without 2-AA demonstrates that this in
vivo signal molecule reprograms the expression of 614 genes at
late exponential and early stationary growth, when many
virulence-related functions are most highly expressed (42). The analysis of the respective
functions of these genes (Fig. 3)
demonstrated that they encode several metabolic functions,
including central intermediary, amino acid, carbon and energy
metabolism pathways. As such, 2-AA promotes profound metabolic
changes in PA14 cells. We further performed whole cell HRMAS NMR
spectroscopy to identify and quantify the PA14 cell metabolome
(Fig. 2), using a novel method,
TOBSY, which combines 1D and 2D solid-state, 1H HRMAS
NMR (24). TOBSY maximizes the
advantages of HRMAS and, using a robust classification strategy,
the 2D data enable a more complete determination of metabolites.
While certain metabolites are clearly detected and quantified using
1D spectra, including glycine, betaine compounds and glutamate
(Fig. 2); other metabolites,
including lysine, UMP and citrulline, require 2D NMR to resolve and
quantify their resonances that overlap in the 1D spectra. The
combined use of 1D and 2D spectra can thus provide complete and
unambiguous metabolite identification in complex biological
samples. Comparing the whole-genome transcriptome profiles and
metabolome studies of PA14 cells grown with or without 2-AA
demonstrates that this molecule profoundly reprograms the gene
expression and metabolism of the cell.
In conclusion, the combination of 1D and 2D
1H HRMAS NMR is a powerful in vivo technique
which can be used in a variety of studies, including studies using
live bacterial cells, as reported herein. Multi-dimensional HRMAS
NMR using intact bacterial cells represents a promising method that
may provide in vivo information on metabolomics in live
bacteria. To this end, it can be complementary to existing chemical
and biological methods, and likely complementary to mass
spectrometry, which is a powerful metabolomics technique, but
nevertheless is also a destructive technique. On the other hand,
multi-dimensional in vivo HRMAS NMR is a promising method to
determine the in vivo metabolome of live intact bacterial
cells and the effects of compounds produced by PA, as they may
induce the emergence of phenotypes that promote chronic infections
in in vitro and in vivo (animal) models. To this end,
our in vivo 1H HRMAS NMR technique should prove a
helpful tool in gene function validation, the study of pathogenesis
mechanisms, the classification of microbial strains into
functional/clinical groups, and the testing of bacterial molecules
as performed here. Moreover, the technique may be used to find
drugs that block the conversion of bacterial cells into the
persister state and enables them to survive traditional antibiotic
treatments and thereby cause persistent and relapsing
infections.
Acknowledgments
This study was supported in part by Shriners
Hospital for Children research grants 87100 and 85200 in addition
to NIH grant AI105902 to LGR and NIH grant R01AI134857. We would
like to thank Dr Scott Stachel for providing comments on the
manuscript and editing.
Competing interests
The authors declare that they have no competing
interests.
References
|
1
|
Bodey GP: Infectious diseases update:
1982. Summary of a symposium. Rev Infect Dis. 5:232–234. 1983.
View Article : Google Scholar : PubMed/NCBI
|
|
2
|
Koch C and Høiby N: Pathogenesis of cystic
fibrosis. Lancet. 341:1065–1069. 1993. View Article : Google Scholar : PubMed/NCBI
|
|
3
|
Bassler BL and Losick R: Bacterially
speaking. Cell. 125:237–246. 2006. View Article : Google Scholar : PubMed/NCBI
|
|
4
|
Hoffman LR, Déziel E, D'Argenio DA, Lépine
F, Emerson J, McNamara S, Gibson RL, Ramsey BW and Miller SI:
Selection for Staphylococcus aureus small-colony variants due to
growth in the presence of Pseudomonas aeruginosa. Proc Natl Acad
Sci USA. 103:19890–19895. 2006. View Article : Google Scholar : PubMed/NCBI
|
|
5
|
Kesarwani M, Hazan R, He J, Que YA,
Apidianakis Y, Lesic B, Xiao G, Dekimpe V, Milot S, Deziel E, et
al: A quorum sensing regulated small volatile molecule reduces
acute virulence and promotes chronic infection phenotypes. PLoS
Pathog. 7:e10021922011. View Article : Google Scholar : PubMed/NCBI
|
|
6
|
Dmitriev B, Toukach F and Ehlers S:
Towards a comprehensive view of the bacterial cell wall. Trends
Microbiol. 13:569–574. 2005. View Article : Google Scholar : PubMed/NCBI
|
|
7
|
Li W: Multidimensional HRMAS NMR: a
platform for in vivo studies using intact bacterial cells. Analyst.
131:777–781. 2006. View
Article : Google Scholar : PubMed/NCBI
|
|
8
|
Griffin JL: Metabonomics: NMR spectroscopy
and pattern recognition analysis of body fluids and tissues for
characterisation of xenobiotic toxicity and disease diagnosis. Curr
Opin Chem Biol. 7:648–654. 2003. View Article : Google Scholar : PubMed/NCBI
|
|
9
|
Tweeddale H, Notley-McRobb L and Ferenci
T: Effect of slow growth on metabolism of Escherichia coli, as
revealed by global metabolite pool ('metabolome') analysis. J
Bacteriol. 180:5109–5116. 1998.PubMed/NCBI
|
|
10
|
Tweeddale H, Notley-McRobb L and Ferenci
T: Assessing the effect of reactive oxygen species on Escherichia
coli using a metabolome approach. Redox Rep. 4:237–241. 1999.
View Article : Google Scholar
|
|
11
|
Liu X, Ng C and Ferenci T: Global
adaptations resulting from high population densities in Escherichia
coli cultures. J Bacteriol. 182:4158–4164. 2000. View Article : Google Scholar : PubMed/NCBI
|
|
12
|
Himmelreich U, Somorjai RL, Dolenko B, Lee
OC, Daniel HM, Murray R, Mountford CE and Sorrell TC: Rapid
identification of Candida species by using nuclear magnetic
resonance spectroscopy and a statistical classification strategy.
Appl Environ Microbiol. 69:4566–4574. 2003. View Article : Google Scholar : PubMed/NCBI
|
|
13
|
Gudlavalleti SK, Szymanski CM, Jarrell HC
and Stephens DS: In vivo determination of Neisseria meningitidis
serogroup A capsular polysaccharide by whole cell high-resolution
magic angle spinning NMR spectroscopy. Carbohydr Res. 341:557–562.
2006. View Article : Google Scholar : PubMed/NCBI
|
|
14
|
Szymanski CM, Michael FS, Jarrell HC, Li
J, Gilbert M, Larocque S, Vinogradov E and Brisson JR: Detection of
conserved N-linked glycans and phase-variable lipooligosaccharides
and capsules from campylobacter cells by mass spectrometry and high
resolution magic angle spinning NMR spectroscopy. J Biol Chem.
278:24509–24520. 2003. View Article : Google Scholar : PubMed/NCBI
|
|
15
|
Righi V, Constantinou C, Kesarwani M,
Rahme LG and Tzika AA: Live-cell high resolution magic angle
spinning magnetic resonance spectroscopy for analysis of
metabolomics. Biomed Rep. 1:707–712. 2013. View Article : Google Scholar
|
|
16
|
Weybright P, Millis K, Campbell N, Cory DG
and Singer S: Gradient, high-resolution, magic angle spinning
1H nuclear magnetic resonance spectroscopy of intact
cells. Magn Reson Med. 39:337–345. 1998. View Article : Google Scholar : PubMed/NCBI
|
|
17
|
Blankenberg FG, Storrs RW, Naumovski L,
Goralski T and Spielman D: Detection of apoptotic cell death by
proton nuclear magnetic resonance spectroscopy. Blood.
87:1951–1956. 1996.PubMed/NCBI
|
|
18
|
Cheng LL, Ma MJ, Becerra L, Ptak T, Tracey
I, Lackner A and González RG: Quantitative neuropathology by high
resolution magic angle spinning proton magnetic resonance
spectroscopy. Proc Natl Acad Sci USA. 94:6408–6413. 1997.
View Article : Google Scholar : PubMed/NCBI
|
|
19
|
Cheng LL, Newell K, Mallory AE, Hyman BT
and Gonzalez RG: Quantification of neurons in Alzheimer and control
brains with ex vivo high resolution magic angle spinning proton
magnetic resonance spectroscopy and stereology. Magn Reson Imaging.
20:527–533. 2002. View Article : Google Scholar : PubMed/NCBI
|
|
20
|
Millis KK, Maas WE, Cory DG and Singer S:
Gradient, high-resolution, magic-angle spinning nuclear magnetic
resonance spectroscopy of human adipocyte tissue. Magn Reson Med.
38:399–403. 1997. View Article : Google Scholar : PubMed/NCBI
|
|
21
|
Righi V, Apidianakis Y, Mintzopoulos D,
Astrakas L, Rahme LG and Tzika AA: In vivo high-resolution magic
angle spinning magnetic resonance spectroscopy of Drosophila
melanogaster at 14.1 T shows trauma in aging and in innate
immune-deficiency is linked to reduced insulin signaling. Int J Mol
Med. 26:175–184. 2010.PubMed/NCBI
|
|
22
|
Fitzsimmons LF, Hampel KJ and Wargo MJ:
Cellular choline and glycine betaine pools impact osmoprotection
and phospho-lipase C production in Pseudomonas aeruginosa. J
Bacteriol. 194:4718–4726. 2012. View Article : Google Scholar : PubMed/NCBI
|
|
23
|
Meiboom S and Gill D: Modified Spin-Echo
method for measuring nuclear relaxation Times. Rev Sci Instrum.
29:688–691. 1958. View Article : Google Scholar
|
|
24
|
Andronesi OC, Mintzopoulos D, Struppe J,
Black PM and Tzika AA: Solid-state NMR adiabatic TOBSY sequences
provide enhanced sensitivity for multidimensional high-resolution
magic-angle-spinning 1H MR spectroscopy. J Magn Reson.
193:251–258. 2008. View Article : Google Scholar : PubMed/NCBI
|
|
25
|
Levenberg K: A method for the solution of
certain non-linear problems in least squares. Q Appl Math.
2:164–168. 1944. View Article : Google Scholar
|
|
26
|
Marquardt D: An algorithm for
least-squares estimation of nonlinear parameters. SIAM J Appl Math.
11:431–441. 1963. View
Article : Google Scholar
|
|
27
|
Swanson MG, Zektzer AS, Tabatabai ZL,
Simko J, Jarso S, Keshari KR, Schmitt L, Carroll PR, Shinohara K,
Vigneron DB and Kurhanewicz J: Quantitative analysis of prostate
metabolites using 1H HR-MAS spectroscopy. Magn Reson
Med. 55:1257–1264. 2006. View Article : Google Scholar : PubMed/NCBI
|
|
28
|
Gudlavalleti SK, Datta AK, Tzeng YL, Noble
C, Carlson RW and Stephens DS: The Neisseria meningitidis serogroup
A capsular polysaccharide O-3 and O-4 acetyltransferase. J Biol
Chem. 279:42765–42773. 2004. View Article : Google Scholar : PubMed/NCBI
|
|
29
|
Cress BF, Englaender JA, He W, Kasper D,
Linhardt RJ and Koffas MAG: Masquerading microbial pathogens:
capsular polysaccharides mimic host-tissue molecules. FEMS
Microbiol Rev. 38:660–697. 2014. View Article : Google Scholar : PubMed/NCBI
|
|
30
|
Bazire A, Diab F, Taupin L, Rodrigues S,
Jebbar M and Dufour A: Effects of osmotic stress on rhamnolipid
synthesis and time-course production of cell-to-cell signal
molecules by Pseudomonas aeruginosa. Open Microbiol J. 3:128–135.
2009. View Article : Google Scholar : PubMed/NCBI
|
|
31
|
Lesic B, Lépine F, Déziel E, Zhang J,
Zhang Q, Padfield K, Castonguay MH, Milot S, Stachel S, Tzika AA,
et al: Inhibitors of pathogen intercellular signals as selective
anti-infective compounds. PLoS Pathog. 3:1229–1239. 2007.
View Article : Google Scholar : PubMed/NCBI
|
|
32
|
Ostroff RM, Vasil AI and Vasil ML:
Molecular comparison of a nonhemolytic and a hemolytic
phospholipase C from Pseudomonas aeruginosa. J Bacteriol.
172:5915–5923. 1990. View Article : Google Scholar : PubMed/NCBI
|
|
33
|
Velasco-García R, Villalobos MA,
Ramírez-Romero MA, Mújica-Jiménez C, Iturriaga G and Muñoz-Clares
RA: Betaine aldehyde dehydrogenase from Pseudomonas aeruginosa:
cloning, over-expression in Escherichia coli, and regulation by
choline and salt. Arch Microbiol. 185:14–22. 2006. View Article : Google Scholar
|
|
34
|
Kilbourn JP: Bacterial content and ionic
composition of sputum in cystic fibrosis. Lancet. 1:3341978.
View Article : Google Scholar : PubMed/NCBI
|
|
35
|
D'Souza-Ault MR, Smith LT and Smith GM:
Roles of N-acetylglutaminylglutamine amide and glycine betaine in
adaptation of Pseudomonas aeruginosa to osmotic stress. Appl
Environ Microbiol. 59:473–478. 1993.PubMed/NCBI
|
|
36
|
Sage AE, Vasil AI and Vasil ML: Molecular
characterization of mutants affected in the
osmoprotectant-dependent induction of phospholipase C in
Pseudomonas aeruginosa PAO1. Mol Microbiol. 23:43–56. 1997.
View Article : Google Scholar : PubMed/NCBI
|
|
37
|
Sainz G, Tricot C, Foray MF, Marion D,
Dideberg O and Stalon V: Kinetic studies of allosteric catabolic
ornithine carbamoyltransferase from Pseudomonas aeruginosa. Eur J
Biochem. 251:528–533. 1998. View Article : Google Scholar : PubMed/NCBI
|
|
38
|
Mercenier A, Simon JP, Vander Wauven C,
Haas D and Stalon V: Regulation of enzyme synthesis in the arginine
deiminase pathway of Pseudomonas aeruginosa. J Bacteriol.
144:159–163. 1980.PubMed/NCBI
|
|
39
|
Stalon V and Mercenier A: L-arginine
utilization by Pseudomonas species. J Gen Microbiol. 130:69–76.
1984.PubMed/NCBI
|
|
40
|
Vander Wauven C, Piérard A, Kley-Raymann M
and Haas D: Pseudomonas aeruginosa mutants affected in anaerobic
growth on arginine: evidence for a four-gene cluster encoding the
arginine deiminase pathway. J Bacteriol. 160:928–934.
1984.PubMed/NCBI
|
|
41
|
Ramos F, Stalon V, Piérard A and Wiame JM:
The specialization of the two ornithine carbamoyltransferases of
Pseudomonas. Biochim Biophys Acta. 139:98–106. 1967. View Article : Google Scholar : PubMed/NCBI
|
|
42
|
Déziel E, Gopalan S, Tampakaki AP, Lépine
F, Padfield KE, Saucier M, Xiao G and Rahme LG: The contribution of
MvfR to Pseudomonas aeruginosa pathogenesis and quorum sensing
circuitry regulation: multiple quorum sensing-regulated genes are
modulated without affecting lasRI, rhlRI or the production of
N-acyl-L-homoserine lactones. Mol Microbiol. 55:998–1014. 2005.
View Article : Google Scholar : PubMed/NCBI
|