Introduction
Morphine is a powerful analgesic agent used for
treating acute and chronic pain in surgical interventions or in
hospice care (1). However,
long-term administration of morphine induces tolerance and
hyperalgesia. Furthermore, adverse effects, including addiction,
dependence, constipation and respiratory depression limit its
clinical usefulness (2,3). The physiological responses of
morphine tolerance include opioid receptor uncoupling,
endocytosis/desensitization (4),
increased binding of β-arrestin to opioid receptors, glutamatergic
receptor activation and neuroinflammation (5). Melatonin is a neurohormone derived
from serotonin and is released from the pineal gland (6). It is used for sleep modulation and
relieves the stress caused by sleep disturbance (1). It has previously been revealed that
melatonin treatment partially reverses morphine tolerance by
inhibiting microglia activation though a heat shock protein 27
(HSP27)-associated pathway (7).
Furthermore, melatonin co-treatment was revealed to prevent
morphine-induced hyperalgesia and tolerance in rats, potentially by
inhibiting protein kinase C-associated pathways (8,9). A
report also demonstrated that decreased mitochondrial DNA copy
numbers in the hippocampus during opiate addiction were mediated by
autophagy and may be reversed by melatonin (10). Additionally, melatonin was
revealed to enhance the reward behaviour of morphine via the nitric
oxidergic pathway (11).
Raghavendra and Kulkarni initially reported that the systemic
administration of melatonin reversed morphine-induced tolerance in
mice (12). Song et al
(8) identified that daily
intraperitoneal melatonin treatment reduced morphine tolerance in
rats via the regulation of the N-methyl-D-aspartate receptor
subunit 1. Furthermore, Garmabi et al (13) observed a reduction of melatonin
levels in rats under constant light exposure; those animals also
presented a high morphine consumption and severe morphine
withdrawal syndrome. Fan et al (14) further reported a substantial
decrease of serum melatonin and melatonin receptor 1 mRNA
subsequent to chronic morphine infusion in rats. Previously, not
only was it revealed that melatonin treatment partially reversed
morphine tolerance by inhibiting microglia activation though a
HSP27-associated pathway (7), but
preliminary examinations additionally revealed that chronic
morphine treatment resulted in transcriptomics changes. All studies
noted that melatonin participates in the morphine tolerance
pathway. Although melatonin was demonstrated to diminish morphine
tolerance, the transcriptomic changes derived from melatonin
treatment in opiate tolerance remain undetermined. To search whole
genome expression profiles disturbed by long-term morphine
administration and clarify the gene alterations caused by
melatonin, an expression array was used in the present study to
examine the effects of melatonin treatment on morphine-induced
tolerance in rats. The results may provide insight on and
contribute to deciphering the detailed mechanisms of morphine
tolerance.
Materials and methods
Construction of intrathecal
catheters
The intrathecal (i.t.) catheters were constructed by
inserting a 3.5 cm Silastic tube (Corning Incorporated, Corning,
NY, USA) into an 8 cm polyethylene tube (0.008 inch internal
diameter, 0.014 inch outer diameter; Spectranetics, Colorado
Springs, CO, USA) and sealing the joint with epoxy resin and
silicon rubber as previously described (15).
Animal preparation and intrathecal drug
delivery
The use of rats in the present study adhered to the
Guiding Principles in the Care and Use of Animals of the American
Physiology Society (16) and was
ethically approved by the National Defense Medical Center Animal
Care and Use Committee (Taipei, Taiwan). A total of 27 Male Wistar
rats (350-400 g), each rat (with 12 weeks of age) was housed
individually at a room temperature at 25°C, at 1 atm, with water
and food freely as wish. The rats were anaesthetized with
phenobarbital (65 mg/kg, intraperitoneally) and two i.t. catheters
were implanted. The catheters were inserted via the
atlantooccipital membrane down to spinal cord segments L5, L6 and
S1-S3, which are associated with the tail-flick reflex (17). One catheter was connected to a
mini-osmotic pump (Alzet, Cupertino, CA, USA) for an infusion of
saline or morphine (15 µg/h) for 7 days at a rate of 1
µl/h. Subsequent to cath-eterization (day 0), the rats were
returned to their home cages and maintained in a 12 h light/dark
cycle with ad libitum access to food and water. Rats with
neurological deficits were excluded. On day 7, by which time a
morphine tolerance had developed, the catheter used for saline or
morphine infusion was cut and blocked with a metal metal plug to
prevent CSF leakage. The rats were injected i.t. via the second
catheter with 5 µl either with vehicle (10% ethanol) or
melatonin (50 µg in 10% ethanol), then, 30 min later, a
single dose of morphine (15 µg in 5 µl saline, i.t.)
was injected and the antinociceptive effect measured. The protocol
is presented in Fig. 1A. There
were four experimental groups used in the present study, as
follows: Controls, melatonin-treated, morphine-treated and those
treated with melatonin and morphine combined. For the control
group, the animals were infused with saline for 7 days and infused
with vehicle injection for 30 min, and subsequently injected with
saline. For the morphine group, the animals were infused with
morphine for 7 days, injected with vehicle injection for 30 min and
subsequently injected with morphine. For the melatonin group, the
animals were infused with morphine for 7 days and injected with
melatonin for 30 min, and subsequently injected with saline. For
the melatonin and morphine group, the animals were infused with
morphine for 7 days, injected with melatonin for 30 min and
subsequently injected with morphine.
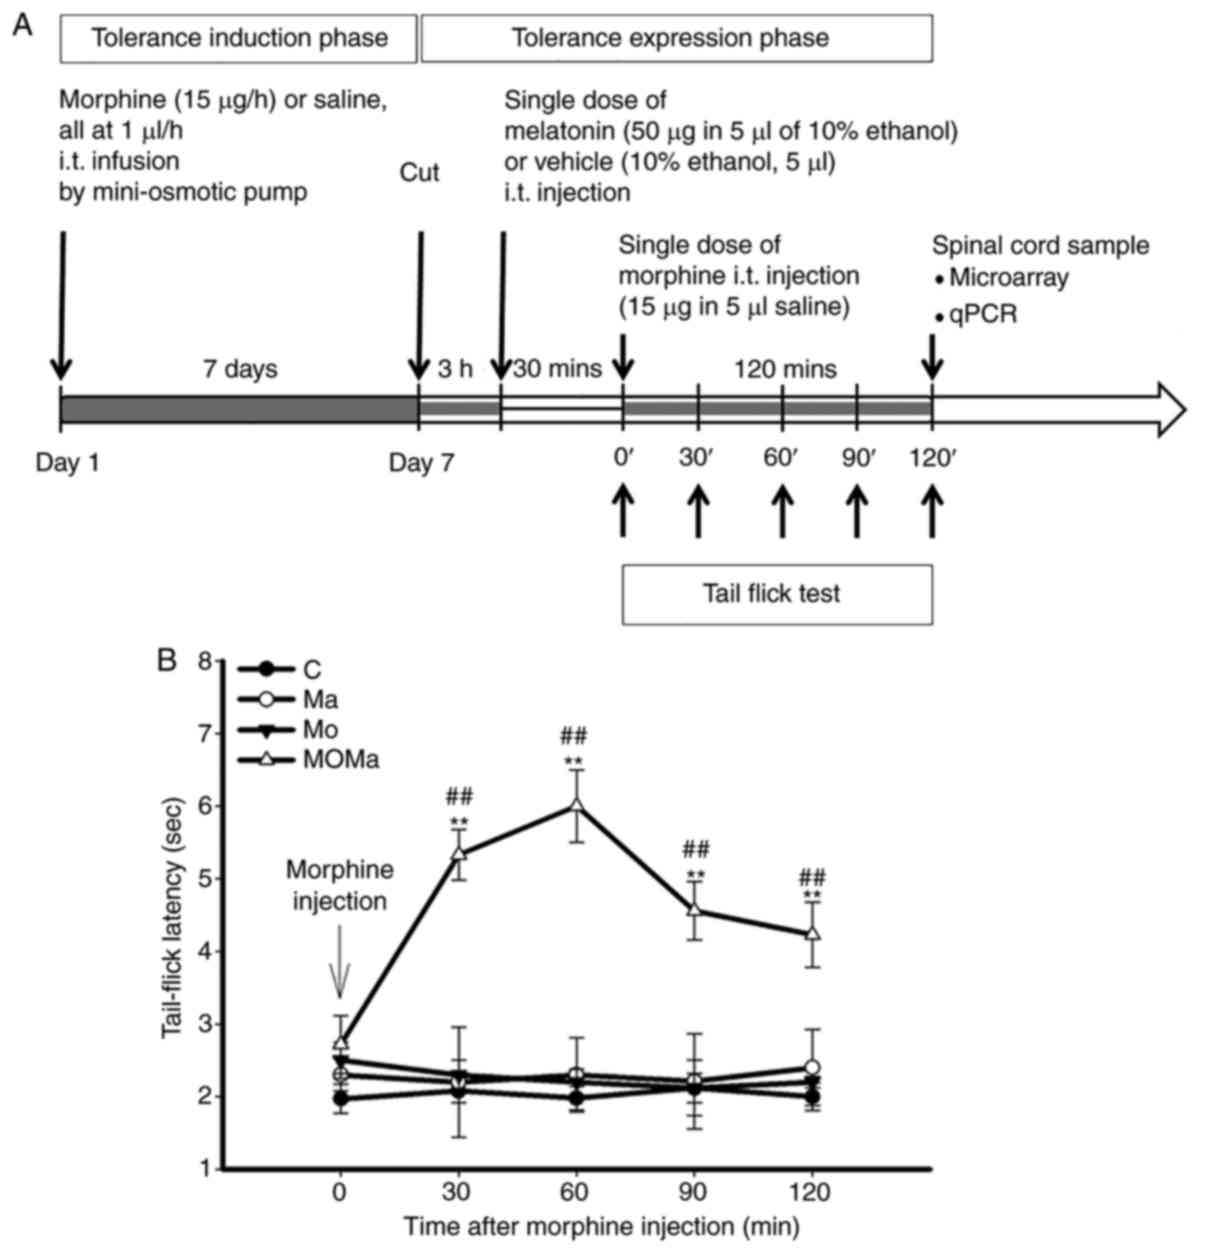 | Figure 1Experimental procedure and effect of
melatonin on the antinocieptive effect in morphine-tolerant rats.
(A) Experimental procedure for drug administration. Male Wistar
rats were implanted with two i.t. catheters, one of which was
connected to a mini-osmotic pump for the infusion of morphine or
saline for 7 days. On day 7, subsequent to morphine tolerance
development, the catheter was cut, and 3 h later the rats were
injected intrathecally with either vehicle or melatonin via the
second catheter. A total of 30 min later, a single dose of morphine
(15 µg) was injected intrathecally and its antinociceptive
effect measured. (B) Melatonin reverses the antinociceptive effect
of morphine in morphine-tolerant rats. Antinociception of morphine
was assessed on day 7 following intrathecal infusion of saline or
morphine. At 3 h subsequent to the discontinuation of infusion, the
rats were injected intrathecally with 10% ethanol (as vehicle) or
50 µg melatonin. After 30 min, the rats underwent a 15
µg morphine administration, then tail-flick latency was
measured every 30 min for 120 min. All data are presented as the
mean ± standard error of the mean for at least 5 rats.
**P<0.01 vs. the Ma group; ##P<0.01 vs.
the MO group. C, control (saline infusion/vehicle injection/saline
challenge); MO, morphine (morphine infusion/vehicle
injection/morphine challenge); Ma, melatonin (morphine
infusion/melatonin injection/saline challenge); MOMa, (morphine
infusion/melatonin injection/morphine challenge); i.t.,
intrathecal; qPCR, quantitative polymerase chain reaction. |
The dose of morphine selected was based on a
previous study (18). For i.t.
injection, melatonin was dissolved in ethanol (50 µg/5
µl in 10% ethanol maximum). All drugs were purchased from
Sigma-Aldrich (Merck KGaA, Darmstadt, Germany) and were delivered
i.t., followed by the flushing of the catheter with 5 µl
saline. Preliminary results revealed no abnormal motor function
subsequent to i.t. injection of the test drugs (data not
shown).
Antinociception test
Tail-flick latency was measured using the hot water
immersion test (52±0.5°C). Baseline latency was ~2±0.38 sec, and a
cutoff time of 10 sec was used. Rats were placed in plastic
restrainers for drug injection and antinociception testing.
Spinal cord sample collection from rats
with different treatments
Spinal cord sample collection was performed as
previously described (7), and
morphine tolerance in rats was confirmed by the time-course of
tail-flick latency over a 7-day period. Prior to day 4, the rats
with morphine infusions demonstrated a reduction of tail-flick
latency compared with the saline-infused group, which exhibited no
changes in latency during the period. Substantial morphine
tolerance was developed on day 7 as determined by a significant
reduction of the antinociceptive effect of morphine compared with
day one, with a reduction of the tail-flick latency of ~60%. And
then, rats were i.t. injected with either 10% ethanol (as a
vehicle) or melatonin via the externalized i.t. catheter. A total
of 30 min later, a single dose of morphine (15 µg) was
injected i.t. to confirm morphine tolerance. In contrast, melatonin
pretreatment attenuated morphine tolerance, melatonin pretreatment
was done by administering melatonin on day 7, at 30 min prior to
morphine intrathecal injection. The lumbar enlargement segment was
removed from 4 rat spinal cords from each group for differential
gene expression analysis.
Spinal cord sample preparation
Following drug treatment, the rats were sacrificed
by exsanguination under anaesthesia with isoflurane (Abbott
Pharmaceutical Co. Ltd., Lake Bluff, IL, USA) and a laminectomy was
performed at the lower edge of the 12th thoracic vertebra.
Subsequently, the lumber enlargement (L5-S3) of the spinal cord was
immediately collected for subsequent analysis.
Rat expression microarray
Following the tail-flick test, the rats were
sacrificed, and lumber enlargement (L5-S3) of the spinal cord was
immediately collected. There were 4 samples tested in each group.
Total mRNAs were extracted using TRIzol reagent (Invitrogen; Thermo
Fisher Scientific, Inc., Waltham, MA, USA). RNA concentration and
purity were assessed using an Agilent 2100 Bioanalyzer (Agilent
Technologies, Inc., Santa Clara, CA, USA) with a criteria of
OD260/OD280 (>1.8) and OD260/OD230 (>1.6). Next, the RNAs
were labelled with Cy5 dye by an indirect NHS ester labelling kit
(GE Healthcare, Chicago, IL, USA) according to the manufacturer’s
protocol. The labelled RNAs were hybridized with a Rat
OneArray® microarray (Phalanx Biotech Group, Hsinchu,
Taiwan), which contains 24,358 rat genome probes and 980
experimental control probes. All the probes correspond to annotated
genes in RefSeq and Ensembl databases. The hybridization procedure
was performed at 50°C in a Phalanx Hybridization System (Phalanx
Biotech Group). A total of 16 h after hybridization, non-specific
binding targets were washed away using three sequential washing
steps by 2X saline-sodium citrate buffer (SSC) contained 0.2% SDS
solution for 5 min at 42°C. Then, the slide was spun dry with a
centrifuge for 1 min at room temperature. The images of the
microarray were scanned using an Agilent G2505C scanner (Agilent
Technologies, Inc.). The Cy5 fluorescence intensities of each spot
were analysed by GenePix 4.1 software (Molecular Devices, LLC,
Sunnyvale, CA, USA).
Microarray analysis
Microarray spot analysis was resolved by the Rosetta
Resolver System® (Rosetta Biosoftware, Seattle, WA,
USA). Control probes data were calculated, and the reproducibility
of each microarray slide was assessed using Pearson’s correlation
coefficient calculations with a criterion of R-value >0.975.
Normalized spot intensities were transformed to gene expression
log2 ratios in each group. For further analysis, the
spots with a log2 ratio ≥1 or a log2 ratio
≤−1 or undetectable log2 ratios but with differences in
intensity between the two samples of >1,000 and a P<0.05 were
selected according to the method of Pirooznia et al
(19). Principal Component
Analysis (PCA) was performed to evaluate any differences among
biological replicates and their treatment conditions using FDA
released ArrayTrack™ HCA-PCA Standalone Package (20). PCA uses an orthogonal
transformation to convert a set of observations of possibly
correlated variables into a set of values of uncorrelated variables
called principal components. For advanced data analysis, intensity
data were pooled and calculated to identify differentially
expressed genes based on the threshold of fold-change and P-value.
The correlation of expression profiles between samples and
treatment conditions was demonstrated by unsupervised hierarchical
clustering analysis. Average linkage clustering was performed to
visualize the correlations among the replicates and varying sample
conditions using and open source software, Java Treeview (21). Up and downregulated genes are
represented in red and green colors, respectively.
Gene ontology (GO) enrichment
analysis
The gene IDs of interest were uploaded to the Gene
ontology Enrichment analysis website (22). The database and analysis services
were funded by the National Human Genome Research Institute in the
U.S. And right now the website were maintained and updated by the
Gene Ontology Consortium (GOC). The names of the genes with
interested were paste to the query column in the website and set
the GO aspect as molecular function for the analysis. The database
search was confined to Rattus norvegicus database.
Gene pathway mapping by PANTHER
The gene IDs of interest were uploaded to the
PANTHER Classification System website (http://pantherdb.org). PANTHER is a comprehensive,
curated database of protein families, trees, subfamilies, functions
and ontology (23). The search
parameter was set to ‘molecular function’, and the database search
was confined to only the Rattus norvegicus database. The
keywords used were the gene names of interest and the access date
were December 12 and 19, 2017.
RNA extraction and reverse
transcription-quantitative polymerase chain reaction (RT-qPCR)
Tissues were collected as described above. RNA was
extracted within 1 h at room temperature using TRIzol reagent
following manufacturer’s protocol (Invitrogen; Thermo Fisher
Scientific, Inc.). mRNA were reverse transcribed to cDNA using the
SuperScript III First-Strand Synthesis System (Invitrogen; Thermo
Fisher Scientific, Inc.). cDNA were amplified and subjected to
optical analysis to verify the integrity of extracted RNA. The
expression of target genes were quantified for all experimental
groups using LightCycler system (Roche Diagnostics, Basel,
Switzerland). RT-qPCR analysis thermocycling conditions were: 95°C
for 10 min and then the cycling conditions were set as 95°C for 10
sec, 60°C for 20 sec, 72°C for 40 sec for 50 cycles. The method of
quantification for RT-qPCR products were followed Livak and
Schmittgen et al (24) The
relative abundance of transcripts were normalized to the
constitutive expression of GAPDH. The primers of each genes used in
RT-qPCR were listed in Table
I.
 | Table IPrimers used for reverse
transcription-quantitative polymerase chain reaction analysis. |
Table I
Primers used for reverse
transcription-quantitative polymerase chain reaction analysis.
| Target gene | Gene ID | Position | Sequence |
|---|
| G protein subunit β
1 (Gnb1) | NM_030987.2 | F:262-281 |
5′-tccagtgggaagaatccaaa-3′ |
| R:317-337 |
5′-ccagtgcatggcataaatctt-3′ |
| Cholecystokinin B
receptor (Cckbr) | NM_013165.2 | F:1799-1819 |
5′-cccgtttgacttcattattgc-3′ |
| R:1842-1861 |
5′-tgaaaggcgtgtggttgata-3′ |
| 5-hydroxytryptamine
receptor 1A (Htr1a) | NM_012585.1 | F:1054-1072 |
5′-ggcaccttcatcctctgct-3′ |
| R:1110-1128 |
5′-gtggcagctgctttcacag-3′ |
| RAS protein
activator like 1 (Rasal1) | NM_001108335.1 | F:408-429 |
5′-ggagtacactgttcaccttcca-3′′ |
| R:451-470 |
5′-tcctcatccagcacgtagaa-3′ |
| General
transcription factor 2A subunit 1 like (Gtf2a1l) | NM_001012136.1 | F:1222-1242 |
5′-gaggatcccctaaattctgga-3′ |
| R:1267-1289 |
5′-ttatctgtgtcaaacaggtctgg-3′ |
| Period circadian
clock 1 (Per1) | NM_001034125.1 | F:1986-2008 |
5′-tcctaacacaaccaagcgtaaat-3′ |
| R:2043-2062 |
5′-ccctctgcttgtcatcatca-3′ |
| Methionine
adenosyltransferase 2A (Mat2a) | NM_134351.1 | F:149-168 |
5′-tgtaggggaaggtcatccag-3′ |
| R:204-222 |
5′-cctgctgaaggtgtgcatc-3′ |
| Collagen type V α 3
chain (Col5a3) | NM_021760.1 | F:634-652 |
5′-cggggaggagtcttttgag-3′ |
| R:673-693 |
5′-gcctgagggtctggaattaac-3′ |
| Inositol
1,4,5-trisphosphate receptor, type 3 (Itpr3) | NM_013138.1 | F:8362-8381 |
5′-taggggatgcaagttctcca-3′ |
| R:8403-8422 |
5′-ccactgagaaatgccagtca-3′ |
| Diacylglycerol
kinase ζ (Dgkz) | NM_031143.1 | F:330-347 |
5′-ctttgggcacaggaaagc-3′ |
| R:410-429 |
5′-gatctgccgctcagattcac-3′ |
| LIM zinc finger
domain containing 2 (Lims2) | NM_001012163.1 | F:966-985 |
5′-tcatgtgattgagggtgacg-3′ |
| R:1032-1051 |
5′ccaccaggagaacagactgg-3′ |
Data and statistical analyses
All data are presented as the mean ± standard error
of the mean. Statistical analysis was performed using SigmaStat 3.0
software (SYSTAT Software Inc., San Jose, CA, USA). Tail-flick
latencies were analyzed using two-way (time and treatment) analysis
of variance (ANOVA), followed by one-way ANOVA with a post
hoc Student-Newman-Keuls test. The RT-qPCR results were
analyzed using a Student’s t-test. P<0.05 was considered to
indicate a statistically significant difference.
Results
Experimental design and procedure
The experimental procedure for drug administration
was depicted in Fig. 1. Male
Wistar rats were implanted with two i.t. catheters and connected to
a mini-osmotic pump for morphine or saline infusion for 7 days for
morphine tolerance induction. On day 7, subsequent to the
development of tolerance, the catheter was cut, and 3 h later, the
rats received an i.t. injection of either vehicle or melatonin via
the other catheter. A total of 30 min later, at the tolerance
expression phase, a single dose of morphine (15 µg) was
injected i.t., and the antinociceptive effect was measured. Tail
flick tests were performed in every experimental group and the
results were presented in Fig.
1B. There was a significant reduction of morphine tolerance
subsequent to melatonin addition compared with the control group
(P<0.01). Following a tail-flick test, the rats were sacrificed,
and the L5 to S3 region of the spinal cords were collected for
further analysis.
Differential gene expression among
morphine tolerance, melatonin treatment and morphine tolerance
combined with melatonin treatment groups
To determine the alterations in gene expression
caused by morphine and reversed by melatonin treatment in rat
spinal cords, rat global gene expression profiles of four
independent RNA samples from each group were selected for
microarray analysis. PCA and clustering analysis revealed that the
overall gene profiles derived from microarray analysis were
separated based on morphine or melatonin treatment. The result
revealed that 162 genes were upregulated and 16 genes were
downregulated in the morphine-tolerant group (MO group, n=7)
compared with the control group (C group, n=5); 476 genes were
upregulated and 71 genes were downregulated in the melatonin
treatment group (Ma group, n=5) compared with the control group (C
group), and 290 genes were upregulated and 15 genes were
downregulated in the morphine with acute melatonin treatment group
(MOMa group, n=10) compared with the control group (Table II). All genes selected using the
criteria of log2|Fold change|≥ 1 and P<0.05 or
undetectable log2 ratios but with differences in
intensity between the two samples of >1,000. Statistical
significance was used to avoid confounding due to variation amongst
the animals and addressed additional evidence that the
transcriptional profiles of morphine tolerance and melatonin
treatment in vivo are different. The present study compared
the number of upregulated genes between the MO and MOMa groups; it
was identified that the number of upregulated genes in the MOMa
group was greater compared with the number in the MO group, which
indicated that melatonin restored the antinociceptive effect of
morphine, which was accomplished with multiple gene expression
alterations.
| Table IINumber of differentially expressed
genes. |
Table II
Number of differentially expressed
genes.
| Group
comparison | Upregulated | Downregulated |
|---|
| MO/C | 162 | 16 |
| MOMa/C | 290 | 15 |
| Ma/C | 476 | 71 |
Gene ontology (GO) analysis of the
altered genes from the MO or MOMa group
The differentially expressed genes were then
subjected to GO analysis based on molecular function (Table III). Numerous GO terms were
identical between the two groups; however, opsonin binding, actin
binding, calcium ion binding, sugar binding, oxidase activity,
deaminase activity, protein complex binding and oxidoreductase
activity were not identified in the MO group. On the other hand,
GTPase activity, phospholipase inhibitor activity, cytokine
activity, GTP binding, guanyl-nucleotide and ribonucleotide
binding, immunoglobulin (Ig)G receptor activity, IgE binding and
protein dimerization activity were not identified in the MOMa
group, implying the potential regulatory mechanism of melatonin
treatment. From the GO terms identified between the MO and MOMa
groups, it was revealed that a number of notable pathways were
altered. It has been previously reported that the morphine
tolerance process involves inflammation (25). Immune-associated processes,
including cytokine activity, IgG receptor activity and IgE binding,
were missing following melatonin treatment, which indicates that
melatonin treatment may participate in the downregulation of these
cellular process. On the other hand, the gene expression for actin
binding was present following melatonin treatment; this result
implies that cytoskeleton reconstitution may be activated.
Additionally, genes involving calcium ion binding, sugar binding,
NADPH oxidase activity, deaminase activity and protein complex
binding pathways appeared subsequent to melatonin treatment,
indicating the requirement for the metabolic activity that emerged
following melatonin treatment. The gene expression data for IgG
receptor expression and actin binding were selected and provided by
request.
| Table IIIIdentified gene ontology terms of the
MO and MOMa groups compared with the C group. |
Table III
Identified gene ontology terms of the
MO and MOMa groups compared with the C group.
| Geneset name | MO/C
| MOMa/C
|
|---|
| No. of genes in
geneset | No. of genes in
overlap | P-value | No. of genes in
geneset | No. of genes in
overlap | P-value |
|---|
| GO:0001846-opsonin
binding | | N.I. | | 7 | 3 | <0.01 |
| GO:0001871-pattern
binding | 116 | 7 | <0.01 | 116 | 13 | <0.01 |
| GO:0001872-zymosan
binding | 3 | 2 | 0.02 | 3 | 2 | 0.04 |
| GO:0003924-GTPase
activity | 98 | 4 | 0.05 | | N.I. | |
| GO:0003779-actin
binding | | N.I. | | 233 | 10 | 0.01 |
| GO:0004857-enzyme
inhibitor activity | 238 | 10 | <0.01 | 238 | 11 | <0.01 |
|
GO:0004859-phospholipase inhibitor
activity | 6 | 2 | 0.05 | | N.I. | |
|
GO:0004866-endopeptidase inhibitor
activity | 148 | 6 | 0.01 | 148 | 7 | 0.02 |
| GO:0005125-cytokine
activity | 110 | 5 | 0.01 | | N.I. | |
| GO:0005506-iron ion
binding | 289 | 7 | 0.03 | 289 | 10 | 0.03 |
| GO:0005525-GTP
binding | 312 | 8 | 0.02 | | N.I. | |
| GO:0005509-calcium
ion binding | | N.I. | | 672 | 20 | 0.01 |
| GO:0005529-sugar
binding | | N.I. | | 215 | 9 | 0.02 |
|
GO:0005539-glycosaminoglycan binding | 102 | 5 | 0.01 | 102 | 11 | <0.01 |
|
GO:0008009-chemokine activity | 32 | 5 | <0.01 | 32 | 4 | 0.01 |
| GO:0008201-heparin
binding | 72 | 4 | 0.02 | 72 | 8 | <0.01 |
|
GO:0016175-superoxide-generating | | N.I. | | 7 | 3 | <0.01 |
| NADPH oxidase
activity | | | | | | |
|
GO:0016814~hydrolase activity, acting on
carbon-nitrogen (but not peptide) bonds, in cyclic amidines | 22 | 3 | 0.01 | 22 | 4 | <0.01 |
|
GO:0019239-deaminase activity | | N.I. | | 21 | 3 | 0.04 |
| GO:0019001-guanyl
nucleotide binding | 326 | 8 | 0.02 | | N.I. | |
|
GO:0019763-immunoglobulin receptor
activity | 7 | 3 | <0.01 | 7 | 3 | <0.01 |
| GO:0019770-IgG
receptor activity | 4 | 2 | 0.03 | | N.I. | |
|
GO:0019834-phospholipase A2 inhibitor
activity | 3 | 2 | 0.02 | 3 | 2 | 0.04 |
| GO:0019863-IgE
binding | 4 | 2 | 0.03 | | N.I. | |
| GO:0019864-IgG
binding | 6 | 4 | <0.01 | 6 | 4 | <0.01 |
|
GO:0019865-immunoglobulin binding | 12 | 5 | <0.01 | 12 | 5 | <0.01 |
| GO:0019955-cytokine
binding | 87 | 4 | 0.04 | 87 | 7 | <0.01 |
| GO:0020037-heme
binding | 148 | 5 | 0.04 | 148 | 7 | 0.02 |
|
GO:0030246-carbohydrate binding | 337 | 10 | <0.01 | 337 | 20 | <0.01 |
|
GO:0030247-polysaccharide binding | 116 | 7 | <0.01 | 116 | 13 | <0.01 |
|
GO:0030414-peptidase inhibitor
activity | 159 | 7 | <0.01 | 159 | 8 | 0.01 |
| GO:0032403-protein
complex binding | | N.I. | | 222 | 12 | <0.01 |
| GO:0032561-guanyl
ribonucleotide binding | 326 | 8 | 0.02 | | N.I. | |
|
GO:0042379-chemokine receptor binding | 33 | 5 | <0.01 | 33 | 4 | 0.01 |
|
GO:0042802-identical protein binding | 588 | 11 | 0.02 | 588 | 18 | 0.01 |
| GO:0042803-protein
homodimerization activity | 318 | 8 | 0.02 | 318 | 15 | <0.01 |
|
GO:0046906-tetrapyrrole binding | 154 | 5 | 0.04 | 154 | 7 | 0.03 |
| GO:0046983-protein
dimerization activity | 528 | 10 | 0.03 | 528 | 20 | <0.01 |
| GO:0048020-CCR
chemokine receptor binding | 3 | 2 | 0.02 | | N.I. | |
|
GO:0050664-oxidoreductase activity, acting
on NADH or NADPH, with oxygen as acceptor | | N.I. | | 11 | 3 | 0.01 |
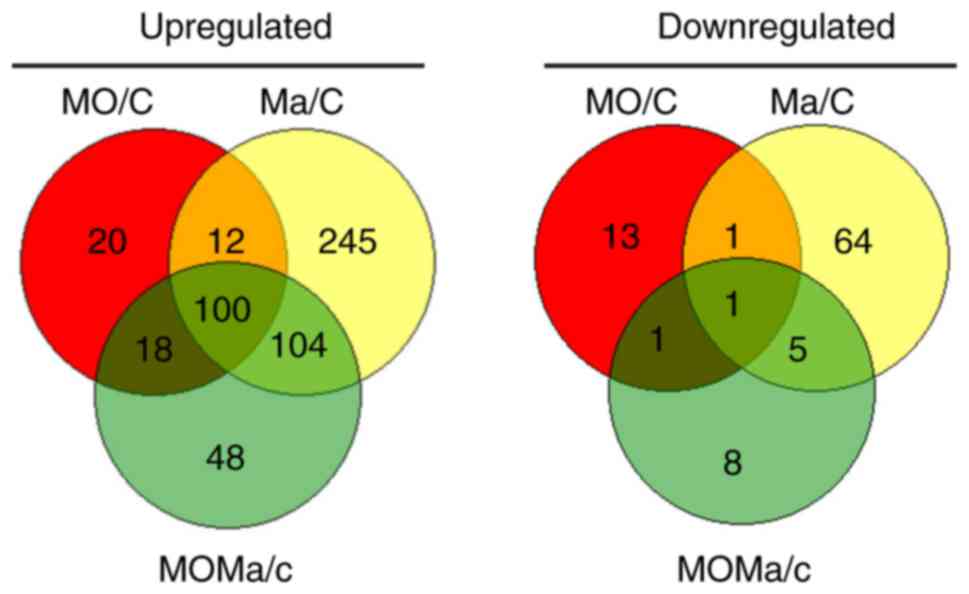
Venn diagram and genes exclusively
expressed in the MOMa group
In order to clarify the differential gene expression
panels among the three groups, Venn diagram analysis was performed,
and the results depicted the overlap of differentially expressed
genes between the MO, Ma and MOMa groups (Fig. 2). In total, 48 genes were
upregulated and 8 were genes downregulated exclusively in the MOMa
group. These genes were the candidates that participated in the
reversal of morphine tolerance. It was also identified that 20
genes were upregulated and 13 genes were downregulated exclusively
in the MO group; these genes were not altered by melatonin
treatment, so these genes were not involved in the melatonin
reversal effect in morphine tolerance. All the genes in Venn
diagram analysis are listed in Table
IV-A and -B. Genes expressed exclusively in the MOMa group are
notable as they may be the targets for the reversal of morphine
tolerance associated with melatonin in future studies. From
Table IV-B, the myocilin gene
demonstrated the greatest fold change in upregulation; and myocilin
has been reported to mediate myelination in the peripheral nervous
system (26). Furthermore,
microtubule-associated protein 9 expression was decreased in the
MOMa group, and this gene has been reported to serve a role in
mitotic spindle formation and mitosis progression (27), implying the potential involvement
of melatonin.
| Table IVTop 20 exclusively upregulated and
downregulated genes in each group. |
Table IV
Top 20 exclusively upregulated and
downregulated genes in each group.
A, Exclusively
expressed genes in MO group
|
|---|
| Gene symbol | Description | Gene ID | Fold-change |
|---|
| Ddx60 | DEAD
(Asp-Glu-Ala-Asp) box polypeptide 60, probable ATP-dependent RNA
helicase DDX60-like | 100360801 | 1.61 Up |
| Lgals3bp | Lectin,
galactoside-binding, soluble, 3 binding protein | 245955 | 1.54 Up |
| Oas1a | 2′-5′
oligoadenylate synthetase 1A | 192281 | 1.47 Up |
| Isg15 | ISG15
ubiquitin-like modifier | 298693 | 1.46 Up |
| Slamf9 | SLAM family member
9 | 289235 | 1.29 Up |
| Usp18 | Ubiquitin specific
peptidase 18 | 312688 | 1.28 Up |
| Smim5 | Small integral
membrane protein 5 | 689926 | 1.26 Up |
| Casp4 | Caspase 4,
apoptosis-related cysteine peptidase | 114555 | 1.2 Up |
| Cd33 | CD33 molecule | 690492 | 1.2 Up |
| Pik3ap1 |
Phosphoinositide-3-kinase adaptor protein
1 | 294048 | 1.14 Up |
| Ccl7 | Chemokine (C-C
motif) ligand 7 | 287561 | 1.13 Up |
| Apol9a | Apolipoprotein L
9a | 503164 | 1.11 Up |
| Dpt | Dermatopontin | 289178 | 1.09 Up |
| Cryaa | Crystallin, αA | 24273 | 1.06 Up |
| Irgm | Immunity-related
GTPase family, M | 303090 | 1.05 Up |
| Irf7 | Interferon
regulatory factor 7 | 293624 | 1.04 Up |
| Gpr160 | G protein-coupled
receptor 160 | 499588 | 1.03 Up |
| Uba7 | Ubiquitin-like
modifier activating enzyme 7 | 301000 | 1.03 Up |
| Vwa5b1 | Von Willebrand
factor A domain containing 5B1 | 313653 | 1.03 Up |
| Olr104 | Olfactory receptor
104 | 293243 | 1.02 Up |
| LOC689064 | β-globin | 689064 | −1 Down |
| Fras1 | Fraser syndrome
1 | 289486 | −1.01 Down |
| Zfp597 | Zinc finger protein
597 | 266774 | −1.06 Down |
| LOC681849 | Similar to protein
C6orf142 homolog | 681849 | −1.09 Down |
| Alas2 | Aminolevulinate,
delta-, synthase 2 | 25748 | −1.13 Down |
| LOC500300 | Similar to
hypothetical protein MGC6835 | 500300 | −1.2 Down |
| Hspa1b | Heat shock 70 kD
protein 1B (mapped) | 294254 | −1.21 Down |
| Ccdc77 | Coiled-coil domain
containing 77 | 312677 | −1.3 Down |
| Oas1e | 2′-5′
oligoadenylate synthetase 1E | 494201 | −1.4 Down |
| Pmp2 | Peripheral myelin
protein 2 | 688790 | −1.47 Down |
| Fkbp6 | FK506 binding
protein 6 | 288597 | −1.98 Down |
| Prx | Periaxin | 78960 | −2.16 Down |
| Mpz | Myelin protein
zero | 24564 | −2.92 Down |
B, Exclusively
expressed genes in MOMa group
|
|---|
| Gene symbol | Description | Gene ID | Fold-change |
|---|
| Myoc | Myocilin | 81523 | 2.47 Up |
| Samsn1 | SAM domain, SH3
domain and nuclear localization signals, 1 | 170637 | 1.48 Up |
| Scin | Scinderin | 298975 | 1.45 Up |
| Ncan | Neurocan | 58982 | 1.35 Up |
| Tagln | Transgelin | 25123 | 1.34 Up |
| Aplnr | Apelin
receptor | 83518 | 1.31 Up |
| Nlrc4 | NLR family, CARD
domain containing 4 | 298784 | 1.28 Up |
| S1pr3 |
Sphingosine-1-phosphate receptor 3 | 306792 | 1.27 Up |
| Mxra8 | Matrix-remodelling
associated 8 | 313770 | 1.26 Up |
| Sptbn5 | Spectrin, β,
non-erythrocytic 5 | 296090 | 1.24 Up |
| Plin2 | Perilipin 2 | 298199 | 1.23 Up |
| Epyc | Epiphycan | 314772 | 1.23 Up |
| Chdh | Choline
dehydrogenase | 290551 | 1.22 Up |
| Hlx | H2.0-like
homeobox | 364069 | 1.19 Up |
| Cenpf | Centromere protein
F | 257649 | 1.19 Up |
| Aoah | Acyloxyacyl
hydrolase (neutrophil) | 498757 | 1.17 Up |
| Spta1 | Spectrin, α,
erythrocytic 1 (elliptocytosis 2) | 289257 | 1.15 Up |
| Trim47 | Tripartite
motif-containing 47 | 690374 | 1.14 Up |
| Abi3 | ABI family, member
3 | 303476 | 1.13 Up |
| Ssc5d | Scavenger receptor
cysteine rich domain containing (5 domains) | 308341 | 1.13 Up |
| Epm2aip1 | EPM2A (laforin)
interacting protein 1 | 316021 | −1.02 Down |
| LOC691921 | Hypothetical
protein LOC691921 | 691921 | −1.04 Down |
| Klhl11 | Kelch-like 11
(Drosophila) | 287706 | −1.09 Down |
| Ppargc1b | Peroxisome
proliferator-activated receptor γ, coactivator 1 β | 291567 | −1.11 Down |
| Pcdhb6 | Protocadherin
β6 | 291653 | −1.14 Down |
| Tox2 | TOX high mobility
group box family member 2 | 311615 | −1.22 Down |
| Map9 |
Microtubule-associated protein 9 | 310544 | −1.26 Down |
| RGD1309108 | Similar to
hypothetical protein FLJ23554 | 315578 | −1.55 Down |
C, Exclusively
expressed genes in Ma group
|
|---|
| Gene symbol | Description | Gene ID | Fold-change |
|---|
| Defb3 | β-defensin 3 | 641623 | 3.52 Up |
| RT1-Da | RT1 class II, locus
Da | 294269 | 2.60 Up |
| RT1-Ba | RT1 class II, locus
Ba | 309621 | 2.59 Up |
| Pxmp4 | Peroxisomal
membrane protein 4 | 282634 | 2.46 Up |
| RT1-Bb | RT1 class II, locus
Bb | 309622 | 2.21 Up |
| Ccl11 | Chemokine (C-C
motif) ligand 11 | 29397 | 2.08 Up |
| Tmem252 | Transmembrane
protein 252 | 361744 | 2.07 Up |
| Aurkb | Aurora kinase
B | 114592 | 1.99 Up |
| Cd74 | Cd74 molecule,
major histocompatibility complex, class II invariant chain | 25599 | 1.89 Up |
| Birc5 | Baculoviral IAP
repeat-containing 5 | 64041 | 1.81 Up |
| Lmcd1 | LIM and
cysteine-rich domains 1 | 494021 | 1.80 Up |
| Fam111a | Family with
sequence similarity 111, member A | 499322 | 1.79 Up |
| RSA-14-44 | RSA-14-44
protein | 297173 | 1.77 Up |
| Kif11 | Kinesin family
member 11 | 171304 | 1.70 Up |
| Vdac1 | Voltage-dependent
anion channel 1 | 83529 | 1.70 Up |
| Hmgn3 | High mobility group
nucleosomal binding domain 3 | 113990 | 1.69 Up |
| Nalcn | Sodium leak
channel, non-selective | 266760 | 1.69 Up |
| Tnfrsf14 | Tumor necrosis
factor receptor superfamily, member 14 | 366518 | 1.67 Up |
| Pex11a | Peroxisomal
biogenesis factor 11 α | 85249 | 1.61 Up |
| RGD1564664 | Similar to
LOC387763 protein | 499839 | 1.61 Up |
| LOC100911604 | CD99 antigen-like
protein 2-like, similar to MIC2L1 | 500410 | −1.14 Down |
| Serpinb1b | Serine (or
cysteine) peptidase inhibitor, clade B member 1b, leukocyte
elastase inhibitor A-like | 306891 | −1.15 Down |
| Mgll | Monoglyceride
lipase | 29254 | −1.15 Down |
| Lrtomt | Leucine rich
transmembrane and 0-methyltransferase domain containing | 308868 | −1.16 Down |
| Tas2r145 | Taste receptor,
type 2, member 145 | 100363053 | −1.18 Down |
| Kcnip3 | Kv channel
interacting protein 3, calsenilin | 65199 | −1.19 Down |
| Fbll1 | Fibrillarin-like
1 | 363563 | −1.19 Down |
| LOC100910054 | NF-κ-B-repressing
factor-like | 100910054 | −1.20 Down |
| Ttll1 | Tubulin tyrosine
ligase-like family, member 1 | 362969 | −1.21 Down |
| Negr1 | Neuronal growth
regulator 1 | 59318 | −1.22 Down |
| Ttll11 | Tubulin tyrosine
ligase-like family, member 11 | 689746 | −1.24 Down |
| Mgam |
Maltase-glucoamylase | 312272 | −1.25 Down |
| Apba1 | Amyloid β(A4)
precursor protein-binding, family A, member 1 | 83589 | −1.26 Down |
| Hoxb5 | Homeo box B5 | 497987 | −1.26 Down |
| Zfp238 | Zinc finger protein
238 | 64619 | −1.27 Down |
| Ddx6 | DEAD
(Asp-Glu-Ala-Asp) box helicase 6 | 500988 | −1.29 Down |
| LOC310902 | Similar to Alcohol
dehydrogenase 1A (alcohol dehydrogenase α subunit) | 310902 | −1.30 Down |
| Fgf13 | Fibroblast growth
factor 13 | 84488 | −1.32 Down |
| Tnnc2 | Troponin C type 2
(fast) | 296369 | −1.33 Down |
| Pdyn | Prodynorphin | 29190 | −1.43 Down |
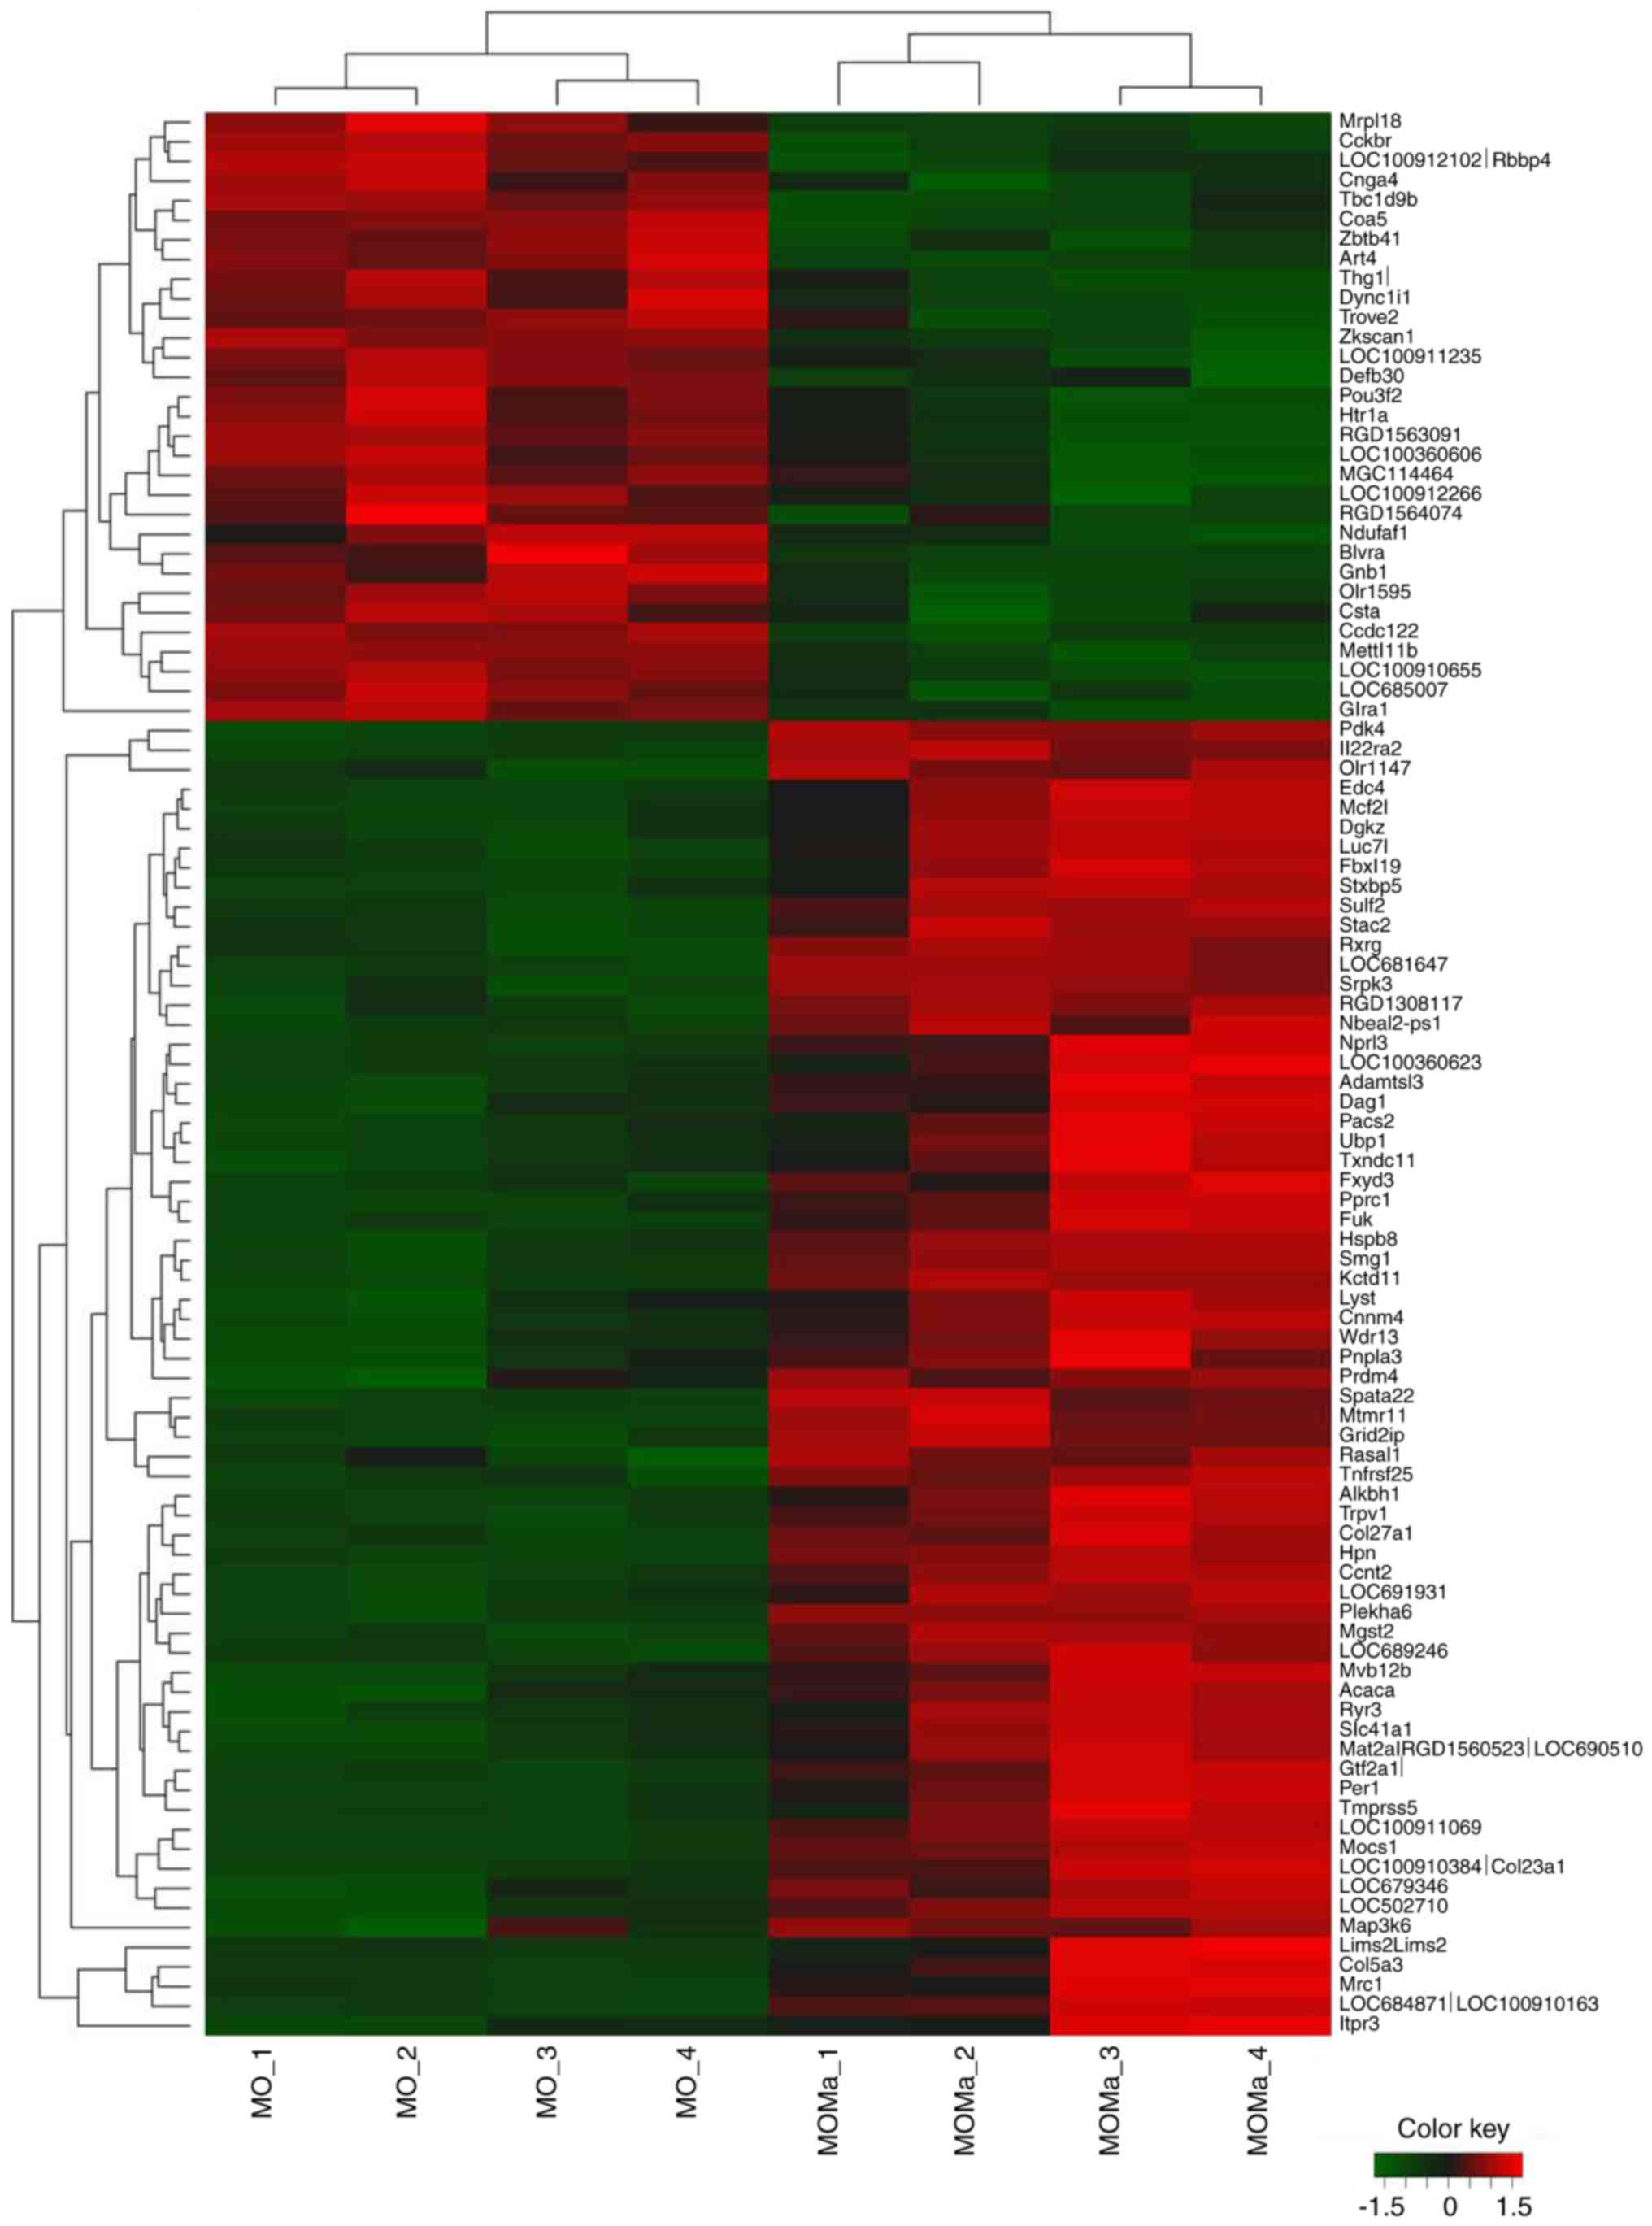
Reversed gene expression panel between
MO/C and MOMa/C groups
In order to clarify which genes were altered by
melatonin treatment in morphine-tolerant rats, genes from the
microarray data with inverted gene expression profiles between MO/C
and MOMa/C groups were selected. Hierarchical clustering analysis
was performed to construct a reversed gene expression heatmap
between the MO/C and MOMa/C groups (Fig. 3). Genes were selected from the
microarray data with the criteria of log2 ratio ≥1 or
≤−1 and P<0.05, and the expression of the genes was reversed
between the MO/C and MOMa/C groups. The constructed panel according
to the heatmap of the reversed genes was listed in Table V. The panel with inverted gene
expression may be used to investigate potential pathways derived by
melatonin treatment.
| Table VGenes with inverted expressions
between Mo and MOMa group |
Table V
Genes with inverted expressions
between Mo and MOMa group
A, Genes with
upregulated expression in the MO group but downregulated expression
in the MOMa group
|
|---|
| Gene symbol | Description | Gene ID | Fold MO | Fold MOMA |
|---|
| Glra1 | Glycine receptor,
α1 | 25674 | 2.10 | 0.65 |
| Olr1595 | Olfactory receptor
1595 | 304990 | 1.70 | 0.66 |
| Ndufaf1 | NADH dehydrogenase
(ubiquinone) complex I, assembly factor 1 | 296086 | 1.42 | 0.72 |
| RGD1563091 | Similar to
OEF2 | 500011 | 1.40 | 0.79 |
| Gnb1 | Guanine nucleotide
binding protein (G protein), βpolypeptide 1 | 24400 | 1.40 | 0.76 |
| Ccdc122 | Coiled-coil domain
containing 122 | 100360752 | 1.39 | 0.61 |
| Csta | Cystatin A (stefin
A) | 288067 | 1.35 | 0.70 |
| Blvra | Biliverdin
reductase A | 116599 | 1.33 | 0.70 |
| MGC114464 | Similar to
expressed sequence AI836003 | 500925 | 1.32 | 0.75 |
| LOC100910655 |
Paralemmin-2-like | 100910655 | 1.31 | 0.64 |
| Dync1i1 | Dynein cytoplasmic
1 intermediate chain 1 | 29564 | 1.31 | 0.79 |
| LOC685007 | Similar to unc-93
homolog A | 685007 | 1.30 | 0.68 |
| Cckbr | Cholecystokinin B
receptor | 25706 | 1.29 | 0.78 |
| Art4 |
ADP-ribosyltransferase 4 | 312806 | 1.29 | 0.72 |
| Zbtb41 | Cytochrome C
oxidase assembly factor 5 | 503252 | 1.28 | 0.75 |
| Cnga4 | Cyclic nucleotide
gated channel α4 | 85258 | 1.28 | 0.78 |
| Thg1l | tRNA-histidine
guanylyltransferase 1-like (S. cerevisiae) | 303067 | 1.26 | 0.82 |
| Mettl11b | Methyltransferase
like 11B | 289167 | 1.25 | 0.68 |
| LOC100911235 | Mediator of RNA
polymerase II transcription subunit 7-like | 100911235 | 1.25 | 0.81 |
| Htr1a | 5-hydroxytryptamine
(serotonin) receptor 1A, G protein-coupled | 24473 | 1.24 | 0.75 |
| Pou3f2 | POU class 3
homeobox 2 | 29588 | 1.24 | 0.77 |
B, Genes with
downregulated expression in the MO group but upregulated expression
in the MOMa group
|
|---|
| Gene symbol | Description | Gene ID | Fold MO | Fold MOMA |
|---|
| Itpr3 | Inositol
1,4,5-trisphosphate receptor, type 3 | 25679 | 0.59 | 1.82 |
| Mocs1 | Molybdenum cofactor
synthesis 1 | 301221 | 0.69 | 1.66 |
| Col5a3 | Collagen, type V,
α3 | 60379 | 0.73 | 1.66 |
| Mrc1 | Mannose receptor, C
type 1 | 291327 | 0.66 | 1.65 |
| Lims2 | LIM and senescent
cell antigen like domains 2 | 361303 | 0.65 | 1.63 |
| Gtf2a1l | General
transcription factor IIA, 1-like | 316711 | 0.76 | 1.58 |
| Olr1147 | Olfactory receptor
1147 | 300408 | 0.60 | 1.55 |
| Ccnt2 | Cyclin T2 | 304758 | 0.82 | 1.51 |
| Map3k6 | Mitogen-activated
protein kinase kinase kinase 6 | 313022 | 0.64 | 1.45 |
| Tnfrsf25 | Tumor necrosis
factor receptor superfamily, member 25 | 500592 | 0.71 | 1.43 |
| Slc41a1 | Solute carrier
family 41, member 1 | 363985 | 0.83 | 1.43 |
| Mvb12b | Multivesicular body
subunit 12B | 362118 | 0.80 | 1.42 |
| Acaca | Acetyl-CoA
carboxylase α | 60581 | 0.77 | 1.38 |
| Ryr3 | Ryanodine receptor
3 | 170546 | 0.77 | 1.38 |
| Col27a1 | Collagen, type
XXVII, α1 | 298101 | 0.83 | 1.36 |
| Rasal1 | RAS protein
activator like 1 (GAP1 like) | 360814 | 0.72 | 1.36 |
| Rasal1 | RAS protein
activator like 1 (GAP1 like) | 360814 | 0.72 | 1.36 |
| Mat2a | Methionine
adenosyltransferase II | 690510 | 0.79 | 1.29 |
| er1 | Period circadian
clock 1 | 287422 | 0.63 | 1.25 |
| Dgkz | Diacylglycerol
kinase ζ | 81821 | 0.77 | 1.24 |
PANTHER pathway mapping and RT-qPCR
analysis
The genes listed in Table V-A and -B were used for enrichment
analysis by the PANTHER algorithm provided by the GO Consortium.
The PANTHER pathway mapped 4 out of 29 genes for the genes listed
in Table V-A and 10 out of 66
genes for the genes listed in Table
V-B. The PANTHER-mapped pathways and associated genes are
listed in Table VI-A and -B.
Guanine nucleotide binding protein β polypeptide 1 (Gnb1) was
identified to participate in numerous cellular functions, including
neuron-associated functions, including glutamatergic, cholinergic,
GABAergic, dopaminergic, serotonergic and sympathetic neuron
functions. Furthermore, Gnb1 has also been reported to participate
in other pathways, including histamine H1 and H2 receptors and
several hormone receptor signals. Gnb1 was upregulated 1.4-fold in
the MO group and downregulated 1.3-fold in the MOMA group; this
result implies the potential of a melatonin-mediated pathway via
the repression of Gβ expression and signaling. On the
other hand, the genes mapped in Table VI-B mainly participated in cell
proliferation and migration in addition to cytoskeleton
reconstruction. For example, a gene named inositol
1,4,5-trisphosphate receptor, type 3 (Itpr3) was downregulated
1.7-fold in the MO group but was upregulated 1.8-fold in the MOMA
group. A number of pathways associated with Itpr3, including
inflammatory, cell proliferation and migration, G protein mediated
and vaso-relaxation pathways, were suggested. The genes mentioned
in Table VI-A and VI-B were selected and their gene
expressions were verified using RT-qPCR (Fig. 4). All the genes selected here
demonstrated an accordance with the expression trends of the
microarray results. The results indicate the potential signaling
pathways of melatonin in the rat spinal cord for the restoration of
cell proliferation and migration through cytoskeleton
reconstruction.
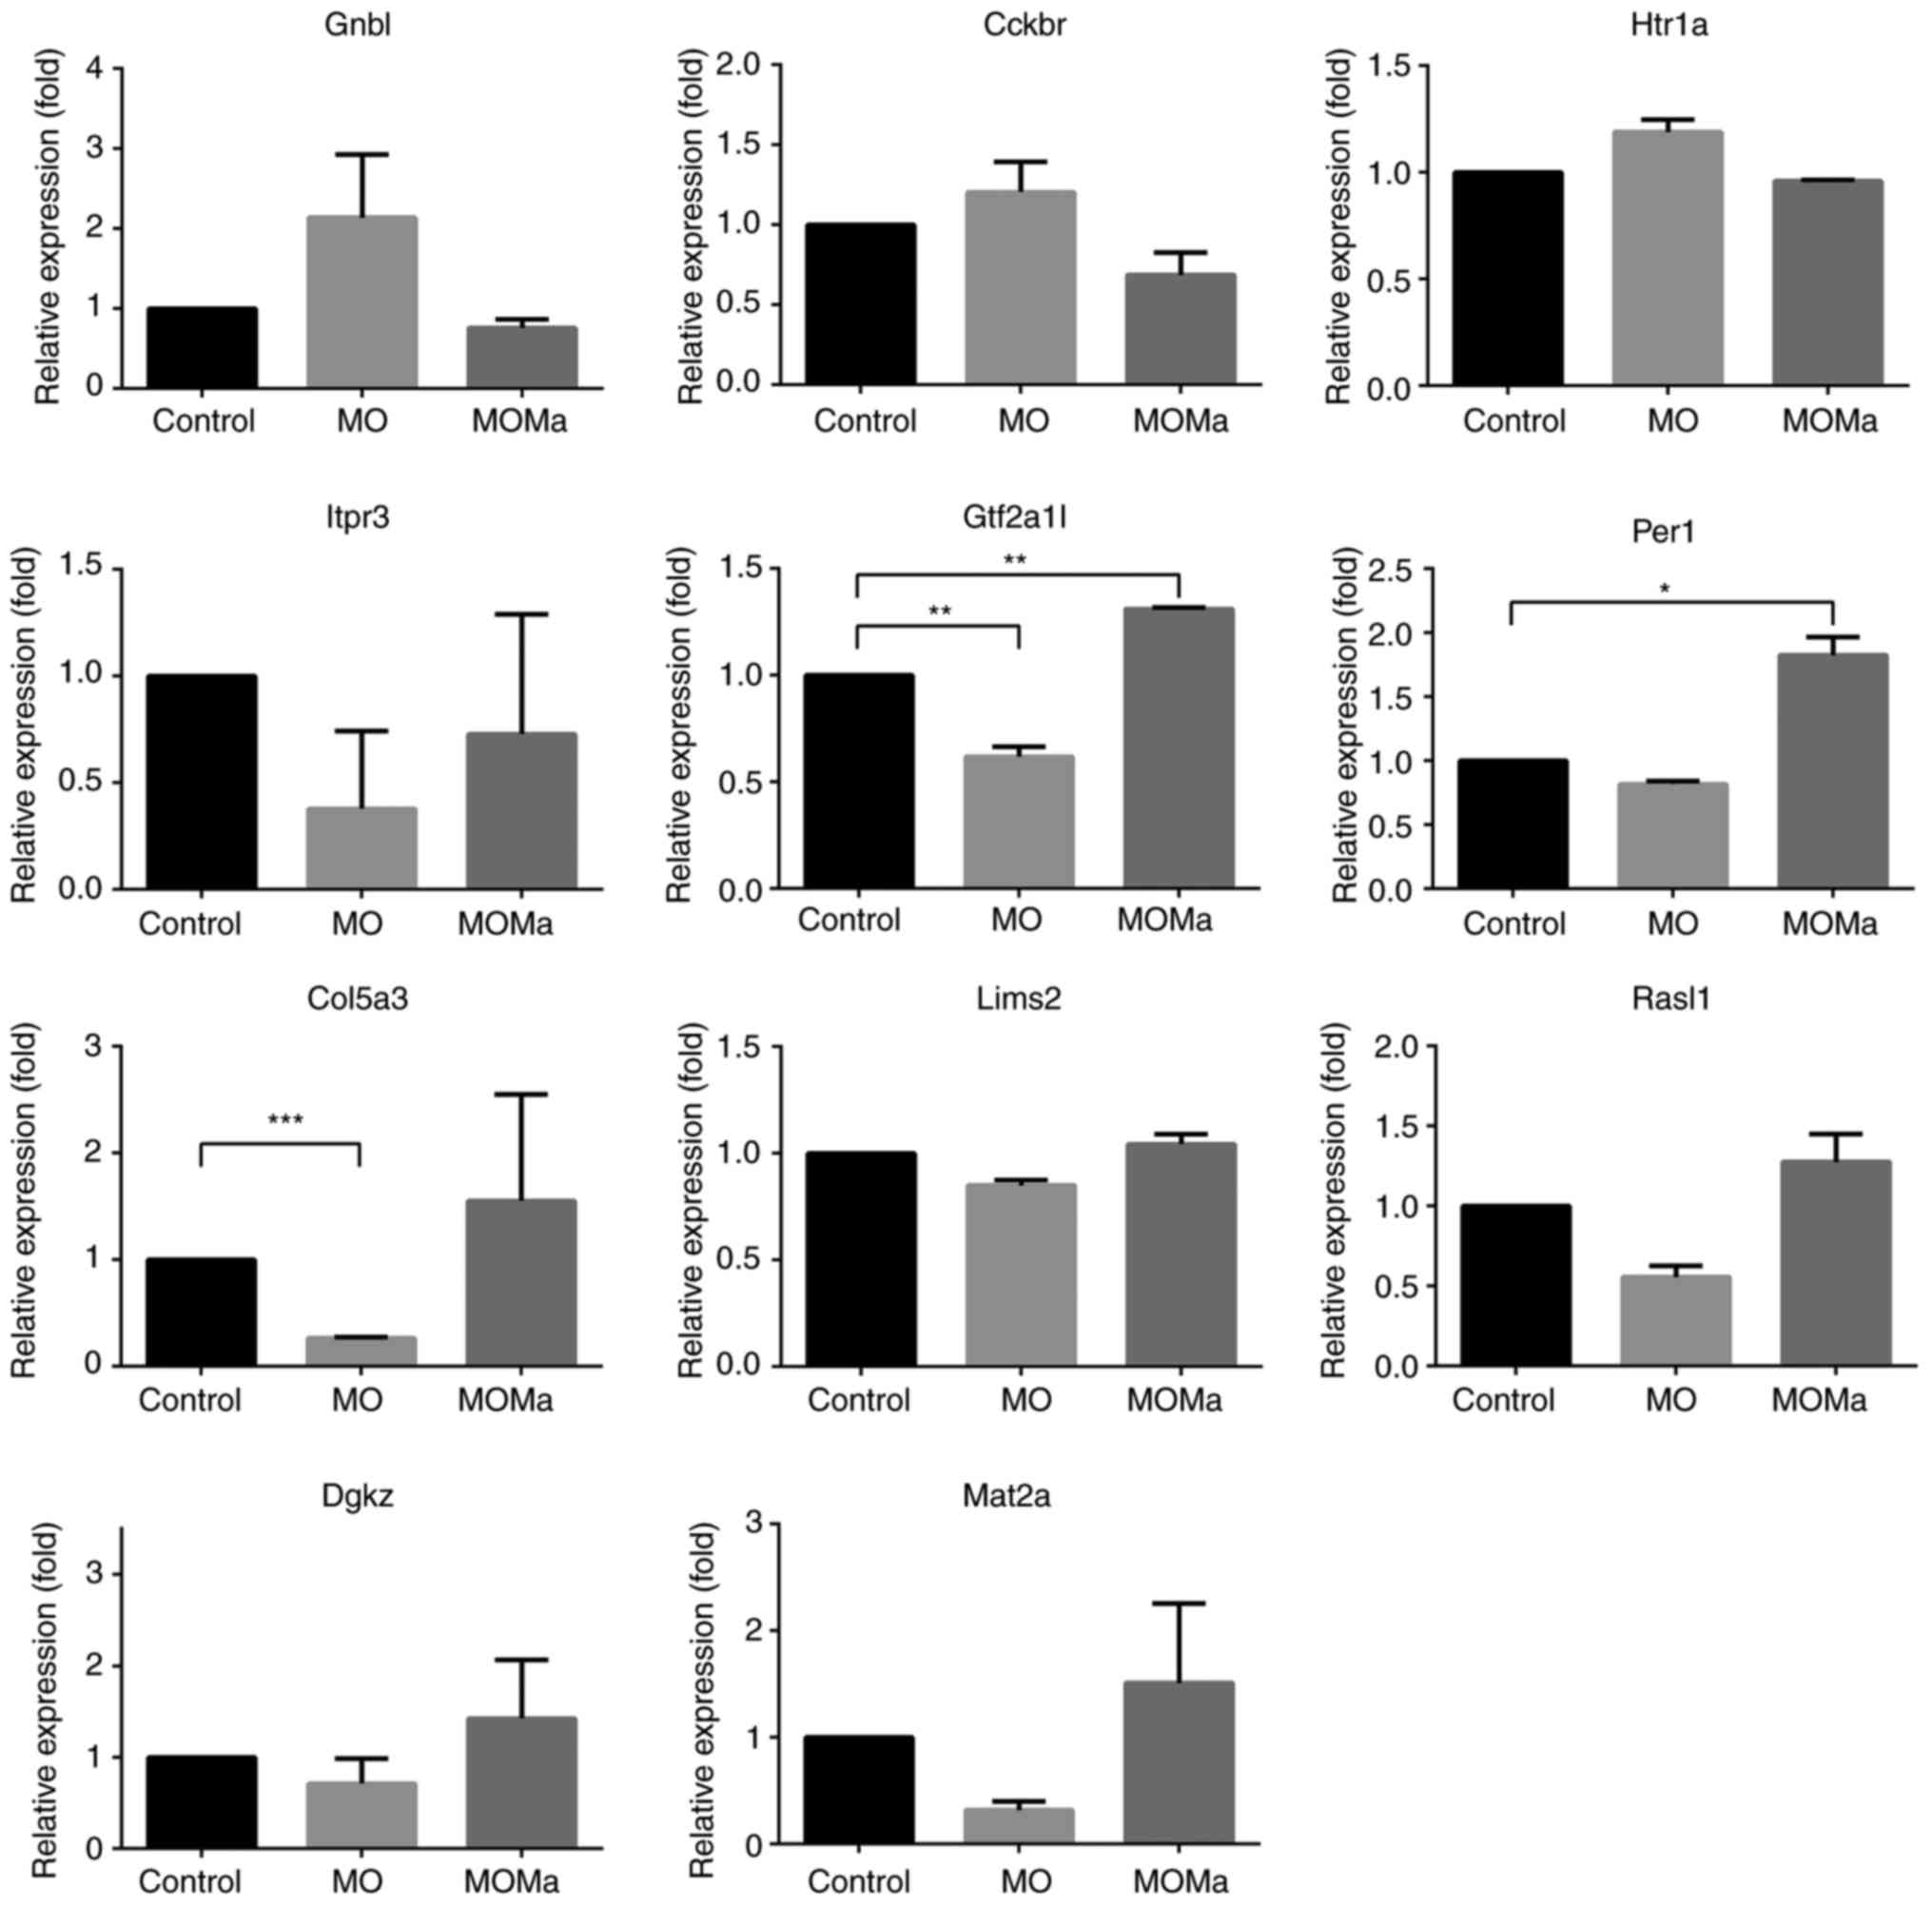 | Figure 4Expressions of genes of interests
determined by reverse transcription-quantitative polymerase chain
reaction. All expression levels were normalized using GAPDH
expression. *P<0.05, **P<0.01 and
***P<0.001 with comparison shown by lines. MO,
morphine (morphine infusion/vehicle injection/morphine challenge);
MOMa, (morphine infusion/melatonin injection/morphine challenge);
Gnb1, guanine nucleotide binding protein β polypeptide 1; Cckbr,
cholecystokinin B receptor; Htr1a, 5-hydroxytryptamine receptor 1A;
Itpr3, inositol 1,4,5-trisphosphate receptor type 3; Gtf2a1,
general transcription factor IIA subunit 1; Per1, period circadian
regulator 1; Col5a3, collagen type V α 3 chain; Lims2, LIM zinc
finger domain containing 2; RasI1, RAS protein activator like 1,
Dgkz, diaglycerol kinase ζ; Mat2a, methionine adenosyltransferase
2A. |
| Table VIPANTHER pathway mapped cellular
functions of four selected genes from Table V-A and -B. |
Table VI
PANTHER pathway mapped cellular
functions of four selected genes from Table V-A and -B.
A, PANTHER pathway
mapped cellular functions of four selected genes from Table V-A
|
|---|
| Gene name | Cellular
functions | Pathways |
|---|
| Guanine nucleotide
binding protein, β polypeptide 1 (Gnb1) | Neuron | |
|
Pain_Relief_anagelsia | Opioid
proopiomelanocortin pathway |
|
Pain_Relief_anagelsia | Opioid
proenkephalin pathway |
|
Pain_Relief_anagelsia | Enkephalin
release |
|
Pain_Relief_anagelsia | Cortocotropin
releasing factor receptor signaling pathway |
|
Pain_Relief_anagelsia | Opioid prodynorphin
pathway |
| Glutamertergic | Metabotropic
glutamate receptor group II pathway |
| Glutamertergic | Heterotrimeric
G-protein signaling pathway-rod outer segment
phototransduction |
| Glutamertergic | Metabotropic
glutamate receptor group III pathway |
| Cholinergic | Muscarinic
acetylcholine receptor 1 and 3 signaling pathway |
| Cholinergic | β1 adrenergic
receptor signaling pathway |
| Cholinergic | Muscarinic
acetylcholine receptor 2 and 4 signaling pathway |
| GABAergic |
GABA-B_receptor_II_signaling |
| GABAergic |
Endogenous_cannabinoid_signaling |
| Dopaminergic | Dopamine receptor
mediated signaling pathway |
| Serotonergic | 5HT2 type receptor
mediated signaling pathway |
| Serotonergic | 5HT4 type receptor
mediated signaling pathway |
| Depolarization | Nicotine
pharmacodynamics pathway |
| Sympathetic | β3 adrenergic
receptor signaling pathway |
| G protein mediated
pathway | β2 adrenergic
receptor signaling pathway |
| Inflammation | |
| G protein mediated
pathway | Histamine H1
receptor mediated signaling pathway |
| G protein mediated
pathway | Histamine H2
receptor mediated signaling pathway |
| G protein mediated
pathway | Heterotrimeric
G-protein signaling pathway-Gq a and Go α mediated pathway |
| G protein mediated
pathway |
Thyrotropin-releasing hormone receptor
signaling pathway |
| Others | |
| Signaling
pathway | Gonadotropin
releasing hormone receptor pathway |
| Signaling
pathway | PI3 kinase
pathway |
| Signaling
pathway | Wnt signaling
pathway |
| Angiogenesis | Angiotensin
II-stimulated signaling through G proteins and β-arrestin |
| Muscle
contraction | Oxytocin receptor
mediated signaling pathway |
| Cell migration | CCKR signaling
pathway |
| Cholecystokinin B
receptor (Cckbr) | Cell migration | CCKR signaling
pathway |
| 5-hydroxytryptamine
(serotonin) receptor 1A |
Neuron_Serotonergic | 5HT1 type receptor
mediated signaling pathway |
| G protein-coupled
(Htr1a) | G protein mediated
pathway | Heterotrimeric
G-protein signaling pathway-Gi α and Gs α mediated pathway |
| Dynein cytoplasmic
1 intermediate chain 1 (Dync1i1) | Neuron | Huntington
disease |
B, PANTHER pathway
mapped cellular functions of four selected genes from Table V-B
|
|---|
| Gene name | Cellular
functions | Pathways |
|---|
| Inositol
1,4,5-trisphosphate receptor type 3 (Itpr3) | Inflammation and
immunity | Inflammation
mediated by chemokine and cytokine signaling pathway |
| Histamine H1
receptor mediated signaling pathwayB cell activation |
| Cell proliferation
and migration | Gonadotropin
releasing hormone receptor pathway |
| Wnt signaling
pathway |
| Muscarinic
acetylcholine receptor 1 and 3 signaling pathway |
| PDGF signaling
pathway |
| G protein mediated
pathway | Angiotensin
II-stimulated signaling through |
| G proteins and
β-arrestin |
| Heterotrimeric
G-protein signaling pathway-Gq α and Go α mediated pathway |
| Vaso
relaxation | Endothelin
signaling pathway |
| RAS protein
activator like 1 (Rasal1) | Cell proliferation
and migration | FGF signaling
pathway |
| EGF receptor
signaling pathway |
| PDGF signaling
pathway |
| General
transcription factor subunit 1-like (Gtf2a1l) | Transcription
regulation | Transcription
regulation by bZIP transcription 2A |
| General
transcription regulation |
| Period circadian
protein | Biochemical
oscillator | Circadian clock
system |
| homolog 1
(Per1) | Cell proliferation
and migration | Gonadotropin
releasing hormone receptor pathway |
|
S-adenosylmethionine synthase isoform
type-2 (Mat2a) | Enzyme
activity | S adenosyl
methionine biosynthesis |
| Diacylglycerol
kinase ζ (Dgkz) | Cell proliferation
and migration | Gonadotropin
releasing hormone receptor pathway |
| α4 type V collagen
(Col5a3) | Cytoskeleton | Integrin signaling
pathway |
| Collagen α-1(XXVII)
chain (Col27a1) | Cytoskeleton | Integrin signaling
pathway |
| LIM and senescent
cell antigen-like-containing domain protein (Lims2) | Cytoskeleton | Integrin signaling
pathway |
| Mitogen-activated
protein kinase kinase kinase 6 (Map3k6) | Cell proliferation
and migration | FGF signaling
pathway |
Discussion
By using microarray analysis of rat spinal cords
from different treatment groups, the gene expression alterations in
different conditions were identified. Panels of gene expression
with upregulation in the MO group but downregulation in the MOMa
group and also inverted gene expression profiles between the MO/C
and MOMa/C groups were constructed. Among them, a number of notable
genes were identified following PANTHER pathway mapping. For
example, Gnb1 is one of the three subunits of heterotrimeric
guanine nucleotide binding proteins (G proteins), which integrate
signals between G protein coupled receptors (GPCR) (28). GPCR signaling is initiated when a
ligand-bound receptor activates heterotrimeric G proteins on the
inner leaflet of the plasma membrane by catalyzing the exchange of
GDP for GTP on G protein α subunit (Gα), causing it to release the
Gβγ subunits. The GTP-bound Gα and free Gβγ subunits transmit the
signal by engaging intracellular effector molecules until GTP is
hydrolysed and the β subunits are recoupled to the α subunit to
terminate signal transduction receptors and effectors (29). According to a study by Klein et
al (30), Gnb1 belongs to a
group of genes that is night/day differentially expressed in the
pineal body; this result implies the potential involvement of Gnb1
in melatonin treatment. Furthermore, β-arrestin-2 mediated
desensitization of the µ-opioid receptor is involved in
morphine tolerance (31,32). In the present data, Gnb1 was
upregulated in the MO group but downregulated by melatonin
treatment; this result indicates the potential of a role of
melatonin in the activation and desensitization of GPCR.
Another gene, Itpr3, was downregulated in the MO
group but upregulated in the MOMA group. It was also produced
following PANTHER pathway mapping. Itpr3 is the receptor for
inositol 1,4,5-trisphosphate (IP3), which mediates the
release of intracellular calcium (33). Following IP3 binding,
Itpr3 permits calcium flow out of the endoplasmic reticulum
(34) and results in the
activation of transient receptor potential cation channel subfamily
M member 5, which results in membrane depolarization (35). In the case of melatonin treatment
with Itpr3 upregulation, it was speculated that depolarization in
certain nerve cells in the spinal cord may participate in the
melatonin-derived attenuation of antinociceptive morphine
tolerance.
In the present model, long-term morphine
administration did not affect opioid receptor expression
potentially due to the alteration of signal transduction and
receptor-G protein coupling. It has been demonstrated that the
downregulation of opioid receptors following chronic agonist
exposure induces tolerance (36,37). However, a controversial report did
not observe the downregulation of opioid receptors in tolerant
animals (38). On the other hand,
studies suggest that β-arrestin-2 (Arrb2) binding causes OPR
desensitization, and OPR endocytosis and recycling are required for
receptor resensitization. This result suggests the potential
involvement of Arrb2 with morphine tolerance (31). However, in the present data, the
expression of Arrb2 between the groups was similar; the results did
not support the potential involvement of Arrb2 with morphine
tolerance. Combining the previous discussion with the present data,
it was postulated that the expression changes of opioid receptor
and Arrb2 are not mandatory for morphine tolerance mechanisms.
There are limitations in descriptive microarray
studies. The first limitation is that sequences in the microarray
will be refined in newer databases and will result in different
outcomes. Secondly, the associations between mRNAs may be different
between mice and humans (39).
The third limitation is that the gene expression detected by
microarrays is descriptive and may not reflect protein expression
and subsequent post-transcriptional modifications (40). However, identifying changes in
gene expression in tissues with a high-throughput approach remains
a good option as it can be performed in one experiment. Even though
the present study uses descriptive microarray analysis, a panel of
genes that are specifically expressed in morphine-tolerant animals
with or without melatonin treatment was produced. As it is
impossible to collect the spinal cord from patients, therefore
future studies will use drug databases to identify drugs which
target the genes of interest in the present study and use the drugs
in the same rat models as in the present study to assess the dosage
and efficacy of the drug in the treatment of relieving the morphine
tolerance. Following that, the drugs with efficacy in the rat model
will be used in humans. Next, patients who are under chronic
treatment and with morphine tolerance may be recruited to assess
the efficacy of the drug in order to ascertain the results of the
present and provide novel treatment methods. From the present
microarray analysis, novel insight into the molecular profiles
associated with morphine tolerance and the effects of melatonin was
provided. The present study offers a foundation for future specific
hypotheses testing on potential therapeutic targets derived from
melatonin treatment in patients with long-term morphine
exposure.
Funding
The present study was supported by research grants
from Ministry of Science and Technology (grant no. 105-231
4-B-281-003-MY2) and Cathay General Hospital (grant no.
CGH-MR-A10518) in Taiwan.
Authors’ contributions
YCC and RYT wrote the manuscript, were responsible
for conception and design, data analysis and interpretation. YTS
performed the microarray data analysis and interpretation. IJC was
in charge of the animal experiments. TYT and YYM performed the
RT-qPCR analysis and interpretation. CSW was responsible for
conception and design, financial support, administrative support,
final approval of manuscript.
Ethics approval and consent to
participate
The use of rats in this study adhered to the Guiding
Principles in the Care and Use of Animals of the American
Physiology Society and was ethically approved by the National
Defense Medical Center Animal Care and Use Committee (Taipei,
Taiwan).
Patient consent for publication
Not applicable.
Availability of data and materials
The datasets used and/or analyzed during the current
study are available from the corresponding author on reasonable
request.
Competing interests
The authors declare that they have no competing
interests.
Acknowledgments
The authors would like to thank Dr. Chih-Cheng Chien
for his advice about the research.
References
|
1
|
Chen WW, Zhang X and Huang WJ: Pain
control by melatonin: Physiological and pharmacological effects.
Exp Ther Med. 12:1963–1968. 2016. View Article : Google Scholar : PubMed/NCBI
|
|
2
|
Pasternak GW: When it comes to opiates,
just say NO. J Clin Invest. 117:3185–3187. 2007. View Article : Google Scholar : PubMed/NCBI
|
|
3
|
Günther T, Dasgupta P, Mann A, Miess E,
Kliewer A, Fritzwanker S, Steinborn R and Schulz S: Targeting
multiple opioid receptors-improved analgesics with reduced side
effects. Br J Pharmacol. 175:2857–2868. 2018. View Article : Google Scholar
|
|
4
|
Martini L and Whistler JL: The role of mu
opioid receptor desensitization and endocytosis in morphine
tolerance and dependence. Curr Opin Neurobiol. 17:556–564. 2007.
View Article : Google Scholar : PubMed/NCBI
|
|
5
|
Rosenblum A, Marsch LA, Joseph H and
Portenoy RK: Opioids and the treatment of chronic pain:
Controversies, current status, and future directions. Exp Clin
Psychopharmacol. 16:405–416. 2008. View
Article : Google Scholar : PubMed/NCBI
|
|
6
|
Pang CS, Tsang SF and Yang JC: Effects of
melatonin, morphine and diazepam on formalin-induced nociception in
mice. Life Sci. 68:943–951. 2001. View Article : Google Scholar : PubMed/NCBI
|
|
7
|
Lin SH, Huang YN, Kao JH, Tien LT, Tsai RY
and Wong CS: Melatonin reverses morphine tolerance by inhibiting
microglia activation and HSP27 expression. Life Sci. 152:38–43.
2016. View Article : Google Scholar : PubMed/NCBI
|
|
8
|
Song L, Wu C and Zuo Y: Melatonin prevents
morphine-induced hyperalgesia and tolerance in rats: Role of
protein kinase C and N-methyl-D-aspartate receptors. BMC
Anesthesiol. 15:122015. View Article : Google Scholar : PubMed/NCBI
|
|
9
|
Xin W, Chun W, Ling L and Wei W: Role of
melatonin in the prevention of morphine-induced hyperalgesia and
spinal glial activation in rats: Protein kinase C pathway involved.
Int J Neurosci. 122:154–163. 2012. View Article : Google Scholar
|
|
10
|
Feng YM, Jia YF, Su LY, Wang D, Lv L, Xu L
and Yao YG: Decreased mitochondrial DNA copy number in the
hippocampus and peripheral blood during opiate addiction is
mediated by autophagy and can be salvaged by melatonin. Autophagy.
9:1395–1406. 2013. View Article : Google Scholar : PubMed/NCBI
|
|
11
|
Yahyavi-Firouz-Abadi N, Tahsili-Fahadan P,
Riazi K, Ghahremani MH and Dehpour AR: Melatonin enhances the
anti-convulsant and proconvulsant effects of morphine in mice: Role
for nitric oxide signaling pathway. Epilepsy Res. 75:138–144. 2007.
View Article : Google Scholar : PubMed/NCBI
|
|
12
|
Raghavendra V and Kulkarni SK: Reversal of
morphine tolerance and dependence by melatonin: Possible role of
central and peripheral benzodiazepine receptors. Brain Res.
834:178–181. 1999. View Article : Google Scholar : PubMed/NCBI
|
|
13
|
Garmabi B, Vousooghi N, Vosough M,
Yoonessi A, Bakhtazad A and Zarrindast MR: Effect of circadian
rhythm disturbance on morphine preference and addiction in male
rats: Involvement of period genes and dopamine D1 receptor.
Neuroscience. 322:104–114. 2016. View Article : Google Scholar : PubMed/NCBI
|
|
14
|
Fan Y, Liang X, Wang R and Song L: Role of
endogenous melatoninergic system in development of hyperalgesia and
tolerance induced by chronic morphine administration in rats. Brain
Res Bull. 135:105–112. 2017. View Article : Google Scholar : PubMed/NCBI
|
|
15
|
Chou KY, Tsai RY, Tsai WY, Wu CT, Yeh CC,
Cherng CH and Wong CS: Ultra-low dose (+)-naloxone restores the
thermal threshold of morphine tolerant rats. J Formos Med Assoc.
112:795–800. 2013. View Article : Google Scholar : PubMed/NCBI
|
|
16
|
Guiding principles in the care and use
of animals of the American physiology society
|
|
17
|
Grossman ML, Basbaum AI and Fields HL:
Afferent and efferent connections of the rat tail flick reflex (a
model used to analyze pain control mechanisms). J Comp Neurol.
206:9–16. 1982. View Article : Google Scholar : PubMed/NCBI
|
|
18
|
Tsai RY, Chou KY, Shen CH, Chien CC, Tsai
WY, Huang YN, Tao PL, Lin YS and Wong CS: Resveratrol regulates
N-methyl-D-aspartate receptor expression and suppresses
neuroinflammation in morphine-tolerant rats. Anesth Analg.
115:944–952. 2012. View Article : Google Scholar : PubMed/NCBI
|
|
19
|
Pirooznia M, Nagarajan V and Deng Y:
GeneVenn-A web application for comparing gene lists using Venn
diagrams. Bioinformation. 1:420–422. 2007. View Article : Google Scholar : PubMed/NCBI
|
|
20
|
Xu J, Kelly R, Fang H and Tong W:
ArrayTrack: A free FDA bioinformatics tool to support emerging
biomedical research-an update. Hum Genomics. 4:428–434.
2010.PubMed/NCBI
|
|
21
|
Saldanha AJ: Java Treeview-extensible
visualization of microarray data. Bioinformatics. 20:3246–3248.
2004. View Article : Google Scholar : PubMed/NCBI
|
|
22
|
Gene ontology Enrichment analysis
website.
|
|
23
|
Mi H, Muruganujan A and Thomas PD: PANTHER
in 2013: Modeling the evolution of gene function, and other gene
attributes, in the context of phylogenetic trees. Nucleic Acids Res
41 (Database Issue). D377–D386. 2013.
|
|
24
|
Livak KJ and Schmittgen TD: Analysis of
relative gene expression data using real-time quantitative PCR and
the 2(−Delta Delta C(T)) method. Methods. 25:402–408. 2001.
View Article : Google Scholar
|
|
25
|
Roeckel LA, Le Coz GM, Gavériaux-Ruff C
and Simonin F: Opioid-induced hyperalgesia: Cellular and molecular
mechanisms. Neuroscience. 338:160–182. 2016. View Article : Google Scholar : PubMed/NCBI
|
|
26
|
Kwon HS, Johnson TV, Joe MK, Abu-Asab M,
Zhang J, Chan CC and Tomarev SI: Myocilin mediates myelination in
the peripheral nervous System through ErbB2/3 signaling. J Biol
Chem. 288:26357–26371. 2013. View Article : Google Scholar : PubMed/NCBI
|
|
27
|
Fontenille L, Rouquier S, Lutfalla G and
Giorgi D: Microtubule-associated protein 9 (Map9/Asap) is required
for the early steps of zebrafish development. Cell Cycle.
13:1101–1114. 2014. View
Article : Google Scholar : PubMed/NCBI
|
|
28
|
Downes GB and Gautam N: The G protein
subunit gene families. Genomics. 62:544–552. 1999. View Article : Google Scholar
|
|
29
|
Thal DM, Vuckovic Z, Draper-Joyce CJ,
Liang YL, Glukhova A, Christopoulos A and Sexton PM: Recent
advances in the determination of G protein-coupled receptor
structures. Curr Opin Struct Biol. 51:28–34. 2018. View Article : Google Scholar : PubMed/NCBI
|
|
30
|
Klein DC, Bailey MJ, Carter DA, Kim JS,
Shi Q, Ho AK, Chik CL, Gaildrat P, Morin F, Ganguly S, et al:
Pineal function: Impact of microarray analysis. Mol Cell
Endocrinol. 314:170–183. 2010. View Article : Google Scholar
|
|
31
|
Bohn LM, Gainetdinov RR, Lin FT, Lefkowitz
RJ and Caron MG: Mu-opioid receptor desensitization by
beta-arrestin-2 determines morphine tolerance but not dependence.
Nature. 408:720–723. 2000. View Article : Google Scholar : PubMed/NCBI
|
|
32
|
Zuo Z: The role of opioid receptor
internalization and beta-arrestins in the development of opioid
tolerance. Anesth Analg. 101:728–734, table of contents. 2005.
View Article : Google Scholar : PubMed/NCBI
|
|
33
|
Nagaleekar VK, Diehl SA, Juncadella I,
Charland C, Muthusamy N, Eaton S, Haynes L, Garrett-Sinha LA,
Anguita J and Rincón M: IP3 receptor-mediated Ca2+ release in naive
CD4 T cells dictates their cytokine program. J Immunol.
181:8315–8322. 2008. View Article : Google Scholar : PubMed/NCBI
|
|
34
|
Taylor CW and Tovey SC: IP(3) receptors:
Toward understanding their activation. Cold Spring Harb Perspect
Biol. 2:a0040102010. View Article : Google Scholar : PubMed/NCBI
|
|
35
|
Liu D and Liman ER: Intracellular Ca2+ and
the phospholipid PIP2 regulate the taste transduction ion channel
TRPM5. Proc Natl Acad Sci USA. 100:15160–15165. 2003. View Article : Google Scholar : PubMed/NCBI
|
|
36
|
Dang VC and Christie MJ: Mechanisms of
rapid opioid receptor desensitization, resensitization and
tolerance in brain neurons. Br J Pharmacol. 165:1704–1716. 2012.
View Article : Google Scholar :
|
|
37
|
Stafford K, Gomes AB, Shen J and Yoburn
BC: mu-Opioid receptor downregulation contributes to opioid
tolerance in vivo. Pharmacol Biochem Behav. 69:233–237. 2001.
View Article : Google Scholar : PubMed/NCBI
|
|
38
|
Polastron J, Meunier JC and Jauzac P:
Chronic morphine induces tolerance and desensitization of mu-opioid
receptor but not down-regulation in rabbit. Eur J Pharmacol.
266:139–146. 1994. View Article : Google Scholar : PubMed/NCBI
|
|
39
|
Wang L, Liu H, Jiao Y, Wang E, Clark SH,
Postlethwaite AE, Gu W and Chen H: Differences between mice and
humans in regulation and the molecular network of collagen, type
III, alpha-1 at the gene expression level: Obstacles that
translational research must overcome. Int J Mol Sci.
16:15031–15056. 2015. View Article : Google Scholar : PubMed/NCBI
|
|
40
|
Brodsky AN, Caldwell M and Harcum SW:
Glycosylation and post-translational modification gene expression
analysis by DNA microarrays for cultured mammalian cells. Methods.
56:408–417. 2012. View Article : Google Scholar :
|