Introduction
Hypertension has become a major factor in the global
burden of disease and mortality, contributing to millions of
mortalities every year caused by coronary heart disease and stroke
(1), peripheral vascular disease,
heart failure, chronic kidney disease, cognitive dysfunction and
dementia (2). Hypertension
remains a critical public health problem despite many developments
in the field, and advancements in the diagnosis, management and
control of the disease. Despite changes in lifestyle and
advancements in pharmacotherapy, the prevalence of hypertension
remains high. A survey in 2010 revealed that ~31% of the world's
population have hypertension, with more than one billion of these
from developing countries (3).
Maintaining homeostatic blood pressure (BP) is a complex process
regulated by multiple factors, including genetic factors,
environmental factors and endocrine regulation in the kidneys.
Studies have suggested that human gut microbiota may have a role in
the regulation of BP and the pathogenesis of hypertension (4-6) by
secreting a variety of microbe-derived bioactive metabolites, such
as short-chain fatty acids (7,8).
Metabolomics has identified new pathogenic pathways
involved in BP regulation (9,10).
However, identifying the causes of hypertension remains challenging
due to the heterogenic and complex nature of the disease. The adult
human gut microbiome is diverse, being made up of trillions of
microorganisms. Generally it is dominated by four phyla:
Firmicutes, Bacteroidetes, Actinobacteria and Proteobacteria
(11). An imbalance in the
composition of normal gut microbiota is commonly known as dysbiosis
(12). Although all healthy gut
microbiota have yet not been fully characterized, increasing
evidence from various reports suggests that changes in the ratio of
microbial communities, such as Firmicutes and Bacteroidetes (the
F/B ratio), can potentially be used as biomarkers identify
pathological conditions (13,14). A study using animals and human
patients showed that decreased microbial richness, evenness and
diversity, and an increased F/B ratio, resulting in gut microbiota
dysbiosis, were associated with hypertension (1).
Several studies have reported the effects of
probiotics on BP regulation (15-17). A meta-analysis of nine randomized
trials showed that a daily dose of ≥109 colony-forming units
probiotics significantly decreased both systolic BP (SBP) and
diastolic BP (DBP) in human patients with hypertension (15). These data indirectly suggest that
gut microbiota may have an important role in maintaining BP
homeostasis, and that an imbalance or any change in microbiota
composition may potentially be involved in the development of
hypertension. Many other studies have suggested that an imbalance
in the gut microbiota (or dysbiosis) can result in chronic
inflammatory diseases, such as inflammatory bowel disease
(encompassing ulcerative colitis and Crohn's disease), asthma,
allergies and infectious diseases (18,19), systemic diseases such as diabetes
(20), and other pathological
conditions, including obesity (21) and malnutrition (22). High-throughput sequencing
technologies and other parallel developments in nongenomic
techniques have made it possible to elucidate the notable role of
gut microbiota in human health and disease.
In the current study, standard metagenomic
techniques, such as high-throughput sequencing along with touchdown
PCR-denaturing gradient gel electrophoresis (DGGE) and quantitative
PCR (qPCR), were used to characterize gut microbial diversity in
patients diagnosed with grade 3 hypertension, with healthy
volunteers as controls.
Materials and methods
Study participants and design
The present study included 50 hypertensive patients
(28 males and 22 females). All of the patients were between 40 and
75 years of age and had grade 3 hypertension [according to the
World Health Organization BP classification (Table SI)]. Patients were examined and
excluded if they had any other acute or chronic inflammatory or
infectious disease. The control group included 30 healthy
volunteers (16 males and 14 females, aged 40-70 years). All of the
healthy volunteers were in good health with no history of
hypertension, or any other cardiovascular or chronic metabolic
disease. None of the patients or healthy individuals had a history
of taking any antibiotics, probiotics or prebiotics within the
preceding 30 days at the time of sampling. Informed written consent
was obtained from all participants in the study. The present study
was performed with the approval of the Ethical Committee of Xi'an
Jiaotong University School of Medical Sciences, under the
guidelines of the World Medical Association and the Declaration of
Helsinki. Fecal samples were collected in sterile cups and were
stored immediately at −80°C until the DNA extraction was carried
out.
Biochemical measurements (Data S1)
Blood pressure and lipid profile analysis data for
each patient were collected from the Cardiology Department of the
1st Affiliated Hospital of Xi'an Jiaotong University (Table SII). The mean values of each
analysis are summarized in Table
I.
 | Table ICharacteristics of study
participants. |
Table I
Characteristics of study
participants.
| Characteristic | HTN (n=50) | CG (n=30) | P-value |
|---|
| Sex
(male/female) | 28/22 | 16/14 | - |
| Age, years | 62.5±10.4 | 60.5±11 | 0.47 |
| Weight, kg | 68.4±8.01 | 65.3±5.9 | 0.07 |
| SBP, mmHg | 180.34±15.44 | 122.83±7.6 | <0.0001 |
| DBP, mmHg | 106.88±10.1 | 79.63±6.8 | <0.0001 |
| FBG, mmol/l | 5.05±0.87 | 4.22±0.64 | <0.0001 |
| TC, mmol/l | 4.07±0.82 | 4.34±0.90 | 0.17 |
| TG, mmol/l | 1.48±0.55 | 1.10±0.30 | <0.005 |
| HDL, mmol/l | 1.04±0.24 | 1.10±0.21 | 0.21 |
| LDL, mmol/l | 2.26±0.63 | 1.87±0.53 | <0.05 |
DNA extraction
Bacterial DNA was extracted using the Qiagen QIAamp
MiniStool kit (Qiagen GmbH), according to the manufacturer's
instructions. The concentration of extracted DNA was estimated via
the absorbance at 260 nm (A260), and the purity was determined by
calculating the A260/A280 ratio with a NanoDrop spectrophotometer
(Thermo Fisher Scientific, Inc.).
PCR-DGGE analysis
Universal primers for the V3 region of the 16S
ribosomal (r)RNA gene were used to amplify the bacterial DNA of the
study samples, using the fecal DNA as a template for PCR-DGGE
analysis. Each 50 µl PCR reaction mixture contained 1
µl of each primer, 1 µl dNTPs (10 mM), 5 µl
MgCl2 (25 mM), 5 µl 1X buffer, 0.4 µl Taq
DNA polymerase (Takara Bio, Inc.) and 2 µl fecal DNA. PCR
amplification was performed in an automated thermocycler (ABI2720;
Applied Biosystems; Thermo Fisher Scientific, Inc.) using a
touchdown PCR program in order to increase the PCR reaction
specificity. The PCR thermal profile conditions were as follows:
Initial denaturation at 95°C for 5 min, followed by 35 cycles of 1
min denaturation at 95°C, annealing at 65°C for 1 min and extension
at 72°C for 1 min (23). The PCR
products were electrophoresed in 1.5% agarose gel stained with
ethidium bromide in 1X Tris-acetate EDTA (TAE) buffer for
visualization under UV illumination. The primer sequences used for
PCR amplification are presented in Table II.
| Table IIPCR primers used in the study. |
Table II
PCR primers used in the study.
| Author, year | Analysis type | Target gene | Primer sequence
(5′-3′) | Product size,
bp | (Refs.) |
|---|
Muyzer et
al, 1993
| PCR-DGGE
| Bacterial 16s
rRNA
gene V3 region | 341 Fa CC
534 R |
TACGGGAGGCAGCAG
ATTACCGCGGCTGCTGG | 193
| (23) |
| Huijsdens et
al, 2002 | qPCR |
Bacteroides | Bac F
Bac R |
AAGGGAGCGTAGATGGATGTTTA
CGAGCCTCAATGTCAGTTGC | 193 | (68) |
| Matsuki et
al, 2002 | |
Prevotella | Pre F
Pre R |
ACAGTAAACGATGGATGCC
GGTCGGGTTGCAGACC | 513 | (69) |
| Bartosch et
al, 2004 | |
Clostridium | Clos F
Clos R |
CGGTACCTGACTAAGAAGC
AGTTTGATTCTTGCGAACG | 429 | (70) |
| Bartosch et
al, 2004 | | Escherichia
coli | E. coli
F
E. coli R |
CATTGACGTTACCGCAGAAGAAGC
CTCTACGAGACTCAAGCTTGC | 190 | (70) |
DGGE was executed using the DCode™ Universal
Mutation Detection System (Bio-Rad Laboratories, Inc.).
Sequence-specific separation of the amplicons was performed using
10% (w/v) polyacrylamide (acrylamide-bis, 37.5:1) gels in 1X TAE
buffer, containing 30-65% linear denaturing gradient.
Electrophoresis was performed at a constant voltage of 90 V at 60°C
for 13 h. The gels were stained with 5 µg/ml ethidium
bromide solution for 30 min, washed with deionized water and then
viewed under a Bio-Rad Gel Doc 2000 (Bio-Rad Laboratories, Inc.).
Comparison of DGGE profiles in the different gels was performed
using a standard reference DNA Marker (DL2000; Takara Bio, Inc.)
The distinct, prominent and frequent bands were cut from the gels,
washed with RNAse-free water, resuspended in 20 µl
RNAse-free water and stored at 4°C overnight. PCR was performed
again under the aforementioned conditions using V3 region primers
341F/534R, this time without a GC clamp. Re-amplified PCR products
were sequenced using the ABI 3500xL system (Applied Biosystems;
Thermo Fisher Scientific, Inc.). Sequences were scanned using the
Basic Local Alignment Search Tool (https://blast.ncbi.nlm.nih.gov/Blast.cgi) and Seqmatch
(http://rdp.cme.msu.edu/seqmatch/seqmatch_intro.jsp)
software to categorize the species or genera.
Statistical analysis of DGGE
Bacterial diversity was evaluated by band number and
band intensities in the DGGE profiles using Quantity One software
(version 4.6.2; Bio-Rad Laboratories, Inc.). The diversity of taxa
in the fecal microbiota was determined by Shannon-Weaver index
(H'). Similarity scoring and cluster analysis of DGGE profiles was
performed using the UPGMA method based on the Dice similarity
coefficient (24). SPSS software
(version 20; SPSS, Inc.) was used for the nonparametric statistical
analysis. Results are expressed as the mean ± standard
deviation.
qPCR analysis
To calculate the absolute copy number of
Bacteroides spp., Prevotella spp., Clostridium
spp. and Escherichia coli within the test samples, qPCR was
performed with a QuantiFast SYBR-Green PCR kit (Qiagen GmbH) using
the StepOne v2.3 real-time PCR detection system (Applied
Biosystems; Thermo Fisher Scientific, Inc.). The reaction mixture
(20 µl) was composed of 10 µl 2X SYBR-Green PCR mix
(Takara Bio, Inc.), 0.8 µl of each specific primer (Table II), 2 µl sample DNA and
6.4 µl sterile deionized water. The total copy number within
each sample was calculated by comparing with a standard curve
prepared from serially diluted plasmid DNA (of known concentration)
ranging from 102 to 108 copies/g of feces.
The qPCR data were analyzed using the absolute quantification
method (25). For each bacterial
group, a partial 16S rRNA gene sequence was amplified with PCR
primers (Table II), and was
subsequently cloned into the pMD18-T vector using the pMD™18-T
Vector Cloning kit (Takara Biotechnology Co., Ltd.), as described
previously (26). Negative
controls, containing all the elements of the reaction mixture
except the template DNA, were run along with each reaction. The
resultant bacterial populations were expressed as Log10 bacterial
replica counts in 1 g of the fecal mass. Triplicate samples were
used in each experiment and the mean values were obtained.
Student's t-test was used to calculate the significance (P<0.05)
between the two groups. Results are expressed as the mean ±
standard deviation.
High-throughput sequencing
A total of 30 fecal samples were randomly selected
for high-throughput sequencing and meta-analysis (20 samples from
the hypertensive group and 10 from the control group). The V3-V4
region of the 16S rRNA gene was amplified using specific primers:
515-F (5′-GTG CCA GCM GCC GCG GTA A-3′), 806-R (5′-GGA CTA CHV GGG
TWT CTA AT-3′), to create the amplicon libraries (27). The libraries were sequenced on an
Illumina HiSeq 2500 platform according to the manufacturer's
instructions. The raw data obtained were screened and assembled
using the QIIME (28) and FLASH
(29) software packages. The
bacterial sequencing data were grouped into operational taxonomic
units (OTUs) at a 97% similarity level against the Greengenes
database (30) using UCLUST
(31) version 1.2.22q. All of the
reads that failed to match the reference sequences were excluded;
this is referred to as a 'closed reference' approach to clustering.
A representative sequence for each OTU was screened for further
annotation. For each representative sequence, the Greengenes
database was used based on the RDP classifier (version 2.2)
algorithm (32). The α-diversity
analysis, including Shannon and Simpson diversity index, Chao1
algorithm, alternating conditional expectations (ACE) algorithm and
Good's coverage, was performed with QIIME (version 1.7.0) and
displayed using R software (version 2.15.3) (33). Student's t-test was used to
calculate the significant differences in α-diversity between the
two groups. P<0.05 was considered to indicate a statistically
significant difference. Linear discriminant analysis along with
effect size measurements was used to examine the differentially
significant taxa at each level. The relative abundances of phyla,
families, genera and species in each sample were calculated and
compared between the two groups. All statistical analyses were
carried out using SPSS software (version 20).
Results
Biochemical measurements
The biochemical variables analyzed are shown in
Table I. Briefly, the lipid
profile data were different between the groups (hypertensive
patients vs. healthy controls). Triglycerides, fasting blood
glucose and low-density lipoprotein levels were significantly
higher in the patients with hypertension compared with healthy
controls (P<0.05). There was no significant difference in total
cholesterol and high-density lipoprotein between the two groups.
However, the SBP and DBP were markedly higher in the patients with
hypertension.
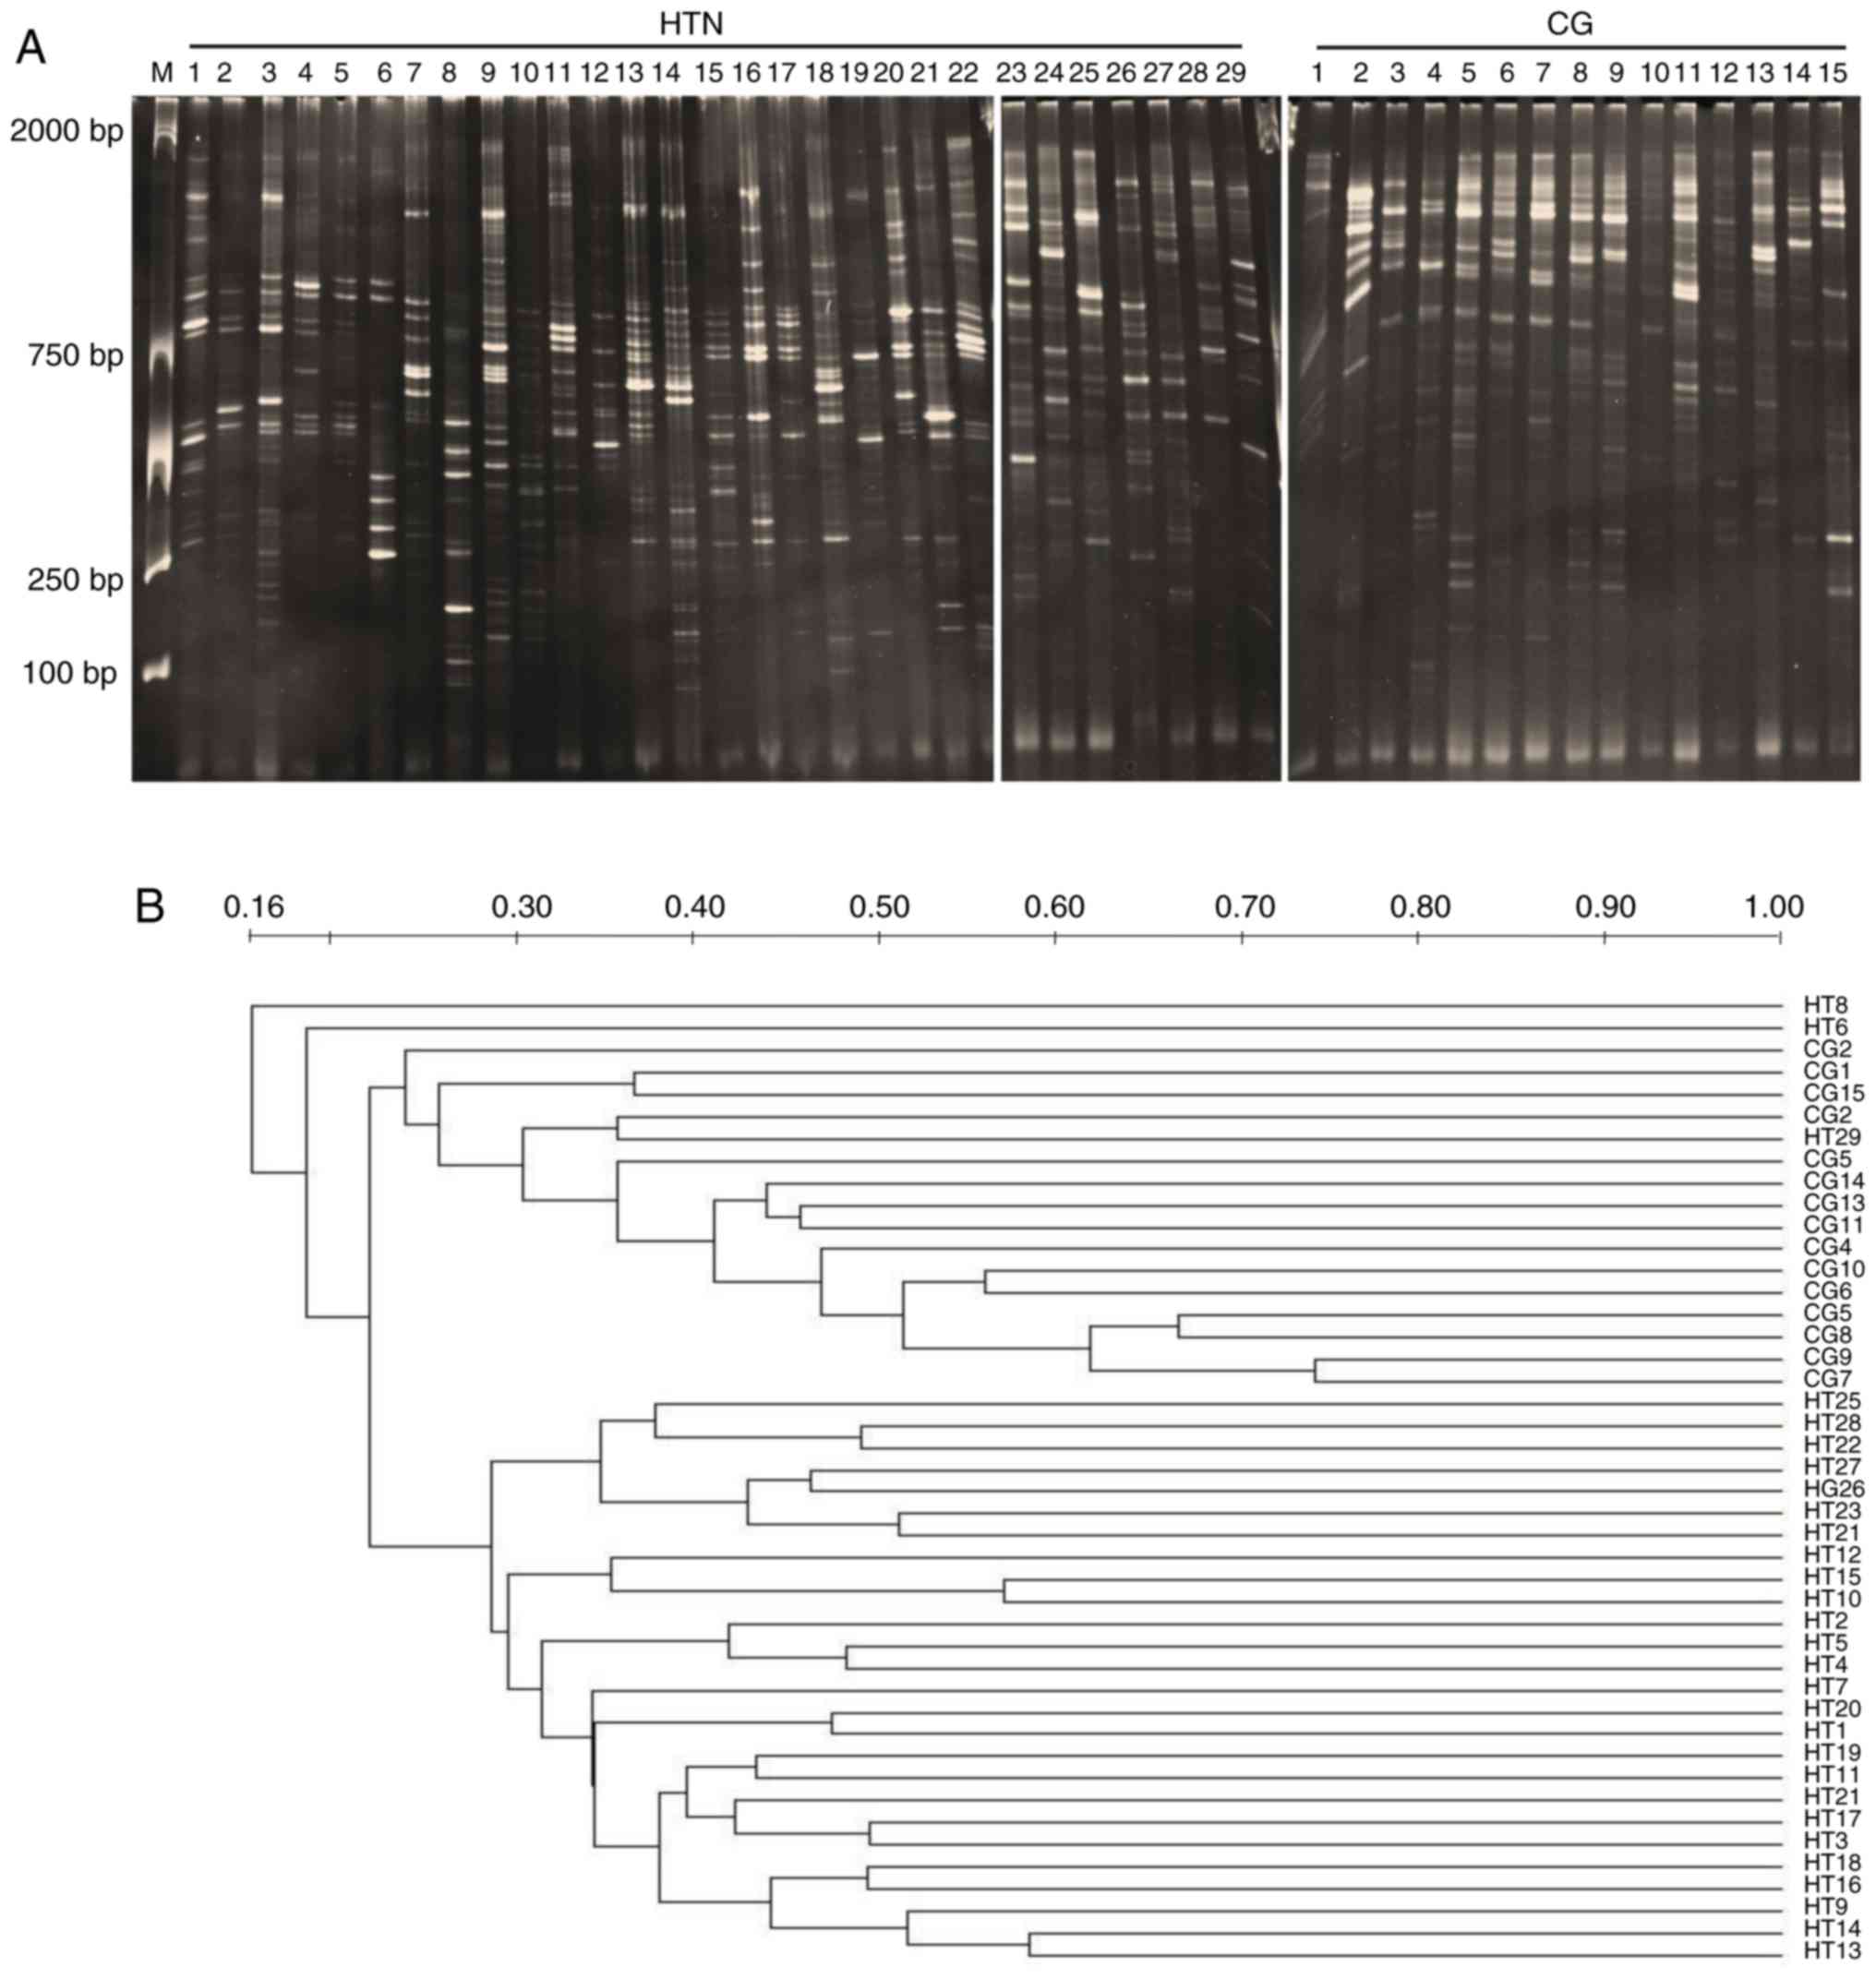
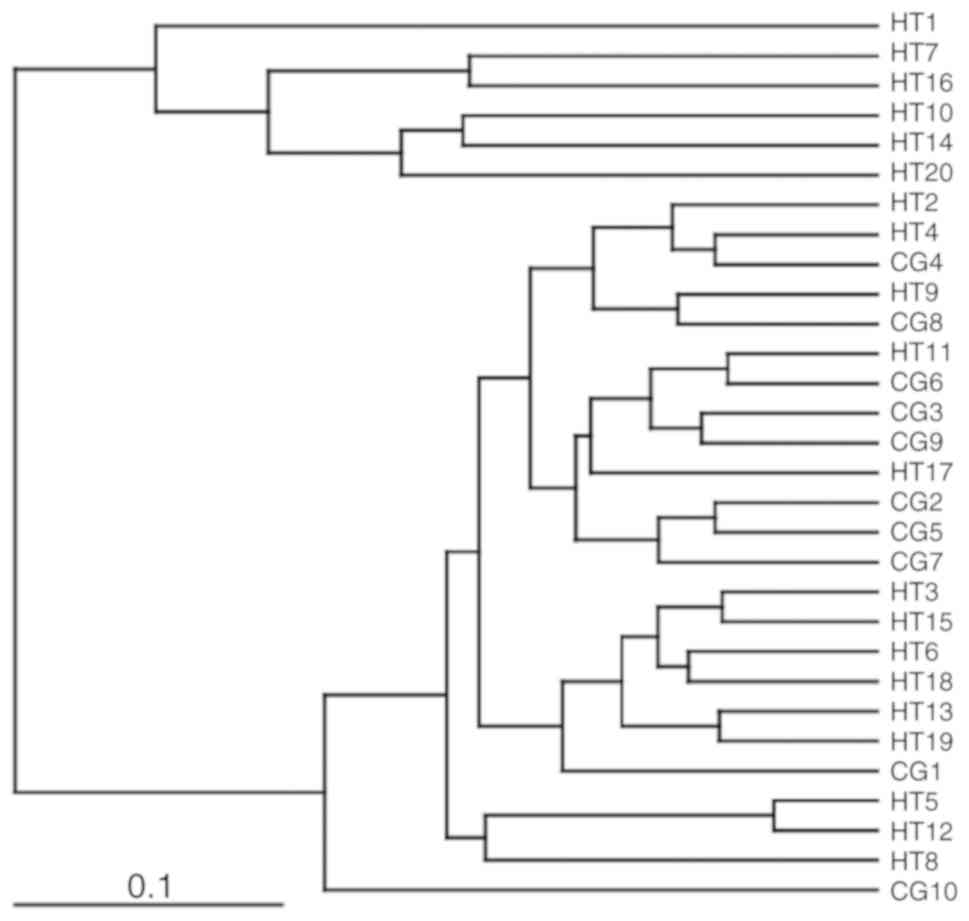
DGGE profile analysis of the gut
microbial communities
The results from DGGE analysis are shown in Fig. 1A. The DGGE profile band number and
the Shannon diversity index (H′) analysis, used to estimate the gut
microbial diversity within the two groups, are presented in
Table III. The similarity
levels of DGGE profiles, measured by the Dice similarity
coefficient and unweighted pair group method with arithmetic mean
dendrogram, are shown in Fig. 1B.
As shown in Table III, the
intragroup similarity of the hypertensive group was significantly
higher than the healthy control group (P<0.05). Comparing all
the samples, the intergroup similarity index was lower than the
intragroup similarity index. These results demonstrated that the
gut microbiota of the hypertension group were different from the
healthy control group. Dominant bands from different positions
within the DGGE profiles were further analyzed by sequencing.
Bacteroidetes and Firmicutes appeared to be the dominant bacterial
phyla within both study groups (Table SIII).
| Table IIIMicrobiota diversity and similarity
of the study groups. |
Table III
Microbiota diversity and similarity
of the study groups.
| Analysis | Group
| P-value |
|---|
| HTN (n=29) | CG (n=15) |
|---|
| Microbiota
diversity | | | |
| DGGE bandsa (mean ± SD) | 21.8±5.85 | 16.3±4.31 | 0.22 |
| Shannon
indexb (mean H′/H′ max ±
SD) | 3.01±0.29 | 2.72±0.27 | 0.72 |
| Microbiota
similarity | | | |
|
Intra-groupc
(mean ± SD) | 30.47±9.42 | 25.86±11.93 | 0.001 |
|
Inter-groupd
(mean ± SD) | 24.13±10.01 | - | <0.001 |
Species-specific qPCR analysis
qPCR analysis was performed to quantify the changes
in Bacteroides spp., Prevotella spp.,
Clostridium spp. and Escherichia coli in fecal
samples from the two groups. There was a significant increase in
Clostridium spp. and Prevotella spp. in the
hypertension group compared with the healthy controls (P<0.05;
Table IV). E. coli was
also increased in the hypertension group, but was not significantly
different compared with the control group. Triplicate samples were
used to calculate the mean within each experiment.
| Table IVAnalysis of bacterial count by
quantitative PCR. |
Table IV
Analysis of bacterial count by
quantitative PCR.
| Bacteria | HTN C (mean ±
SD) | G (mean ± SD) | P-value |
|---|
| Bacteroides
spp. | 6.97±1.45 | 6.96±1.06 | 0.89 |
| Prevotella
spp.a | 5.36±2.03 | 5.08±1.58 | 0.04 |
| Clostridium
spp.a | 6.78±0.79 | 6.59±0.38 | 0.02 |
| Escherichia
coli | 5.38±1.11 | 4.91±1.01 | 0.86 |
High-throughput sequencing analysis of
gene sequences
The comparative statistics of the PCR sequences were
estimated using 1,758,974 amplicons at the V3-V4 site of the 16S
rRNA gene from 20 patients with hypertension and 10 healthy
controls. Among these, the sum of the high-throughput sequencing
reads [1,352,991 (860,339 hypertension and 492,652 healthy control,
with an average of 46,654.86 per sample)] passed quality control
and were processed for further analysis. The total unique tag
counts detected in the hypertension and control groups were 197,167
and 99,191, respectively (with an average of 10,219.24 for all
samples). The total number of OTUs assigned was 5,566 (3,653
hypertension and 1,913 healthy control, with an average of 192 per
sample). The sum of the unique tags from the two groups was
296,358, which revealed the total phylotypes in the present study,
and after deletion of linkage primers, the length of the average
sequence was 421 bp.
Gut microbial diversity and
composition
The richness and diversity of the microbial
community were calculated at the 97% similarity level. Rarefaction
curves indicated that the microbial communities were well
represented for most of the samples, and there were no obvious
differences in the rarefaction curves between the two groups
(Fig. S1). The number (mean) of
bacterial OTUs and the observed species were higher in the
hypertension group compared with the healthy control group
(Table V). Good's coverage was
~99% for all sequences, indicating that the 16S rRNA sequences
identified in the two groups were the major bacterial sequences
present in the study samples. The α-diversity, determined using the
nonparametric ACE and Chao1 algorithms, was significantly higher in
the hypertension group than in the healthy individuals (P=0.02 and
P=0.03, respectively). The study samples were divided into two
clusters, based on UniFrac metrics (Fig. 2).
| Table VGut bacterial richness and diversity
index at 97% similarity, analyzed by high-throughput
sequencing. |
Table V
Gut bacterial richness and diversity
index at 97% similarity, analyzed by high-throughput
sequencing.
| Index | Group
| P-value |
|---|
| HTN | CG |
|---|
| Observed
species | 182.6 | 169.7 | 0.3 |
| OTUs | 209.3 | 191.3 | 0.12 |
| Shannon | 4.36 | 4.25 | 0.63 |
| Simpson | 0.89 | 0.88 | 0.88 |
| Chao1a | 225.7 | 192.73 | 0.03 |
| ACEa | 226.1 | 194.98 | 0.02 |
| Good's
coverage | 0.9988 | 0.9988 | 1.000 |
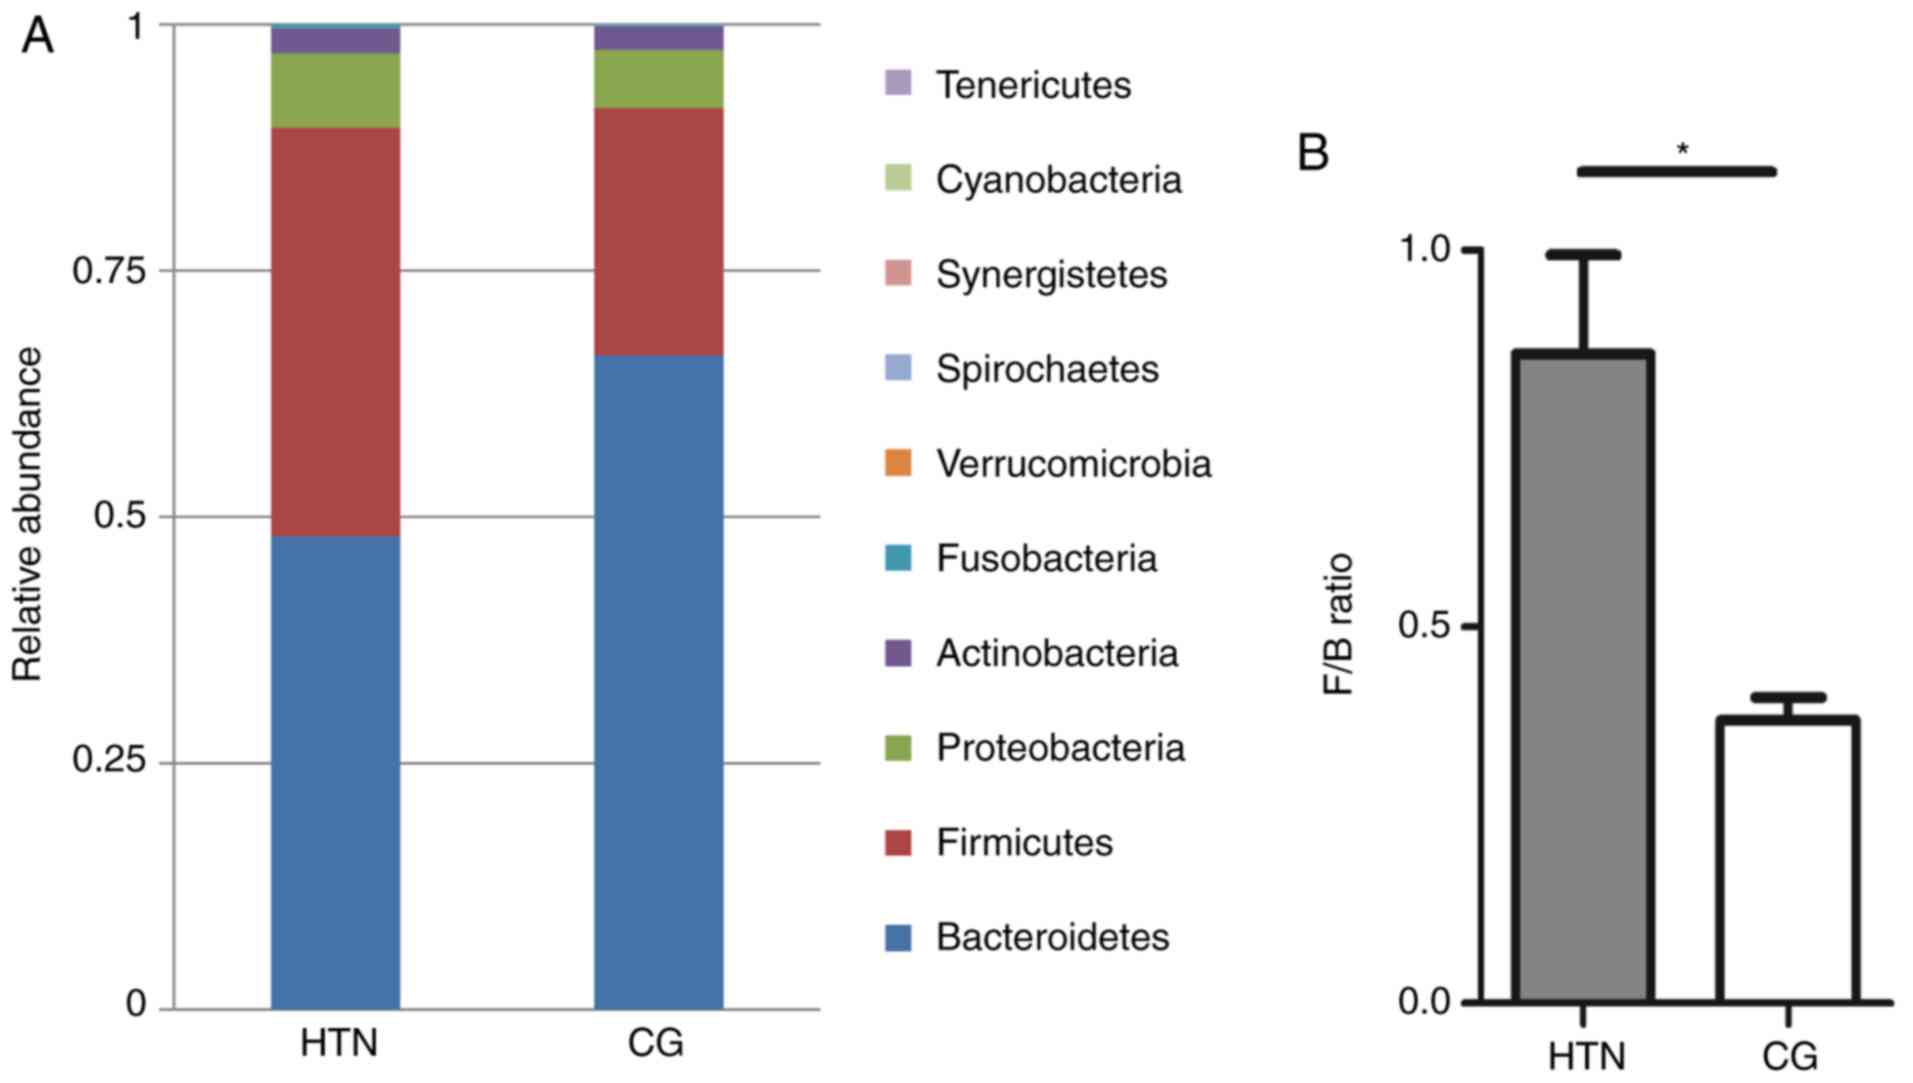
Gut microbiota distribution at the phylum
level
The bacterial composition was assessed on a
taxonomic basis at the phylum, family, genus and species levels,
and the taxa that accounted for >1-0.5% were considered. With
respect to the 15 phyla sequenced, the composition of the gut
microbiota was different in the two study groups (Fig. 3A). The dominant phyla in all
samples were Bacteroidetes (56.58%), Firmicutes (33.89%),
Proteobacteria (6.74%) and Actinobacteria (1.99%), but the only
statistically significant quantitative difference between the two
groups was in the F/B ratio, which was significantly increased in
the hypertension group (P=0.02) compared with the control group
(Fig. 3B). Statistical data of
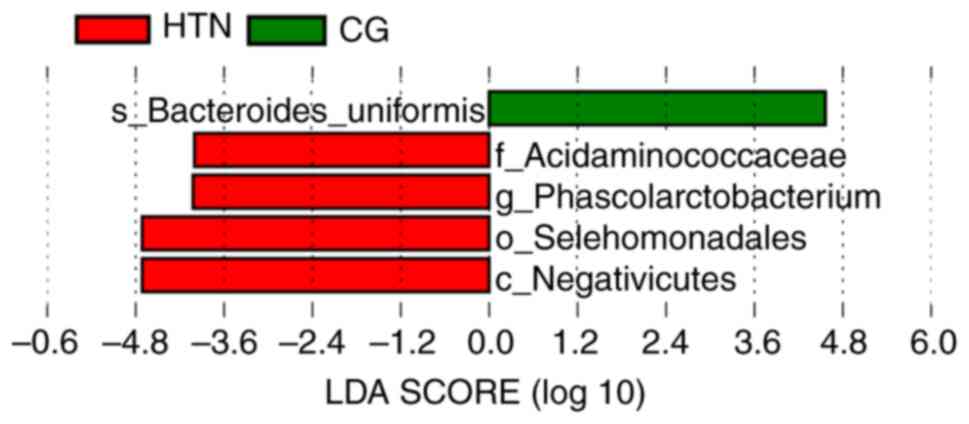
the top 10 phyla are presented in Table SIV. Linear discriminant analysis
and effect size measurement was performed, and it was demonstrated
that the most differentially abundant bacterial taxa in patients
with hypertension were from the phylum Firmicutes (Fig. 4).
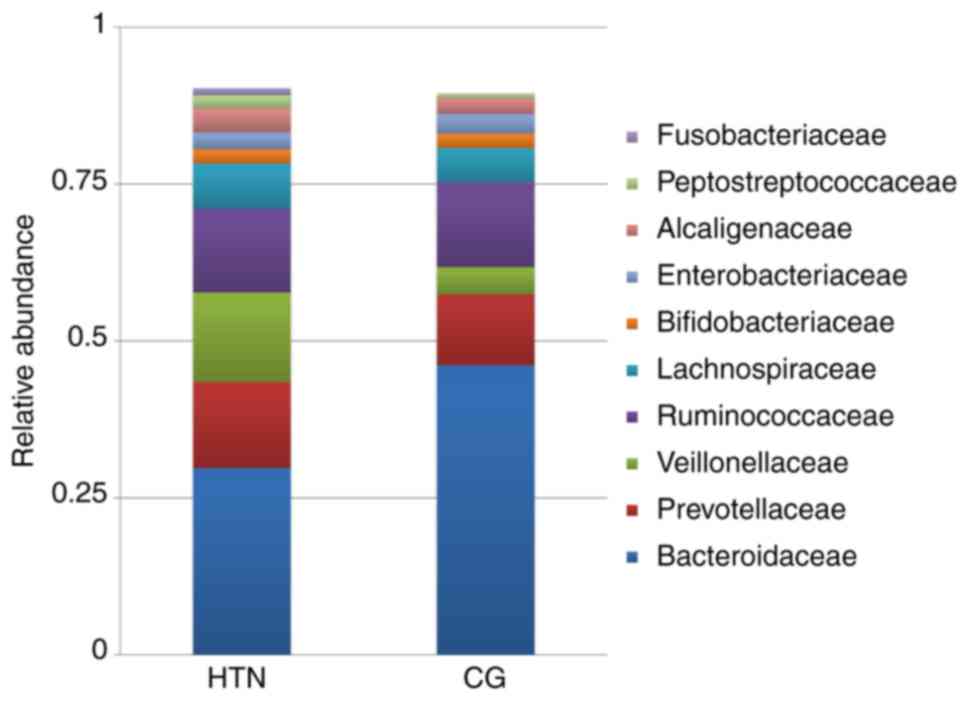
Gut microbial distribution at the family
level
At the family level, 76 families were sequenced.
Among the 10 most prevalent families, Prevotellaceae,
Veillonellaceae and Lachnospiraceae were increased in the
hypertension group compared with the control group (Fig. 5). In these families, the relative
abundance of Bacteroidaceae was lower in patients with hypertension
compared with healthy controls. Quantitative differences at the
family level are presented in Table
SIV.
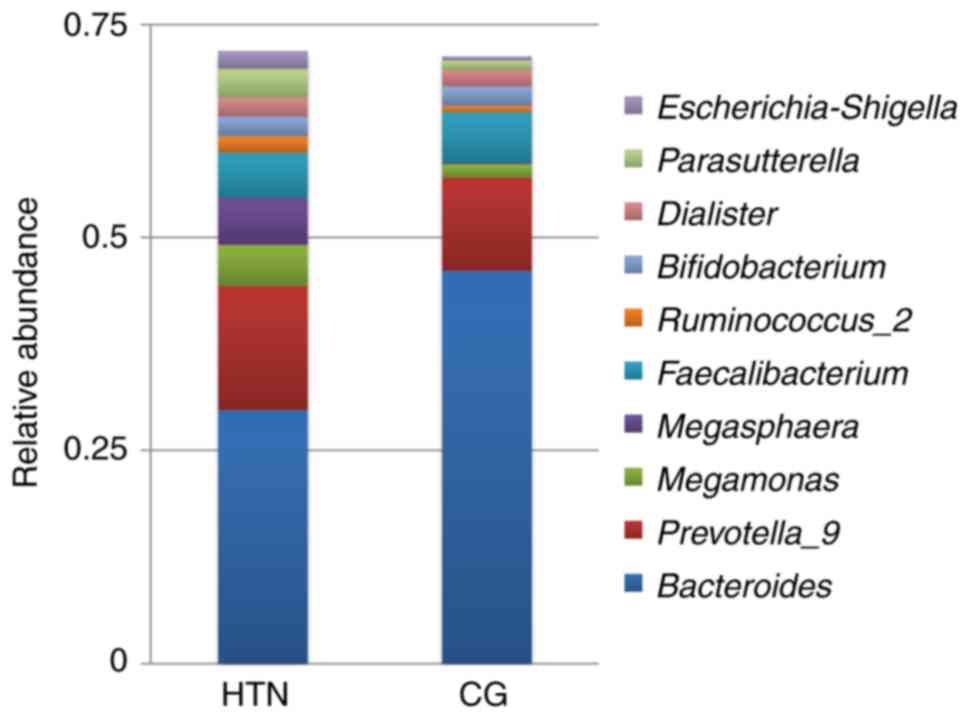
Gut microbial distribution at the genus
level
The high-throughput sequencing identified 175
different genera in the samples. Among the 10 top most prevalent
genera, the abundance of Prevotella_9, Megasphaera,
Parasutterella and Escherichia-Shigella was
significantly increased in the patients with hypertension compared
with the healthy control group (Fig.
6). Quantitative differences at the genus level are presented
in Table SIV.
Gut microbial distribution at the species
level
Faecalibacterium prausnitzii, which accounts
for up to 14% of the total fecal microbiota and has been reported
to be the major source of butyrate-producing bacteria (34), was significantly reduced in the
hypertension group. Other important butyrate-producing bacterial
species in the human colon, such as Roseburia inulinivorans
and Anaerostipes hadrus, were reduced in the hypertension
group, although not to a significant level. In addition,
Bacteroides uniformis was also reduced in the hypertension
group compared with the healthy controls, while
Phascolarctobacterium faecium was increased in patients with
hypertension. No significant differences among Klebsiella
spp., Streptococcus spp. and Parabacteroides merdae
were observed in our study groups (data not shown). These results
suggested that there was considerable dissimilarity between the
hypertension and healthy control groups at the species level. The
bacterial composition as evaluated by high-throughput sequencing at
the species level is presented in Table SV.
Comparative evaluation of analytical
techniques used
In the current study, the gut microbiota analysis
was performed using three molecular techniques. DGGE and
high-throughput sequencing detected the same dominant bacteria,
mainly Bacteriodetes and Firmicutes; however, high-throughput
sequencing revealed more diversity among bacterial communities and
a greater number of phylotypes than PCR-DGGE. The results of qPCR
and high-throughput sequencing illustrated the same variations in
the composition of the total bacterial community. Overall, the
results from the three analytical techniques were in general
concordance.
Discussion
Balance in the gut microbiota is key for maintaining
intestinal immunity and homeostasis. A fluctuation in this balance
may lead to destructive pathophysiological outcomes (35). Hypertension is the most important,
modifiable and potentially reversible risk factor for stroke in all
age groups, and is closely associated with SBP and DBP,
particularly in patients who experience intracerebral hemorrhage
(36,37). The current study focused on
molecular characterization of the gut microbiota from patients with
hypertension, compared with healthy controls. The compositional
characteristics of the gut microbiota in the two groups were
determined by PCR-DGGE analysis targeting the V3 region of the
bacterial 16S rRNA gene with imaging and sequencing, qPCR followed
by statistical analysis, and high-throughput sequencing of randomly
selected samples from the two groups. The α-diversity, measured by
the nonparametric ACE and Chao1 algorithms, was significantly
higher in the hypertension group, while the Shannon and Simpson
index did not indicate significant differences between the two
groups. The gut microbiota distribution was analyzed at the phylum,
genus and species levels, and variations between the hypertension
and control groups were observed.
Firmicutes, Bacteroidetes and Proteobacteria were
the dominant phyla in all the samples, with variable proportions
between the two groups. There was a significant difference in the
F/B ratio between the groups, with an increased ratio in the
hypertension group compared with the control group. An increased
F/B ratio, due to an increase in Firmicutes or a decline in
Bacteroidetes counts, is broadly considered to be an indicator of
gut microbiota dysbiosis and is associated with obesity, diabetes
mellitus and cardiovascular disease (15,21,38). The F/B ratio is well validated in
rodent and human samples; however, in pig models it requires
further confirmation (39,40).
These findings clearly indicated the role of the F/B ratio in the
pathophysiology of hypertension. Spirochaetes were also increased
in the hypertension group; however, this phylum was a very small
proportion of the total population (0.03%).
Phascolarctobacterium spp. and
Veillonellaceae belong to the same class within the
Firmicutes phylum and produce high quantities of short chain fatty
acids, acetate and propionate (41,42). The butyrate produced is
predominantly used by colonocytes, while acetate and propionate are
largely taken up by the liver. Acetate promotes
hypercholesterolemia and hypertriglyceridemia, and results in liver
steatosis, as it used for cholesterol and fatty acid production
(43). Members of the
Veillonellaceae family are generally responsible for
polymicrobial infections, such as osteoarticular infections or
endocarditis, and are rarely associated with monomicrobial
infections in humans (44). In
the present study, there was an increased abundance of the
Veillonellaceae family in patients with hypertension
compared with the control group.
At the genus level, there was an increased in the
abundance of Prevotella _9, Megasphaera,
Parasutterella and Escherichia-Shigella in the
hypertension group, as compared with the healthy control group. It
has previously been reported that the expansion of Prevotella
copri, an intestinal bacterium, is associated with enhanced
susceptibility to arthritis (45,46). Prevotella copri express a
superoxide reductase and phosphoadenosine phosphosulfate reductase
that may promote the development of inflammation. Furthermore,
Prevotella copri was shown to enhance body weight loss and
aggravate epithelial inflammation in a mouse model of colitis
(45). Prevotella was
overrepresented in individuals with hypertension in the present
study, which is consistent with a previous study by Li et al
(47), which indicated that these
organisms may be increased as a response to hypertension; further
investigations may strengthen the association of this bacteria with
hypertension. Previous studies have shown that
Parasutterella is increased by sugar and alcohol consumption
(48,49). An increased abundance of
Parasutterella in the gut is associated with dysbiosis, or a
lack of microbial diversity (50,51). It has been reported
Parasutterella is increased in the submucosa of the ileum in
patients with Crohn's disease (50) and in rodents with
hypertriglyceridemia-related acute necrotizing pancreatitis
(51). However,
Parasutterella is a relatively a new discovery, and
additional research is required to further establish its role in
hypertension and gut microbial dysbiosis.
Escherichia-Shigella is closely genetically related to E.
coli and produces Shiga-toxin that can cause various
afflictions, including hemorrhagic colitis, septicemia, severe
gastrointestinal tract inflammations in the ileocolonic area,
thrombocytopenia, problems in urinary duct channels and hemolytic
uremic syndrome (52).
At the species level, the data of the current study
demonstrated that Faecalibacterium prausnitzii and
Bacteroides uniformis were significantly decreased in the
patients with hypertension compared with the healthy control group.
Faecalibacterium prausnitzii, the sole known species of the
Faecalibacterium genus, is one of the most common gut
bacteria, which represents >10% of the intestinal microbiota in
healthy individuals. It is reported to boost the immune system and
serve as an anti-inflammatory agent (53). Low or depleted levels of F.
prausnitzii are associated with inflammation and observed in a
number of diseases, including inflammatory bowel diseases such as
Crohn's (54). Increased gut
microbial diversity with enrichment of bacterial colonies that
produce metabolites such as short-chain fatty acids is favorable
and helps to maintain normal physiological homeostasis (5). Faecalibacteria produce
butyrate and other short-chain fatty acids through the fermentation
of dietary fiber. Butyrate is considered to be one of the most
useful short-chain fatty acids that benefits human health via
several mechanisms; it reduces the inflammation in adipose tissue
and the intestine (55), protects
against obesity (induced by food) (56) and cardiovascular disease (57), and improves insulin sensitivity in
patients with type 2 diabetes mellitus (58,59). Yan et al (60) reported that Klebsiella
spp., Streptococcus spp. and Parabacteroides merdae
were frequently distributed in hypertensive gut microbiota, but in
our study groups no significant differences among these bacteria
were observed. The current study revealed the relative predominance
of various microbial populations in the gut at the phylum, genus
and species levels in fecal samples from patients with grade 3
hypertension and the healthy controls. The findings illustrate a
clear disparity between the study groups, and population
comparisons revealed a clear difference in the intestinal microbial
populations between the hypertension and healthy control
groups.
Limitations of the present study include the
difficulty of obtaining the human intestinal contents for microbial
community analysis. Ideally, mucosal biopsy samples should be used
instead of stool samples, as mucosal microbiota may differ from
stool microbiota. However, mucosal sampling presents practical
challenges, including disruption of the biofilm when the biopsy is
performed and the effect of bowel preparation prior to colonoscopy
on the microbiota (61,62). Stool samples are therefore used as
a proxy for the study of the gut microbiota as these samples are
easier to collect than biopsy samples, especially in healthy
volunteers. However, animal experiments need to be performed and
the gut microbiota of patients with hypertension may be
transplanted into germ-free animals to verify the association of
gut dysbiosis with hypertension. Diet is considered another
important factor influencing the gut microbial community. In the
present study, it was not possible to evaluate the relationship
between the gut microbiota and dietary habits of the participants
because of the incomplete nutritional information. However, the
conclusions are unlikely to be affected by this potential
confounding factor, due to likely similar dietary habits and
lifestyles of the enrolled subjects from Xi'an, China.
The findings from the DGGE and high-throughput
sequencing were consistent and stable. PCR-DGGE is a useful
molecular fingerprinting method to qualitatively analyze bacterial
communities, especially in the identification of dominant bacteria
within a sample. DGGE is fast and multiple samples can be analyzed
simultaneously (63). However, it
is a semi-quantitative technique and does not give direct
phylogenetic identification; thus, it is not optimized for
numerical assessment of gut microbiota components (64). When qPCR is used in combination
with DGGE, it can provide more detailed information on the
diversity and abundance of the gut microbiota (65-67). Metagenomics is the most recent
development in the study of the gut microbiota. It is a more
sensitive, advanced and authenticated technique, and may be more
suitable for examining the microbial ecology. Despite being
comparatively expensive, metagenomic techniques have the advantages
that they are high throughput, phylogenetically characterize the
microbiota components, and quantify the relative proportions of
organisms present. On the other hand, PCR-DGGE analysis may be
useful as a preliminary test to analyze larger shifts in the
bacterial community, as it is economical and less time consuming
than high-throughput sequencing.
In conclusion, the findings of current study
revealed that the gut microbiota composition was different in the
patients with hypertension compared with the healthy control group.
More specifically, there was a significant difference in the
similarity of bacterial populations, with a significantly increased
F/B ratio in the patients with hypertension. It was concluded that
hypertension-associated gut dysbiosis is characterized by an
imbalance in the normal gut flora. Understanding the fluctuations
in microbial composition, and the F/B ratio in particular, may help
to identify potential biomarkers for hypertension and other related
diseases.
Supplementary Data
Acknowledgments
The authors would like to thank Dr Lei Jine
(Department of Pathology, First Affiliated Hospital of Xi'an
Jiaotong University) for providing the samples from the grade 3
hypertensive patients. The authors are indebted to the Center for
Disease Control and Prevention of Shaanxi Province for the
equipment and technical support.
Funding
This project was funded by the National Natural
Science Foundation of China (grant no. NSFC81730056).
Availability of data and materials
The datasets used and/or analyzed during the current
study are available from the corresponding author on reasonable
request.
Authors' contributions
NM designed and executed the experiments, analyzed
the data and wrote the manuscript. SH helped in the analyses and
interpretation of data. SZ, LY, HL, SU, YW helped perform the
experiments. JX conceived and designed the study, critically
reviewed and drafted the manuscript and take responsibility for the
integrity of the work as a whole. All authors read and approved the
final manuscript.
Ethics approval and consent to
participate
Informed written consent was obtained from all
participants in the study. The present study was performed with the
approval of the Ethical Committee of Xi'an Jiaotong University
School of Medical Sciences, under the guidelines of the World
Medical Association and the Declaration of Helsinki.
Patient consent for publication
Informed written consent for publication was
obtained from all the participants.
Competing interests
The authors declare that they have no competing
interests.
References
|
1
|
Lim SS, Vos T, Flaxman AD, Danaei G,
Shibuya K, Adair-Rohani H, Amann M, Anderson HR, Andrews KG, Aryee
M, et al: A comparative risk assessment of burden of disease and
injury attributable to 67 risk factors and risk factor clusters in
21 regions, 1990-2010: A systematic analysis for the global burden
of disease study 2010. Lancet. 380:2224–2260. 2012. View Article : Google Scholar : PubMed/NCBI
|
|
2
|
Lackland DT and Weber MA: Global burden of
cardiovascular disease and stroke: Hypertension at the core. Can J
Cardiol. 31:569–571. 2015. View Article : Google Scholar : PubMed/NCBI
|
|
3
|
Mills KT, Bundy JD, Kelly TN, Reed JE,
Kearney PM, Reynolds K, Chen J and He J: Global disparities of
hypertension prevalence and control: A systematic analysis of
population-based studies from 90 countries. Circulation.
134:441–450. 2016. View Article : Google Scholar : PubMed/NCBI
|
|
4
|
Durgan DJ, Ganesh BP, Cope JL, Ajami NJ,
Phillips SC, Petrosino JF, Hollister EB and Bryan RM Jr: Role of
the gut microbiome in obstructive sleep apnea-induced hypertension.
Hypertension. 67:469–474. 2016. View Article : Google Scholar :
|
|
5
|
Yang T, Santisteban MM, Rodriguez V, Li E,
Ahmari N, Carvajal JM, Zadeh M, Gong M, Qi Y, Zubcevic J, et al:
Gut dysbiosis is linked to hypertension. Hypertension.
65:1331–1340. 2015. View Article : Google Scholar : PubMed/NCBI
|
|
6
|
Mell B, Jala VR, Mathew AV, Byun J,
Waghulde H, Zhang Y, Haribabu B, Vijay-Kumar M, Pennathur S and Joe
B: Evidence for a link between gut microbiota and hypertension in
the Dahl rat. Physiol Genomics. 47:187–197. 2015. View Article : Google Scholar : PubMed/NCBI
|
|
7
|
Nutting CW, Islam S and Daugirdas JT:
Vasorelaxant effects of short chain fatty acid salts in rat caudal
artery. Am J Physiol. 261:H561–H567. 1991.PubMed/NCBI
|
|
8
|
Pluznick JL, Zou DJ, Zhang X, Yan Q,
Rodriguez-Gil DJ, Eisner C, Wells E, Greer CA, Wang T, Firestein S,
et al: Functional expression of the olfactory signaling system in
the kidney. Proc Natl Acad Sci USA. 106:2059–2064. 2009. View Article : Google Scholar : PubMed/NCBI
|
|
9
|
Galla S, Chakraborty S, Mell B,
Vijay-Kumar M and Joe B: Microbiotal-host interactions and
hypertension. Physiology (Bethesda). 32:224–233. 2017.
|
|
10
|
Menni C, Graham D, Kastenmuller G, Alharbi
NH, Alsanosi SM, McBride M, Mangino M, Titcombe P, Shin SY, Psatha
M, et al: Metabolomic identification of a novel pathway of blood
pressure regulation involving hexadecanedioate. Hypertension.
66:422–429. 2015. View Article : Google Scholar : PubMed/NCBI
|
|
11
|
Thursby E and Juge N: Introduction to the
human gut microbiota. Biochem J. 474:1823–1836. 2017. View Article : Google Scholar : PubMed/NCBI
|
|
12
|
Sekirov I, Russell SL, Antunes LC and
Finlay BB: Gut micro-biota in health and disease. Physiol Rev.
90:859–904. 2010. View Article : Google Scholar : PubMed/NCBI
|
|
13
|
Sanz Y and Moya-Perez A: Microbiota,
inflammation and obesity. Adv Exp Med Biol. 817:291–317. 2014.
View Article : Google Scholar : PubMed/NCBI
|
|
14
|
Mariat D, Firmesse O, Levenez F, Guimarăes
V, Sokol H, Doré J, Corthier G and Furet JP: The
firmicutes/bacteroidetes ratio of the human microbiota changes with
age. BMC Microbiol. 9:1232009. View Article : Google Scholar : PubMed/NCBI
|
|
15
|
Khalesi S, Sun J, Buys N and Jayasinghe R:
Effect of probiotics on blood pressure: A systematic review and
meta-analysis of randomized, controlled trials. Hypertension.
64:897–903. 2014. View Article : Google Scholar : PubMed/NCBI
|
|
16
|
Mann GV: Studies of a surfactant and
cholesteremia in the Maasai. Am J Clinl Nutr. 27:464–469. 1974.
View Article : Google Scholar
|
|
17
|
Kiessling G, Schneider J and Jahreis G:
Long-term consumption of fermented dairy products over 6 months
increases HDL cholesterol. Eur J Clin Nutr. 56:843–849. 2002.
View Article : Google Scholar : PubMed/NCBI
|
|
18
|
Collado MC, Rautava S, Isolauri E and
Salminen S: Gut micro-biota: A source of novel tools to reduce the
risk of human disease? Pediatr Res. 77:182–188. 2015. View Article : Google Scholar
|
|
19
|
Frank DN, St Amand AL, Feldman RA,
Boedeker EC, Harpaz N and Pace NR: Molecular-phylogenetic
characterization of microbial community imbalances in human
inflammatory bowel diseases. Proc Natl Acad Sci USA.
104:13780–13785. 2007. View Article : Google Scholar : PubMed/NCBI
|
|
20
|
Qin J, Li R, Raes J, Arumugam M, Burgdorf
KS, Manichanh C, Nielsen T, Pons N, Levenez F, Yamada T, et al: A
human gut microbial gene catalogue established by metagenomic
sequencing. Nature. 464:59–65. 2010. View Article : Google Scholar : PubMed/NCBI
|
|
21
|
Ley RE, Turnbaugh PJ, Klein S and Gordon
JI: Microbial ecology: Human gut microbes associated with obesity.
Nature. 444:1022–1023. 2006. View Article : Google Scholar : PubMed/NCBI
|
|
22
|
Kau AL, Ahern PP, Griffin NW, Goodman AL
and Gordon JI: Human nutrition, the gut microbiome and the immune
system. Nature. 474:327–336. 2011. View Article : Google Scholar : PubMed/NCBI
|
|
23
|
Muyzer G, de Waal EC and Uitterlinden AG:
Profiling of complex microbial populations by denaturing gradient
gel electrophoresis analysis of polymerase chain reaction-amplified
genes coding for 16S rRNA. Appl Environ Microbiol. 59:695–700.
1993.PubMed/NCBI
|
|
24
|
Fromin N, Hamelin J, Tarnawski S, Roesti
D, Jourdain-Miserez K, Forestier N, Teyssier-Cuvelle S, Gillet F,
Aragno M and Rossi P: Statistical analysis of denaturing gel
electrophoresis (DGE) fingerprinting patterns. Environ Microbiol.
4:634–643. 2002. View Article : Google Scholar : PubMed/NCBI
|
|
25
|
Lu Y, Xie L and Chen J: A novel procedure
for absolute real-time quantification of gene expression patterns.
Plant Methods. 8:92012. View Article : Google Scholar : PubMed/NCBI
|
|
26
|
Sun H, Tang JW, Fang CL, Yao XH, Wu YF,
Wang X and Feng J: Molecular analysis of intestinal bacterial
microbiota of broiler chickens fed diets containing fermented
cottonseed meal. Poult Sci. 92:392–401. 2013. View Article : Google Scholar : PubMed/NCBI
|
|
27
|
Peiffer JA, Spor A, Koren O, Jin Z, Tringe
SG, Dangl JL, Buckler ES and Ley RE: Diversity and heritability of
the maize rhizosphere microbiome under field conditions. Proc Natl
Acad Sci USA. 110:6548–6553. 2013. View Article : Google Scholar : PubMed/NCBI
|
|
28
|
Caporaso JG, Kuczynski J, Stombaugh J,
Bittinger K, Bushman FD, Costello EK, Fierer N, Peña AG, Goodrich
JK, Gordon JI, et al: QIIME allows analysis of high-throughput
community sequencing data. Nat Methods. 7:335–336. 2010. View Article : Google Scholar : PubMed/NCBI
|
|
29
|
Magoc T and Salzberg SL: FLASH: Fast
length adjustment of short reads to improve genome assemblies.
Bioinformatics. 27:2957–2963. 2011. View Article : Google Scholar : PubMed/NCBI
|
|
30
|
DeSantis TZ, Hugenholtz P, Larsen N, Rojas
M, Brodie EL, Keller K, Huber T, Dalevi D, Hu P and Andersen GL:
Greengenes, a chimera-checked 16S rRNA gene database and workbench
compatible with ARB. Appl Environ Microbiol. 72:5069–5072. 2006.
View Article : Google Scholar : PubMed/NCBI
|
|
31
|
Edgar RC: Search and clustering orders of
magnitude faster than BLAST. Bioinformatics. 26:2460–2461. 2010.
View Article : Google Scholar : PubMed/NCBI
|
|
32
|
Wang Q, Garrity GM, Tiedje JM and Cole JR:
Naive bayesian classifier for rapid assignment of rRNA sequences
into the new bacterial taxonomy. App Environ Microbiol.
73:5261–5267. 2007. View Article : Google Scholar
|
|
33
|
Team RC: R: A language and environment for
statistical computing. R foundation for statistical computing;
Vienna, Austria: 2012
|
|
34
|
De Vuyst L, Moens F, Selak M, Riviere A
and Leroy F: Summer meeting 2013: Growth and physiology of
bifidobacteria. J Appl Microbiol. 116:477–491. 2014. View Article : Google Scholar
|
|
35
|
Kearney PM, Whelton M, Reynolds K, Whelton
PK and He J: Worldwide prevalence of hypertension: A systematic
review. J Hypertens. 22:11–19. 2004. View Article : Google Scholar : PubMed/NCBI
|
|
36
|
Arima H, Chalmers J, Woodward M, Anderson
C, Rodgers A, Davis S, Macmahon S and Neal B; PROGRESS
Collaborative Group: Lower target blood pressures are safe and
effective for the prevention of recurrent stroke: The PROGRESS
trial. J Hyperten. 24:1201–1208. 2006. View Article : Google Scholar
|
|
37
|
Goldstein LB, Adams R, Alberts MJ, Appel
LJ, Brass LM, Bushnell CD, Culebras A, Degraba TJ, Gorelick PB,
Guyton JR, et al: Primary prevention of ischemic stroke: A
guideline from the american heart association/American stroke
association stroke council: Cosponsored by the atherosclerotic
peripheral vascular disease interdisciplinary working group;
cardiovascular nursing council; clinical cardiology council;
nutrition, physical activity, and metabolism council; and the
quality of care and outcomes research interdisciplinary working
group: The American academy of neurology affirms the value of this
guideline. Stroke. 37:1583–1633. 2006. View Article : Google Scholar : PubMed/NCBI
|
|
38
|
Tilg H and Kaser A: Gut microbiome,
obesity, and metabolic dysfunction. J Clin Invest. 121:2126–2132.
2011. View Article : Google Scholar : PubMed/NCBI
|
|
39
|
Duca FA, Sakar Y, Lepage P, Devime F,
Langelier B, Doré J and Covasa M: Replication of obesity and
associated signaling pathways through transfer of microbiota from
obese-prone rats. Diabetes. 63:1624–1636. 2014. View Article : Google Scholar : PubMed/NCBI
|
|
40
|
Pedersen R, Andersen AD, Molbak L,
Stagsted J and Boye M: Changes in the gut microbiota of cloned and
non-cloned control pigs during development of obesity: Gut
microbiota during development of obesity in cloned pigs. BMC
Microbiol. 13:302013. View Article : Google Scholar : PubMed/NCBI
|
|
41
|
Duncan SH, Holtrop G, Lobley GE, Calder
AG, Stewart CS and Flint HJ: Contribution of acetate to butyrate
formation by human faecal bacteria. Br J Nutr. 91:915–923. 2004.
View Article : Google Scholar : PubMed/NCBI
|
|
42
|
Watanabe Y, Nagai F and Morotomi M:
Characterization of Phascolarctobacterium succinatutens sp. Nov.an
asaccharolytic, succinate-utilizing bacterium isolated from human
feces. Appl Environ Microbiol. 78:511–518. 2012. View Article : Google Scholar :
|
|
43
|
Wong JM, de Souza R, Kendall CW, Emam A
and Jenkins DJ: Colonic health: Fermentation and short chain fatty
acids. J Clin Gastroenterol. 40:235–243. 2006. View Article : Google Scholar : PubMed/NCBI
|
|
44
|
Marchandin H and Jumas-Bilak E: The family
Veillonellaceae: The prokaryotes: Firmicutes and tenericutes.
Rosenberg E, DeLong EF, Lory S, Stackebrandt E and Thompson F:
Springer, Berlin Heidelberg; Berlin, Heidelberg: pp. 433–453.
2014
|
|
45
|
Hofer U: Microbiome: Anelloviridae go
viral. Nat Rev Microbiol. 12:4–5. 2014. View Article : Google Scholar
|
|
46
|
Scher JU, Sczesnak A, Longman RS, Segata
N, Ubeda C, Bielski C, Rostron T, Cerundolo V, Pamer EG, Abramson
SB, et al: Expansion of intestinal Prevotella copri correlates with
enhanced susceptibility to arthritis. ELife. 2:e012022013.
View Article : Google Scholar : PubMed/NCBI
|
|
47
|
Li J, Zhao F, Wang Y, Chen J, Tao J, Tian
G, Wu S, Liu W, Cui Q, Geng B, et al: Gut microbiota dysbiosis
contributes to the development of hypertension. Microbiome.
5:142017. View Article : Google Scholar : PubMed/NCBI
|
|
48
|
Zhang X, Wang H, Yin P, Fan H, Sun L and
Liu Y: Flaxseed oil ameliorates alcoholic liver disease via
anti-inflammation and modulating gut microbiota in mice. Lipids
Health Dis. 16:442017. View Article : Google Scholar : PubMed/NCBI
|
|
49
|
Noble EE, Hsu TM, Jones RB, Fodor AA,
Goran MI and Kanoski SE: Early-life sugar consumption affects the
rat micro-biome independently of obesity. J Nutr. 147:20–28. 2017.
View Article : Google Scholar
|
|
50
|
Chiodini RJ, Dowd SE, Chamberlin WM,
Galandiuk S, Davis B and Glassing A: Microbial population
differentials between mucosal and submucosal intestinal tissues in
advanced crohn's disease of the ileum. PLoS One. 10:e01343822015.
View Article : Google Scholar : PubMed/NCBI
|
|
51
|
Huang C, Chen J, Wang J, Zhou H, Lu Y,
Louz L, Zheng J, Tian L, Wang X, Cao Z and Zeng Y: Dysbiosis of
intestinal microbiota and decreased antimicrobial peptide level in
paneth cells during hypertriglyceridemia-related acute necrotizing
pancreatitis in rats. Front Microbiol. 8:7762017. View Article : Google Scholar : PubMed/NCBI
|
|
52
|
Amani J, Ahmadpour A, Imani Fooladi AA and
Nazarian S: Detection of E. coli O157:H7 and Shigella dysenteriae
toxins in clinical samples by PCR-ELISA. Braz J Infect Dis.
19:278–284. 2015. View Article : Google Scholar : PubMed/NCBI
|
|
53
|
Miquel S, Martin R, Rossi O,
Bermúdez-Humarán LG, Chatel JM, Sokol H, Thomas M, Wells JM and
Langella P: Faecalibacterium prausnitzii and human intestinal
health. Curr Opin Microbiol. 16:255–261. 2013. View Article : Google Scholar : PubMed/NCBI
|
|
54
|
Cao Y, Shen J and Ran ZH: Association
between Faecalibacterium prausnitzii reduction and inflammatory
bowel disease: A meta-analysis and systematic review of the
literature. Gastroenterol Res Pract. 2014:8727252014. View Article : Google Scholar : PubMed/NCBI
|
|
55
|
Vinolo MA, Rodrigues HG, Nachbar RT and
Curi R: Regulation of inflammation by short chain fatty acids.
Nutrients. 3:858–876. 2011. View Article : Google Scholar
|
|
56
|
Lin HV, Frassetto A, Kowalik EJ Jr,
Nawrocki AR, Lu MM, Kosinski JR, Hubert JA, Szeto D, Yao X, Forrest
G and Marsh DJ: Butyrate and propionate protect against
diet-induced obesity and regulate gut hormones via free fatty acid
receptor 3-independent mechanisms. PLoS One. 7:e352402012.
View Article : Google Scholar : PubMed/NCBI
|
|
57
|
Berni Canani R, Di Costanzo M and Leone L:
The epigenetic effects of butyrate: Potential therapeutic
implications for clinical practice. Clin Epigenetics. 4:42012.
View Article : Google Scholar : PubMed/NCBI
|
|
58
|
Henagan TM, Stefanska B, Fang Z, Navard
AM, Ye J, Lenard NR and Devarshi PP: Sodium butyrate epigenetically
modulates high-fat diet-induced skeletal muscle mitochondrial
adaptation, obesity and insulin resistance through nucleosome
positioning. Br J Pharmacol. 172:2782–2798. 2015. View Article : Google Scholar : PubMed/NCBI
|
|
59
|
Gao Z, Yin J, Zhang J, Ward RE, Martin RJ,
Lefevre M, Cefalu WT and Ye J: Butyrate improves insulin
sensitivity and increases energy expenditure in mice. Diabetes.
58:1509–1517. 2009. View Article : Google Scholar : PubMed/NCBI
|
|
60
|
Yan Q, Gu Y, Li X, Yang W, Jia L, Chen C,
Han X, Huang Y, Zhao L, Li P, et al: Alterations of the gut
microbiome in hypertension. Front Cell Infect Microbiol. 7:3812017.
View Article : Google Scholar : PubMed/NCBI
|
|
61
|
Zoetendal EG, von Wright A,
Vilpponen-Salmela T, Ben-Amor K, Akkermans AD and de Vos WM:
Mucosa-associated bacteria in the human gastrointestinal tract are
uniformly distributed along the colon and differ from the community
recovered from feces. Appl Environ Microbiol. 68:3401–3407. 2002.
View Article : Google Scholar : PubMed/NCBI
|
|
62
|
Eckburg PB, Bik EM, Bernstein CN, Purdom
E, Dethlefsen L, Sargent M, Gill SR, Nelson KE and Relman DA:
Diversity of the human intestinal microbial flora. Science.
308:1635–1638. 2005. View Article : Google Scholar : PubMed/NCBI
|
|
63
|
Muyzer G: DGGE/TGGE a method for
identifying genes from natural ecosystems. Curr Opin Microbiol.
2:317–322. 1999. View Article : Google Scholar : PubMed/NCBI
|
|
64
|
Rinttila T, Kassinen A, Malinen E, Krogius
L and Palva A: Development of an extensive set of 16S rDNA-targeted
primers for quantification of pathogenic and indigenous bacteria in
faecal samples by real-time PCR. J Appl Microbiol. 97:1166–1177.
2004. View Article : Google Scholar : PubMed/NCBI
|
|
65
|
Ponnusamy K, Choi JN, Kim J, Lee SY and
Lee CH: Microbial community and metabolomic comparison of irritable
bowel syndrome faeces. J Med Microbiol. 60:817–827. 2011.
View Article : Google Scholar : PubMed/NCBI
|
|
66
|
Jalanka-Tuovinen J, Salonen A, Nikkila J,
Immonen O, Kekkonen R, Lahti L, Palva A and de Vos WM: Intestinal
micro-biota in healthy adults: Temporal analysis reveals individual
and common core and relation to intestinal symptoms. PLoS One.
6:e230352011. View Article : Google Scholar
|
|
67
|
Zwielehner J, Liszt K, Handschur M, Lassl
C, Lapin A and Haslberger AG: Combined PCR-DGGE fingerprinting and
quantitative-PCR indicates shifts in fecal population sizes and
diversity of Bacteroides, bifidobacteria and Clostridium cluster IV
in institutionalized elderly. Exp Gerontol. 44:440–446. 2009.
View Article : Google Scholar : PubMed/NCBI
|
|
68
|
Huijsdens XW, Linskens RK, Mak M,
Meuwissen SG, Vandenbroucke-Grauls CM and Savelkoul PH:
Quantification of bacteria adherent to gastrointestinal mucosa by
real-time PCR. J Clin Microbiol. 40:4423–4427. 2002. View Article : Google Scholar : PubMed/NCBI
|
|
69
|
Matsuki T, Watanabe K, Fujimoto J,
Miyamoto Y, Takada T, Matsumoto K, Oyaizu H and Tanaka R:
Development of 16S rRNA-gene-targeted group-specific primers for
the detection and identification of predominant bacteria in human
feces. Appl Environ Microbiol. 68:5445–5451. 2002. View Article : Google Scholar : PubMed/NCBI
|
|
70
|
Bartosch S, Fite A, Macfarlane GT and
McMurdo ME: Characterization of bacterial communities in feces from
healthy elderly volunteers and hospitalized elderly patients by
using real-time PCR and effects of antibiotic treatment on the
fecal microbiota. Appl Environ Microbiol. 70:3575–3581. 2004.
View Article : Google Scholar : PubMed/NCBI
|